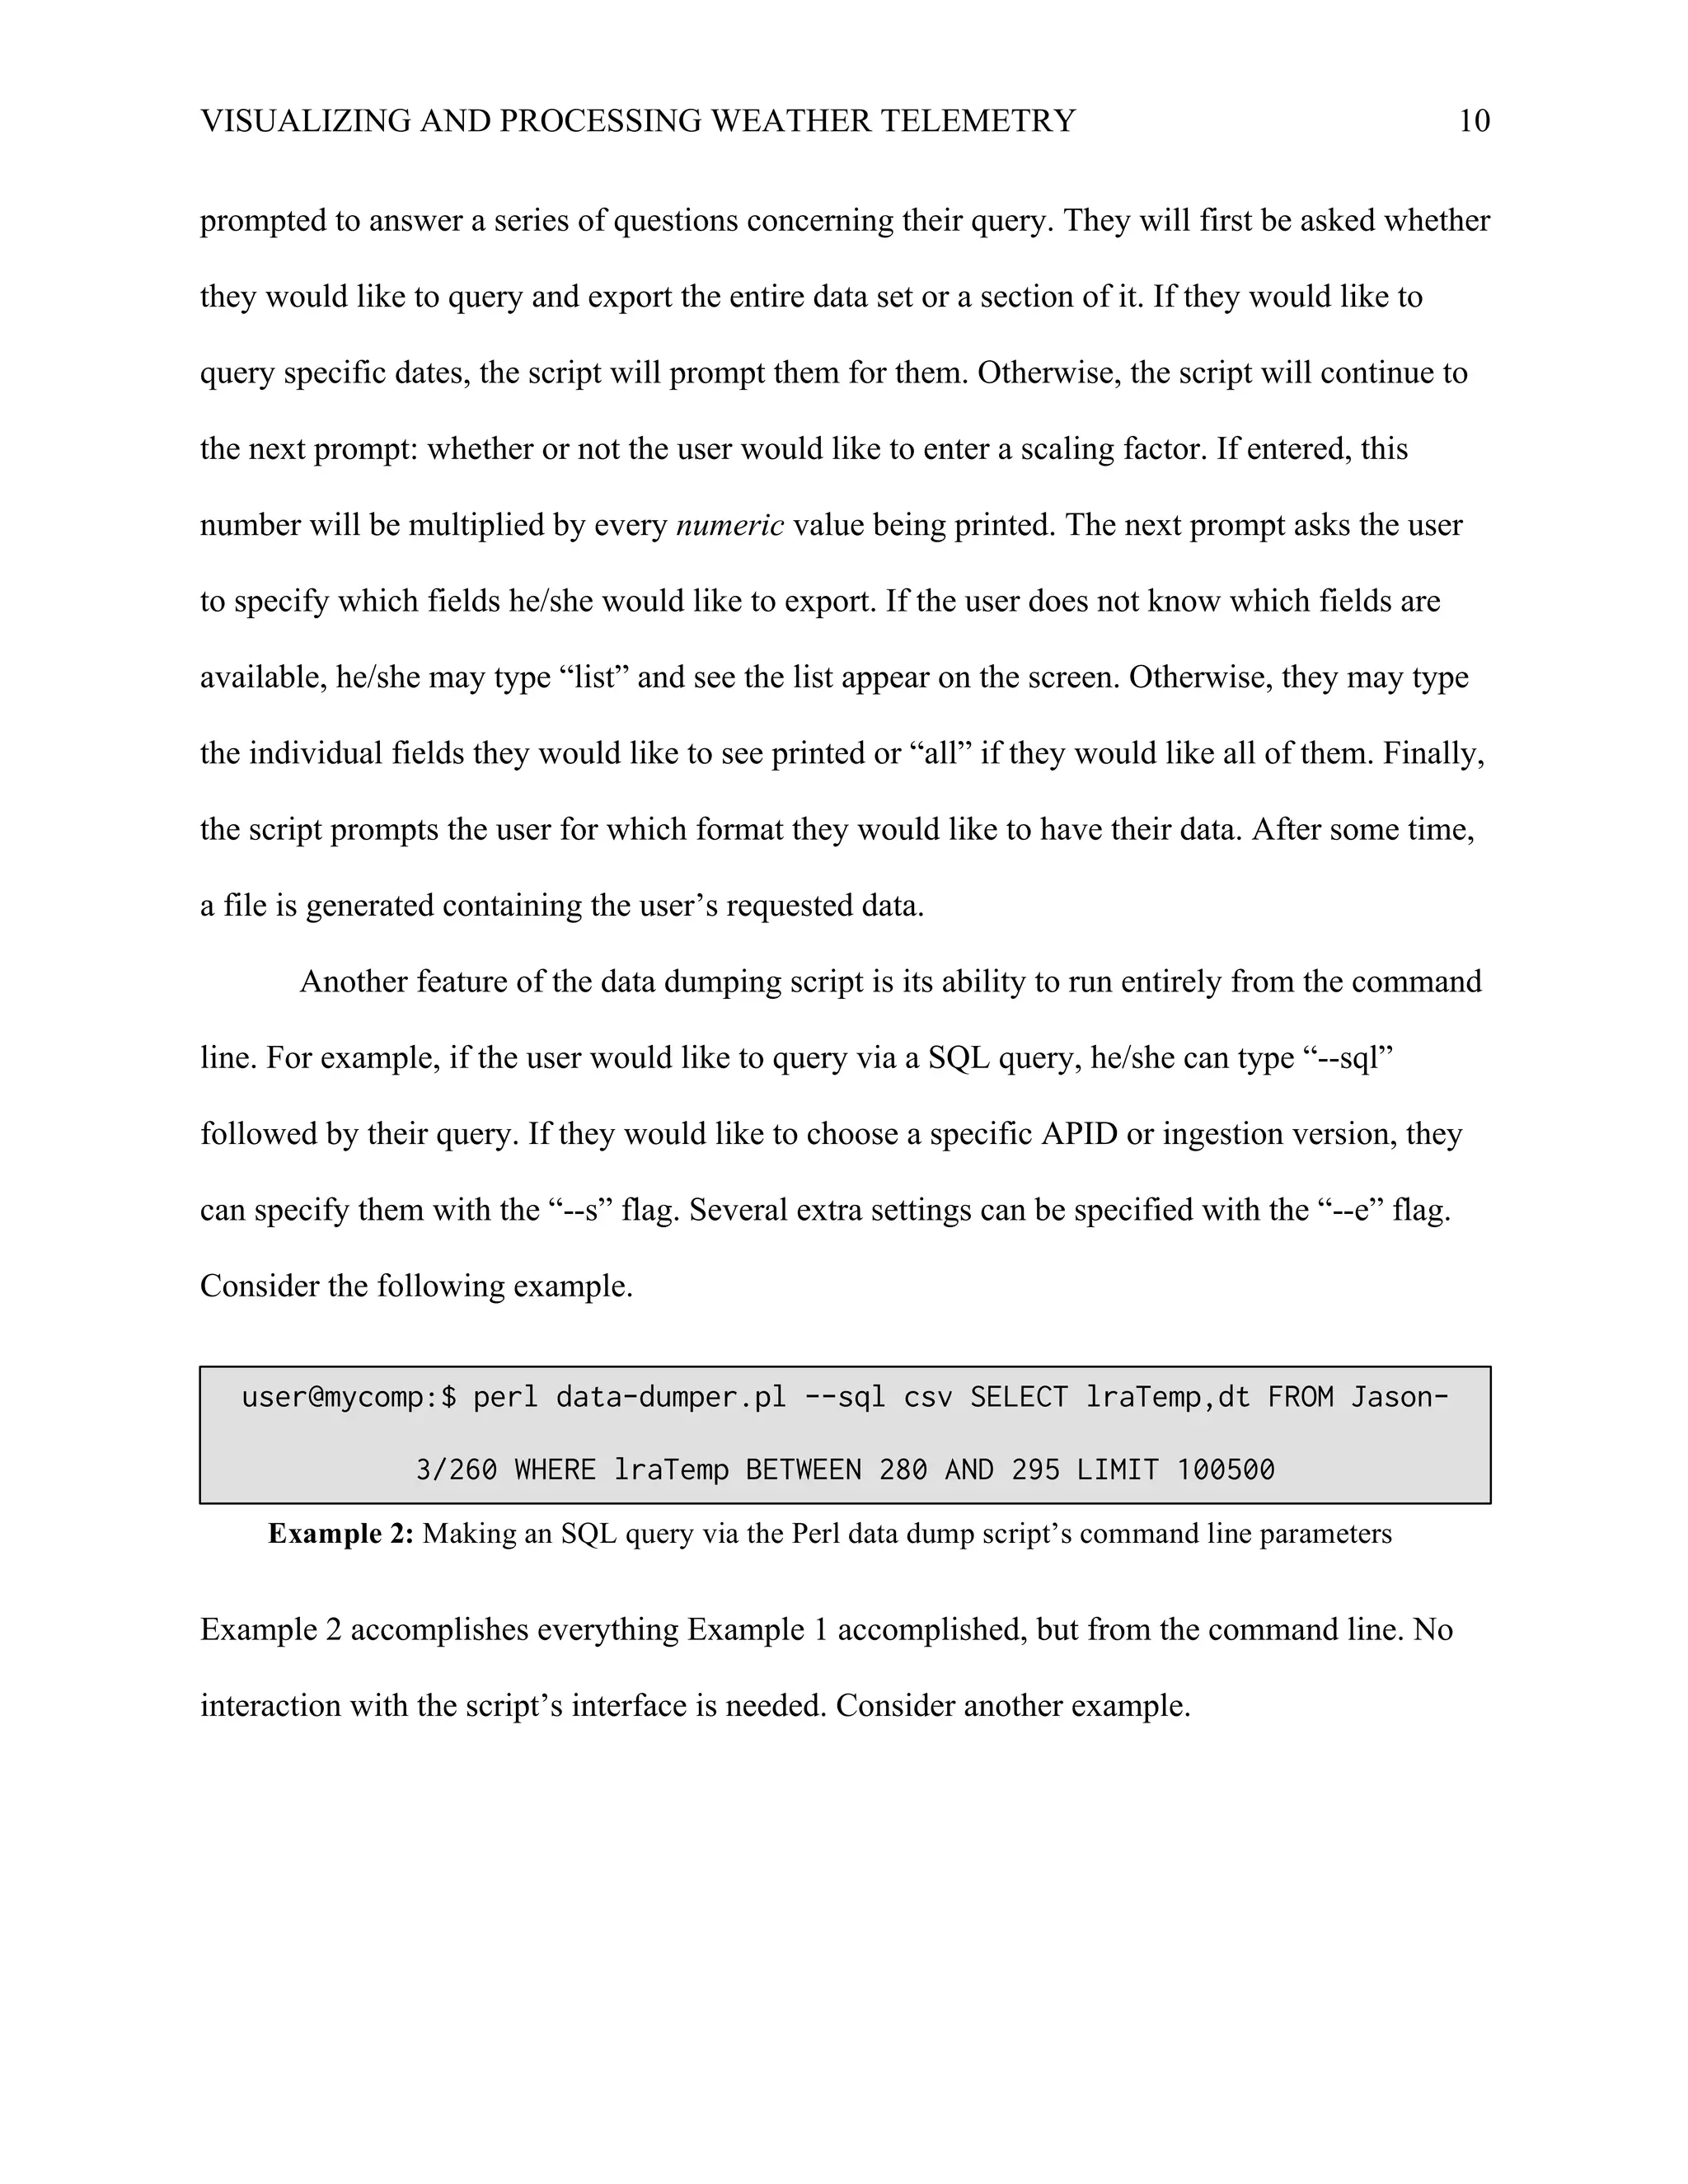
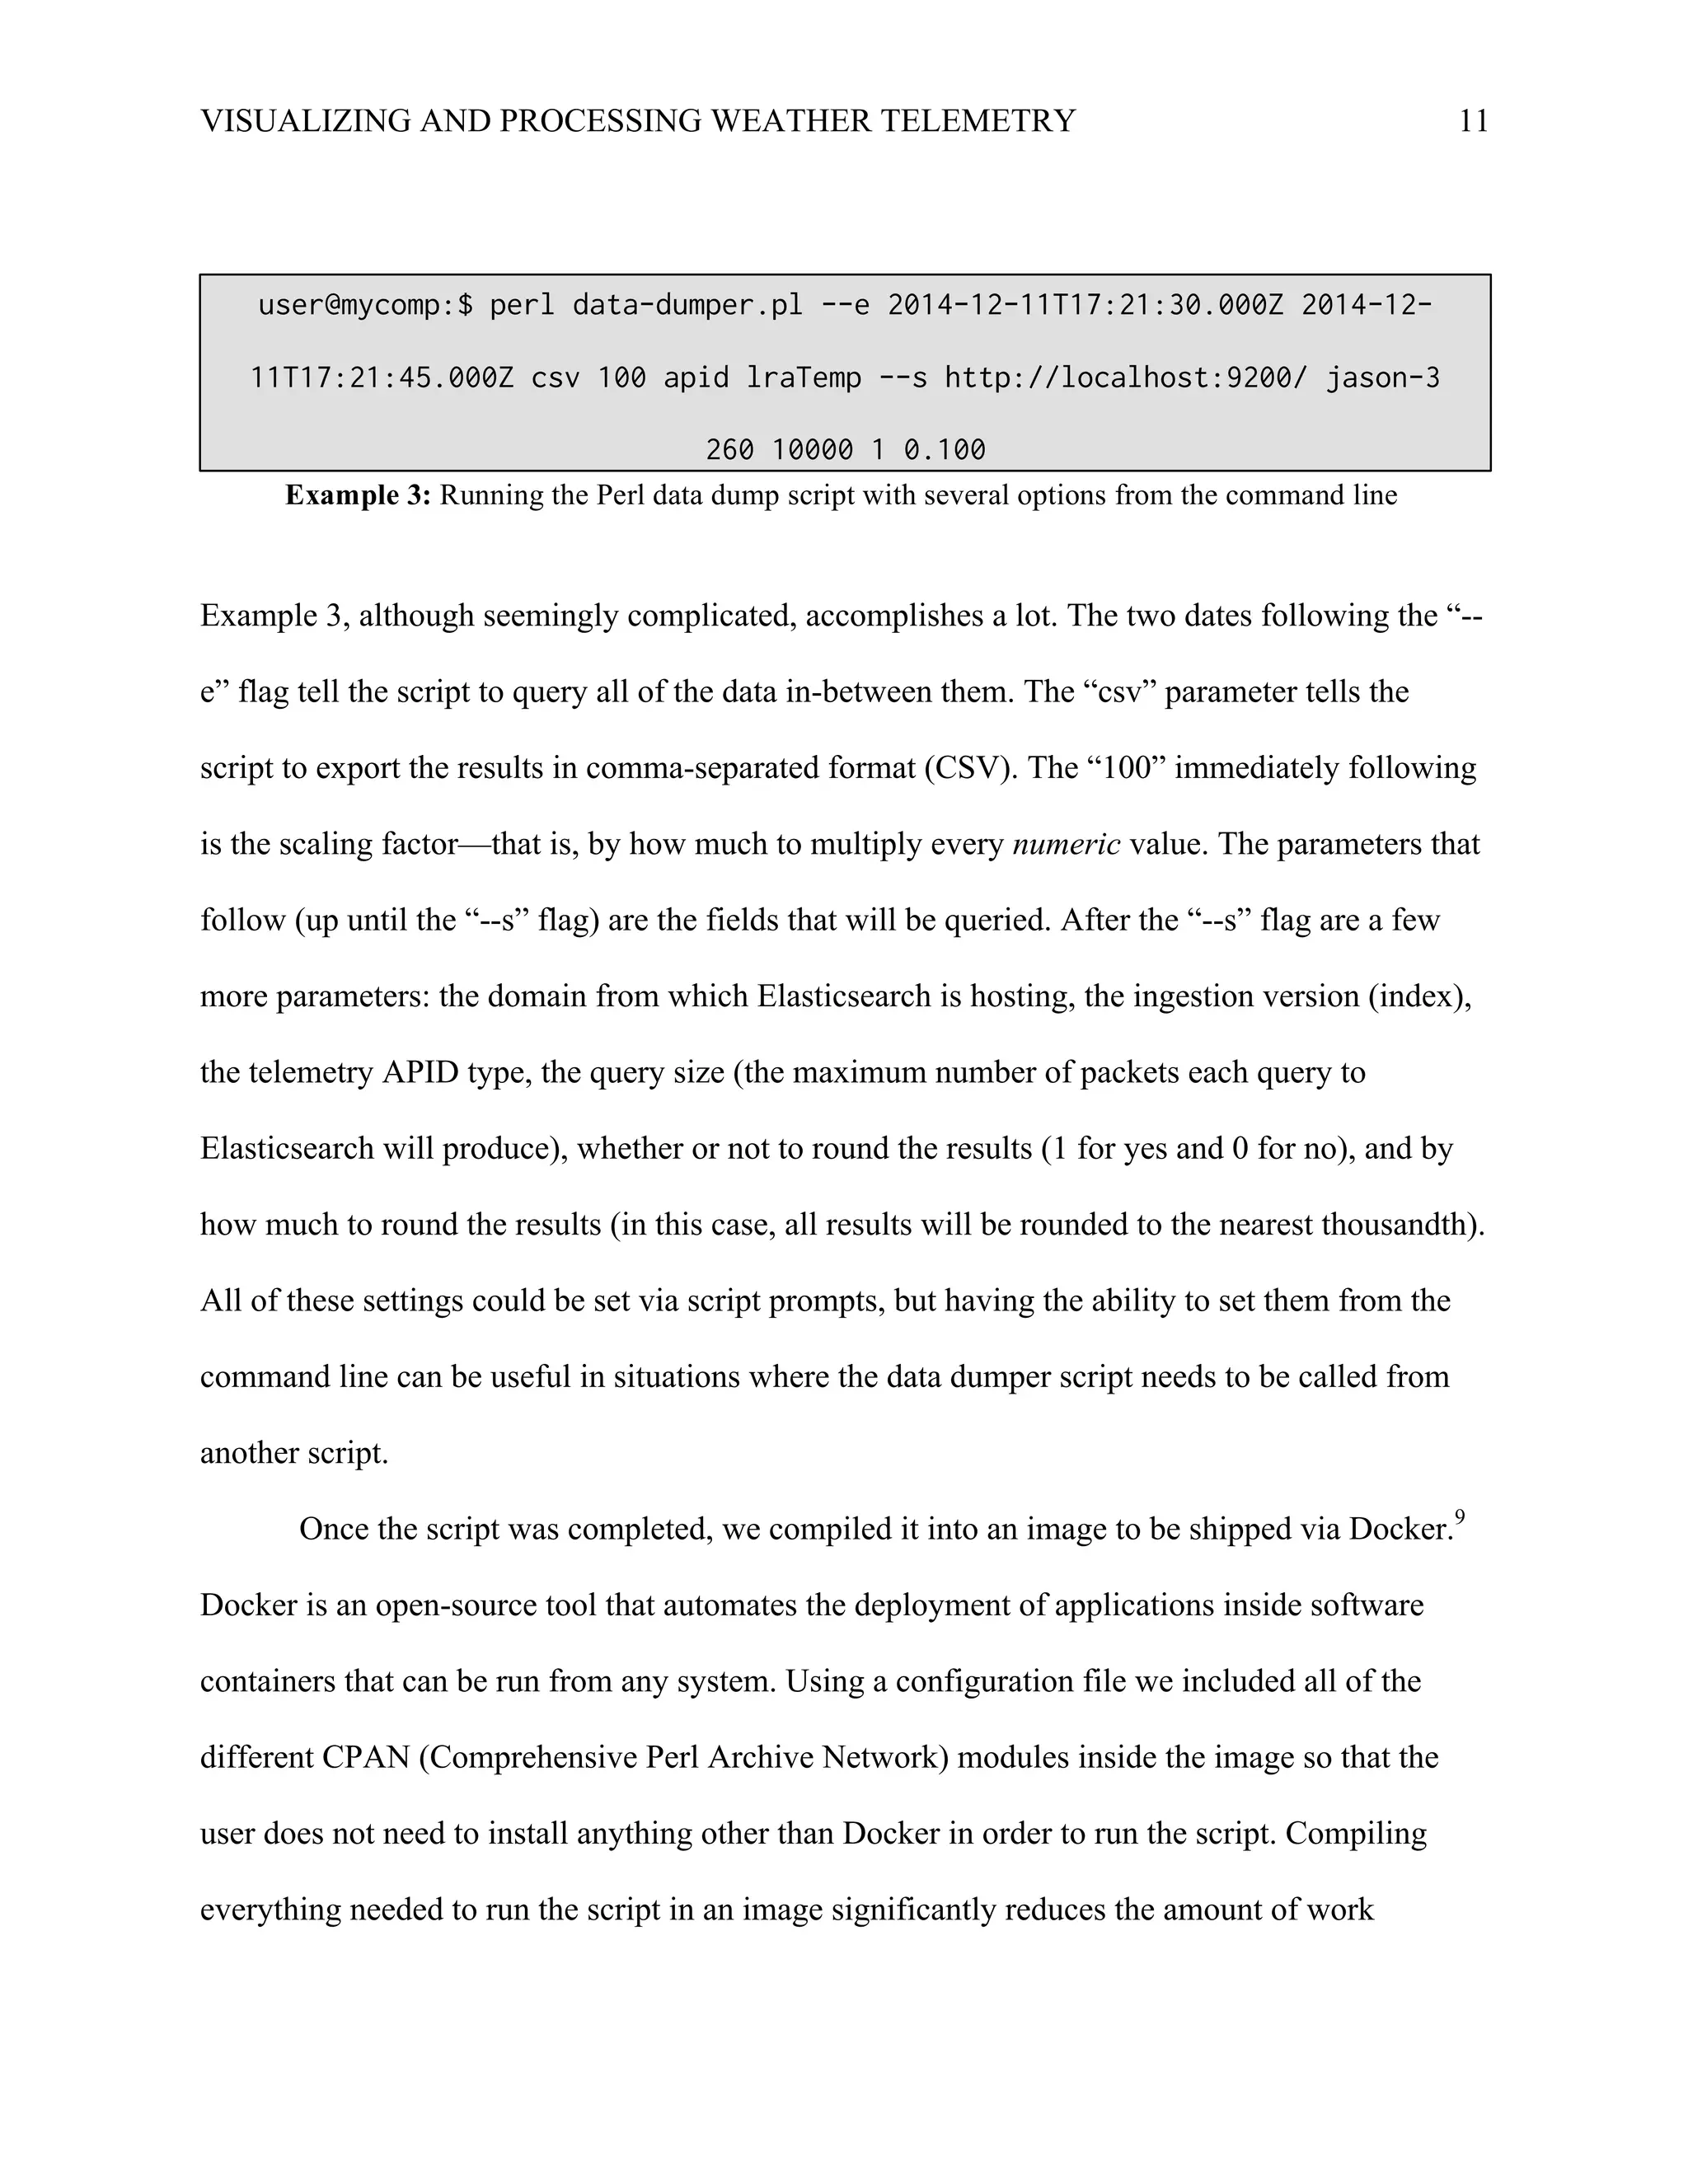
Download to read offline
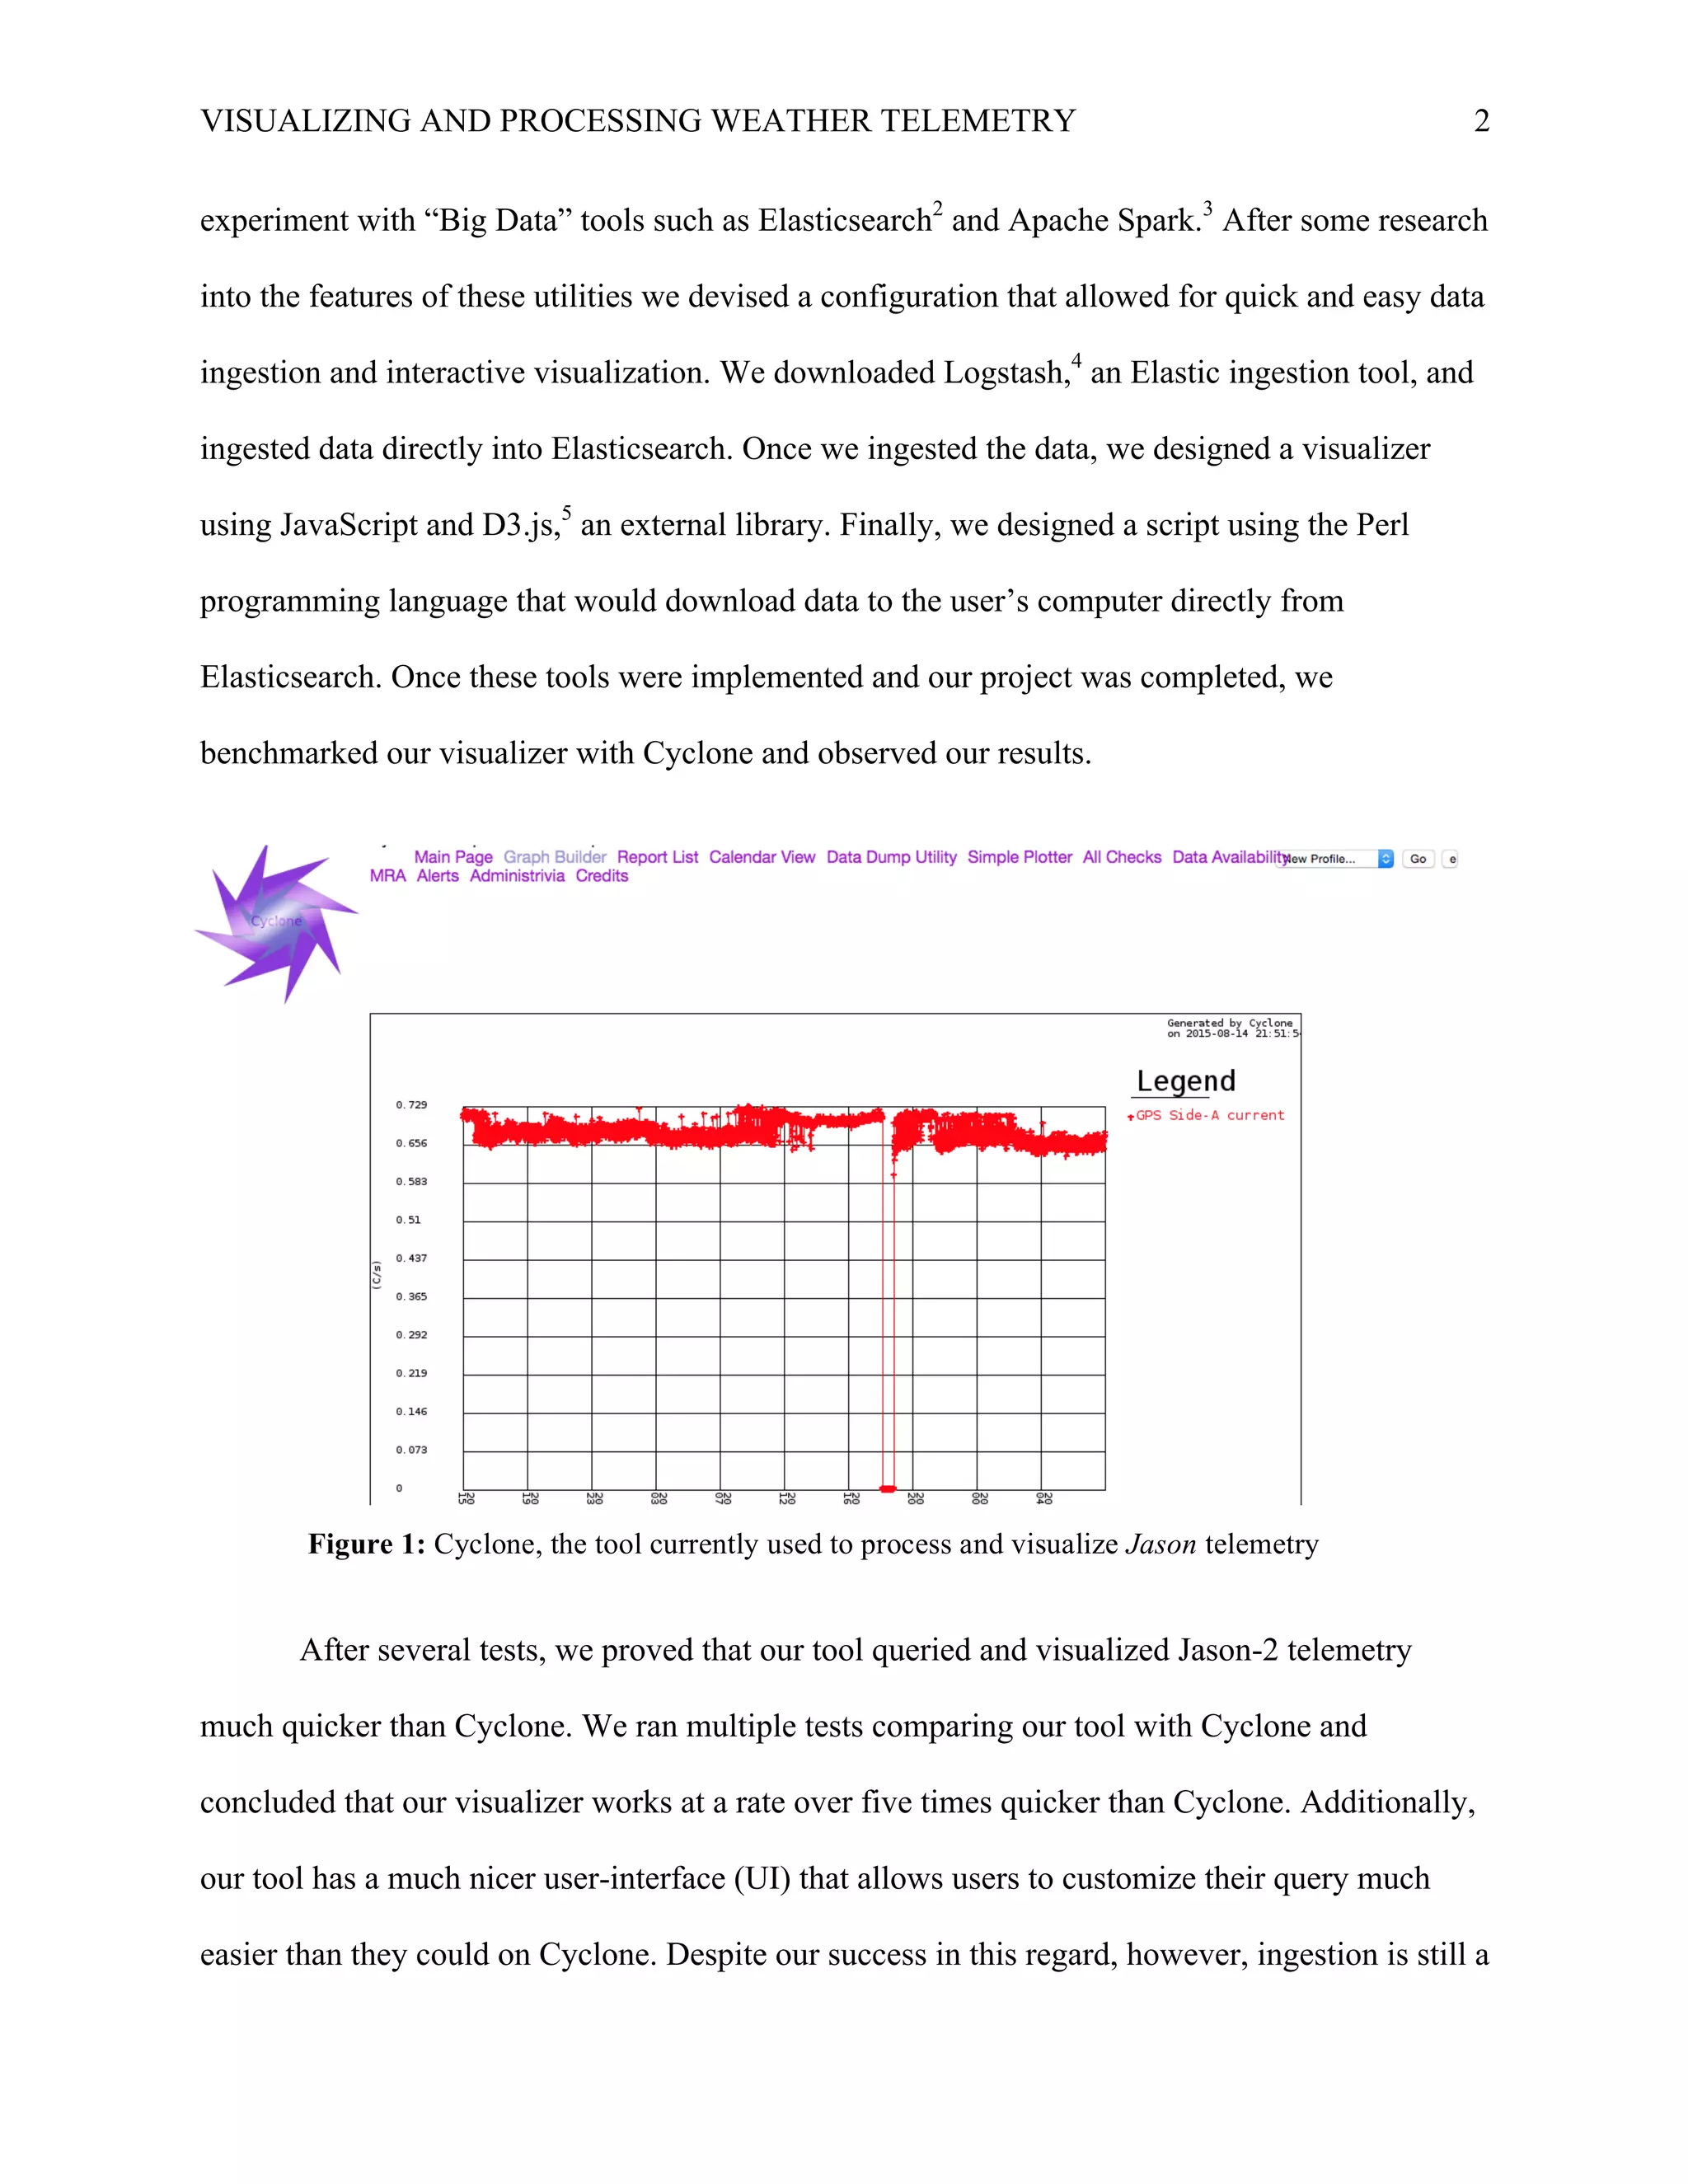
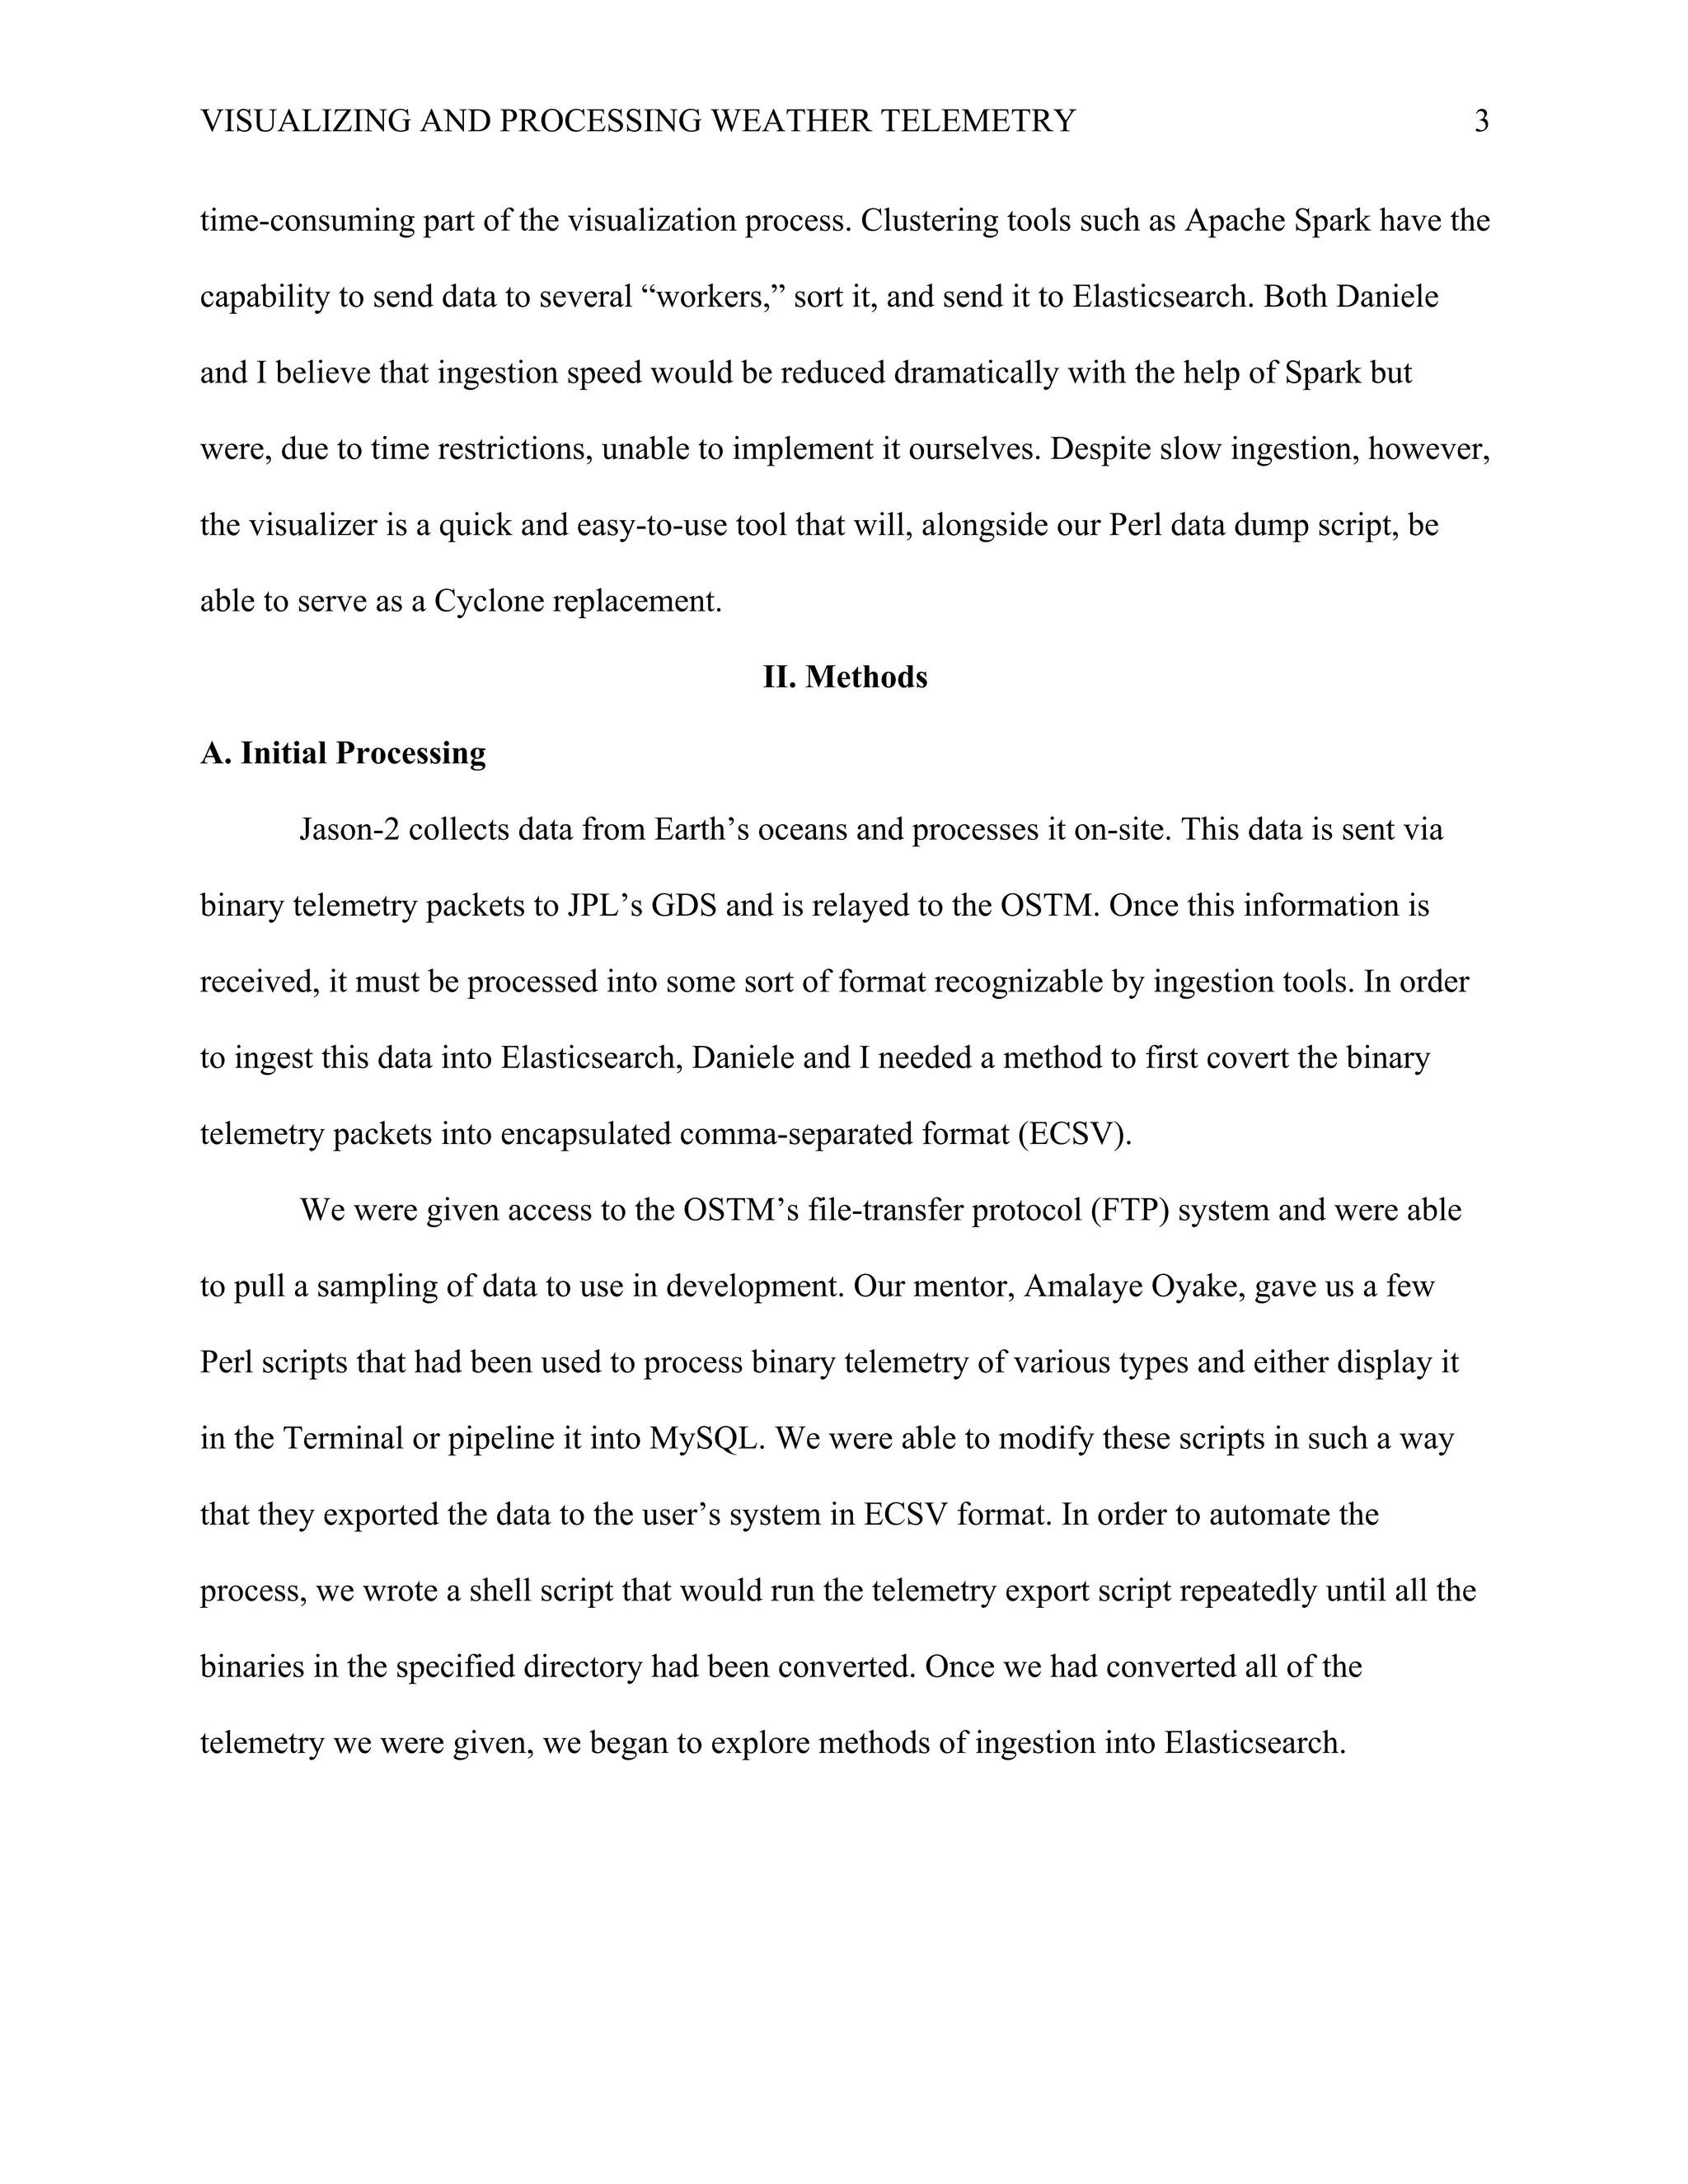

This document describes a project to improve the processing and visualization of weather satellite telemetry data from the Ocean Surface Topography Mission (OSTM) satellites. The current tool (Cyclone) is slow, taking a long time to perform queries and generate graphs from the large dataset. The authors developed a new tool that ingests the data into Elasticsearch using Logstash, then allows users to quickly query and visualize the data in an interactive graph through a custom interface. Benchmarking showed their tool was over 5 times faster than Cyclone. While ingestion is still slow, the visualization component provides a quicker and easier experience to replace Cyclone. Future work could implement Apache Spark to improve the speed of data ingestion.