Download to read offline


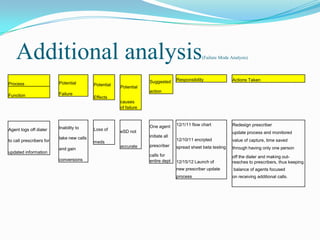
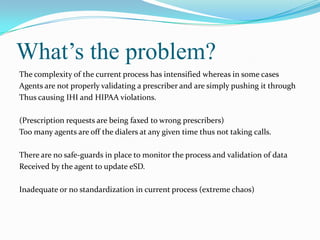
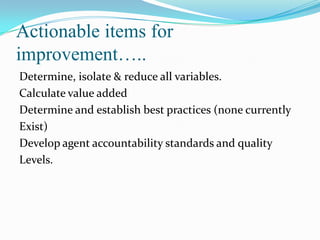
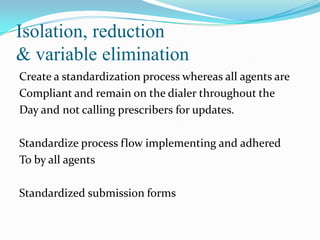
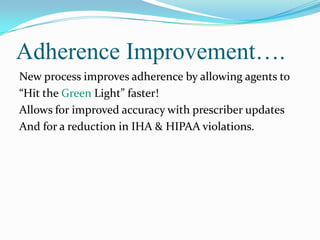
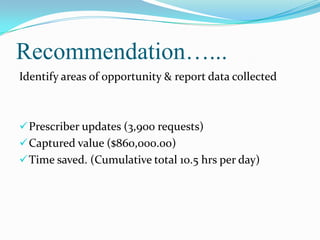
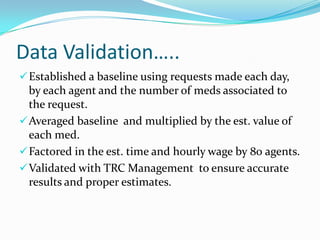
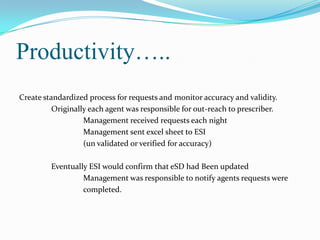
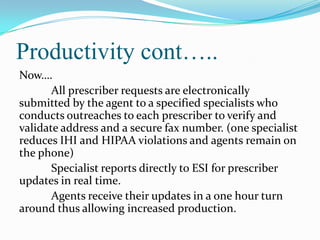
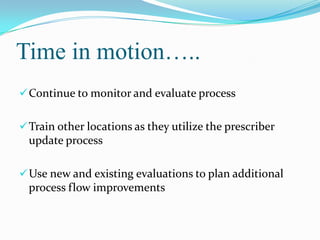
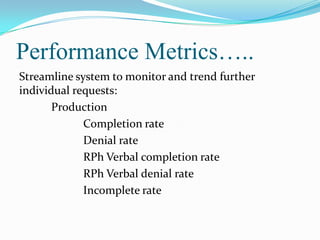
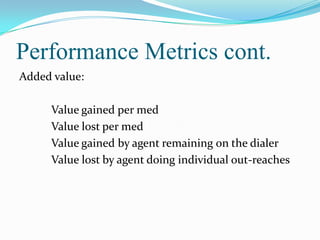
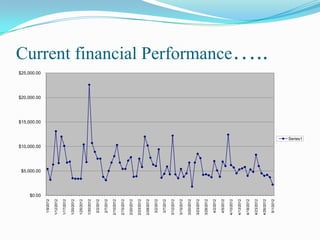
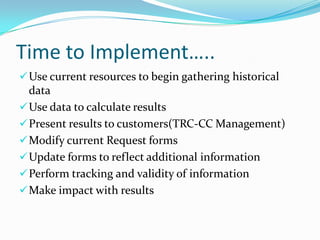

The current prescriber update process at TRC-CC PBS is cumbersome and costly, resulting in $3.9 million in lost revenue annually. A Six Sigma project was conducted to analyze the process, collect data, and identify areas for improvement. Key findings included inaccurate prescriber data in eSD, agents spending too much time off phone calls to update prescribers, and a lack of process standardization and monitoring. Recommendations included designating specialists to validate prescriber updates instead of individual agents, electronically submitting requests, and establishing performance metrics to track outcomes. Implementing these changes improved adherence and reduced errors while allowing agents to focus on calls, capturing an estimated $860,000 in additional value annually.


![Derechos amparo pcte[1]](https://cdn.slidesharecdn.com/ss_thumbnails/derechosamparopcte1-110806235700-phpapp02-thumbnail.jpg?width=640&height=640&fit=bounds)


![Getting Started with Apache Spark: Big Data Made Simple [Free Meetup]](https://cdn.slidesharecdn.com/ss_thumbnails/apachesparkgettingstarted-260203175547-8361bcc3-thumbnail.jpg?width=640&height=640&fit=bounds)