Project Simplification through Metric AnalysisAcumen
A white paper on the benefits of using project metrics to analyze the health and quality of your projects. In addition, this paper introduces the patented approach of project ribbons for simplified project slice and dice reporting.
Graph-based analysis of resource dependencies in project networksGurdal Ertek
It is a challenge to visualize high dimensional data such as project data to yield new and interesting types of insights. To address this, we augment the traditional PERT network diagram with additional nodes that represent resources, and with arcs from the resource nodes to the activities that use those resources. Subsequently, we apply various graph layout algorithms that can reveal the hidden patterns in the graph data. Finally, we also map various attributes of the activities to the features of activity nodes. We illustrate the applicability and usefulness of our methodology through two case studies, where we visualize data from a benchmark data library and from the real world.
http://ertekprojects.com/gurdal-ertek-publications/
http://ieeexplore.ieee.org/xpl/articleDetails.jsp?arnumber=7363999&newsearch= true&queryText=gurdal%20ertek
bit.ly/1SbBk49
Presentation given at DMZ about Data Structure Graphs.
Also known as Applying Social Network Analysis Techniques to Data Modeling and Data Architecture
project management-cpm and pert methods for managersNaganna Chetty
A project is a one shot, time limited, goal directed, major undertaking, requiring the commitment of varied skills & resources.
A project:
Has a unique purpose.
Is temporary.
Is developed using progressive elaboration.
Requires resources, often from various areas.
Should have a primary customer or sponsor.
The project sponsor usually provides the direction and funding for the project.
Involves uncertainty.
Project managers work with project sponsors, project teams, and other people involved in projects to meet project goals.
Program: “A group of related projects managed in a coordinated way to obtain benefits and control not available from managing them individually.”
Program managers oversee programs and often act as bosses for project managers.
Project management is “the application of knowledge, skills, tools and techniques to project activities to meet project requirements.”
IntroductionThis report discusses the programming process whic.docxmariuse18nolet
Introduction
This report discusses the programming process which I would developed and used to produce the required data suitable for part two and three. The main measurement that I used to generate data is one region, particularly in two month period of time. This period information is required to generate from particular years 2011, 2012 and 2013. This data contains two different types of information which are climatic conditions recorded and power consumption that are related to that period of time.
Climatic conditions
The program that I developed using C programming related to weather data was focusing on years. What is supposed to do is processing a bunch of dataset containing information that is climatic conditions recorded across various regions. Which means reducing it down to just the data values that are relevant or meaningful to the desired region (Auckland) to be able to get its details on January and February in particular years .The idea is collecting the 2011+2013 desired information and generating it in a separate excel file then so on for 2013.
Power consumption
It is the same idea for power consumption, what I accomplished was using two processes in a huge number of data file to generate a filtered file. Although that huge file contained only the required years, there were unwanted months details that needed to be excluded. The first process was using C codes programming to get the desired two months by printing out the first two months of each year. So, during printing process, it had to be stopped at the end of the second months of each year and jumping on the following year to complete the process. The second process was combining every two rows of the filtered file as each row taken every 5 minutes power consuming recorded but the requirement was ten minutes reading for each row.
After achieving all of that processes and generating the filtered files, we need to use these files information with Weka to undertake a data modelling task. Then using this modelling task in different visualization techniques to see how well the performance of the task predictive is. The following sections show how to use the generated data both the weather data and power consumption in data mining and data visualization.
STAT390-14B (Ham): Directed Study Project
Individual Project Focus: Work vs. Play
Project co-ordinator: Associate Professor David Bainbridge
Process the weather data for Auckland in January and February in the given
dataset (10 minute readings) and experiment with various data mining
techniques to see if a model can be generated that predicts power
consumption for Monday-Friday (work), Saturday, and Sunday (play). Is it
easier to predict the power usage for one of time periods? Trial having
Saturday and Sunday represented as a single entity (i.e. the weekend) and as
separate days.
The aim of this directed study project is combine the programming skills learnt in COMP5002 (BoPP)
with the Data Min.
AN AI PLANNING APPROACH FOR GENERATING BIG DATA WORKFLOWSgerogepatton
The scale of big data causes the compositions of extract-transform-load (ETL) workflows to grow increasingly complex. With the turnaround time for delivering solutions becoming a greater emphasis, stakeholders cannot continue to afford to wait the hundreds of hours it takes for domain experts to manually compose a workflow solution. This paper describes a novel AI planning approach that facilitates rapid composition and maintenance of ETL workflows. The workflow engine is evaluated on real-world scenarios from an industrial partner and results gathered from a prototype are reported to demonstrate the validity of the approach.
The scale of big data causes the compositions of extract-transform-load (ETL) workflows to grow increasingly complex. With the turnaround time for delivering solutions becoming a greater emphasis,
stakeholders cannot continue to afford to wait the hundreds of hours it takes for domain experts to manually compose a workflow solution. This paper describes a novel AI planning approach that facilitates rapid composition and maintenance of ETL workflows. The workflow engine is evaluated on real-world
scenarios from an industrial partner and results gathered from a prototype are reported to demonstrate the validity of the approach.
Correlations, Trends, and Outliers in ggplot2Chris Rucker
This project explains how ggplot2 can serve as an adequate instrument to visualize data; how in a fantastic world, a graph may construct its own identity outside of the rigid roles imposed upon itself by raw data.
Assignment Handout
Programme Name: Higher Diploma in Travel, Tourism & Events Management
Module Name: Culture, Festivals, and Special Events Management
Assignment Learning Objectives:
1. Describe the key principles and concept of the strategic planning function of
events planning.
1. Develop and manage events from initial idea to evaluation and identify
requirements and select the right tools, people and resources to meet demand.
1. Effectively plan, schedule, budget and manage the event process.
1. Develop a strategy to market an event using integrated marketing approach
1. Analyse apply risks management strategies to mitigate and avoid potential
problems with events.
Assignment Introduction:
Event planning has become an important consideration for any entity wishing to promote its business. Promotional events are now necessary for any organization's marketing plan. Carefully planned events allow organizations a closer, more personal means of interacting with current or potential customers or supporters.
The success or failure of a business can be determined, in large part, by the events it sponsors.
Event planning can be defined as the coordination of all aspects of an event, including budgeting and program development. Designing and producing an event is analogous to a live stage production.
Once the event begins, there is no turning back. There is no guarantee of a successful outcome; however, event organizers can plan, prepare, and be prepared for the unanticipated (Allen, 2000, KE Holley,2001).
Instructions:
Student may choose any ONE of the following events for your assignment:
1. Birthday party
2. Fashion Show
3. Wedding lunch
4. Alumni Re-union dinner
5. Sports Events
6. Community Event
You are the owner and manager of Dragon Events Pte Ltd. You have been approached by one of your clients to come up with an event proposal to be held in Singapore in November 2021.
You are to draft a proposal to your client and ensure that it covers the following:
1. Introduction
1.1 The vision and mission of your organisation – See Lesson 2
1.2 The objective of the event, concept and description – See Lesson 2
1.2.1 Objectives of the Event
1.2.2 Concept
1.2.3 The unique selling point (USP) of the event – Lesson 3
1. Budget for the event
· Detail projection of revenue and expenses
· Funding of event (e.g. funded, self-funded or sponsorship) seetemplate attachment 1 – Lesson 5
1. Marketing and promotional plan – Lesson 6
· Social media platform, tickets, posters, etc.
1. Division of tasks and individual responsibilities (before and during the event day) – Structure – Lesson 2
1. Floor plan and event layout plan- see template attachment 3 – Lesson 8
1. Menu and Beverage Planning (if any)
1. Activities and Games (if any)
1. Resource Planning – no of staff, equipment/speakers, structure (tent, stage)
1. Action Plan
· Timeline and deliverables (Gantt chart) – see template .
From Data to Knowledge thru Grailog Visualizationgiurca
Visualization of Data & Knowledge: Graphs Remove Entry Barrier to Logic: From 1-dimensional symbol-logic knowledge specification to 2-dimensional graph-logic visualization in a systematic 2D syntax; Supports human in the loop across knowledge elicitation, specification, validation, and reasoning; Combinable with graph transformation, (‘associative’) indexing & parallel processing for efficient implementation of specifications
Implementation of multidimensional databases with document-oriented NoSQL
Implémentation des entrepôts de données NoSQL dans les bases de données NoSQL orienté documents.
"Towards a Science of Reproducible Science?" DPRMA Workshop talk at JCDL 2013, Indianapolis, 25th July 2013. Workshop website is http://dprma.oerc.ox.ac.uk/
Paper is
David De Roure. 2013. Towards computational research objects. In Proceedings of the 1st International Workshop on Digital Preservation of Research Methods and Artefacts (DPRMA '13). ACM, New York, NY, USA, 16-19. DOI=10.1145/2499583.2499590 http://doi.acm.org/10.1145/2499583.2499590
Data Innovation Lens: A New Way to Approach Data Design as Value CreationAleksi Aaltonen
Presentation at the London School of Economics and Political Science on May 10, KIN Center for Digital Innovation, Amsterdam on May 7, and at ESSEC Business School, Paris on April 30, 2024 on the study of data as innovation. The presentation is based on a paper coauthored with Marta Stelmaszak.
Not Good Enough, But Try Again! The Impact of Improved Rejection Communicatio...Aleksi Aaltonen
Presentation at the Tilburg School of Economics and Management on May 8, and at IÉSEG School of Management, Paris on May 3, 2024 on how Stack Overflow community question answering service tweaked its rejection notices to improve the retention of new contributors whose initial question is rejected (closed). The presentation is based on a paper coauthored with Sunil Wattal.
More Related Content
Similar to Graphing the Empirical Research Process: Toward Modular Empirical Research
IntroductionThis report discusses the programming process whic.docxmariuse18nolet
Introduction
This report discusses the programming process which I would developed and used to produce the required data suitable for part two and three. The main measurement that I used to generate data is one region, particularly in two month period of time. This period information is required to generate from particular years 2011, 2012 and 2013. This data contains two different types of information which are climatic conditions recorded and power consumption that are related to that period of time.
Climatic conditions
The program that I developed using C programming related to weather data was focusing on years. What is supposed to do is processing a bunch of dataset containing information that is climatic conditions recorded across various regions. Which means reducing it down to just the data values that are relevant or meaningful to the desired region (Auckland) to be able to get its details on January and February in particular years .The idea is collecting the 2011+2013 desired information and generating it in a separate excel file then so on for 2013.
Power consumption
It is the same idea for power consumption, what I accomplished was using two processes in a huge number of data file to generate a filtered file. Although that huge file contained only the required years, there were unwanted months details that needed to be excluded. The first process was using C codes programming to get the desired two months by printing out the first two months of each year. So, during printing process, it had to be stopped at the end of the second months of each year and jumping on the following year to complete the process. The second process was combining every two rows of the filtered file as each row taken every 5 minutes power consuming recorded but the requirement was ten minutes reading for each row.
After achieving all of that processes and generating the filtered files, we need to use these files information with Weka to undertake a data modelling task. Then using this modelling task in different visualization techniques to see how well the performance of the task predictive is. The following sections show how to use the generated data both the weather data and power consumption in data mining and data visualization.
STAT390-14B (Ham): Directed Study Project
Individual Project Focus: Work vs. Play
Project co-ordinator: Associate Professor David Bainbridge
Process the weather data for Auckland in January and February in the given
dataset (10 minute readings) and experiment with various data mining
techniques to see if a model can be generated that predicts power
consumption for Monday-Friday (work), Saturday, and Sunday (play). Is it
easier to predict the power usage for one of time periods? Trial having
Saturday and Sunday represented as a single entity (i.e. the weekend) and as
separate days.
The aim of this directed study project is combine the programming skills learnt in COMP5002 (BoPP)
with the Data Min.
AN AI PLANNING APPROACH FOR GENERATING BIG DATA WORKFLOWSgerogepatton
The scale of big data causes the compositions of extract-transform-load (ETL) workflows to grow increasingly complex. With the turnaround time for delivering solutions becoming a greater emphasis, stakeholders cannot continue to afford to wait the hundreds of hours it takes for domain experts to manually compose a workflow solution. This paper describes a novel AI planning approach that facilitates rapid composition and maintenance of ETL workflows. The workflow engine is evaluated on real-world scenarios from an industrial partner and results gathered from a prototype are reported to demonstrate the validity of the approach.
The scale of big data causes the compositions of extract-transform-load (ETL) workflows to grow increasingly complex. With the turnaround time for delivering solutions becoming a greater emphasis,
stakeholders cannot continue to afford to wait the hundreds of hours it takes for domain experts to manually compose a workflow solution. This paper describes a novel AI planning approach that facilitates rapid composition and maintenance of ETL workflows. The workflow engine is evaluated on real-world
scenarios from an industrial partner and results gathered from a prototype are reported to demonstrate the validity of the approach.
Correlations, Trends, and Outliers in ggplot2Chris Rucker
This project explains how ggplot2 can serve as an adequate instrument to visualize data; how in a fantastic world, a graph may construct its own identity outside of the rigid roles imposed upon itself by raw data.
Assignment Handout
Programme Name: Higher Diploma in Travel, Tourism & Events Management
Module Name: Culture, Festivals, and Special Events Management
Assignment Learning Objectives:
1. Describe the key principles and concept of the strategic planning function of
events planning.
1. Develop and manage events from initial idea to evaluation and identify
requirements and select the right tools, people and resources to meet demand.
1. Effectively plan, schedule, budget and manage the event process.
1. Develop a strategy to market an event using integrated marketing approach
1. Analyse apply risks management strategies to mitigate and avoid potential
problems with events.
Assignment Introduction:
Event planning has become an important consideration for any entity wishing to promote its business. Promotional events are now necessary for any organization's marketing plan. Carefully planned events allow organizations a closer, more personal means of interacting with current or potential customers or supporters.
The success or failure of a business can be determined, in large part, by the events it sponsors.
Event planning can be defined as the coordination of all aspects of an event, including budgeting and program development. Designing and producing an event is analogous to a live stage production.
Once the event begins, there is no turning back. There is no guarantee of a successful outcome; however, event organizers can plan, prepare, and be prepared for the unanticipated (Allen, 2000, KE Holley,2001).
Instructions:
Student may choose any ONE of the following events for your assignment:
1. Birthday party
2. Fashion Show
3. Wedding lunch
4. Alumni Re-union dinner
5. Sports Events
6. Community Event
You are the owner and manager of Dragon Events Pte Ltd. You have been approached by one of your clients to come up with an event proposal to be held in Singapore in November 2021.
You are to draft a proposal to your client and ensure that it covers the following:
1. Introduction
1.1 The vision and mission of your organisation – See Lesson 2
1.2 The objective of the event, concept and description – See Lesson 2
1.2.1 Objectives of the Event
1.2.2 Concept
1.2.3 The unique selling point (USP) of the event – Lesson 3
1. Budget for the event
· Detail projection of revenue and expenses
· Funding of event (e.g. funded, self-funded or sponsorship) seetemplate attachment 1 – Lesson 5
1. Marketing and promotional plan – Lesson 6
· Social media platform, tickets, posters, etc.
1. Division of tasks and individual responsibilities (before and during the event day) – Structure – Lesson 2
1. Floor plan and event layout plan- see template attachment 3 – Lesson 8
1. Menu and Beverage Planning (if any)
1. Activities and Games (if any)
1. Resource Planning – no of staff, equipment/speakers, structure (tent, stage)
1. Action Plan
· Timeline and deliverables (Gantt chart) – see template .
From Data to Knowledge thru Grailog Visualizationgiurca
Visualization of Data & Knowledge: Graphs Remove Entry Barrier to Logic: From 1-dimensional symbol-logic knowledge specification to 2-dimensional graph-logic visualization in a systematic 2D syntax; Supports human in the loop across knowledge elicitation, specification, validation, and reasoning; Combinable with graph transformation, (‘associative’) indexing & parallel processing for efficient implementation of specifications
Implementation of multidimensional databases with document-oriented NoSQL
Implémentation des entrepôts de données NoSQL dans les bases de données NoSQL orienté documents.
"Towards a Science of Reproducible Science?" DPRMA Workshop talk at JCDL 2013, Indianapolis, 25th July 2013. Workshop website is http://dprma.oerc.ox.ac.uk/
Paper is
David De Roure. 2013. Towards computational research objects. In Proceedings of the 1st International Workshop on Digital Preservation of Research Methods and Artefacts (DPRMA '13). ACM, New York, NY, USA, 16-19. DOI=10.1145/2499583.2499590 http://doi.acm.org/10.1145/2499583.2499590
Data Innovation Lens: A New Way to Approach Data Design as Value CreationAleksi Aaltonen
Presentation at the London School of Economics and Political Science on May 10, KIN Center for Digital Innovation, Amsterdam on May 7, and at ESSEC Business School, Paris on April 30, 2024 on the study of data as innovation. The presentation is based on a paper coauthored with Marta Stelmaszak.
Not Good Enough, But Try Again! The Impact of Improved Rejection Communicatio...Aleksi Aaltonen
Presentation at the Tilburg School of Economics and Management on May 8, and at IÉSEG School of Management, Paris on May 3, 2024 on how Stack Overflow community question answering service tweaked its rejection notices to improve the retention of new contributors whose initial question is rejected (closed). The presentation is based on a paper coauthored with Sunil Wattal.
The Performative Production of Trace Data in Knowledge WorkAleksi Aaltonen
Invited talk at Bentley University on September 15, 2023. I talk about my recent paper co-authored with Marta Stelmaszak on trace data and how knowledge workers actively perform such data.
What Happens to Ratings When Both Sides Multihome? The Impact of Vertical Spi...Aleksi Aaltonen
Presentation at the EU Digital Platform Research Network (EU-DPRN) Summit on 9 June 2023 in Milan, Italy. I talk about how competition between platforms can drive ratings inflation under certain conditions. The presentation is based on a paper coauthored with Yulia Vorotyntseva, Subodha Kumar and Paul Pavlou.
Beyond the Facts: Data as Digital-Semantic ArtifactsAleksi Aaltonen
Presentation at Aalto University on 12 May 2022 on how information systems discipline needs to study digital data as fully fledged artifacts. The presentation is based on a paper coauthored with Marta Stelmaszak.
Not Good Enough but Try Again! Mitigating the Impact of Rejections on New Con...Aleksi Aaltonen
Presentation at the University of Miami on 3 December 2021 on how Stack Overflow improved the retention of new contributors whose initial question is rejected (closed) as substandard. The presentation is based on a paper coauthored with Sunil Wattal.
Comparing Evolved Extractive Text Summary Scores of Bidirectional Encoder Rep...University of Maribor
Slides from:
11th International Conference on Electrical, Electronics and Computer Engineering (IcETRAN), Niš, 3-6 June 2024
Track: Artificial Intelligence
https://www.etran.rs/2024/en/home-english/
What is greenhouse gasses and how many gasses are there to affect the Earth.moosaasad1975
What are greenhouse gasses how they affect the earth and its environment what is the future of the environment and earth how the weather and the climate effects.
Professional air quality monitoring systems provide immediate, on-site data for analysis, compliance, and decision-making.
Monitor common gases, weather parameters, particulates.
Deep Behavioral Phenotyping in Systems Neuroscience for Functional Atlasing a...Ana Luísa Pinho
Functional Magnetic Resonance Imaging (fMRI) provides means to characterize brain activations in response to behavior. However, cognitive neuroscience has been limited to group-level effects referring to the performance of specific tasks. To obtain the functional profile of elementary cognitive mechanisms, the combination of brain responses to many tasks is required. Yet, to date, both structural atlases and parcellation-based activations do not fully account for cognitive function and still present several limitations. Further, they do not adapt overall to individual characteristics. In this talk, I will give an account of deep-behavioral phenotyping strategies, namely data-driven methods in large task-fMRI datasets, to optimize functional brain-data collection and improve inference of effects-of-interest related to mental processes. Key to this approach is the employment of fast multi-functional paradigms rich on features that can be well parametrized and, consequently, facilitate the creation of psycho-physiological constructs to be modelled with imaging data. Particular emphasis will be given to music stimuli when studying high-order cognitive mechanisms, due to their ecological nature and quality to enable complex behavior compounded by discrete entities. I will also discuss how deep-behavioral phenotyping and individualized models applied to neuroimaging data can better account for the subject-specific organization of domain-general cognitive systems in the human brain. Finally, the accumulation of functional brain signatures brings the possibility to clarify relationships among tasks and create a univocal link between brain systems and mental functions through: (1) the development of ontologies proposing an organization of cognitive processes; and (2) brain-network taxonomies describing functional specialization. To this end, tools to improve commensurability in cognitive science are necessary, such as public repositories, ontology-based platforms and automated meta-analysis tools. I will thus discuss some brain-atlasing resources currently under development, and their applicability in cognitive as well as clinical neuroscience.
This presentation explores a brief idea about the structural and functional attributes of nucleotides, the structure and function of genetic materials along with the impact of UV rays and pH upon them.
Observation of Io’s Resurfacing via Plume Deposition Using Ground-based Adapt...Sérgio Sacani
Since volcanic activity was first discovered on Io from Voyager images in 1979, changes
on Io’s surface have been monitored from both spacecraft and ground-based telescopes.
Here, we present the highest spatial resolution images of Io ever obtained from a groundbased telescope. These images, acquired by the SHARK-VIS instrument on the Large
Binocular Telescope, show evidence of a major resurfacing event on Io’s trailing hemisphere. When compared to the most recent spacecraft images, the SHARK-VIS images
show that a plume deposit from a powerful eruption at Pillan Patera has covered part
of the long-lived Pele plume deposit. Although this type of resurfacing event may be common on Io, few have been detected due to the rarity of spacecraft visits and the previously low spatial resolution available from Earth-based telescopes. The SHARK-VIS instrument ushers in a new era of high resolution imaging of Io’s surface using adaptive
optics at visible wavelengths.
THE IMPORTANCE OF MARTIAN ATMOSPHERE SAMPLE RETURN.Sérgio Sacani
The return of a sample of near-surface atmosphere from Mars would facilitate answers to several first-order science questions surrounding the formation and evolution of the planet. One of the important aspects of terrestrial planet formation in general is the role that primary atmospheres played in influencing the chemistry and structure of the planets and their antecedents. Studies of the martian atmosphere can be used to investigate the role of a primary atmosphere in its history. Atmosphere samples would also inform our understanding of the near-surface chemistry of the planet, and ultimately the prospects for life. High-precision isotopic analyses of constituent gases are needed to address these questions, requiring that the analyses are made on returned samples rather than in situ.
Richard's aventures in two entangled wonderlandsRichard Gill
Since the loophole-free Bell experiments of 2020 and the Nobel prizes in physics of 2022, critics of Bell's work have retreated to the fortress of super-determinism. Now, super-determinism is a derogatory word - it just means "determinism". Palmer, Hance and Hossenfelder argue that quantum mechanics and determinism are not incompatible, using a sophisticated mathematical construction based on a subtle thinning of allowed states and measurements in quantum mechanics, such that what is left appears to make Bell's argument fail, without altering the empirical predictions of quantum mechanics. I think however that it is a smoke screen, and the slogan "lost in math" comes to my mind. I will discuss some other recent disproofs of Bell's theorem using the language of causality based on causal graphs. Causal thinking is also central to law and justice. I will mention surprising connections to my work on serial killer nurse cases, in particular the Dutch case of Lucia de Berk and the current UK case of Lucy Letby.
This pdf is about the Schizophrenia.
For more details visit on YouTube; @SELF-EXPLANATORY;
https://www.youtube.com/channel/UCAiarMZDNhe1A3Rnpr_WkzA/videos
Thanks...!
The ASGCT Annual Meeting was packed with exciting progress in the field advan...
Graphing the Empirical Research Process: Toward Modular Empirical Research
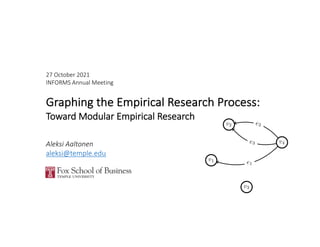
1. Figure 7. Research operation "2 uses two outputs
from operation "# and one from operation "! as its
inputs, and is independent of operation "".
If that which I have said above helps you to see empirical work in a n
since the researcher(s) responsible for the operation will
undoubtedly assign, for instance, different filenames for
different outputs.
By contrast, the namespace for labeling vertices,
that is, research operations is potentially global and
cuts across various governance boundaries. This makes
vertex labeling more difficult. It is relatively easy to
come up with a scheme to name research operations in
an individual research project, even if the project is large
and transcends organizational boundaries involving
many different researchers. However, interesting
opportunities arise if one could develop an infrastructure
that provides globally unique and searchable identifiers
for research operations (and, as we will discuss below,
verify their integrity). This would allow, in principle,
any research operation to reference outputs from any
other operation in the global network of empirical
research—note that I am not talking about the papers
RPG2
v1
v2
v3
v4
e1
e2
e3
Figure 7. Research operation v4 uses two outputs
from operation v2 and one from operation v1 as its
inputs, and is independent of operation v3.
If that which I have said above helps you to see
27 October 2021
INFORMS Annual Meeting
Graphing the Empirical Research Process:
Toward Modular Empirical Research
Aleksi Aaltonen
aleksi@temple.edu
2. Motivation
The nature of empirical research varies considerably between academic fields.
Methodological plurality and varying practices between academic communities
make it difficult to understand the process by which empirical studies produce their
results beyond one’s own niche.
This is a problem because it:
1. Makes research less transparent and reproducible
2. Hinders the re-usability of intermediate outputs in the research process
3. Research vs. Software Development Practices
In software development, we glue together existing, well-
tested and validated components while trying to write as little
new code as possible.
In empirical research, we tend to start from the scratch, from
‘raw’ data and do everything ourselves.
4. The Aim of the Project
Design a rigorous approach for modeling empirical research processes without
sacrificing the diversity of research. To this end, I make three assumption about
research:
1. Empirical research means producing a posteriori knowledge by justifying knowledge claims with
appropriately analyzed observations.
2. The observations are recorded on a relatively persistent medium as data.
3. An empirical study incorporates a process that starts from acquiring, simulating, or otherwise generating
data about a phenomenon of interest and then proceeds by performing analytical operations on the data.
The process can go through several iterations and dead ends until the data have
been transformed into a form in which they support a scholarly knowledge claim.
5. Definitions
Research process is a series of modular operations that transform data step-by-step into a form that
supports a posteriori knowledge claim.
Modularity entails dividing a complex system into relatively independent components so that the
relationships between the components are easily governable.
Research operation is the basic unit (module) of a research process. Internally, a research operation
is a bundle of closely related data manipulations. Externally, the manipulations that make up the
operation are separated from all other operations so that the individual operation can be
understood in isolation.
Graph is a representation of a structure formed by vertices that may or may not be connected by
edges.
6. Minimal Graph Based Representation
That is, status quo in the absence of common language
We can think G1 to capture the entire research
process as one massive operation, that is, the
process is collapsed into a tightly coupled bundle
of inputs, data manipulations, and outputs.
An effective description of the process must then
fall back on whatever idiosyncratic and field-
specific practices are available to the researcher.
Obviously, a graph-based representation is here
mostly superfluous…
arrive at the results. Such practices may be shared to within a specific
they are seldom pinned down as formally specified rules. It is p
projects are naturally like +!, that is, inherently difficult to break dow
A graph-based representation would then seem superfluous, although
the research externally as inputs to other research processes.
Figure 1. A minimal graph-based representation
an empirical research process
More interestingly, +! can be seen as the status quo in how resear
without a shared language: publications may include elaborate desc
that was performed to produce the results, but these tend to lack
available to the researcher to convey the steps that we
performed to arrive at the results. Such practices m
be shared to within a specific academic communi
but they are seldom pinned down as formally specifi
rules. It is possible that some research proje
are naturally like G1, that is, inherently difficult
break down into modular operations. A graph-bas
representation would then seem superfluous, althou
it might still help offering the research externally
inputs to other research processes.
G1
v1
Figure 1. A minimal graph-based representation o
an empirical research process
More interestingly, G1 can be seen as the stat
quo in how research processes are described witho
a shared language: publications may include elabora
descriptions of empirical work that was performed
produce the results, but these tend to lack a structu
that would be immediately recognizable to fello
academics. Without extensive and often tacit knowled
A minimal graph-based representation of an
empirical research process
7. Vertices and Edges
We need a meaningful way to define the
vertices and edges of the research
process graph.
To account for the temporal order of
operations, we make the graph directed.
Vertices as outputs/inputs and edges as
research operations.
results in a number of problems that are worth exploring in some detai
must have a vertex at its both ends and hence a minimal graph-based m
(!", %"), would be !" = {"!, ""}, %" = {&!}. To account for the tem
operations, we also want to make +" a directed graph in which the set
ordered pair &! = ("!, ""). Figure 2 illustrates +".
Figure 2. Vertices as outputs/inputs and edges as
research operations
+" is immediately less elegant than +! as a starting point. It is difficult
counterpart similarly to +!. Also, the former would seem to suggest th
already existing output which does not make sense. Some material or e
k G1 to capture the entire research as one
ration; that is, the process is collapsed into
upled bundle of inputs, data manipulations,
.5
The description of the process must
ck on whatever idiosyncratic practices are
the researcher to convey the steps that were
o arrive at the results. Such practices may
o within a specific academic community,
seldom pinned down as formally specified
is possible that some research projects
y like G1, that is, inherently difficult to
into modular operations. A graph-based
on would then seem superfluous, although
ll help offering the research externally as
her research processes.
G1
v1
A minimal graph-based representation of
an empirical research process
terestingly, G1 can be seen as the status
research processes are described without
guage: publications may include elaborate
be tempting to think edges as research operations
and vertices as their outputs, yet this results in a
number of problems that are worth exploring in some
detail. To begin with, an edge must have a vertex
at its both ends and hence a minimal graph-based
model, let us call this G2 = (V2, E2), would be
V2 = {v1, v2}, E2 = {e1}. To account for the tempora
order of research operations, we also want to make G2 a
directed graph in which the set of edges E2 is made of
an ordered pair e1 = (v1, v2). Figure 2 illustrates G2.
G2
v1 v2
e1
Figure 2. Vertices as outputs/inputs and edges as
research actions
G2 is immediately less elegant than G1 as a starting
point. It is difficult to map G2 to a real-world
counterpart in a similarly to G1. Also, the former would
seem to suggest that research starts with an already
existing output which does not make sense. Some
material or events must of course exist for an empirica
research to start with, but the observations of any such
entities become research data only through the actions
8. Vertices and Edges
It is tempting to think edges as research
operations and vertices as their inputs/
outputs, but this results in several problems:
1. An edge must have vertices at both ends, which makes
the minimal graph G2 less elegant than G1 – it’s difficult
to map the former to a real-world counterpart in a
similar manner to the latter.
2. G2 suggests that research starts with an already existing
output, which does not make sense. Any observations
become data only through the actions of a researcher.
Vertices as outputs/inputs and edges as
research operations.
results in a number of problems that are worth exploring in some detai
must have a vertex at its both ends and hence a minimal graph-based m
(!", %"), would be !" = {"!, ""}, %" = {&!}. To account for the tem
operations, we also want to make +" a directed graph in which the set
ordered pair &! = ("!, ""). Figure 2 illustrates +".
Figure 2. Vertices as outputs/inputs and edges as
research operations
+" is immediately less elegant than +! as a starting point. It is difficult
counterpart similarly to +!. Also, the former would seem to suggest th
already existing output which does not make sense. Some material or e
k G1 to capture the entire research as one
ration; that is, the process is collapsed into
upled bundle of inputs, data manipulations,
.5
The description of the process must
ck on whatever idiosyncratic practices are
the researcher to convey the steps that were
o arrive at the results. Such practices may
o within a specific academic community,
seldom pinned down as formally specified
is possible that some research projects
y like G1, that is, inherently difficult to
into modular operations. A graph-based
on would then seem superfluous, although
ll help offering the research externally as
her research processes.
G1
v1
A minimal graph-based representation of
an empirical research process
terestingly, G1 can be seen as the status
research processes are described without
guage: publications may include elaborate
be tempting to think edges as research operations
and vertices as their outputs, yet this results in a
number of problems that are worth exploring in some
detail. To begin with, an edge must have a vertex
at its both ends and hence a minimal graph-based
model, let us call this G2 = (V2, E2), would be
V2 = {v1, v2}, E2 = {e1}. To account for the tempora
order of research operations, we also want to make G2 a
directed graph in which the set of edges E2 is made of
an ordered pair e1 = (v1, v2). Figure 2 illustrates G2.
G2
v1 v2
e1
Figure 2. Vertices as outputs/inputs and edges as
research actions
G2 is immediately less elegant than G1 as a starting
point. It is difficult to map G2 to a real-world
counterpart in a similarly to G1. Also, the former would
seem to suggest that research starts with an already
existing output which does not make sense. Some
material or events must of course exist for an empirica
research to start with, but the observations of any such
entities become research data only through the actions
9. perspectives on data that are being processed. Finally, a research opera
one output as its input, which is difficult to model if we define edg
illustrated by +# in Figure 3.
Figure 3. Research operation !! with multiple input
results in an ill-defined graph
Given the problems with +" and +#, and the overall approach they repr
research operations including their outputs. An operation is therefore
G3
v1
v2
v3
e1
e1
Figure 3. Research operation e1 with multiple inputs
results in an ill-defined graph
the output within the research operation. It follows from
this is that the references, that is, edges between research
operations will actually point backwards in time. This
makes it intuitive to trace research results back to the
operations that contributed to them and are needed to
Vertices and Edges
3. A research operation can use more than one
output as its input, which is difficult to model if we
define research operations as edges.
Research operation with multiple inputs
results in an ill-defined graph.
10. Research Process Graph, RPG
Research operation references the outputs
of two earlier operations as its inputs.
("*+(,, "-.+/) where "*+(,, "-.+/ ∈ ! and % = {&!, &", &#, … , &'}. The
strictly preceding operations, since an operation can only use existi
Figure 4 illustrates how 01+ solves the problem of capturing multipl
minimal, 01+ = (("!), ∅), is isomorphic with our elegant starting poin
Figure 4. Research operation "" references the
outputs of two earlier operations "! and "# as its
inputs
The edges of 01+ record the order of operations for each path in the g
can arise if we need to know the order of two operations that do not
outputs from other research operations. The edges are
thus directed and defined as ordered pairs of operations,
e = (vtail, vhead) where vtail, vhead 2 V and E =
{e1, e2, e3, ..., em}. The edges can only point to strictly
preceding operations, since an operation can only use
existing outputs as its inputs. Figure 4 illustrates how
RPG solves the problem of capturing multiple inputs in
G3. Also, the minimal, RPG = ((v1), ;), is isomorphic
with our elegant starting point G1.
RPG1
v1
v2
v3
e1
e2
Figure 4. Research operation v3 references the
outputs of two earlier operations v1 and v2 as its
inputs
The edges of RPG record the order of operations
for each path in the graph. However, problems can arise
if we need to know the order of two operations that
do not appear on the same path. This can happen, for
Let us define vertices as research operations
including their outputs, and edges as references to
outputs of earlier research operations.
It follows that references (edges) point backward in time.
This makes it intuitive to trace back a research operation
(results) to all those operations that contributed to it and
makes actual implementation of the graph more
straightforward.
Note that the minimal RPG is again isomorphic with our
elegant starting point G1
11. Research Process Graph, RPG
Research operation references the outputs
of two earlier operations as its inputs.
("*+(,, "-.+/) where "*+(,, "-.+/ ∈ ! and % = {&!, &", &#, … , &'}. The
strictly preceding operations, since an operation can only use existi
Figure 4 illustrates how 01+ solves the problem of capturing multipl
minimal, 01+ = (("!), ∅), is isomorphic with our elegant starting poin
Figure 4. Research operation "" references the
outputs of two earlier operations "! and "# as its
inputs
The edges of 01+ record the order of operations for each path in the g
can arise if we need to know the order of two operations that do not
outputs from other research operations. The edges are
thus directed and defined as ordered pairs of operations,
e = (vtail, vhead) where vtail, vhead 2 V and E =
{e1, e2, e3, ..., em}. The edges can only point to strictly
preceding operations, since an operation can only use
existing outputs as its inputs. Figure 4 illustrates how
RPG solves the problem of capturing multiple inputs in
G3. Also, the minimal, RPG = ((v1), ;), is isomorphic
with our elegant starting point G1.
RPG1
v1
v2
v3
e1
e2
Figure 4. Research operation v3 references the
outputs of two earlier operations v1 and v2 as its
inputs
The edges of RPG record the order of operations
for each path in the graph. However, problems can arise
if we need to know the order of two operations that
do not appear on the same path. This can happen, for
Graphing the Research Process
albeit the order of operations in ! and other edges in % may rule out such a possibility.
e 5 summarizes the definition of 01+.
1: #$% = ((, *)
2: ( = (,$, ,%, ,&, … , ,'), where . > 0
3: Research operations are added to ( in a non-decreasing order according
to their completion time.
5: * = {2$, 2%, 2&, … , 2(}, where 4 ≥0
6: 2 = (,)*+,, ,-+./), where ℎ278 < :7;<
7: #$% is a directed acyclic graph.
Figure 5. The definition of research process graph
does not have to be a simple or connected graph. There may be parallel edges, that is, more
one reference between two operations in the case the latter uses two different outputs from
rmer. To distinguish between the parallel edges and, more generally, to help identify the
t that is being referenced, we add a set of edge labels ;'
1
. We also add a set of vertex
;%
2
that allows to construct unique identifiers for research operations and their outputs by
ining vertex and edge labels together. To serve their function as identifiers, the edge labels
However, to allow mapping the graph to actual
research processes, we need identifiers for
research operations and references (edges).
12. Research Process Graph, RPG
Research operation references the outputs
of two earlier operations as its inputs.
("*+(,, "-.+/) where "*+(,, "-.+/ ∈ ! and % = {&!, &", &#, … , &'}. The
strictly preceding operations, since an operation can only use existi
Figure 4 illustrates how 01+ solves the problem of capturing multipl
minimal, 01+ = (("!), ∅), is isomorphic with our elegant starting poin
Figure 4. Research operation "" references the
outputs of two earlier operations "! and "# as its
inputs
The edges of 01+ record the order of operations for each path in the g
can arise if we need to know the order of two operations that do not
outputs from other research operations. The edges are
thus directed and defined as ordered pairs of operations,
e = (vtail, vhead) where vtail, vhead 2 V and E =
{e1, e2, e3, ..., em}. The edges can only point to strictly
preceding operations, since an operation can only use
existing outputs as its inputs. Figure 4 illustrates how
RPG solves the problem of capturing multiple inputs in
G3. Also, the minimal, RPG = ((v1), ;), is isomorphic
with our elegant starting point G1.
RPG1
v1
v2
v3
e1
e2
Figure 4. Research operation v3 references the
outputs of two earlier operations v1 and v2 as its
inputs
The edges of RPG record the order of operations
for each path in the graph. However, problems can arise
if we need to know the order of two operations that
do not appear on the same path. This can happen, for
Graphing the Research Process
albeit the order of operations in ! and other edges in % may rule out such a possibility.
e 5 summarizes the definition of 01+.
1: #$% = ((, *)
2: ( = (,$, ,%, ,&, … , ,'), where . > 0
3: Research operations are added to ( in a non-decreasing order according
to their completion time.
5: * = {2$, 2%, 2&, … , 2(}, where 4 ≥0
6: 2 = (,)*+,, ,-+./), where ℎ278 < :7;<
7: #$% is a directed acyclic graph.
Figure 5. The definition of research process graph
does not have to be a simple or connected graph. There may be parallel edges, that is, more
one reference between two operations in the case the latter uses two different outputs from
rmer. To distinguish between the parallel edges and, more generally, to help identify the
t that is being referenced, we add a set of edge labels ;'
1
. We also add a set of vertex
;%
2
that allows to construct unique identifiers for research operations and their outputs by
ining vertex and edge labels together. To serve their function as identifiers, the edge labels
Graphing the Research Process
cture that provides globally unique and searchable identifiers for research operations
we will discuss below, verify their integrity). This would allow, in principle, any
operation to reference outputs from any other operation in the global network of
al research—note that I am not talking about the papers published from the study but the
empirical operations that were performed to come up with the results. This may sound a
hed vision, yet it is exactly what happens in software development, where newly written
ypically a fraction of the total codebase of a new product.
8: =0
= {<$
0
, <%
0
, <&
0
, … , <'
0
}, where . is the number of vertices in #$%
9: =1
= {<$
1
, <%
1
, <&
1
, … , <(
1
}, where 4 is the number of vertices in #$%
Figure 6. Adding vertex and edge labels to >?@
isolated vertices and separate graph components can capture false starts and separate
inquiry that did not contribute to each other or did not lead to useful findings, but are still
hile to report as they may provide valuable resources to other studies. These
ations lead to two important questions concerning the boundaries of 01+. First, one
choose whether to include in 01+ false starts, all the iterations, and separates lines of
13. Toward a Global Research Graph
The graph-based notation of research process graph leaves many practical issues
open.
1. The identification of research operations and their outputs in practice
2. The degree of process modularization
3. Research operation metadata
4. The stability and verifiability of research operations
14. The Vision
Research process graphs could evolve into boundary objects in academic
communication that allow researchers to make intermediary outputs from
empirical operations broadly available to each other.
To explore the feasibility of a global research graph, future studies should:
1. Develop algorithms to create visually appealing ways to plot RPGs
2. Assess the idea of RPG with respect to existing infrastructures
3. Simulate the benefits of modular empirical research