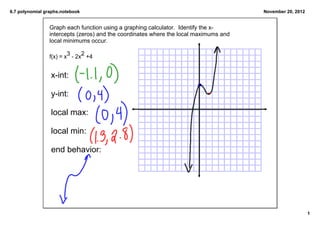
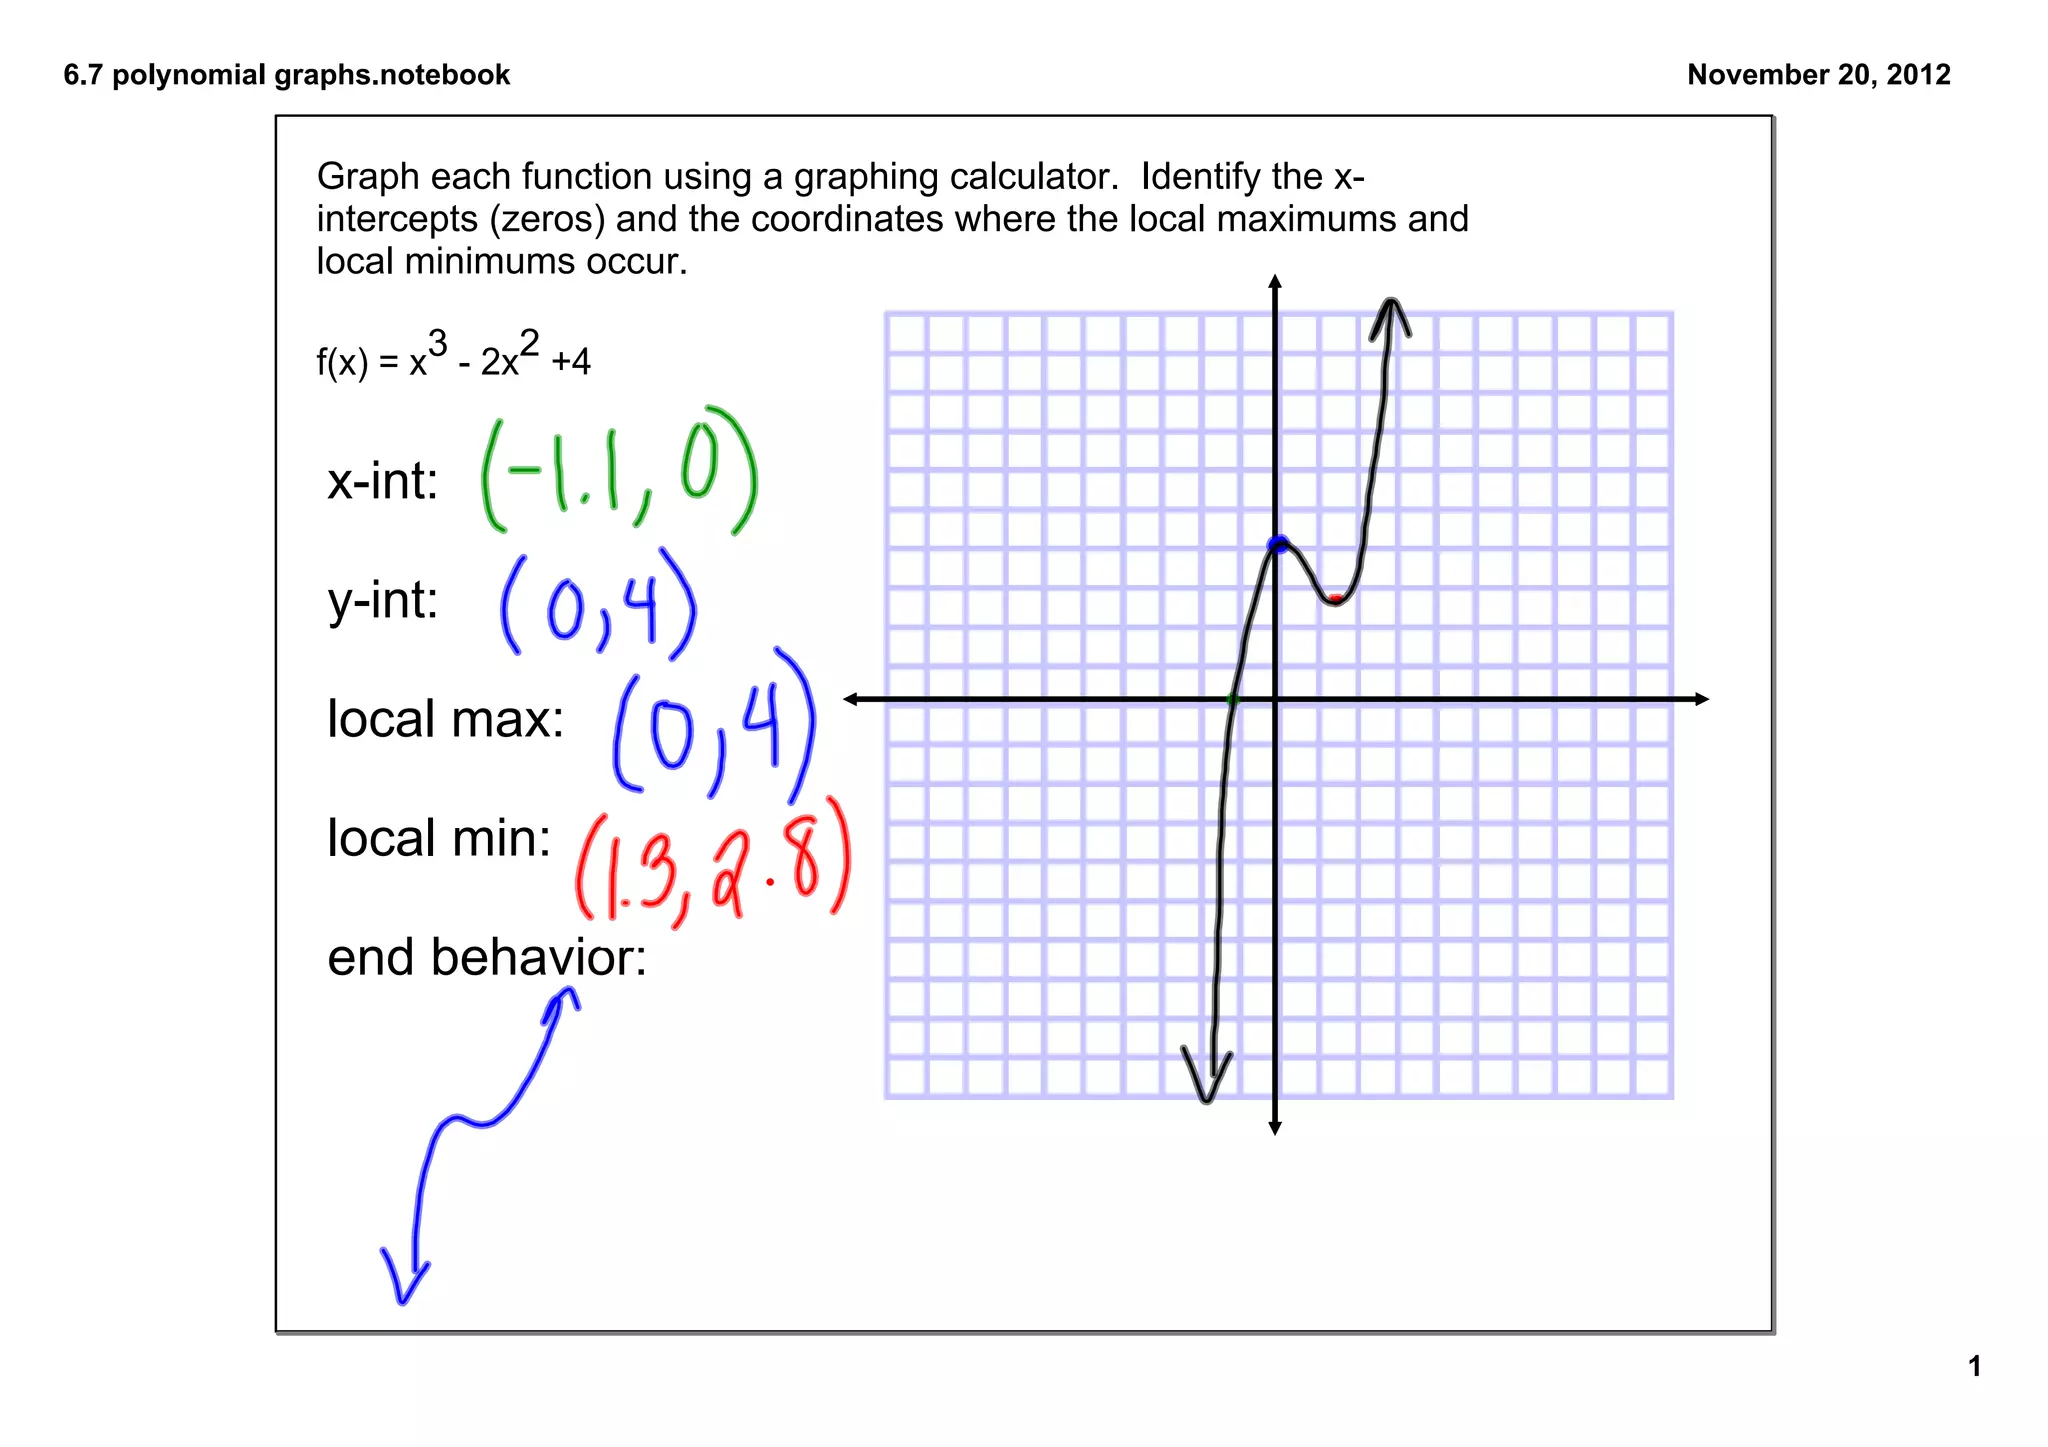
6.7 polynomial graphs.notebook                                                         November 20, 2012


                Graph each function using a graphing calculator.  Identify the x­
                intercepts (zeros) and the coordinates where the local maximums and 
                local minimums occur.

                        3     2
                f(x) = x  ­ 2x  +4


                 x­int:     (­1.1, 0)
                 y­int:          (0, 4)
                 local max: (0, 4)

                 local min:         (1.3, 2.8)
                 end behavior:


                                                                                                           1
6.7 polynomial graphs.notebook                                November 20, 2012


                  f(x) = x4 ­ 3x3 ­ x2 + 6x ­ 4


                     x­int:      (­1.5, 0), (2.8, 0)

                     y­int: (0, ­4)

                     local max: (.9, ­.9)

                     local min: (­.8, ­7.5), (      ,     )

                     end behavior:


                                                                                  2

Graphing calc 6.7

  • 1.
    6.7 polynomial graphs.notebook November 20, 2012 Graph each function using a graphing calculator.  Identify the x­ intercepts (zeros) and the coordinates where the local maximums and  local minimums occur. 3 2 f(x) = x  ­ 2x  +4 x­int: (­1.1, 0) y­int: (0, 4) local max: (0, 4) local min: (1.3, 2.8) end behavior: 1
  • 2.
    6.7 polynomial graphs.notebook November 20, 2012 f(x) = x4 ­ 3x3 ­ x2 + 6x ­ 4 x­int: (­1.5, 0), (2.8, 0) y­int: (0, ­4) local max: (.9, ­.9) local min: (­.8, ­7.5), (      ,     ) end behavior: 2