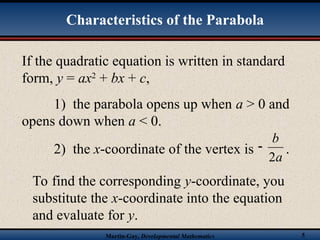
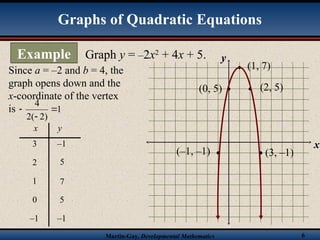
Graphing Quadratic
Equations in Two
Variables
Martin-Gay, Developmental Mathematics 2
We spent a lot of time graphing linear equations in
chapter 3.
The graph of a quadratic equation is a parabola.
The highest point or lowest point on the parabola
is the vertex.
Axis of symmetry is the line that runs through the
vertex and through the middle of the parabola.
Graphs of Quadratic Equations
Martin-Gay, Developmental Mathematics 3
x
y
Graph y = 2x2
– 4.
x y
0 –4
1 –2
–1 –2
2 4
–2 4
(2, 4)
(–2, 4)
(1, –2)
(–1, – 2)
(0, –4)
Graphs of Quadratic Equations
Example
Martin-Gay, Developmental Mathematics 4
Although we can simply plot points, it is helpful
to know some information about the parabola
we will be graphing prior to finding individual
points.
To find x-intercepts of the parabola, let y = 0
and solve for x.
To find y-intercepts of the parabola, let x = 0
and solve for y.
Intercepts of the Parabola
Martin-Gay, Developmental Mathematics 5
If the quadratic equation is written in standard
form, y = ax2
+ bx + c,
1) the parabola opens up when a > 0 and
opens down when a < 0.
2) the x-coordinate of the vertex is .
a
b
2

To find the corresponding y-coordinate, you
substitute the x-coordinate into the equation
and evaluate for y.
Characteristics of the Parabola
Martin-Gay, Developmental Mathematics 6
x
y
Graph y = –2x2
+ 4x + 5.
x y
1 7
2 5
0 5
3 –1
–1 –1
(3, –1)
(–1, –1)
(2, 5)
(0, 5)
(1, 7)
Since a = –2 and b = 4, the
graph opens down and the
x-coordinate of the vertex
is 1
)
2
(
2
4



Graphs of Quadratic Equations
Example

Graphical Method-Quadratic Equations.ppt

  • 1.
  • 2.
    Martin-Gay, Developmental Mathematics2 We spent a lot of time graphing linear equations in chapter 3. The graph of a quadratic equation is a parabola. The highest point or lowest point on the parabola is the vertex. Axis of symmetry is the line that runs through the vertex and through the middle of the parabola. Graphs of Quadratic Equations
  • 3.
    Martin-Gay, Developmental Mathematics3 x y Graph y = 2x2 – 4. x y 0 –4 1 –2 –1 –2 2 4 –2 4 (2, 4) (–2, 4) (1, –2) (–1, – 2) (0, –4) Graphs of Quadratic Equations Example
  • 4.
    Martin-Gay, Developmental Mathematics4 Although we can simply plot points, it is helpful to know some information about the parabola we will be graphing prior to finding individual points. To find x-intercepts of the parabola, let y = 0 and solve for x. To find y-intercepts of the parabola, let x = 0 and solve for y. Intercepts of the Parabola
  • 5.
    Martin-Gay, Developmental Mathematics5 If the quadratic equation is written in standard form, y = ax2 + bx + c, 1) the parabola opens up when a > 0 and opens down when a < 0. 2) the x-coordinate of the vertex is . a b 2  To find the corresponding y-coordinate, you substitute the x-coordinate into the equation and evaluate for y. Characteristics of the Parabola
  • 6.
    Martin-Gay, Developmental Mathematics6 x y Graph y = –2x2 + 4x + 5. x y 1 7 2 5 0 5 3 –1 –1 –1 (3, –1) (–1, –1) (2, 5) (0, 5) (1, 7) Since a = –2 and b = 4, the graph opens down and the x-coordinate of the vertex is 1 ) 2 ( 2 4    Graphs of Quadratic Equations Example