WHAT IS GRAPHDATABASE
• A graph database uses graph structures for semantic queries. The data gets
stored as nodes, edges, and properties.
• Nodes represent entities such as people or products.
• Edges define relationships between nodes.
• Properties provide additional information about nodes and edges.
• This structure allows for efficient querying and visualization of complex
relationships.
2
3.
3
KEY FEATURES OFGRAPH
DATABASES
• Data Modeling Capabilities
• Graph databases offer flexible data modeling. Unlike relational databases,
graph databases do not require a predefined schema. This flexibility allows
for the easy addition of new types of relationships and nodes.
• Graph databases can model real-world scenarios more naturally. This
capability proves useful in dynamic environments like social networks and
supply chain management.
• Query Languages
• Graph databases use specialized query languages.
• Neo4j uses Cypher, a declarative graph query language.
• TigerGraph employs GSQL, which combines SQL-like syntax with graph
traversal capabilities.
• ArangoDB uses AQL, a versatile query language for its multi-model
database.
• These languages enable complex queries that would be cumbersome in
SQL.
4.
4
• Performance andScalability
• Graph databases outperform traditional databases in handling
connected data.
• Neo4j offers robust performance for read-heavy workloads.
• TigerGraph excels in data loading speed and storage efficiency.
• ArangoDB provides competitive performance with its multi-model
approach.
• Scalability remains a critical factor. Graph databases scale
horizontally, accommodating growing datasets without sacrificing
performance. This scalability ensures that graph databases meet the
demands of modern applications.
5.
5
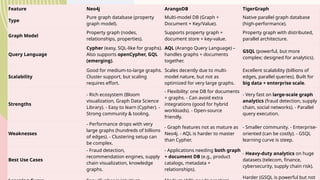
Feature Neo4j ArangoDBTigerGraph
Type
Pure graph database (property
graph model).
Multi-model DB (Graph +
Document + Key/Value).
Native parallel graph database
(high-performance).
Graph Model
Property graph (nodes,
relationships, properties).
Supports property graph +
document store + key-value.
Property graph with distributed,
parallel architecture.
Query Language
Cypher (easy, SQL-like for graphs).
Also supports openCypher, GQL
(emerging).
AQL (Arango Query Language) –
handles graphs + documents
together.
GSQL (powerful, but more
complex; designed for analytics).
Scalability
Good for medium-to-large graphs.
Cluster support, but scaling
requires effort.
Scales decently due to multi-
model nature, but not as
optimized for very large graphs.
Excellent scalability (billions of
edges, parallel queries). Built for
big data + enterprise scale.
Strengths
- Rich ecosystem (Bloom
visualization, Graph Data Science
Library). - Easy to learn (Cypher). -
Strong community & tooling.
- Flexibility: one DB for documents
+ graphs. - Can avoid extra
integrations (good for hybrid
workloads). - Open-source
friendly.
- Very fast on large-scale graph
analytics (fraud detection, supply
chain, social networks). - Parallel
query execution.
Weaknesses
- Performance drops with very
large graphs (hundreds of billions
of edges). - Clustering setup can
be complex.
- Graph features not as mature as
Neo4j. - AQL is harder to master
than Cypher.
- Smaller community. - Enterprise-
oriented (can be costly). - GSQL
learning curve is steep.
Best Use Cases
- Fraud detection,
recommendation engines, supply
chain visualization, knowledge
graphs.
- Applications needing both graph
+ document DB (e.g., product
catalogs, metadata +
relationships).
- Heavy-duty analytics on huge
datasets (telecom, finance,
cybersecurity, supply chain risk).
Harder (GSQL is powerful but not
6.
6
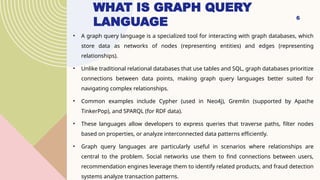
WHAT IS GRAPHQUERY
LANGUAGE
• A graph query language is a specialized tool for interacting with graph databases, which
store data as networks of nodes (representing entities) and edges (representing
relationships).
• Unlike traditional relational databases that use tables and SQL, graph databases prioritize
connections between data points, making graph query languages better suited for
navigating complex relationships.
• Common examples include Cypher (used in Neo4j), Gremlin (supported by Apache
TinkerPop), and SPARQL (for RDF data).
• These languages allow developers to express queries that traverse paths, filter nodes
based on properties, or analyze interconnected data patterns efficiently.
• Graph query languages are particularly useful in scenarios where relationships are
central to the problem. Social networks use them to find connections between users,
recommendation engines leverage them to identify related products, and fraud detection
systems analyze transaction patterns.
8
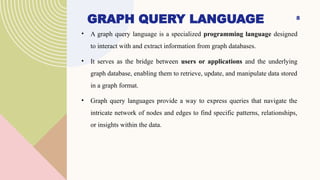
GRAPH QUERY LANGUAGE
•A graph query language is a specialized programming language designed
to interact with and extract information from graph databases.
• It serves as the bridge between users or applications and the underlying
graph database, enabling them to retrieve, update, and manipulate data stored
in a graph format.
• Graph query languages provide a way to express queries that navigate the
intricate network of nodes and edges to find specific patterns, relationships,
or insights within the data.
9.
GRAPH QUERY LANGUAGES9
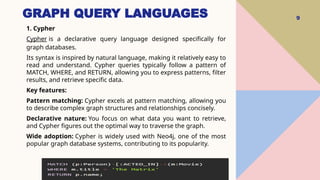
1. Cypher
Cypher is a declarative query language designed specifically for
graph databases.
Its syntax is inspired by natural language, making it relatively easy to
read and understand. Cypher queries typically follow a pattern of
MATCH, WHERE, and RETURN, allowing you to express patterns, filter
results, and retrieve specific data.
Key features:
Pattern matching: Cypher excels at pattern matching, allowing you
to describe complex graph structures and relationships concisely.
Declarative nature: You focus on what data you want to retrieve,
and Cypher figures out the optimal way to traverse the graph.
Wide adoption: Cypher is widely used with Neo4j, one of the most
popular graph database systems, contributing to its popularity.
10.
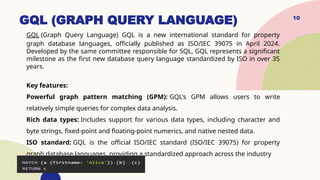
GQL (GRAPH QUERYLANGUAGE)
GQL (Graph Query Language) GQL is a new international standard for property
graph database languages, officially published as ISO/IEC 39075 in April 2024.
Developed by the same committee responsible for SQL, GQL represents a significant
milestone as the first new database query language standardized by ISO in over 35
years.
Key features:
Powerful graph pattern matching (GPM): GQL's GPM allows users to write
relatively simple queries for complex data analysis.
Rich data types: Includes support for various data types, including character and
byte strings, fixed-point and floating-point numerics, and native nested data.
ISO standard: GQL is the official ISO/IEC standard (ISO/IEC 39075) for property
graph database languages, providing a standardized approach across the industry
10
11.
11
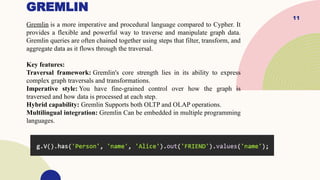
GREMLIN
Gremlin is amore imperative and procedural language compared to Cypher. It
provides a flexible and powerful way to traverse and manipulate graph data.
Gremlin queries are often chained together using steps that filter, transform, and
aggregate data as it flows through the traversal.
Key features:
Traversal framework: Gremlin's core strength lies in its ability to express
complex graph traversals and transformations.
Imperative style: You have fine-grained control over how the graph is
traversed and how data is processed at each step.
Hybrid capability: Gremlin Supports both OLTP and OLAP operations.
Multilingual integration: Gremlin Can be embedded in multiple programming
languages.
12.
12
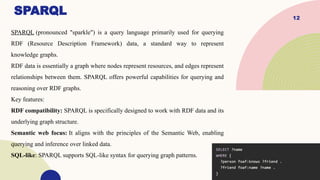
SPARQL
SPARQL (pronounced "sparkle")is a query language primarily used for querying
RDF (Resource Description Framework) data, a standard way to represent
knowledge graphs.
RDF data is essentially a graph where nodes represent resources, and edges represent
relationships between them. SPARQL offers powerful capabilities for querying and
reasoning over RDF graphs.
Key features:
RDF compatibility: SPARQL is specifically designed to work with RDF data and its
underlying graph structure.
Semantic web focus: It aligns with the principles of the Semantic Web, enabling
querying and inference over linked data.
SQL-like: SPARQL supports SQL-like syntax for querying graph patterns.
13.
13
WHAT IS GRAPHDATA
MODELING?
Data modeling is a practice that defines the logic of queries and the structure of the data in
storage. A well-designed model is the key to leveraging the strengths of a graph database as
it improves query performance, supports flexible queries, and optimizes storage.
In summary, the process of creating a data model includes the following:
• Understand the domain and define specific use cases (questions) for the application.
• Develop an initial graph data model by extracting entities and decide how they relate to
each other.
• Test the use cases against the initial data model.
• Create the graph with test data using Cypher.
• Test the use cases, including performance against the graph.
• Refactor the graph data model due to changes in the key use cases or for performance
reasons.
14.
14
CREATE A GRAPHDATA MODEL
Define the domain
The Movies example dataset, the domain includes movies, people who acted or directed movies, and users
who rated movies. It is in the connections (relationships) between these entities that you find insights about
your domain.
Define the use case
In other words, what questions are you trying to answer?
You can make a list of questions to help you identify the application use cases. The questions will help you
define what you need from the application, and what data must be included in the graph.
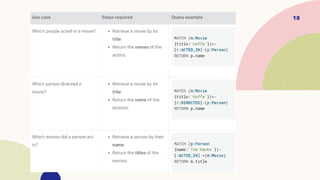
For this tutorial, your application should be able to answer these questions:
• Which people acted in a movie?
• Which person directed a movie?
• Which movies did a person act in?
• How many users rated a movie?
• Who was the youngest person to act in a movie?
• Which role did a person play in a movie?
• Which is the highest rated movie in a particular year according to imDB?
• Which drama movies did an actor act in?
• Which users gave a movie a rating of 5?
15.
15
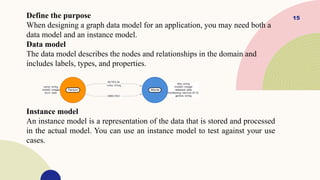
Define the purpose
Whendesigning a graph data model for an application, you may need both a
data model and an instance model.
Data model
The data model describes the nodes and relationships in the domain and
includes labels, types, and properties.
Instance model
An instance model is a representation of the data that is stored and processed
in the actual model. You can use an instance model to test against your use
cases.
17
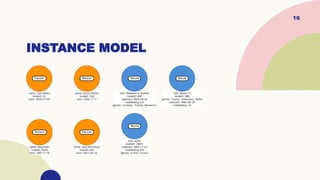
Define entities
An instancemodel helps you preview how the data will be stored as nodes, relationships, and
properties. The next step is to refine your model with more details.
Labels
The dominant nouns in your application use case are represented as nodes in your model and
can be used as node labels. For example:
Which person acted in a movie?
How many users rated a movie?
The nodes in your initial model are thus Person, Movie, and User
Node properties
MATCH (p:Person {name: 'Tom Hanks'})-[:ACTED_IN]-(m:Movie)
RETURN m
With these properties, it is easier to visualize what you need from the graph to answer
the use case questions.
19
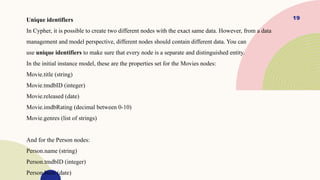
Unique identifiers
In Cypher,it is possible to create two different nodes with the exact same data. However, from a data
management and model perspective, different nodes should contain different data. You can
use unique identifiers to make sure that every node is a separate and distinguished entity.
In the initial instance model, these are the properties set for the Movies nodes:
Movie.title (string)
Movie.tmdbID (integer)
Movie.released (date)
Movie.imdbRating (decimal between 0-10)
Movie.genres (list of strings)
And for the Person nodes:
Person.name (string)
Person.tmdbID (integer)
Person.born (date)
20.
20
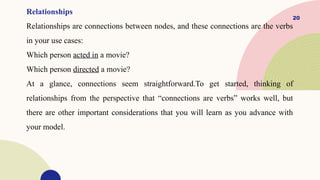
Relationships
Relationships are connectionsbetween nodes, and these connections are the verbs
in your use cases:
Which person acted in a movie?
Which person directed a movie?
At a glance, connections seem straightforward.To get started, thinking of
relationships from the perspective that “connections are verbs” works well, but
there are other important considerations that you will learn as you advance with
your model.
21.
21
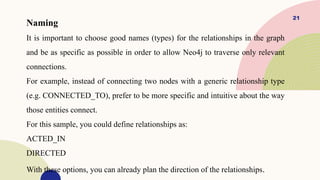
Naming
It is importantto choose good names (types) for the relationships in the graph
and be as specific as possible in order to allow Neo4j to traverse only relevant
connections.
For example, instead of connecting two nodes with a generic relationship type
(e.g. CONNECTED_TO), prefer to be more specific and intuitive about the way
those entities connect.
For this sample, you could define relationships as:
ACTED_IN
DIRECTED
With these options, you can already plan the direction of the relationships.
22.
22
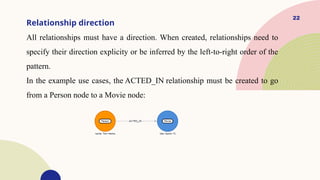
Relationship direction
All relationshipsmust have a direction. When created, relationships need to
specify their direction explicity or be inferred by the left-to-right order of the
pattern.
In the example use cases, the ACTED_IN relationship must be created to go
from a Person node to a Movie node:
23.
23
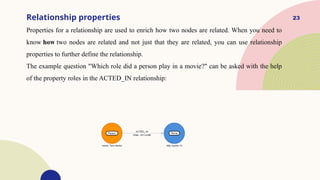
Relationship properties
Properties fora relationship are used to enrich how two nodes are related. When you need to
know how two nodes are related and not just that they are related, you can use relationship
properties to further define the relationship.
The example question "Which role did a person play in a movie?" can be asked with the help
of the property roles in the ACTED_IN relationship:
24.
24
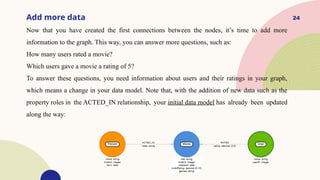
Add more data
Nowthat you have created the first connections between the nodes, it’s time to add more
information to the graph. This way, you can answer more questions, such as:
How many users rated a movie?
Which users gave a movie a rating of 5?
To answer these questions, you need information about users and their ratings in your graph,
which means a change in your data model. Note that, with the addition of new data such as the
property roles in the ACTED_IN relationship, your initial data model has already been updated
along the way:
25.
25
GRAPH ALGORITHMS
Graph algorithmsare computational methods designed to process and analyze
data structured as a graph.
A graph is a data structure consisting of vertices (also known as nodes) and
edges that connect these vertices.
These algorithms are crucial for understanding relationships, paths, and patterns
within interconnected data.
26.
26
RANDOM WALKS
• Thefirst and most basic of these concepts are random walks.
• A random walk simply chooses a starting node from which to begin its walk and
then randomly traverses the graph for some amount of steps or “hops”.
• A random walk can be performed on any graph whether it be directed,
undirected, weighted, or unweighted or even disconnected graphs.
• As we will see, these random walks can be used to solve a number of problems
and are therefore the foundation for most graph algorithms.
27.
27
PATHFINDING & SEARCHALGORITHMS
Another foundational graph algorithm family are graph shortest path
algorithms. Shortest path algorithms typically come in two flavors depending
on the nature of the problem and how you want to explore the graph to
ultimately find the shortest path.
Depth First Search, starts by traversing as deeply into the graph as possible
before returning to its starting point and pursuing another deep path traversal.
Breadth First Search, keeps its traversals as close to the starting node as
possible and only ventures deeper into the graph when it has exhausted all
possible paths closest to it.
28.
28
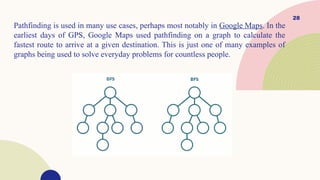
Pathfinding is usedin many use cases, perhaps most notably in Google Maps. In the
earliest days of GPS, Google Maps used pathfinding on a graph to calculate the
fastest route to arrive at a given destination. This is just one of many examples of
graphs being used to solve everyday problems for countless people.
29.
29
CENTRALITY ALGORITHMS
Centrality Algorithmscan be used to analyze a graph as a whole to
understand which nodes within that graph have the greatest impact on the
network.
However, to measure the influence of a node in the network with an
algorithm, we must first define what “impact” on a graph means.
This differs from algorithm to algorithm and is a great starting point when
trying to decide which centrality algorithm to choose.
30.
30
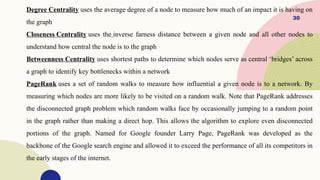
Degree Centrality usesthe average degree of a node to measure how much of an impact it is having on
the graph
Closeness Centrality uses the inverse farness distance between a given node and all other nodes to
understand how central the node is to the graph
Betweenness Centrality uses shortest paths to determine which nodes serve as central ‘bridges’ across
a graph to identify key bottlenecks within a network
PageRank uses a set of random walks to measure how influential a given node is to a network. By
measuring which nodes are more likely to be visited on a random walk. Note that PageRank addresses
the disconnected graph problem which random walks face by occasionally jumping to a random point
in the graph rather than making a direct hop. This allows the algorithm to explore even disconnected
portions of the graph. Named for Google founder Larry Page, PageRank was developed as the
backbone of the Google search engine and allowed it to exceed the performance of all its competitors in
the early stages of the internet.
31.
31
COMMUNITY DETECTION ALGORITHMS
Communitydetection is a common use case for a variety of graphs.
Typically it is used in any situation where understanding the distinct groups of
nodes within a graph offers some tangible value to the use case.
This could be anything from social networks, from fleets of trucks making
deliveries to a network of accounts transacting with one another.
However, which algorithm you choose to discover these communities will
greatly impact how they’re grouped.
32.
32
Triangle Count simplyuses the principle that three nodes fully connected to one another (like a triangle) is the
simplest community dynamic that can exist in a graph. It therefore finds every combination of triangles within
a graph to determine how those nodes are grouped together
Strongly Connected Components and Connected Components are excellent algorithms for determining the
shape of your graph. Both aim to measure how many graphs make up the entirety of the data. While Connected
Components simply returns the number of completely disconnected graphs within a set of nodes and edges,
Strongly Connected Components returns those subgraphs which are solidly connected by many linkages.
Because of this, they are typically used in combination as a form of initial exploratory data analysis when first
analyzing graph data.
Louvain Modularity finds communities by comparing clusters of nodes and edges to the average for the
network. If a group of nodes are found to be generally greater than what is seen on average in the graph, those
nodes can be considered a community.
33.
33
SHORTEST PATH
ALGORITHMS
The ShortestPath algorithms calculate the
shortest path between a pair of nodes. There
are different algorithms that achieve this goal:
Dijkstra's Algorithm Purpose: Find the shortest
path from a single source to all other nodes in
a graph with non-negative edge weights.
Method: Uses a greedy approach with a
priority queue to iteratively select the nearest
unvisited node. Example Use Cases: GPS
navigation, network routing, and game
pathfinding.
34.
34
Bellman-Ford Algorithm Purpose:Compute shortest
paths from a single source in graphs that may contain
negative edge weights. Method: Iteratively relax all
edges up to (V 1) times, where V is the number of
−
vertices. Example Use Cases: Currency arbitrage
detection, routing in networks with variable costs, and
analyzing economic models.
Floyd-Warshall Algorithm Purpose: Find shortest
paths between all pairs of nodes in a graph. Method:
Uses dynamic programming to update path lengths by
considering all possible intermediate nodes. Example
Use Cases: Traffic analysis, social network distance
metrics, and transitive closure in databases.
Click icon to add picture
35.
35
GRAPH DATABASE INDEXING
Itis the process of creating and maintaining
indexes in a graph database, for faster
querying and traversal. They can be of
different types based on the implementation:
Full-text search (FTS) indexing
Spatial indexing Relationship indexing
Click icon to add picture
36.
36
FULL-TEXT SEARCH (FTS)
INDEXING
Full-textsearch (FTS) indexing enables very fast queries
over textual data stored in the nodes.
Text-based properties (like names, descriptions) are
indexed for efficient searching.
This allows users to perform flexible queries using
keywords, partial matches, or phrases
Examples: Searching product descriptions in an e-
commerce graph, locating users by name or bio in a social
network graph
37.
37
SPATIAL INDEXING
Spatial indexingenables fast querying of
location-based data stored in graph nodes or
relationships.
Spatial properties (like coordinates or
geometries) using tree based data structures
(like R-trees) are indexed to support spatial
operations.
This allows users to perform efficient queries
based on location data.
Examples: Finding nearby restaurants in a
location graph, locate nearby friends in a
social graph.
Click icon to add picture
38.
38
RELATIONSHIP INDEXING
It speedsup queries that depend on specific types or
properties of relationships between nodes.
Indexes relationship types or attributes (like
timestamps, weights, or labels) to allow fast filtering
and traversal of graph.
This allows users to quickly find relevant connections
based on the relationship properties. Examples:
Filtering recent interactions in social graphs, tracing
financial transactions in fraud detection.
![17
Define entities
An instance model helps you preview how the data will be stored as nodes, relationships, and
properties. The next step is to refine your model with more details.
Labels
The dominant nouns in your application use case are represented as nodes in your model and
can be used as node labels. For example:
Which person acted in a movie?
How many users rated a movie?
The nodes in your initial model are thus Person, Movie, and User
Node properties
MATCH (p:Person {name: 'Tom Hanks'})-[:ACTED_IN]-(m:Movie)
RETURN m
With these properties, it is easier to visualize what you need from the graph to answer
the use case questions.](https://image.slidesharecdn.com/graphdatabase-251111165444-59ad1cc8-251114155733-349a76d5/85/graphdatabaseGraph-database_10-ppt-etty-rtyGraph-database_10-ppt-etty-rtyGraph-database_10-ppt-etty-rty-17-320.jpg)