Who am I
Ph.DKisung Kim - Chief Technology Officer of Bitnine Global Inc.
Researched query optimization for graph-structured data during doctorate degree
Developed a distributed relational database engine in TmaxSoft
Lead the development of a new graph database, Agens Graph in Bitnine Global
4.
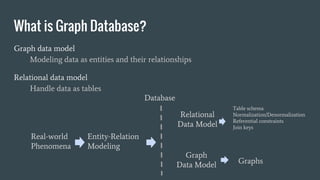
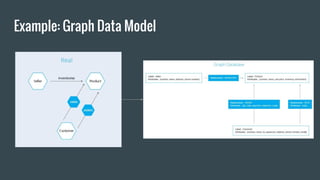
Graph data model
Modelingdata as entities and their relationships
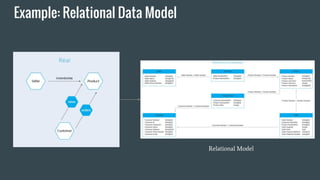
Relational data model
Handle data as tables
What is Graph Database?
Real-world
Phenomena
Relational
Data Model
Graph
Data Model
Entity-Relation
Modeling
Database
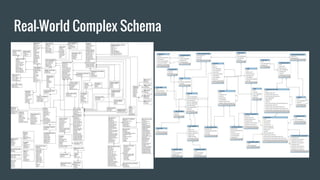
Table schema
Normalization/Denormalization
Referential constraints
Join keys
Graphs
5.
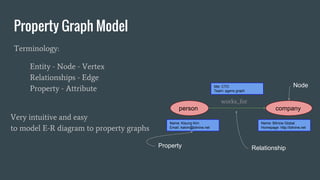
Property Graph Model
Terminology:
Entity- Node - Vertex
Relationships - Edge
Property - Attribute
person company
works_for
Name: Kisung Kim
Email: kskim@bitnine.net
Name: Bitnine Global
Homepage: http://bitnine.net
title: CTO
Team: agens graph
Property
Node
Relationship
Very intuitive and easy
to model E-R diagram to property graphs
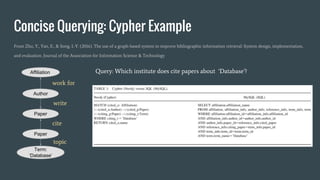
Concise Querying: CypherExample
From Zhu, Y., Yan, E., & Song, I.-Y. (2016). The use of a graph-based system to improve bibliographic information retrieval: System design, implementation,
and evaluation. Journal of the Association for Information Science & Technology
Affiliation
Author
Paper
Paper
Term:
‘Database’
cite
write
work for
topic
Query: Which institute does cite papers about ‘Database’?
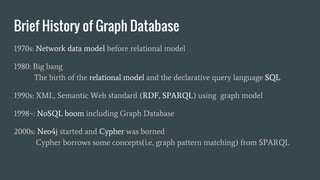
10.
Brief History ofGraph Database
1970s: Network data model before relational model
1980: Big bang
The birth of the relational model and the declarative query language SQL
1990s: XML, Semantic Web standard (RDF, SPARQL) using graph model
1998~: NoSQL boom including Graph Database
2000s: Neo4j started and Cypher was borned
Cypher borrows some concepts(i.e, graph pattern matching) from SPARQL
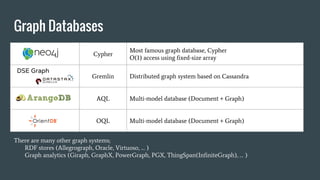
11.
Cypher
Most famous graphdatabase, Cypher
O(1) access using fixed-size array
Gremlin Distributed graph system based on Cassandra
AQL Multi-model database (Document + Graph)
OQL Multi-model database (Document + Graph)
Graph Databases
DSE Graph
There are many other graph systems;
RDF stores (Allegrograph, Oracle, Virtuoso, … )
Graph analytics (Giraph, GraphX, PowerGraph, PGX, ThingSpan(InfiniteGraph), … )
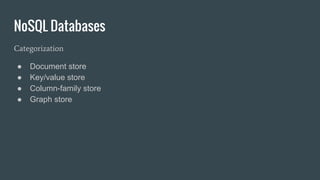
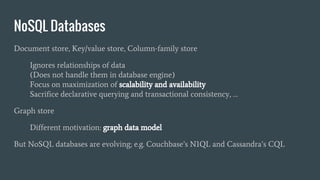
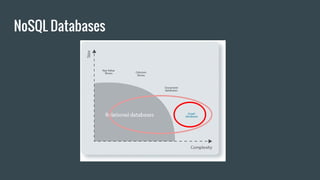
NoSQL Databases
Document store,Key/value store, Column-family store
Ignores relationships of data
(Does not handle them in database engine)
Focus on maximization of scalability and availability
Sacrifice declarative querying and transactional consistency, …
Graph store
Different motivation: graph data model
But NoSQL databases are evolving; e.g. Couchbase’s N1QL and Cassandra’s CQL
Summary
Graph database motivation
Simpleand intuitive data modeling for complex relationship data
Graph database strengths
Enhanced productivity from concise queries
Fast traversal performance for complex graphs
Graph visualization and graph analytics


![[DSC Europe 25] Josip Saban - Career building for data professionals.pptx](https://cdn.slidesharecdn.com/ss_thumbnails/zroflcttkm1vmli0txea-josip-saban-career-building-for-data-professionals-260123083019-587cdb8c-thumbnail.jpg?width=640&height=640&fit=bounds)


