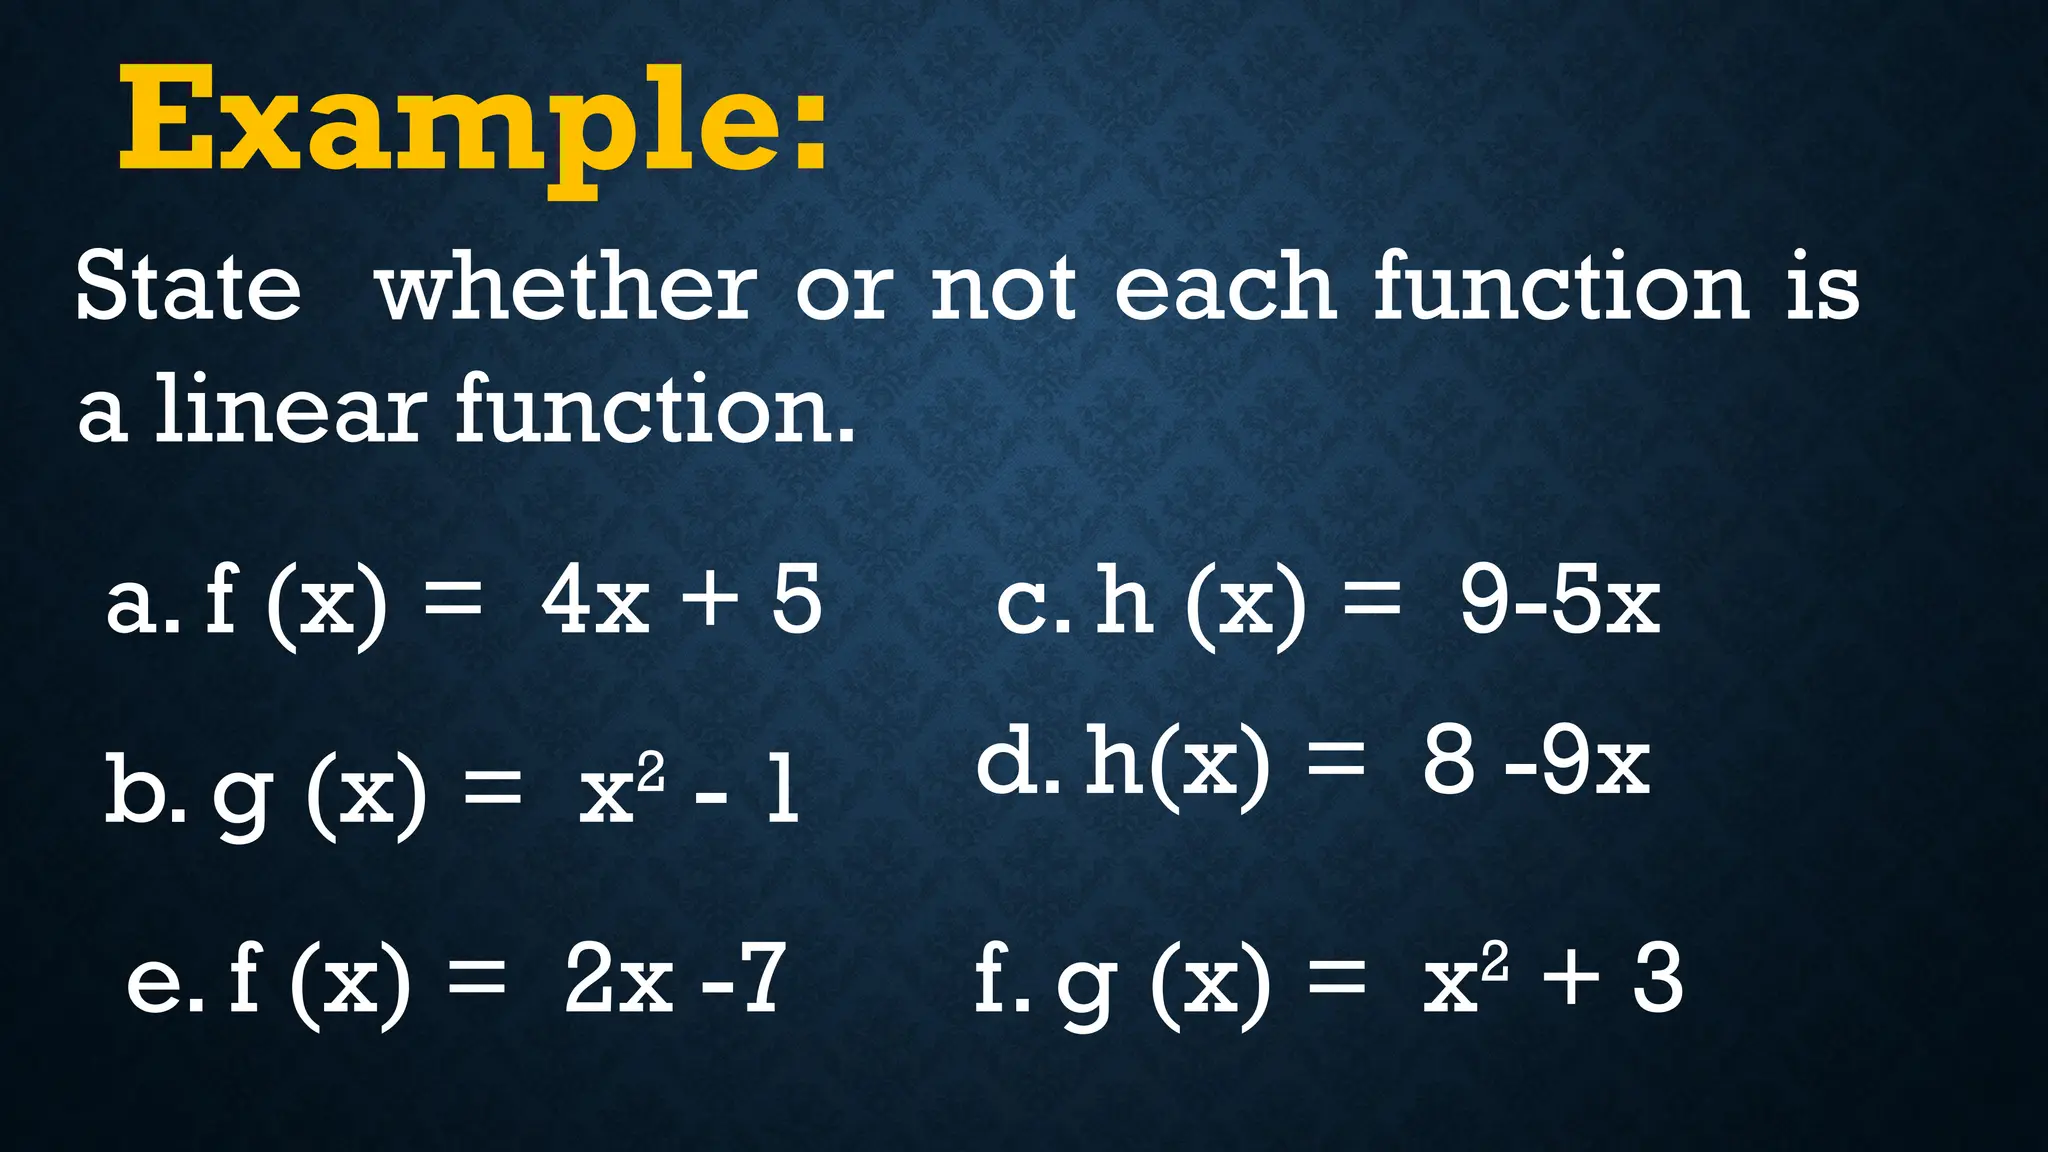
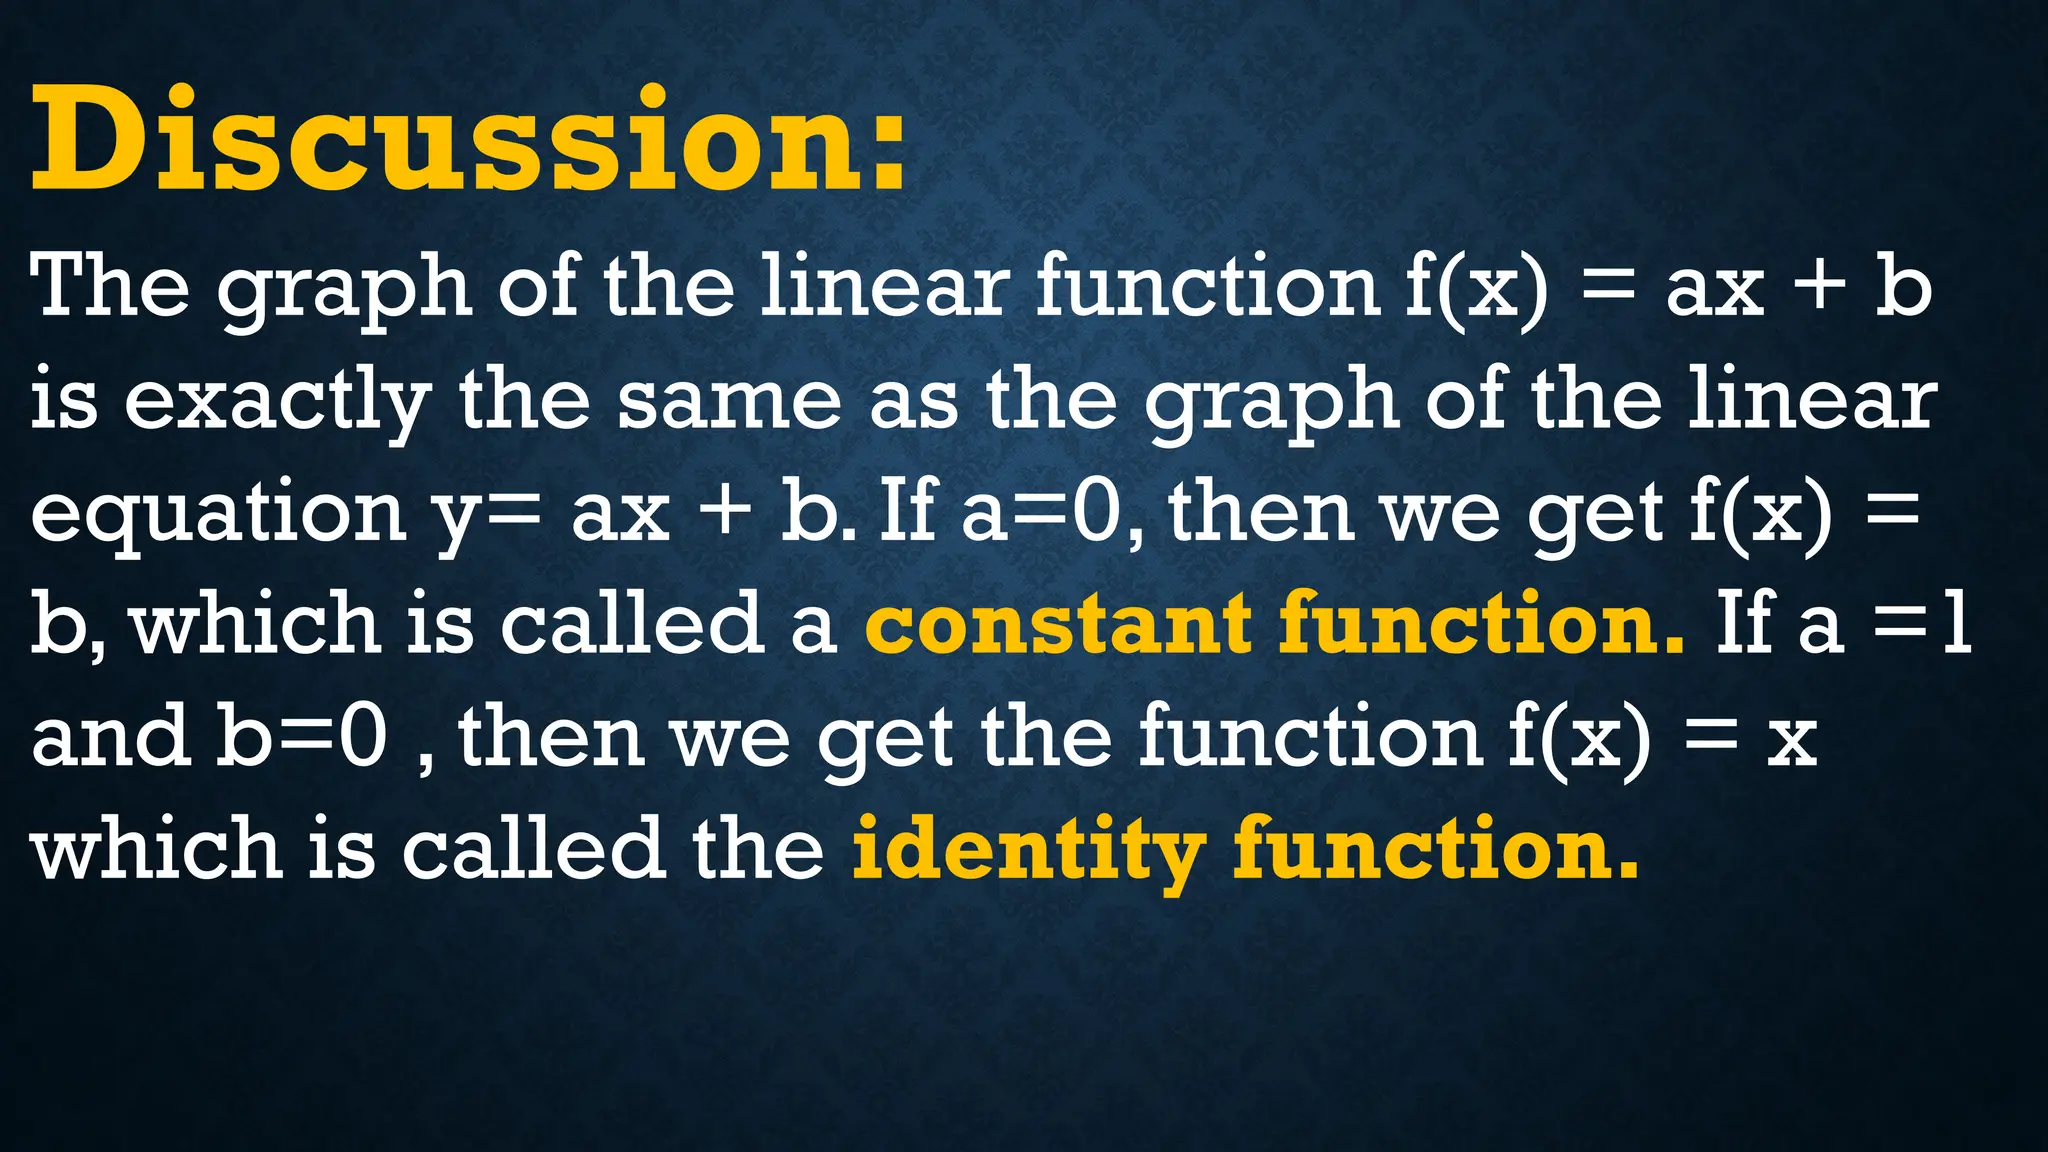
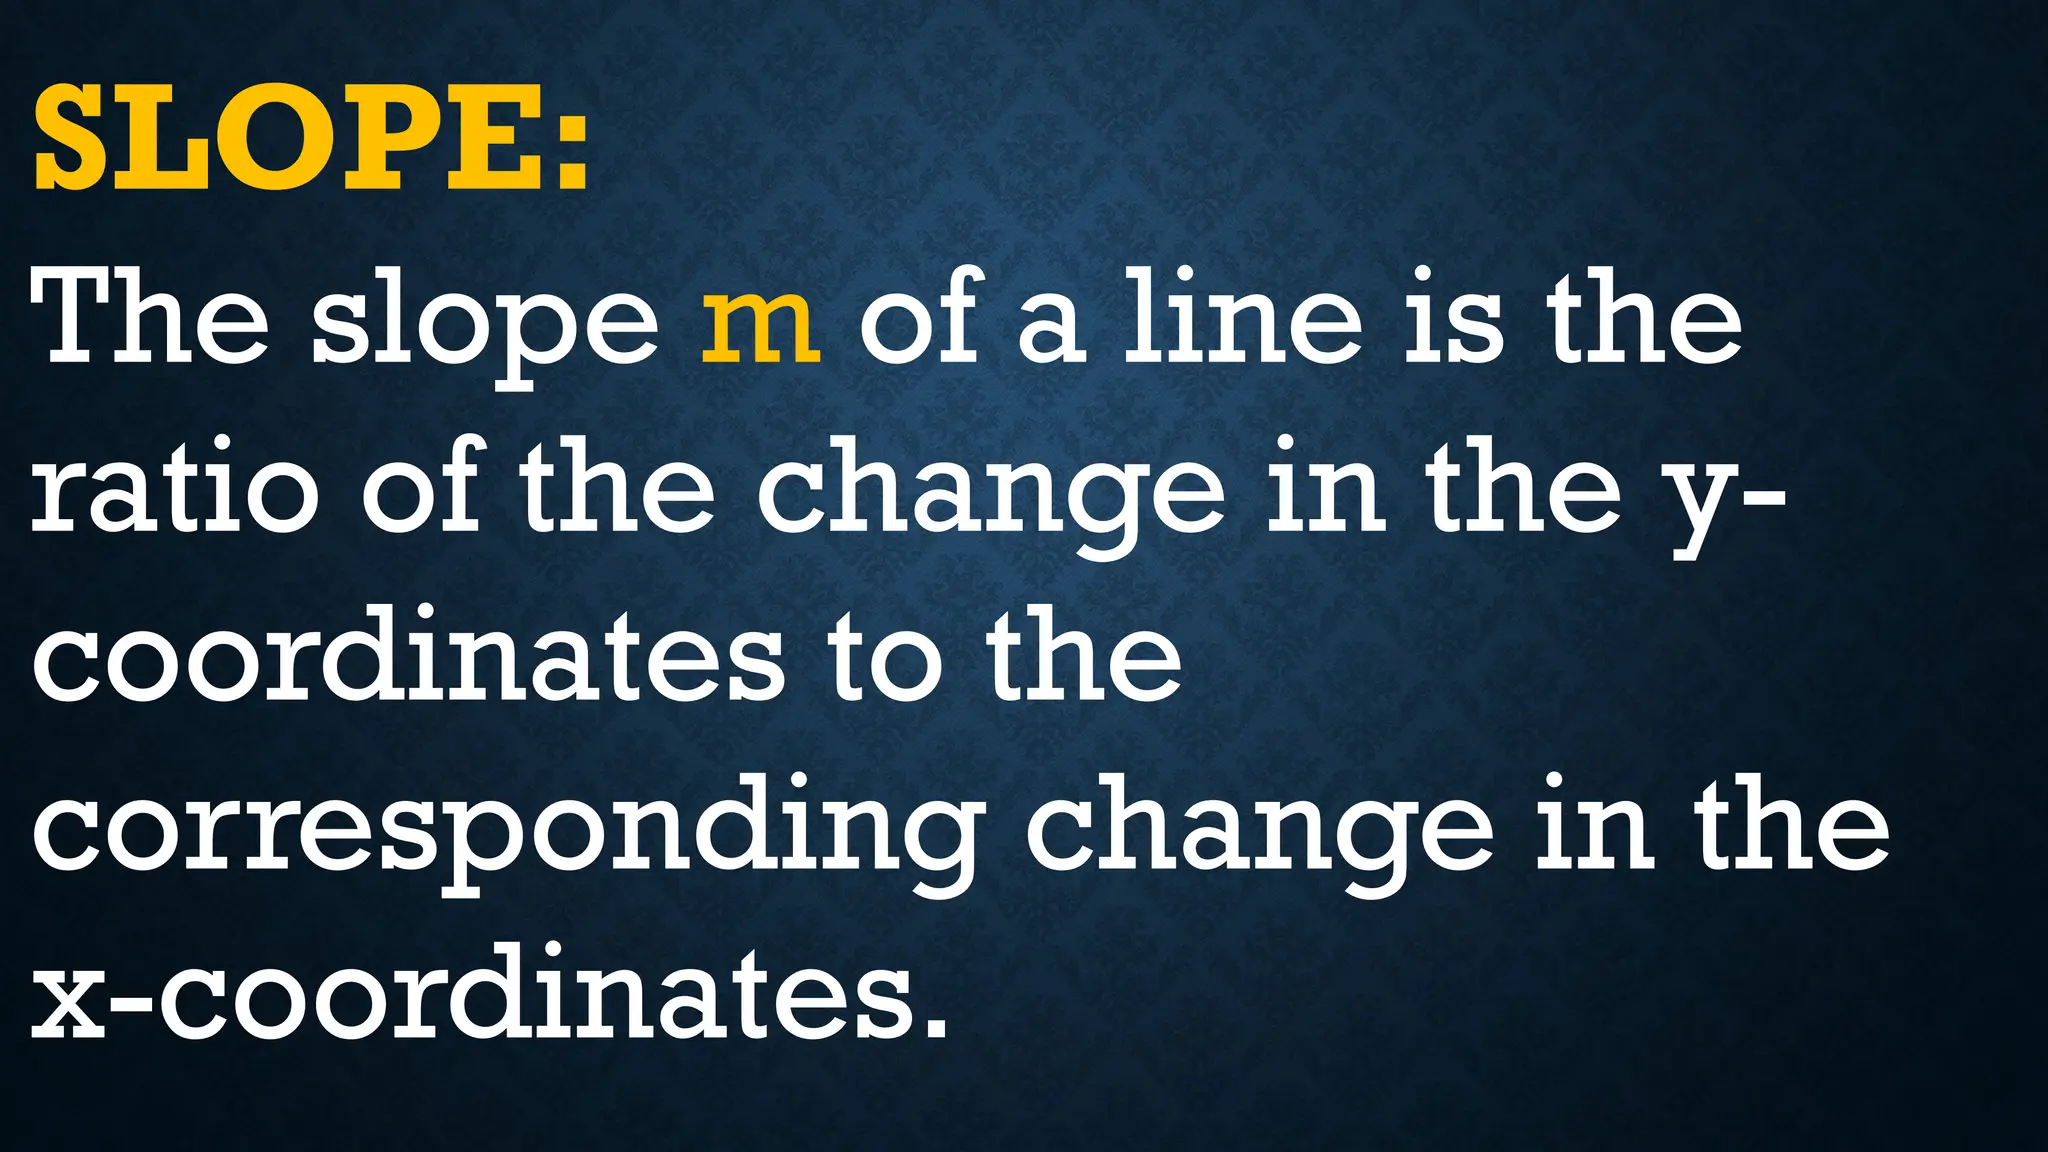
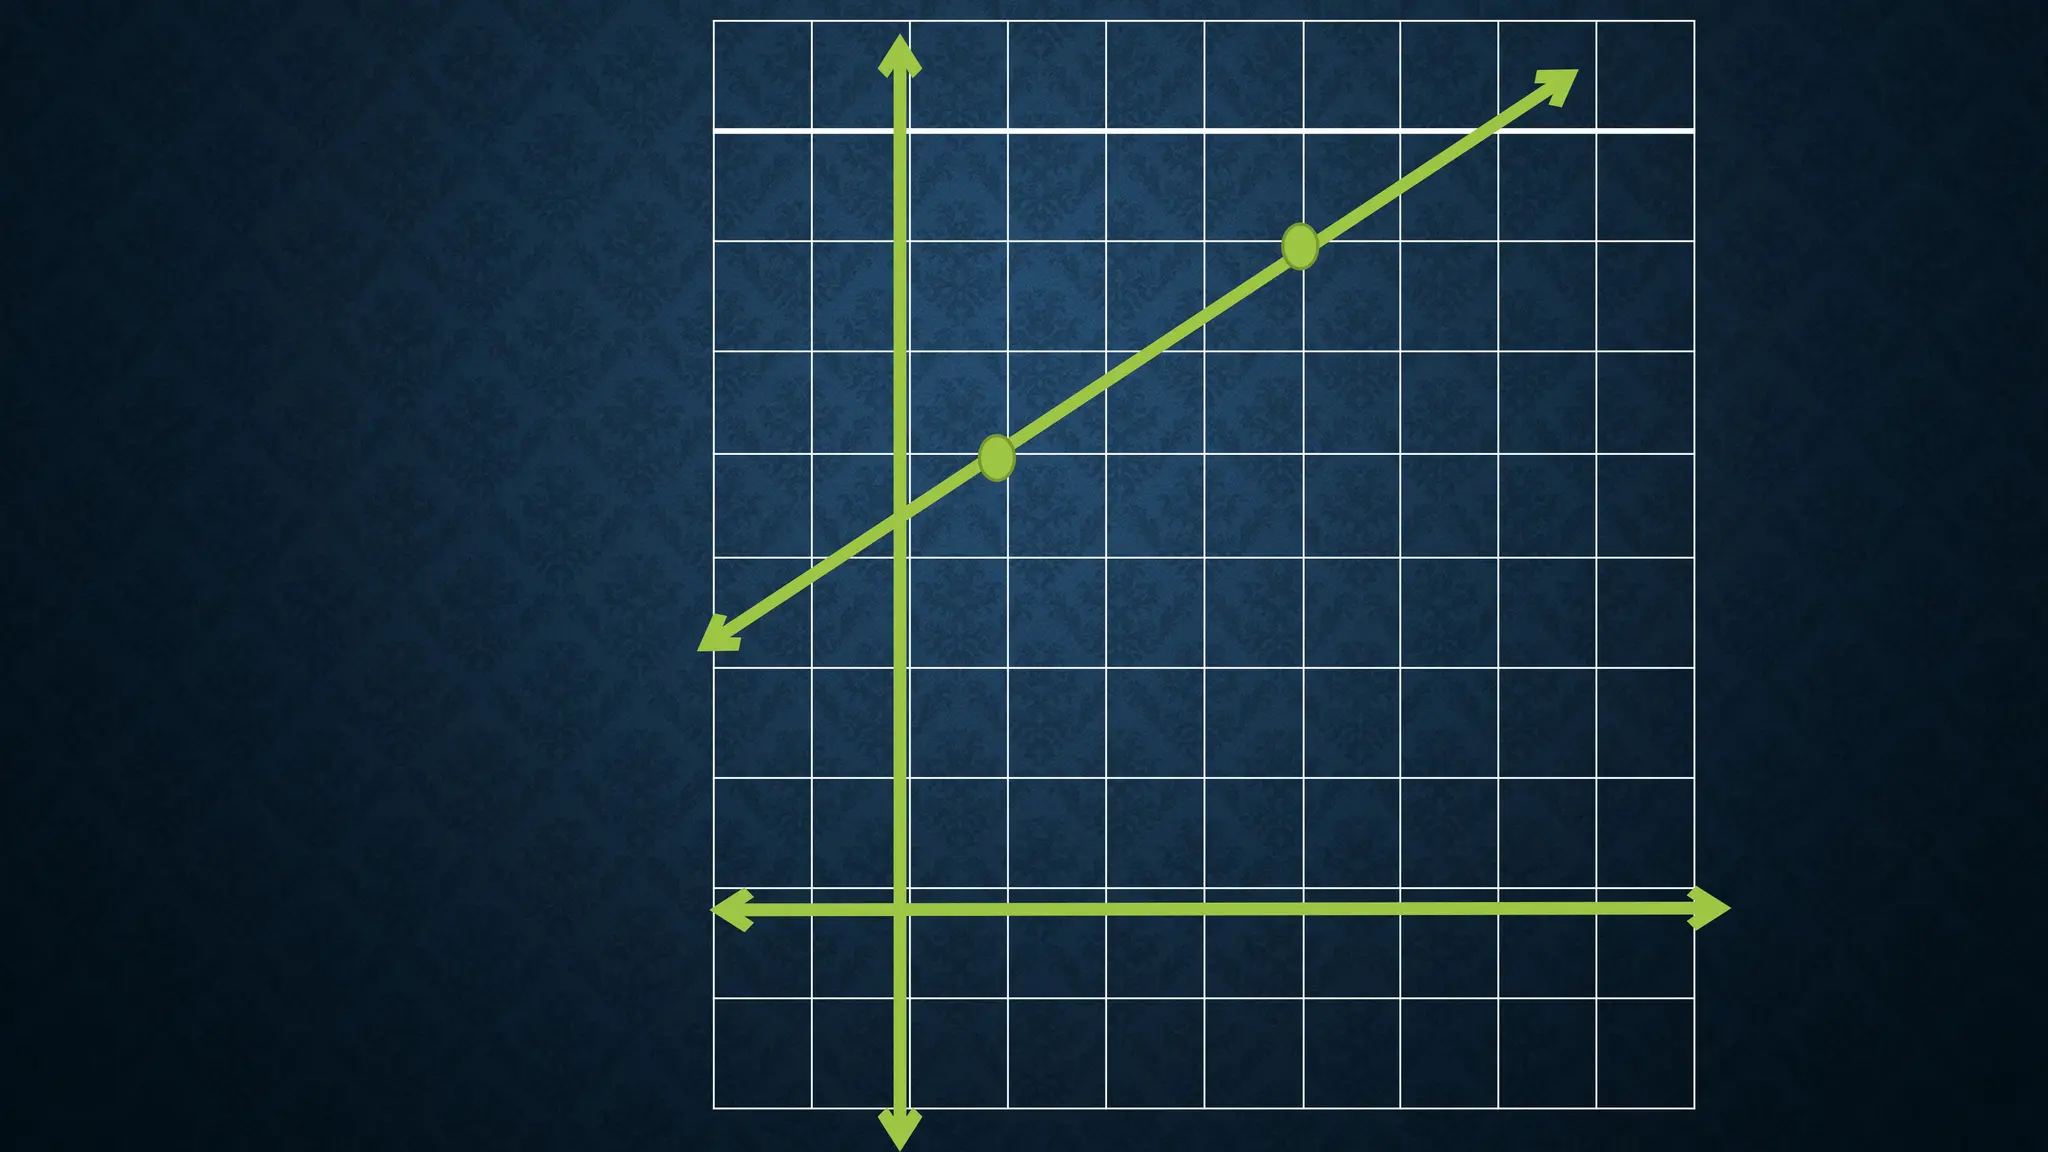
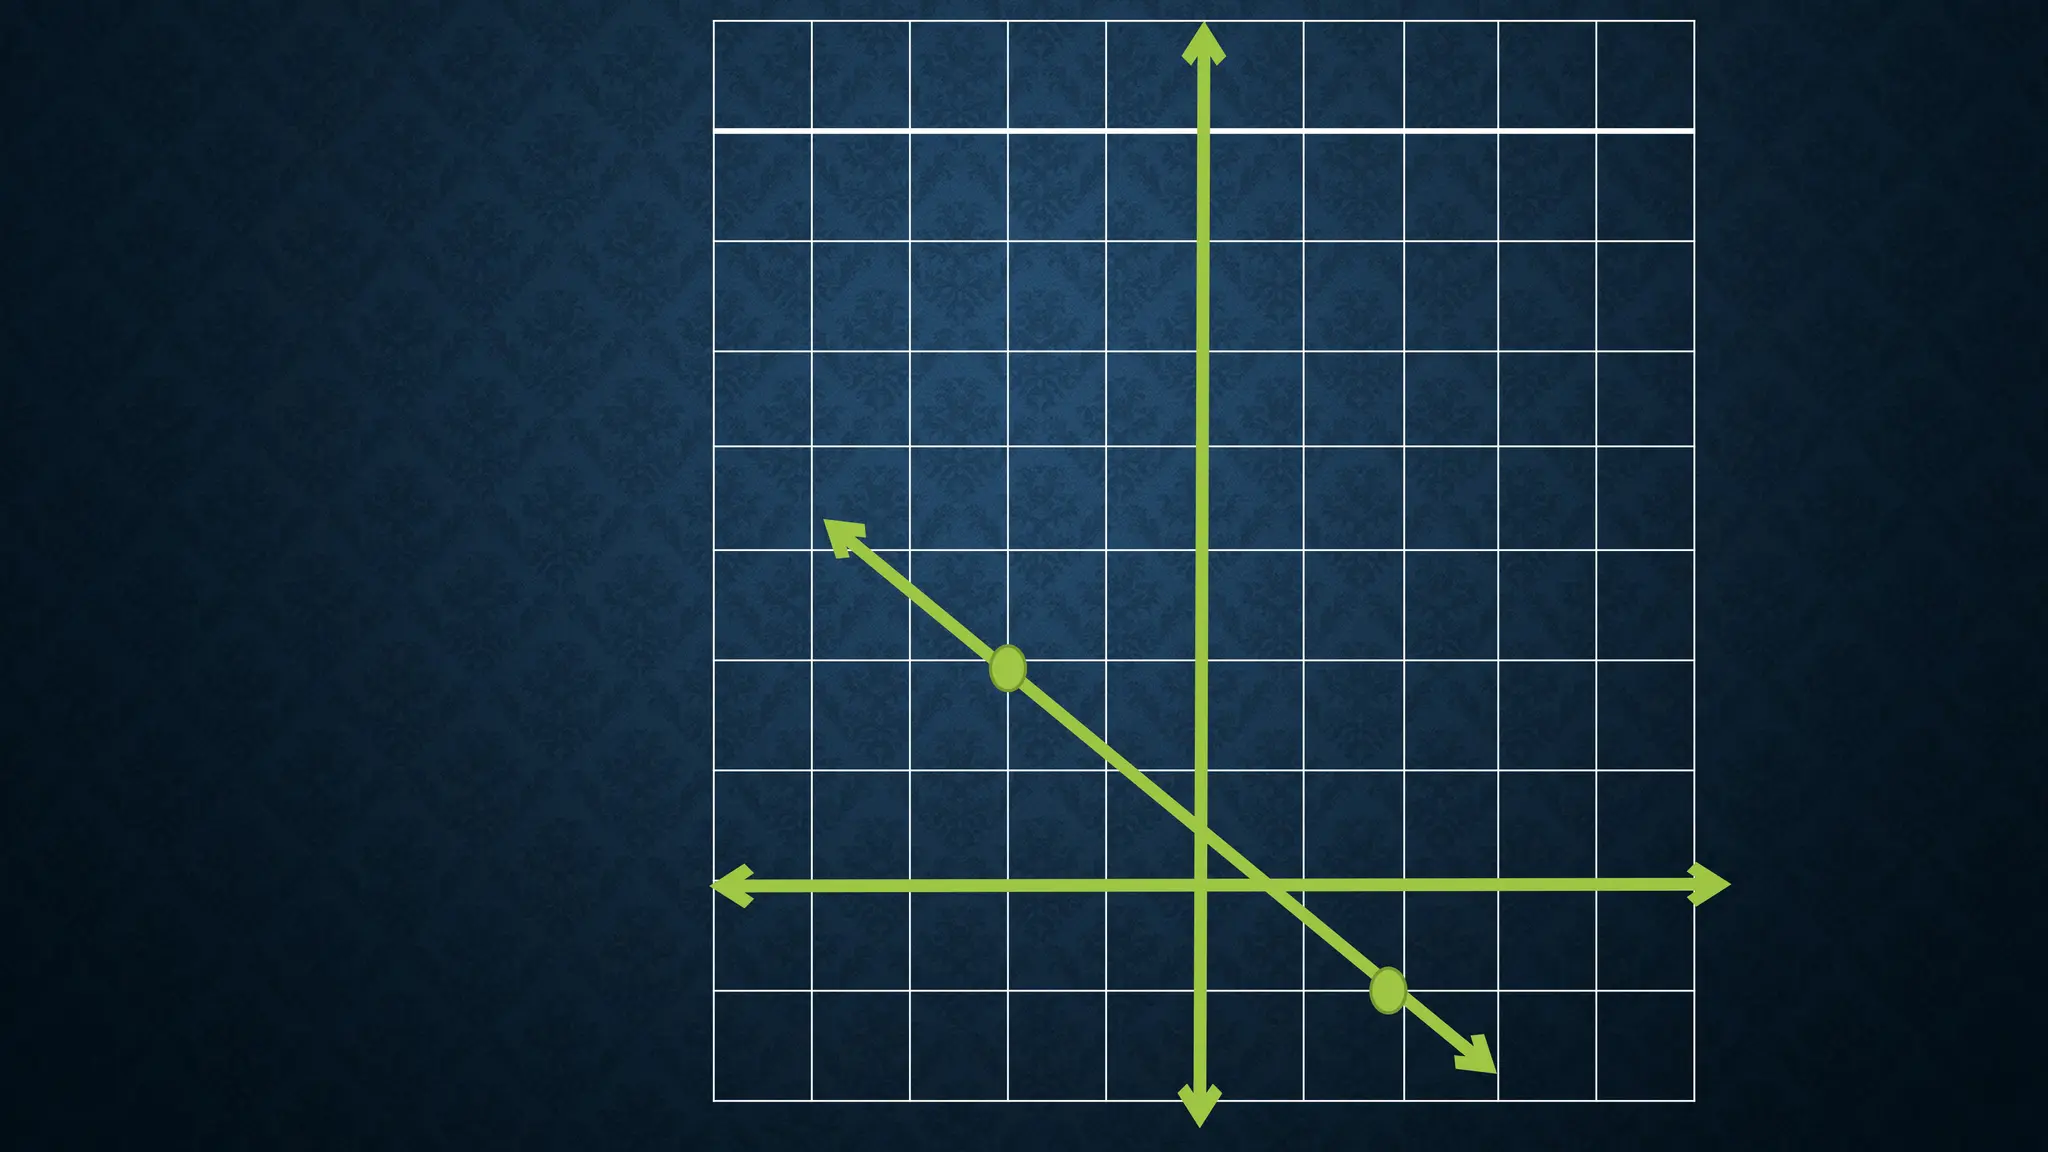
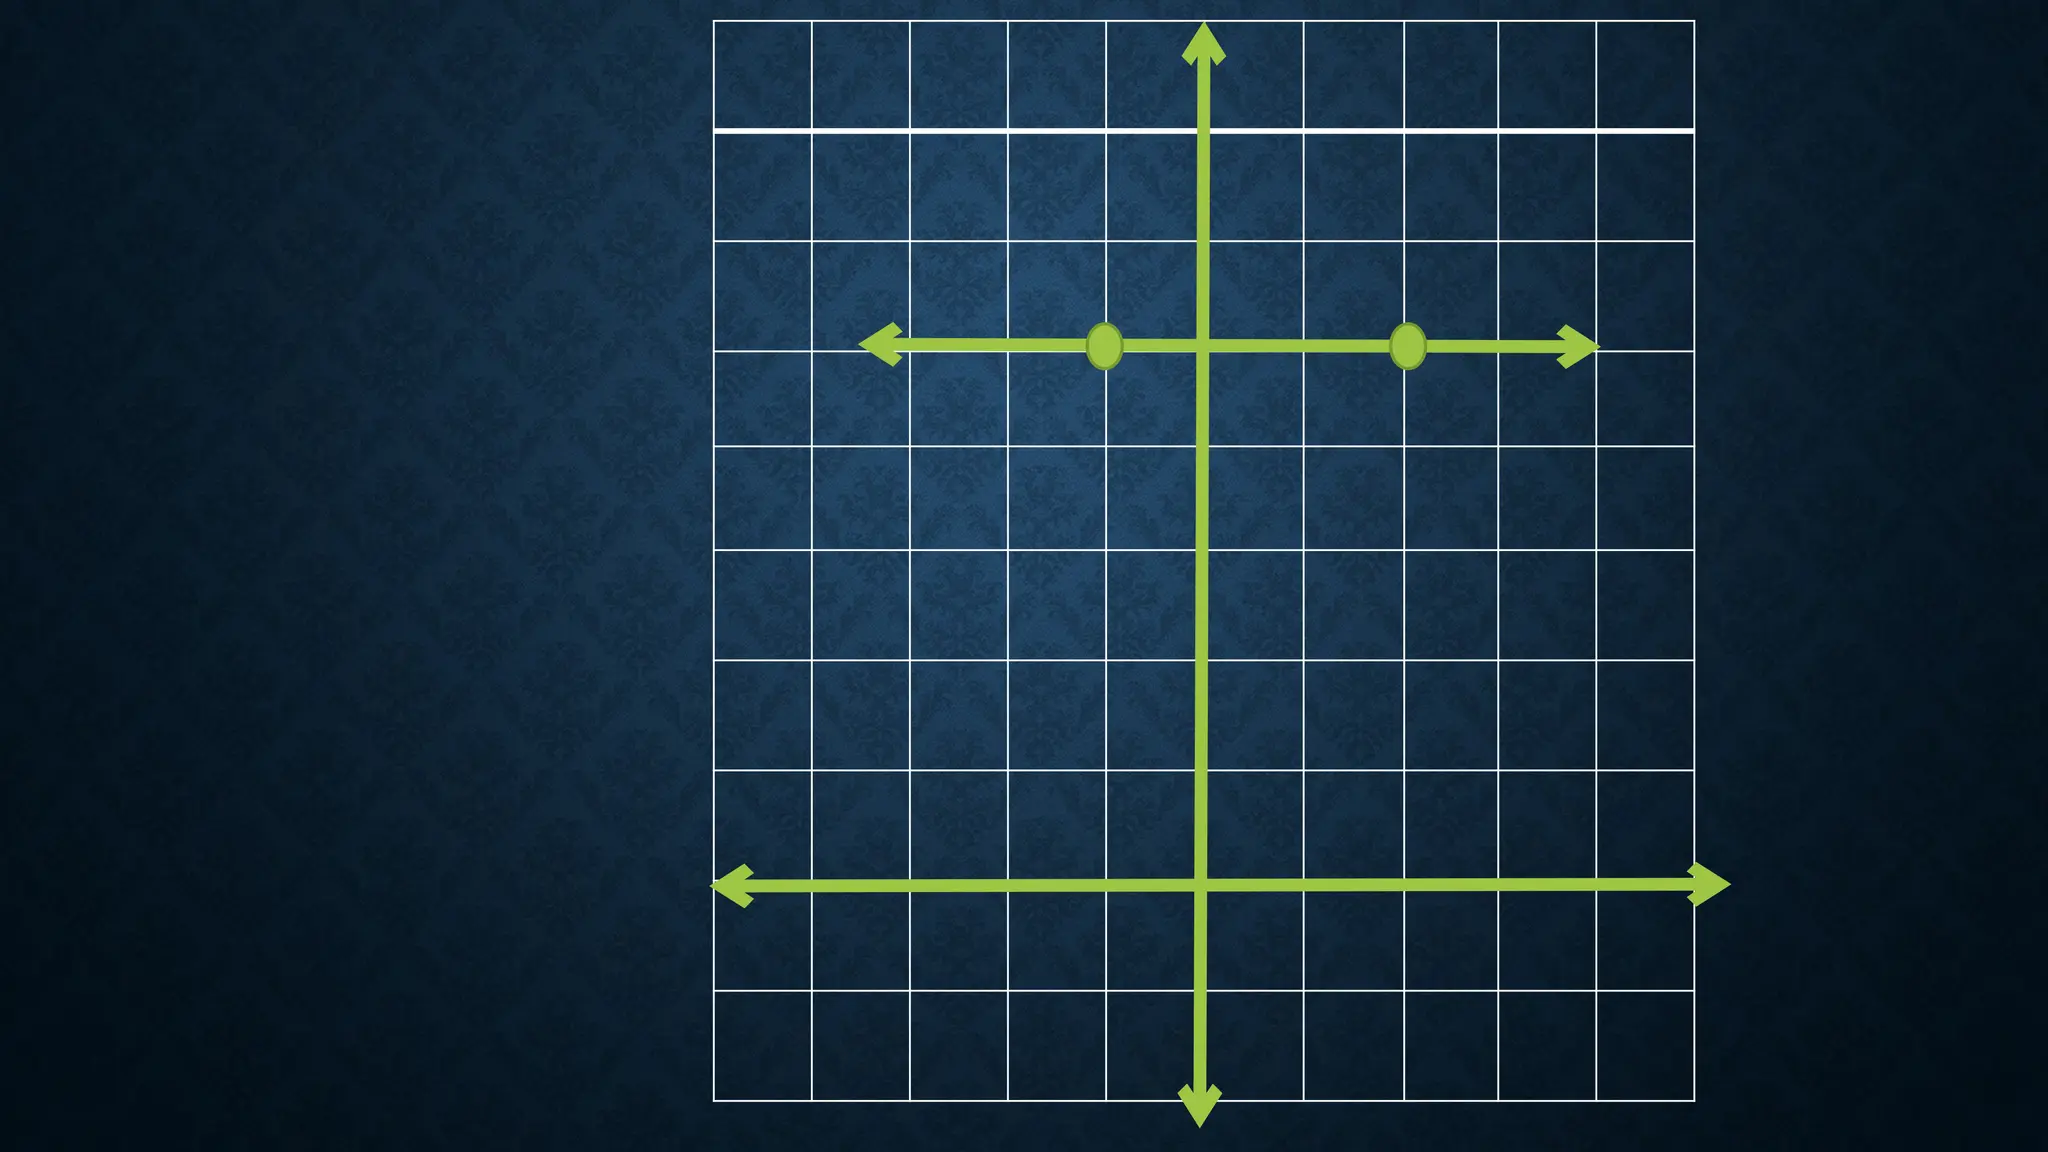
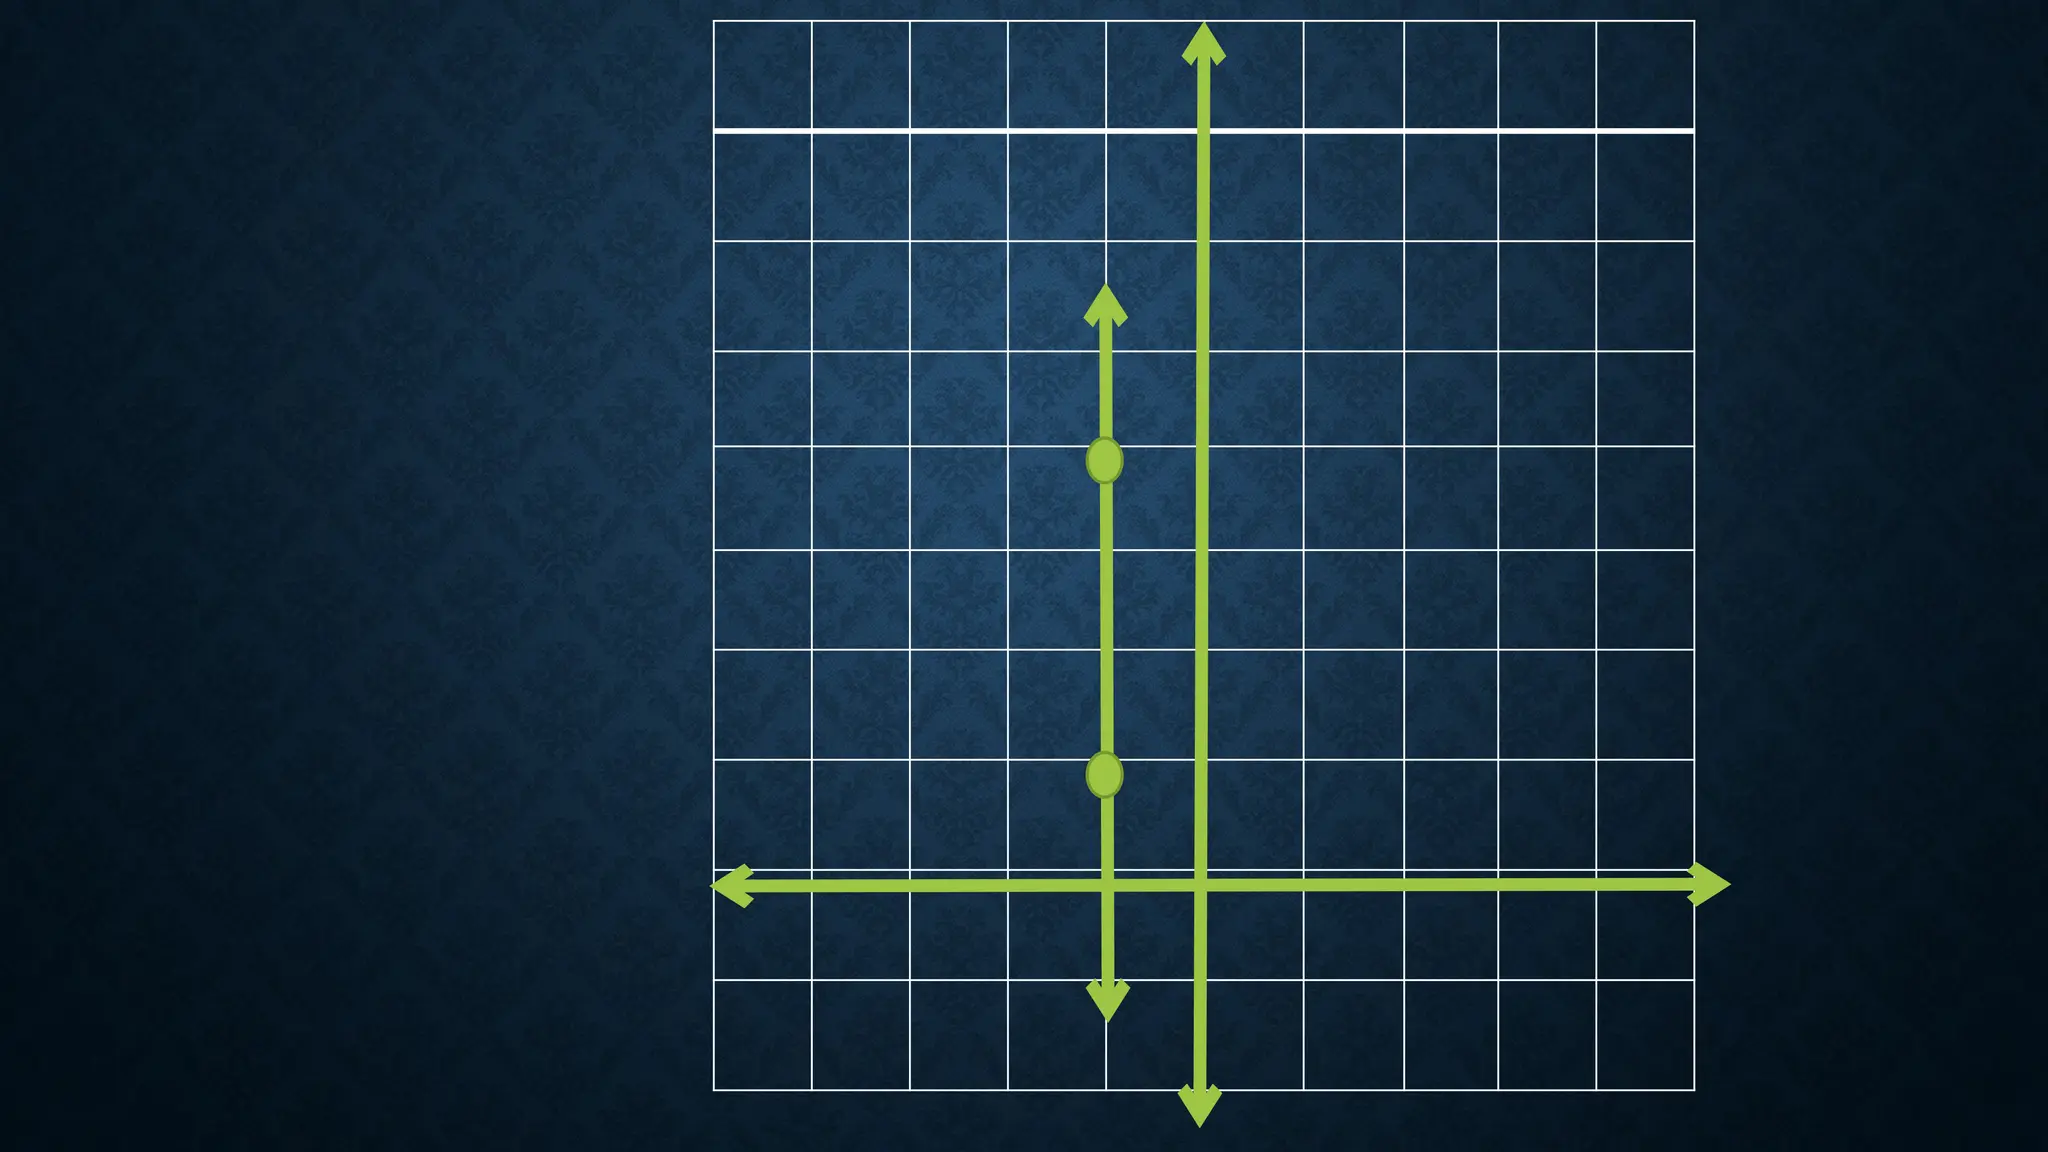
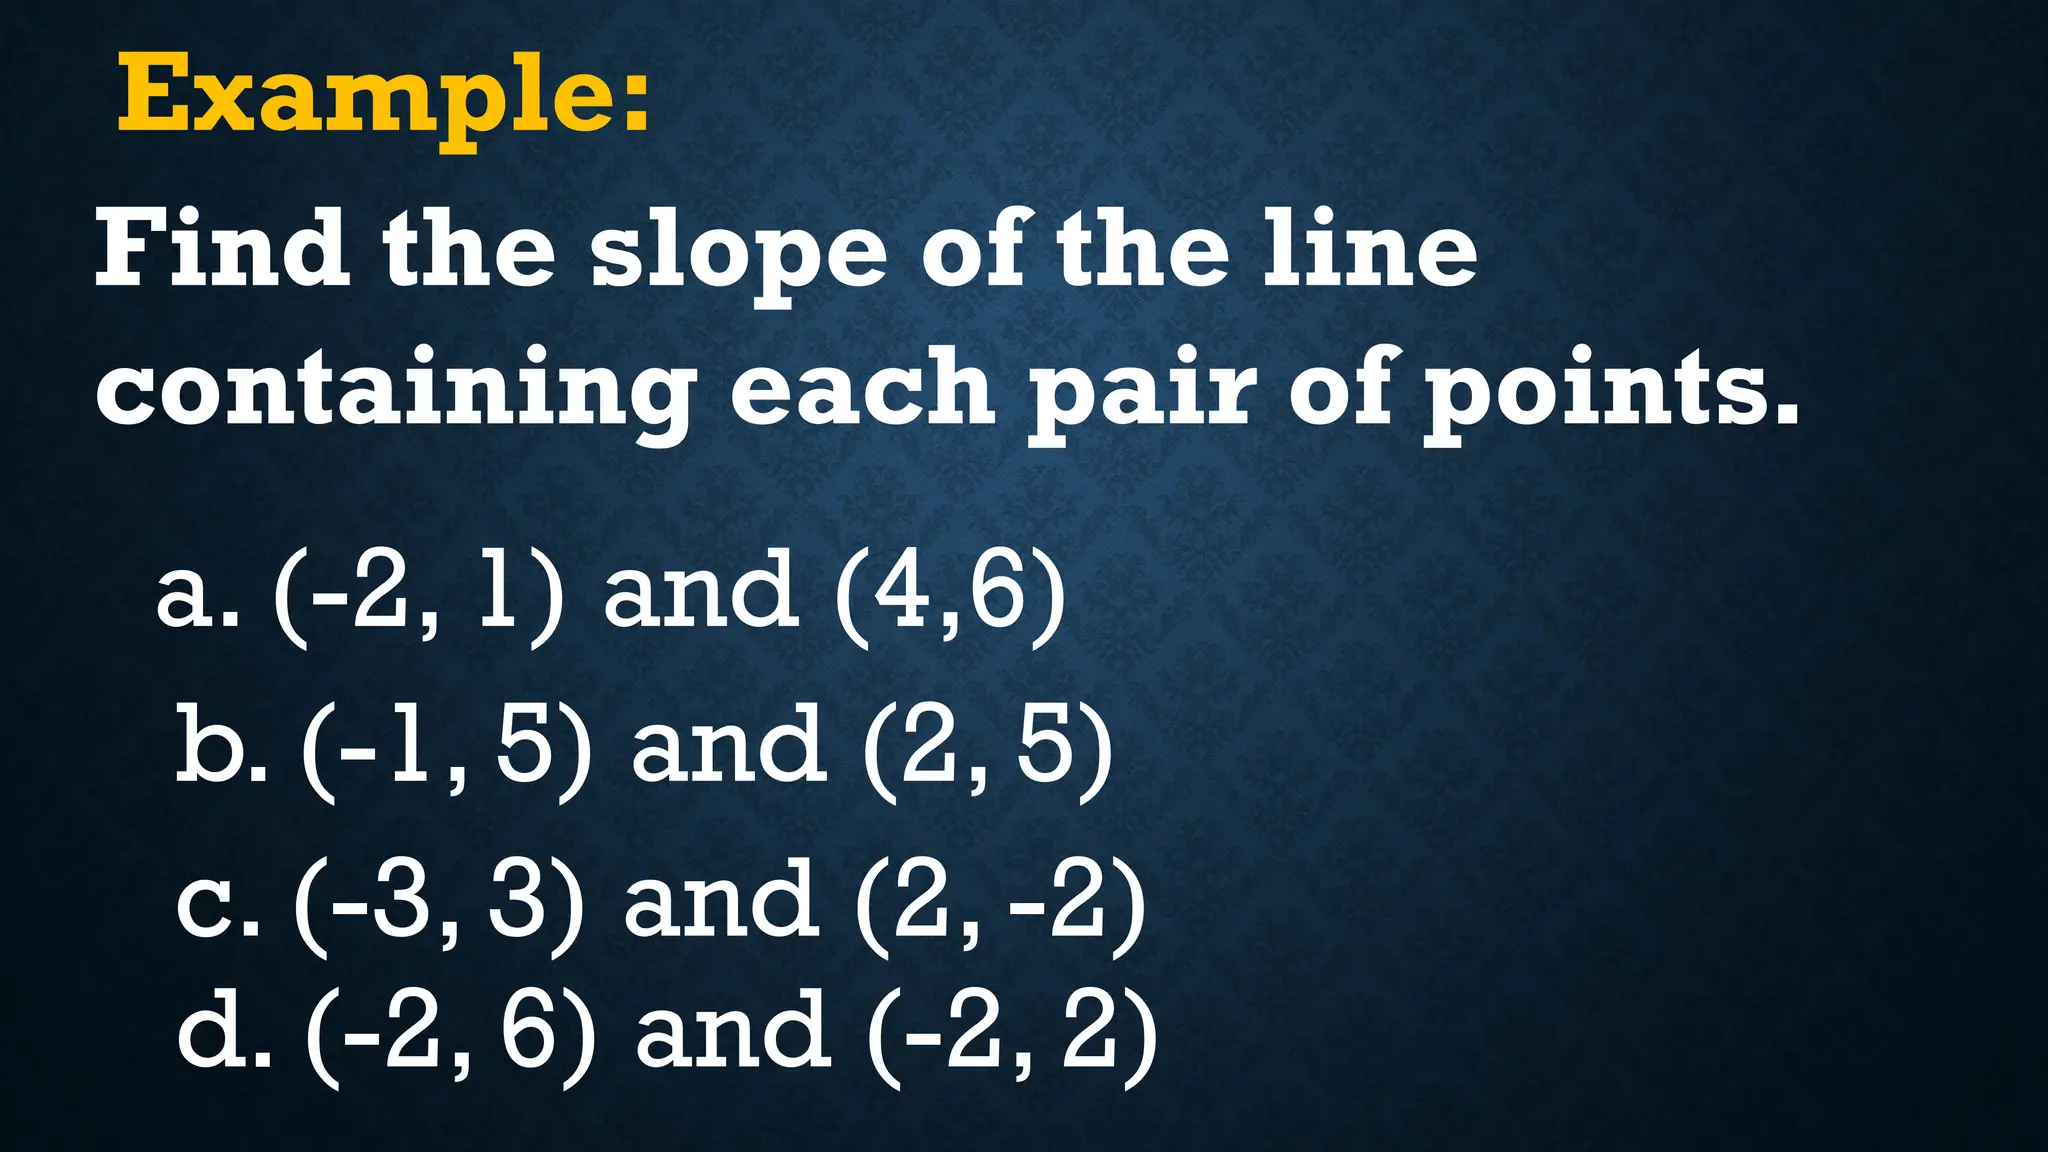
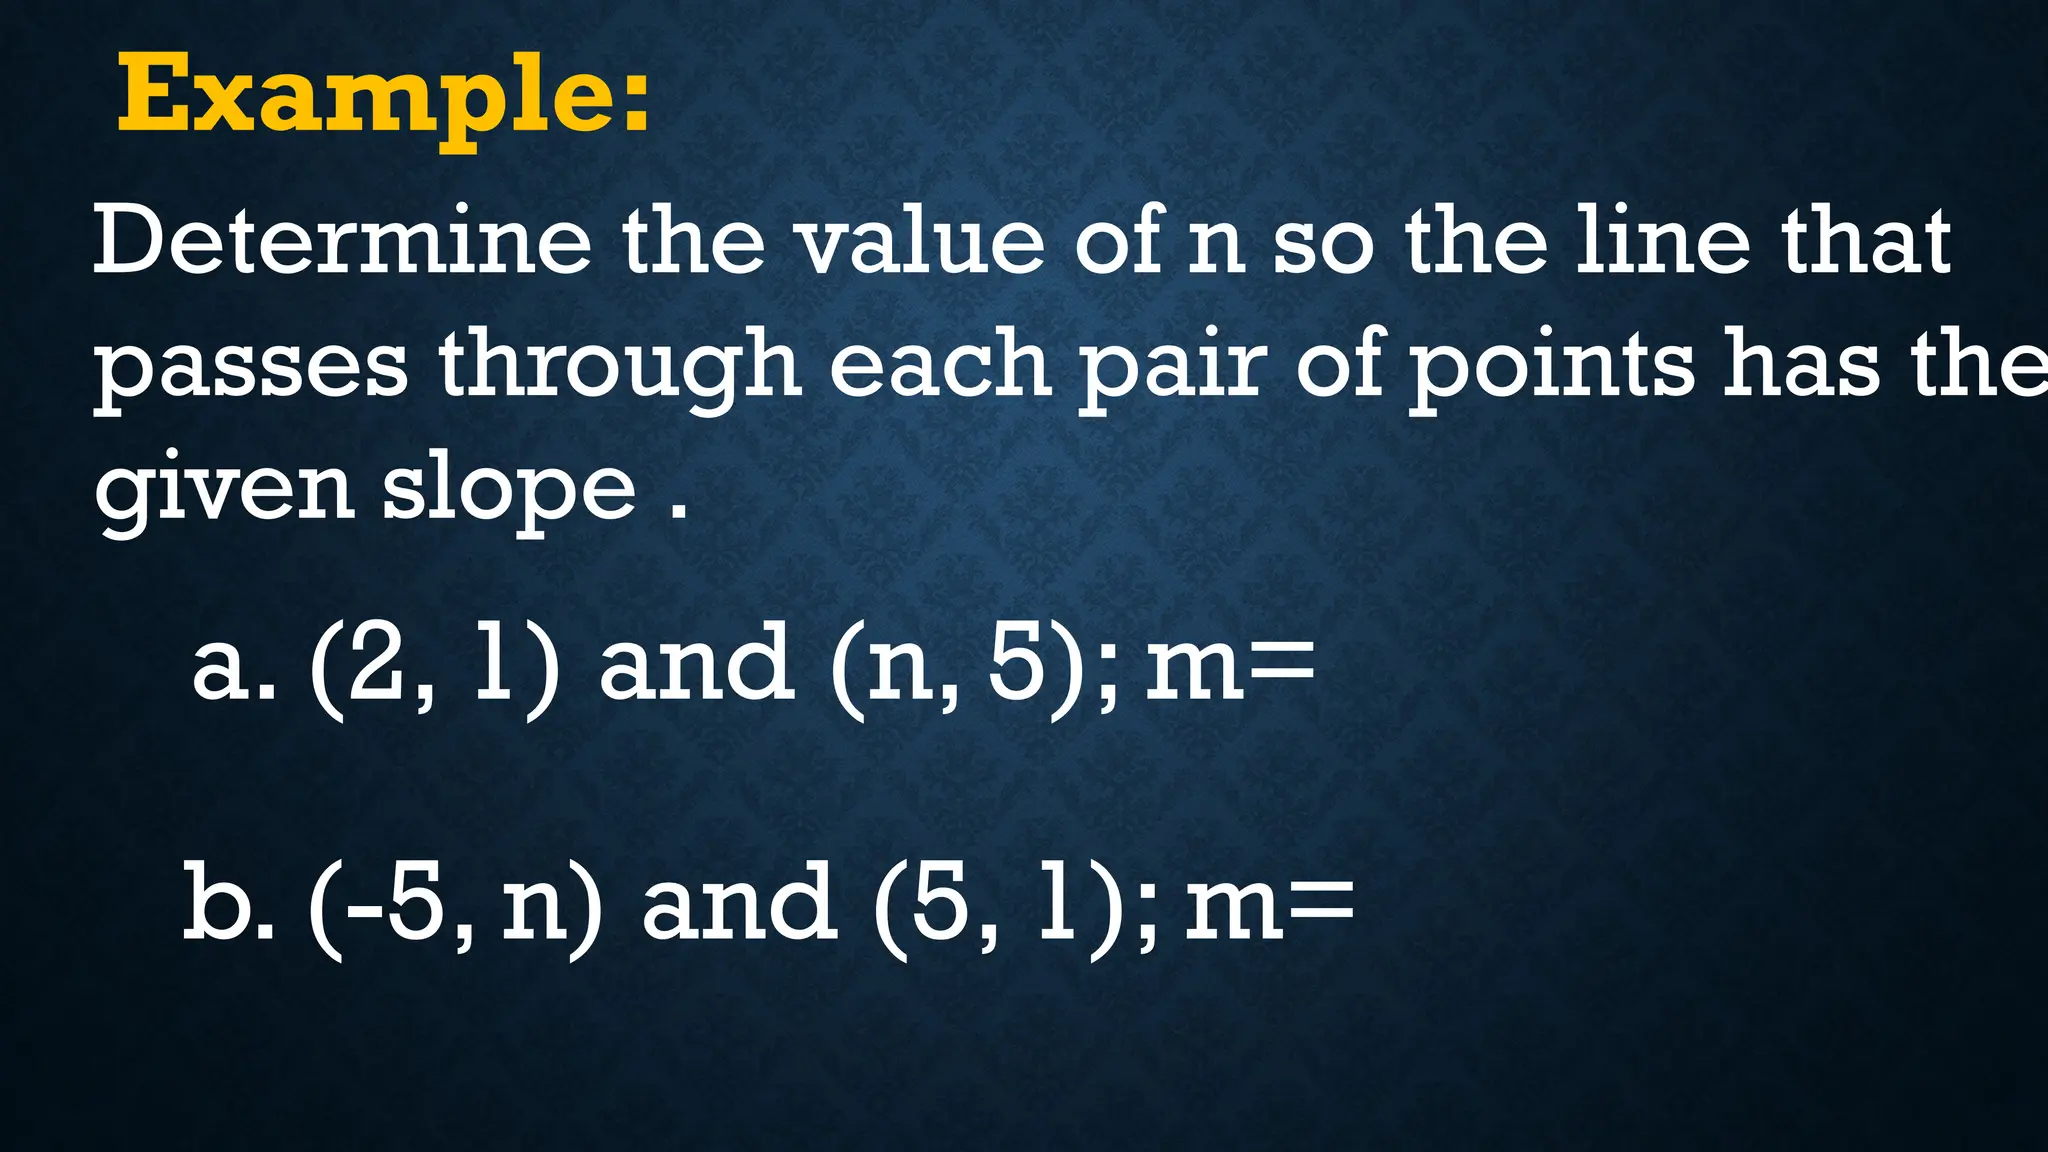
GRAPHING OF LINEAR
EQUATIONS
DEFINITION:
Linear Function
A linear function is a function
whose equation can be written in
the form f(x) = ax + b, where a
and b are real numbers .
Example:
State whether or not each function is
a linear function.
a. f (x) = 4x + 5
b. g (x) = x2
- 1
c. h (x) = 9-5x
d. h(x) = 8 -9x
e. f (x) = 2x -7 f. g (x) = x2
+ 3
Discussion:
The graph of the linear function f(x) = ax + b
is exactly the same as the graph of the linear
equation y= ax + b. If a=0, then we get f(x) =
b, which is called a constant function. If a =1
and b=0 , then we get the function f(x) = x
which is called the identity function.
SLOPE:
The slope m of a line is the
ratio of the change in the y-
coordinates to the
corresponding change in the
x-coordinates.
Note:
1.The graph in a slopes upward
from left to right has a positive
slope.
2.The graph in b slopes
downward from left to right and
has a negative slope.
Note:
3.The graph in c is a horizontal
line and has a slope of zero.
4.The graph in d is a vertical line
and its slope is undefined.
Rule: Determining Slope
If the coordinates of two points on a
line are (x1, y1) and (x2, y2), the slope
m can be found as follows:
𝑚=
𝑦 2− 𝑦 1
𝑥 2− 𝑥 1
, where x1 x2
Example:
Find the slope of the line
containing each pair of points.
a. (-2, 1) and (4,6)
b. (-1, 5) and (2, 5)
c. (-3, 3) and (2, -2)
d. (-2, 6) and (-2, 2)
Example:
Determine the value of n so the line that
passes through each pair of points has the
given slope .
a. (2, 1) and (n, 5); m=
b. (-5, n) and (5, 1); m=

Graph of linear function-mathematics 8.pptx

  • 1.
  • 2.
    DEFINITION: Linear Function A linearfunction is a function whose equation can be written in the form f(x) = ax + b, where a and b are real numbers .
  • 3.
    Example: State whether ornot each function is a linear function. a. f (x) = 4x + 5 b. g (x) = x2 - 1 c. h (x) = 9-5x d. h(x) = 8 -9x e. f (x) = 2x -7 f. g (x) = x2 + 3
  • 4.
    Discussion: The graph ofthe linear function f(x) = ax + b is exactly the same as the graph of the linear equation y= ax + b. If a=0, then we get f(x) = b, which is called a constant function. If a =1 and b=0 , then we get the function f(x) = x which is called the identity function.
  • 5.
    SLOPE: The slope mof a line is the ratio of the change in the y- coordinates to the corresponding change in the x-coordinates.
  • 10.
    Note: 1.The graph ina slopes upward from left to right has a positive slope. 2.The graph in b slopes downward from left to right and has a negative slope.
  • 11.
    Note: 3.The graph inc is a horizontal line and has a slope of zero. 4.The graph in d is a vertical line and its slope is undefined.
  • 12.
    Rule: Determining Slope Ifthe coordinates of two points on a line are (x1, y1) and (x2, y2), the slope m can be found as follows: 𝑚= 𝑦 2− 𝑦 1 𝑥 2− 𝑥 1 , where x1 x2
  • 13.
    Example: Find the slopeof the line containing each pair of points. a. (-2, 1) and (4,6) b. (-1, 5) and (2, 5) c. (-3, 3) and (2, -2) d. (-2, 6) and (-2, 2)
  • 14.
    Example: Determine the valueof n so the line that passes through each pair of points has the given slope . a. (2, 1) and (n, 5); m= b. (-5, n) and (5, 1); m=