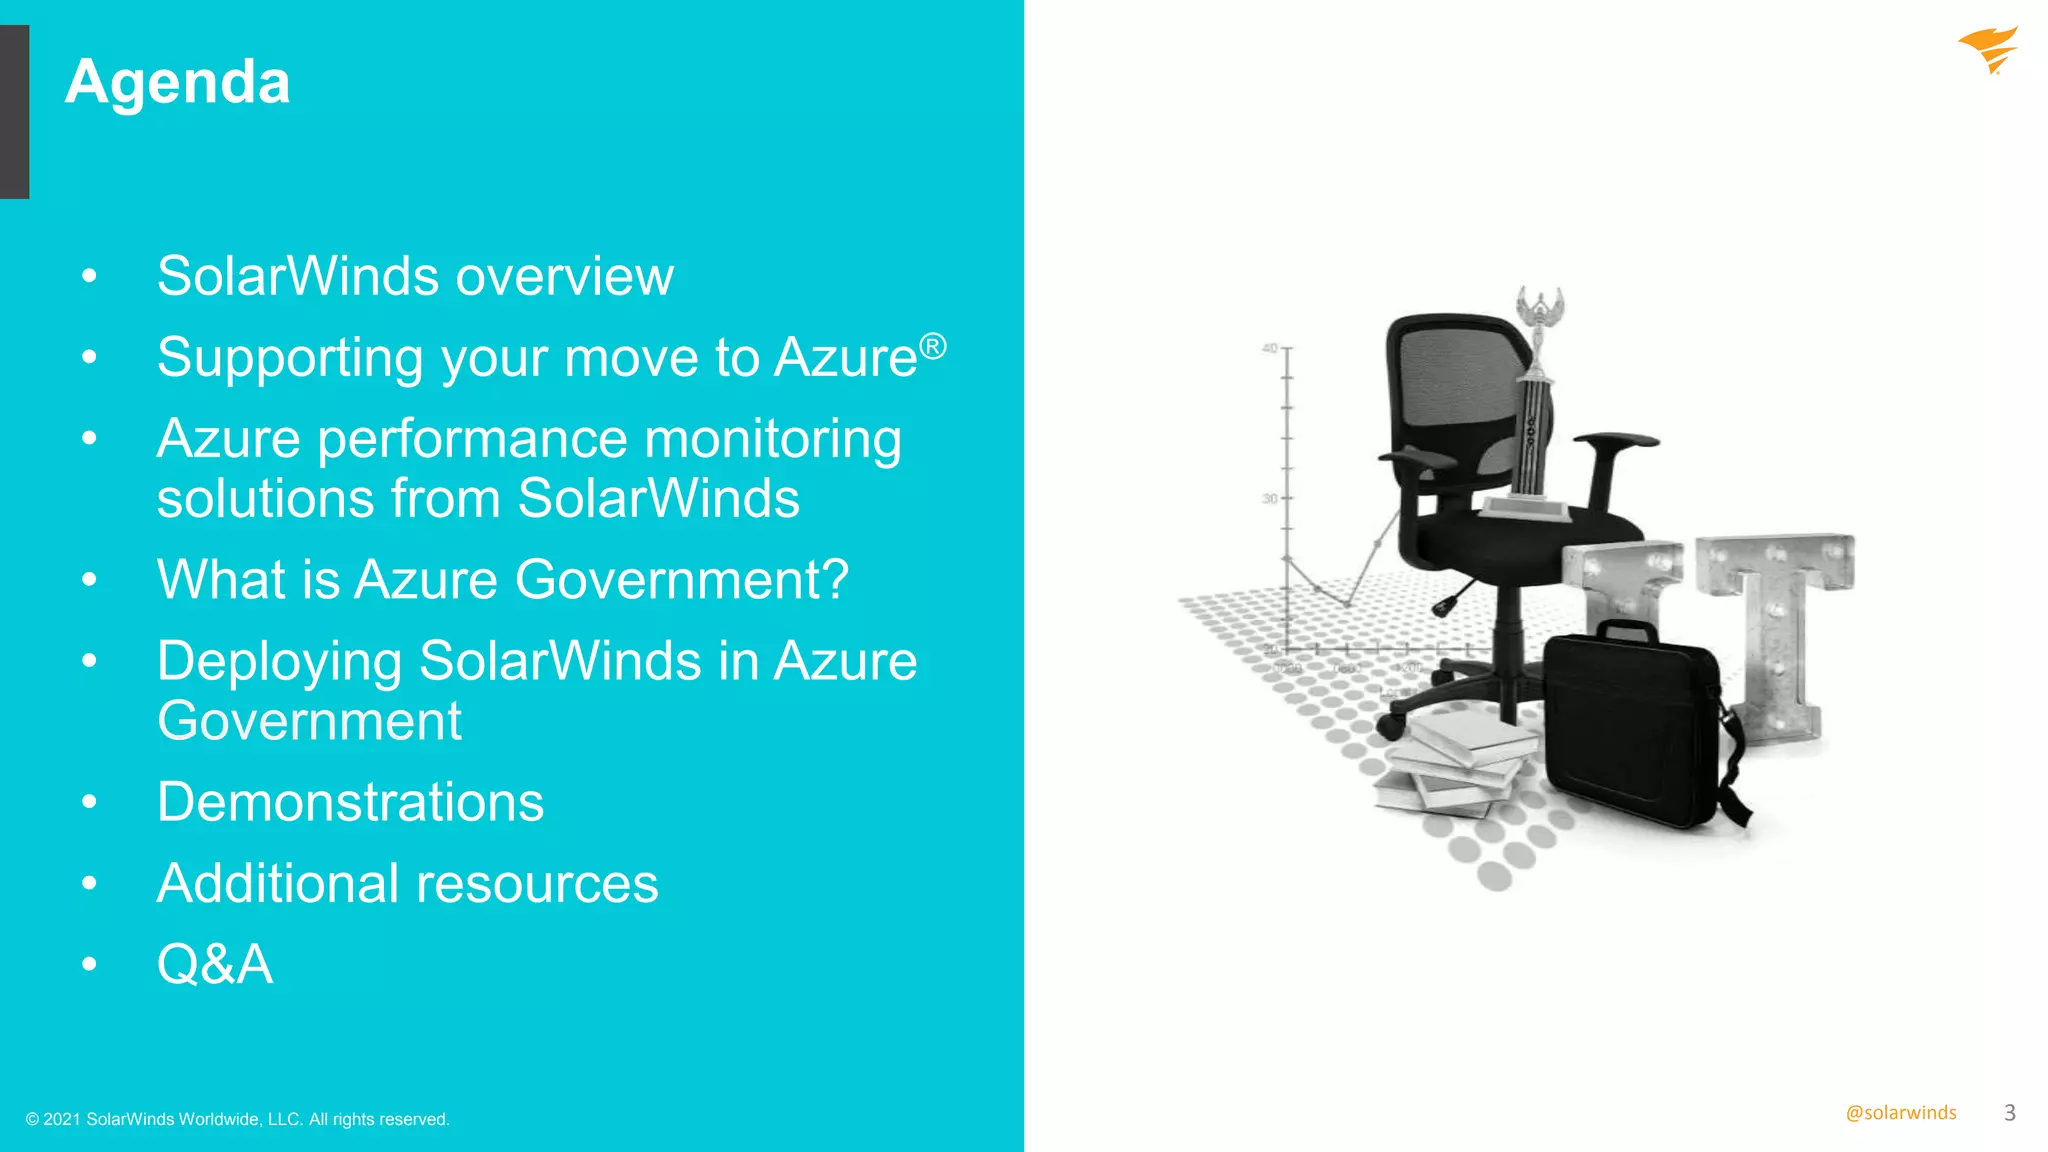
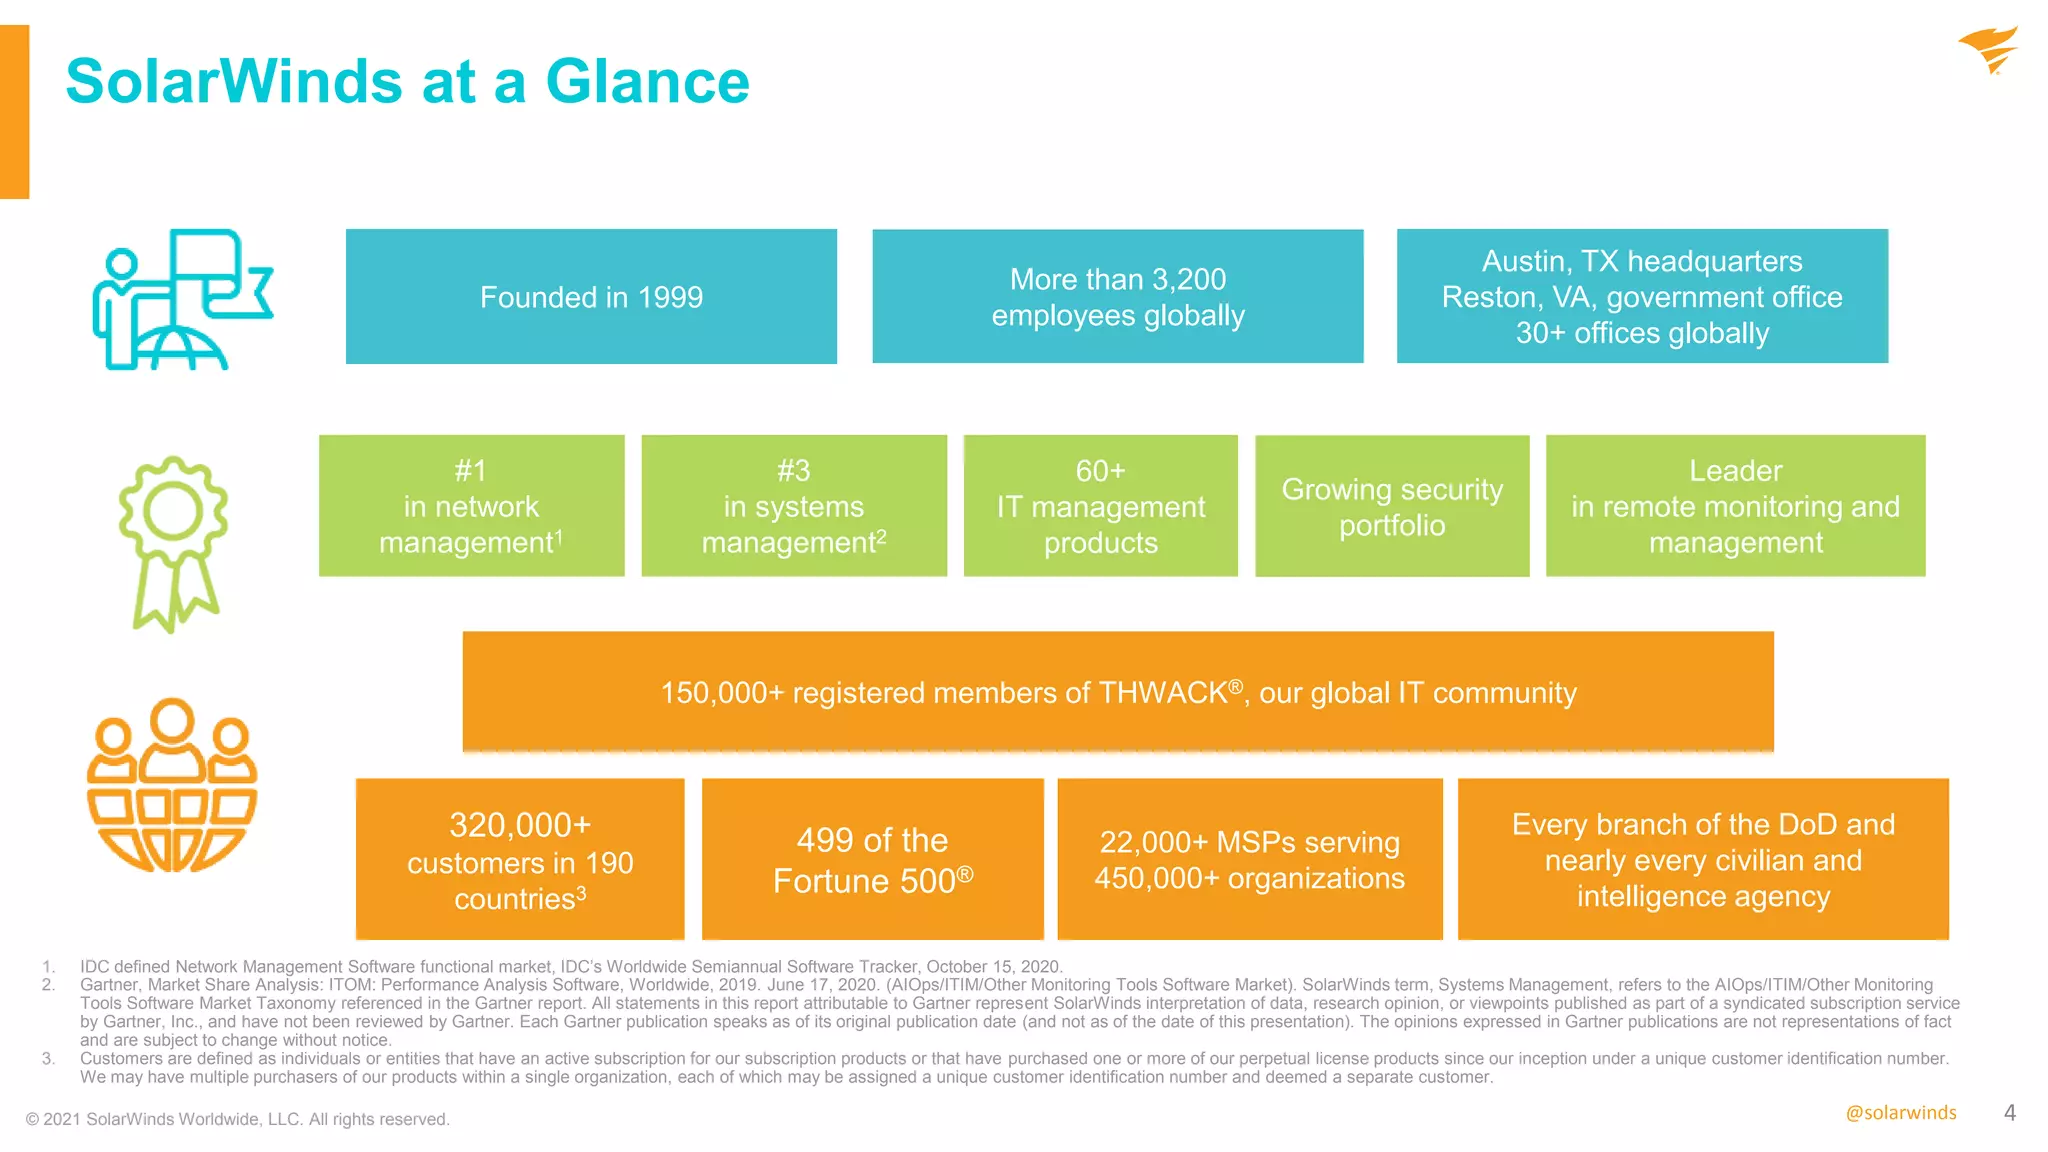
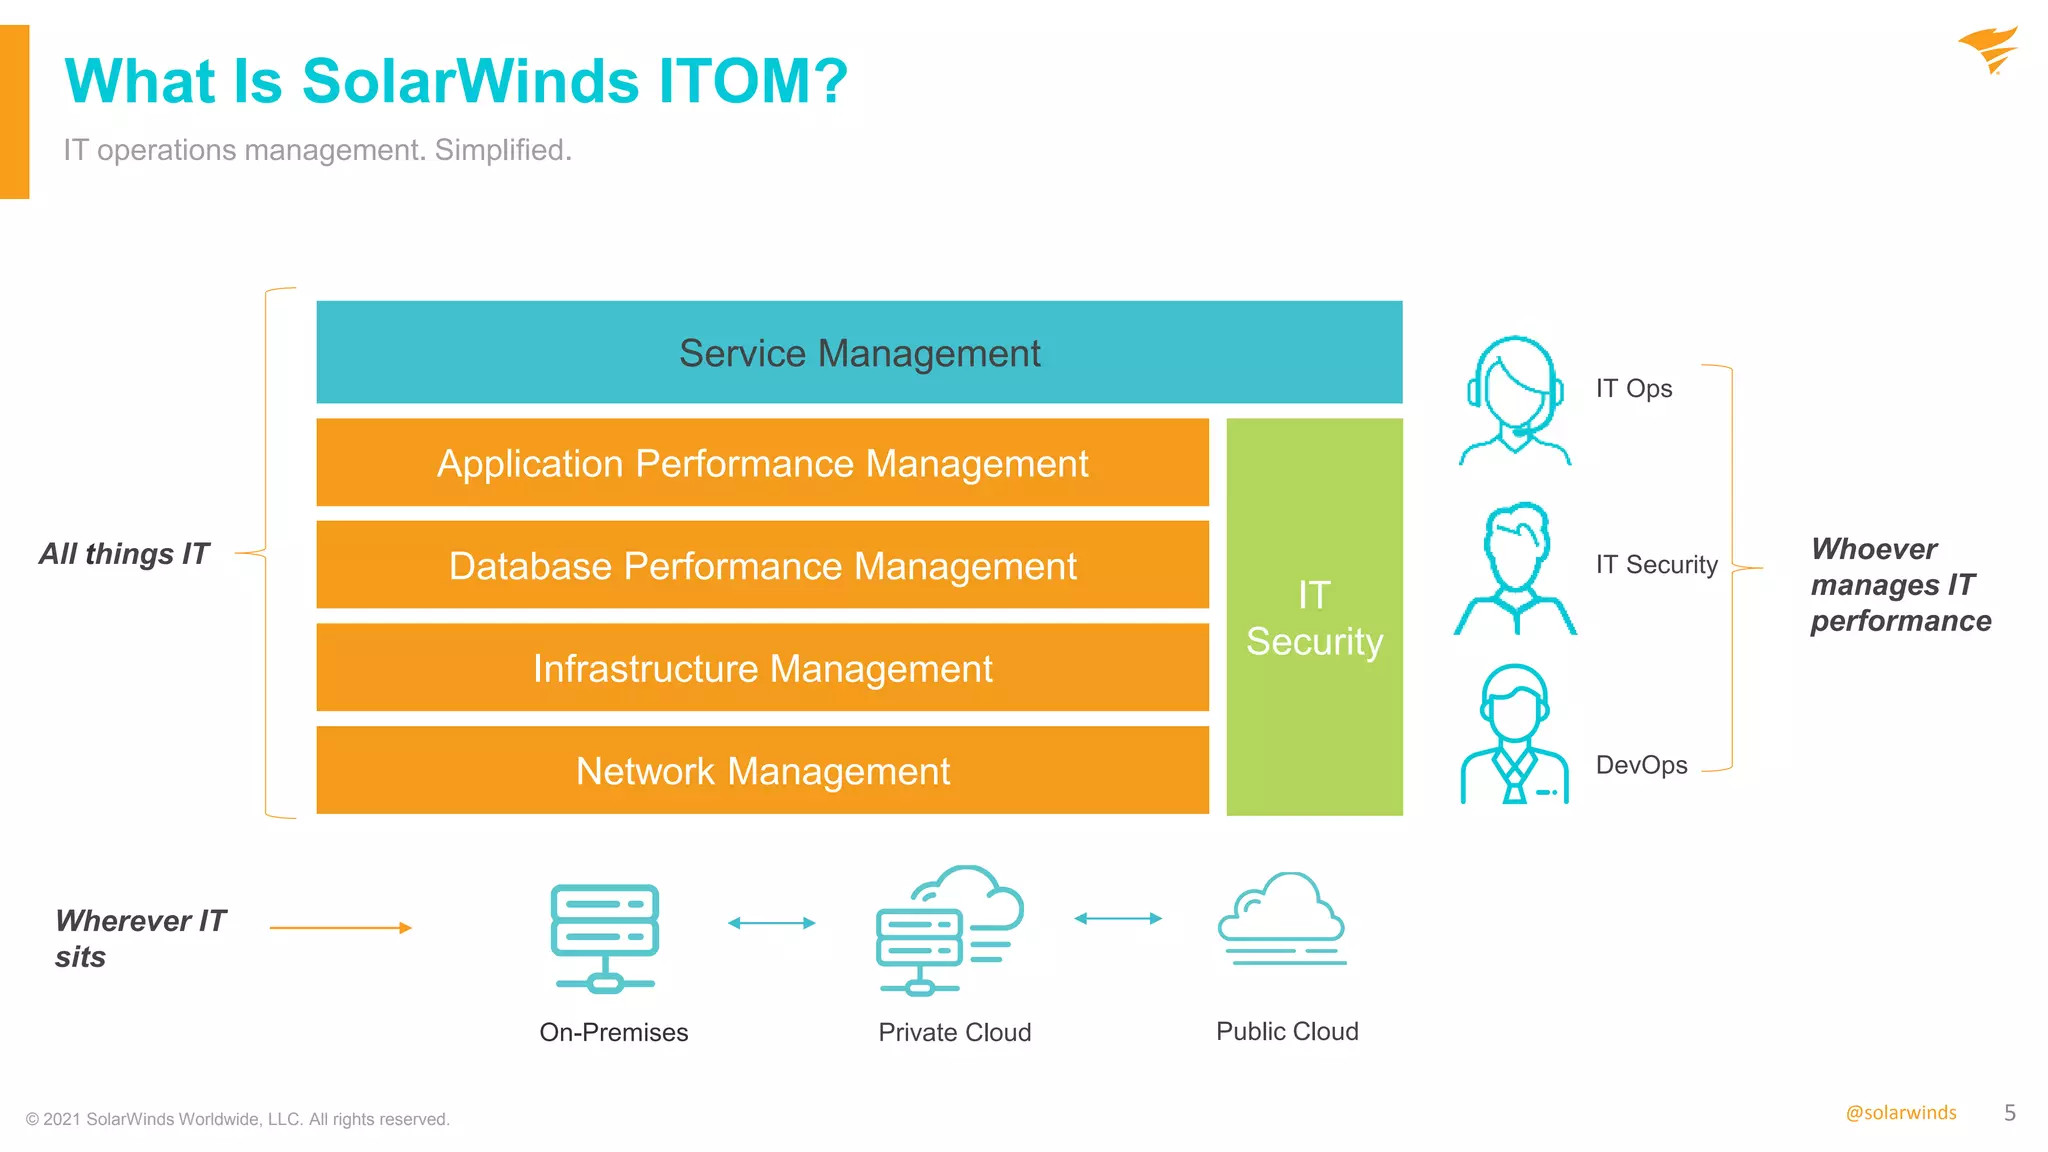
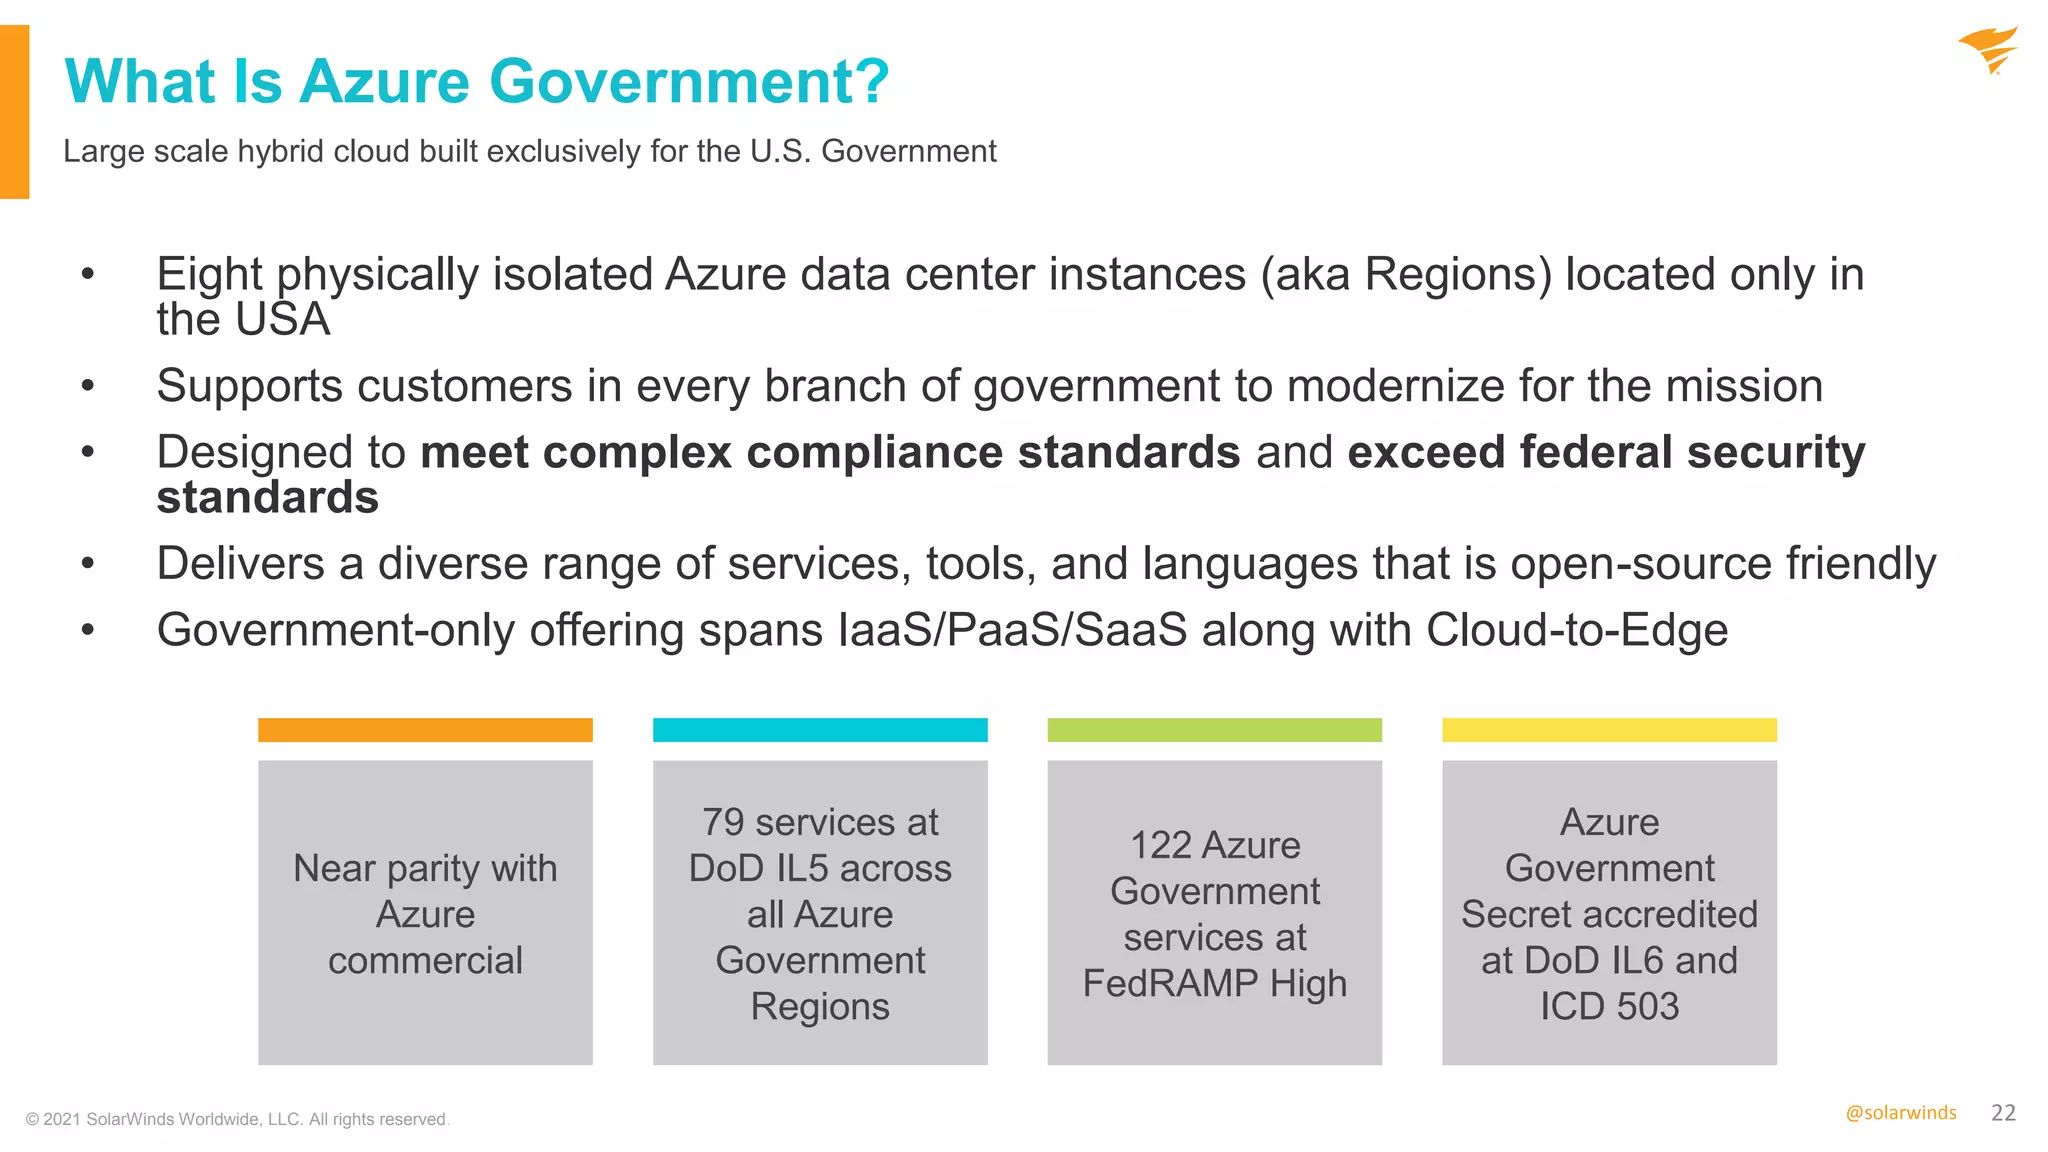
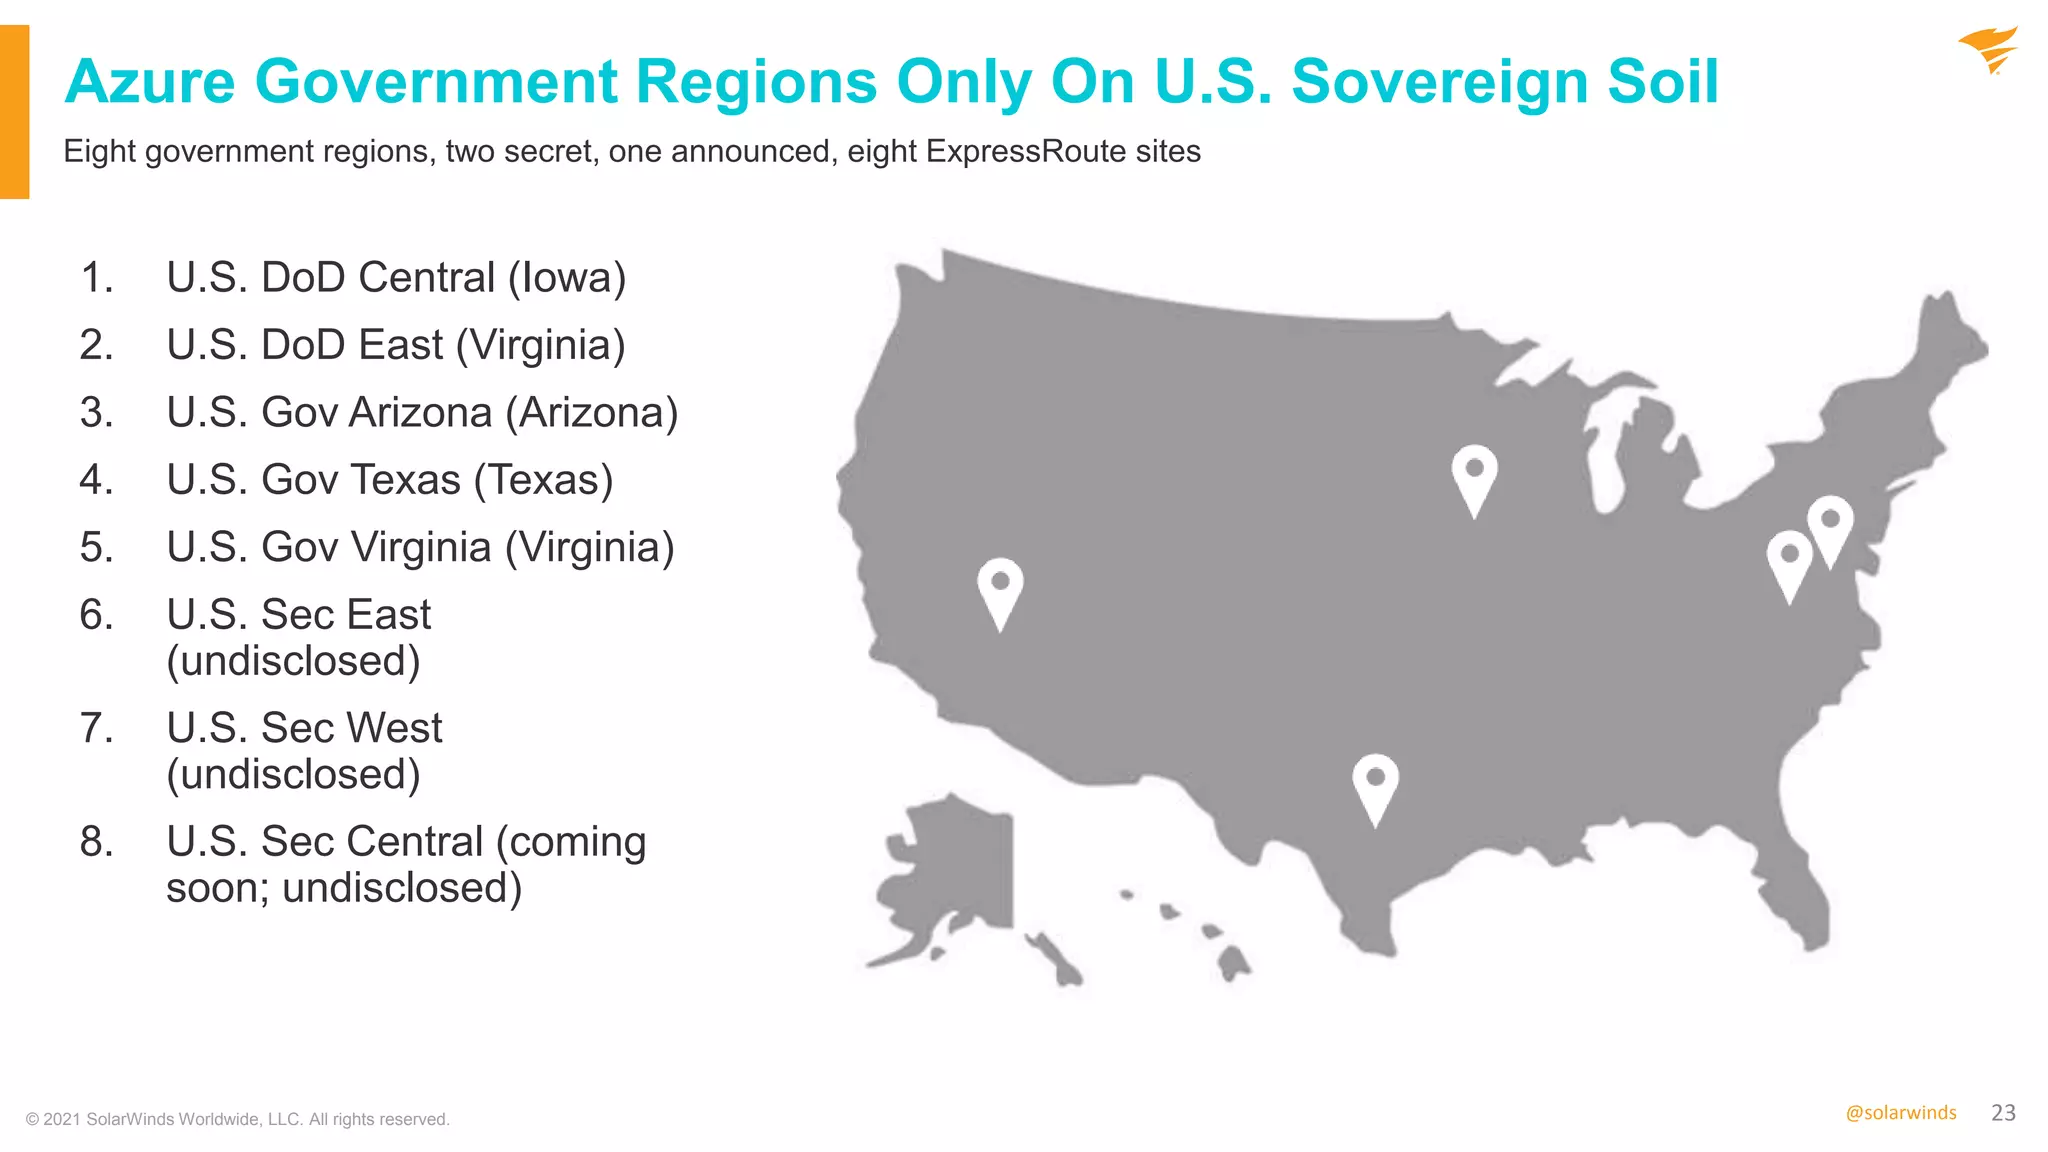
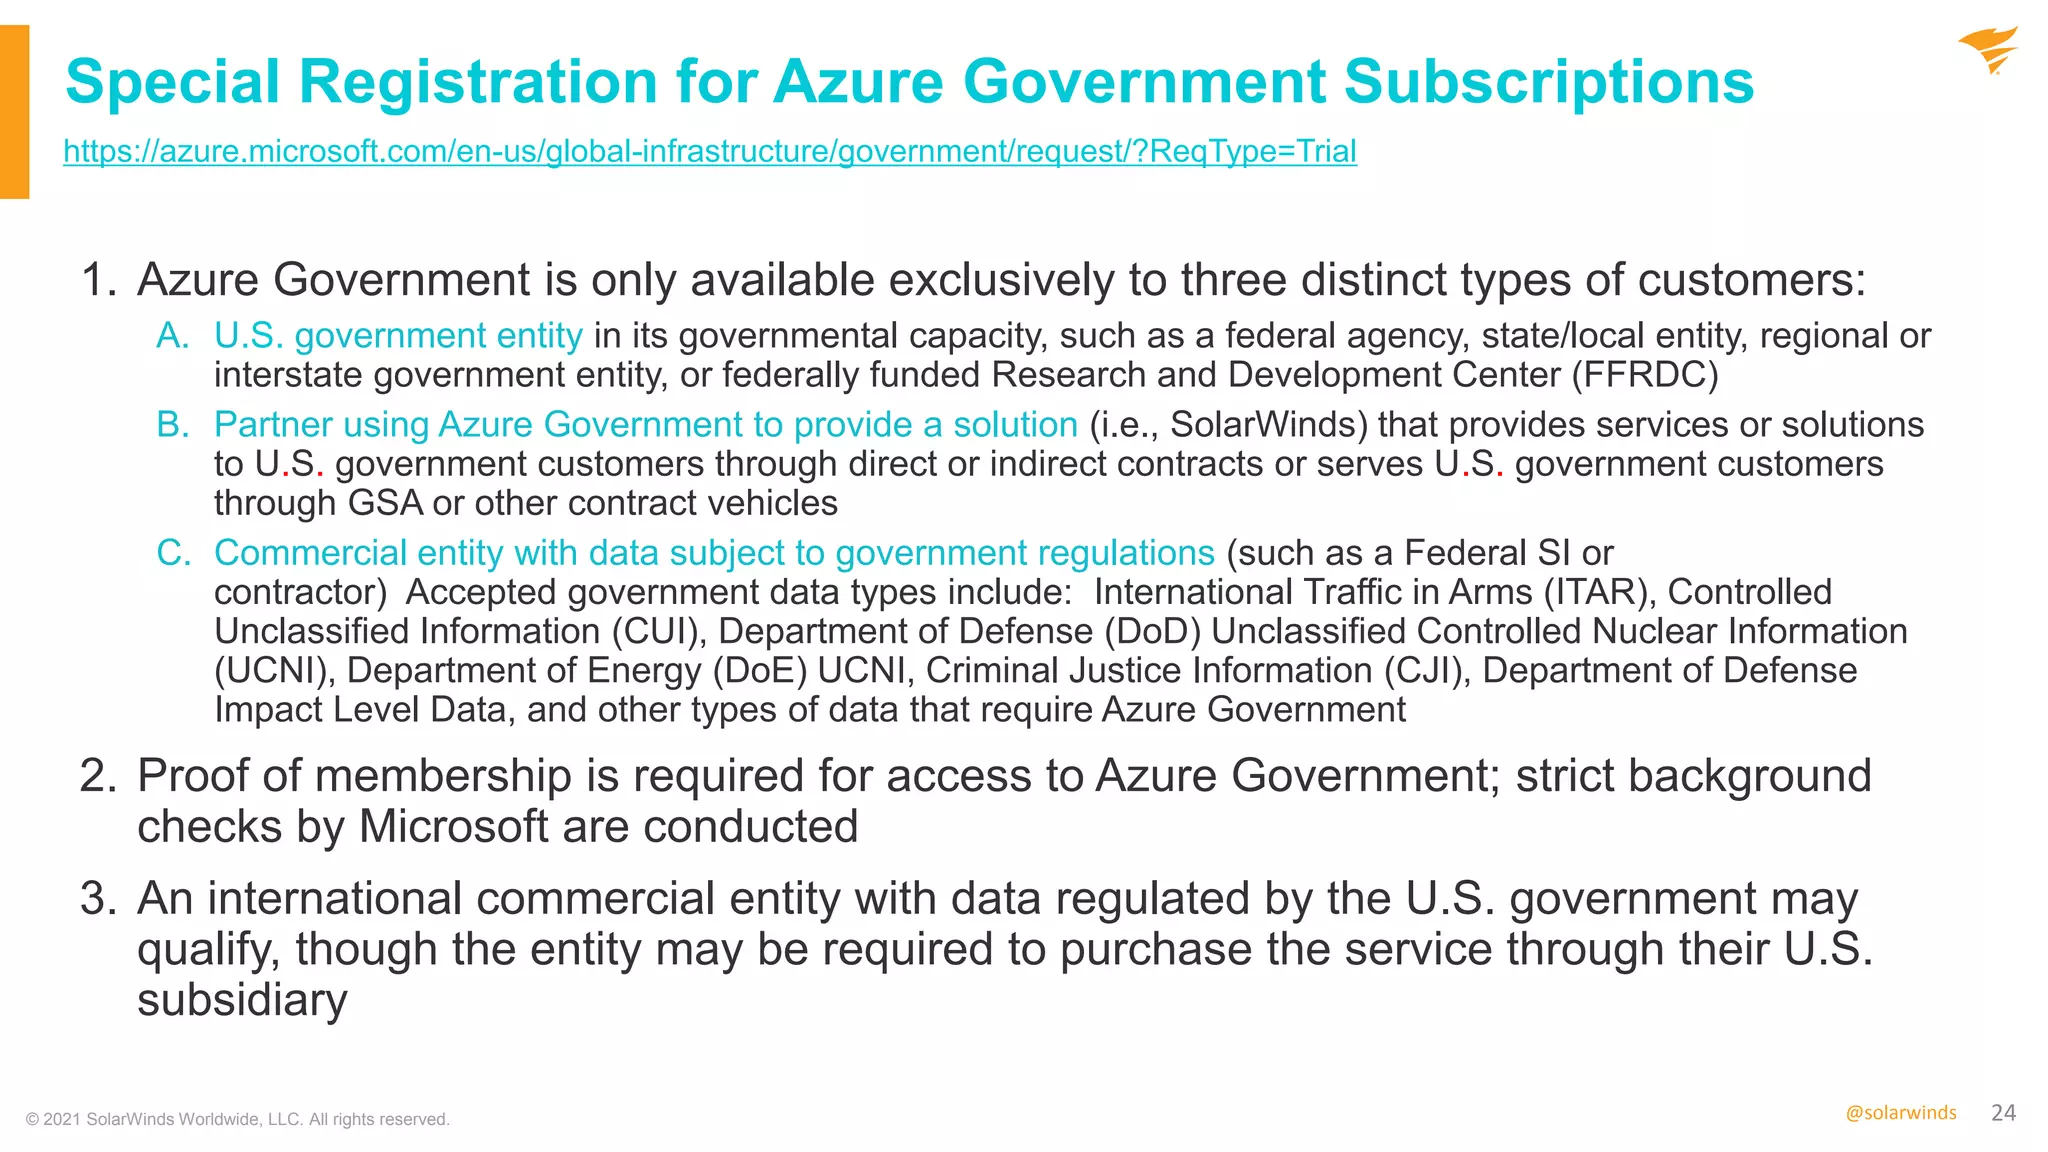
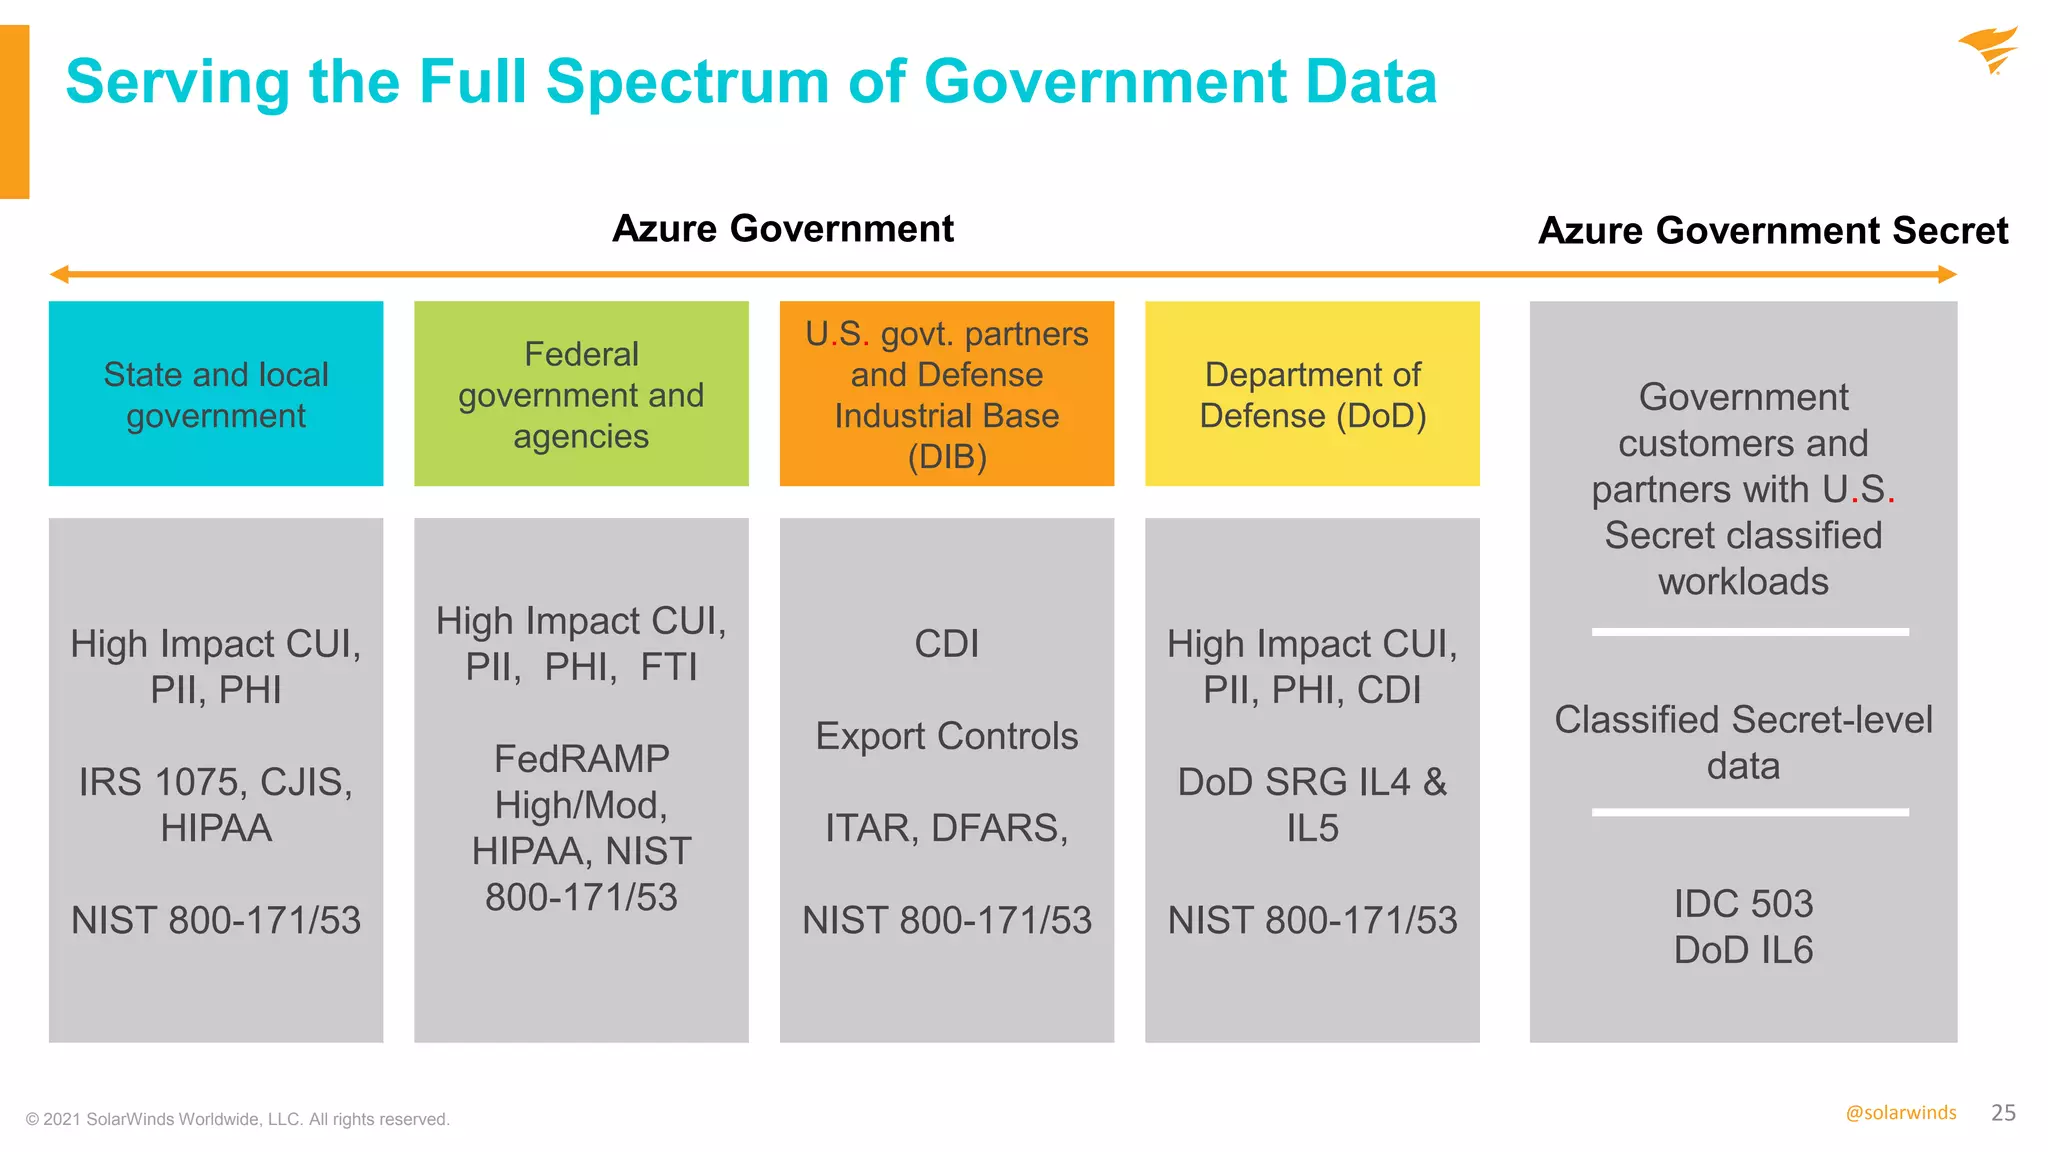
In this webinar, we discussed how SolarWinds® solutions for Azure® monitoring provide end-to-end visibility for your applications running on private, public, and hybrid clouds. We also reviewed our Azure Gov Cloud deployment options and best practices.
During this interactive webinar, attendees learned about:
Rightsizing and optimizing your virtual machines to get them ready for Azure and managing sprawl control with SolarWinds Virtualization Manager (VMAN)
Leveraging over 1,200 application, server, and Azure infrastructure monitoring templates with SolarWinds Server & Application Monitor (SAM)
Monitoring your Azure Services, Azure App Service, and custom applications using transaction tracing, code profiling, and exception tracking with SolarWinds AppOptics™, a software as a service (SaaS) product
Testing end-user experience from inside the organization and outside the firewall with SolarWinds Web Performance Monitor (WPM)
Ensuring your databases are performing optimally through cross-platform database performance optimization and tuning with SolarWinds Database Performance Analyzer (DPA)
SolarWinds availability on Azure Gov Cloud and how deployment works
37. 37@solarwinds
The SolarWinds, SolarWinds & Design, Orion, and THWACK
trademarks are the exclusive property of SolarWinds Worldwide,
LLC or its affiliates, are registered with the U.S. Patent and
Trademark Office, and may be registered or pending registration
in other countries. All other SolarWinds trademarks, service
marks, and logos may be common law marks or are registered or
pending registration. All other trademarks mentioned herein are
used for identification purposes only and are trademarks of (and
may be registered trademarks) of their respective companies.
Editor's Notes
Starting with NPM 2020.2, you can monitor traffic on Azure Network Gateways and Site-to-Site Connections on monitored Microsoft Azure cloud accounts. This will allow you to see the connections between your datacenter and the Azure cloud. This feature monitors the status of the VPN Gateway as well as it's connections, to include ingress and egress bandwidth utilization.
NPM shares components of this integration with SAM and VMAN to cohesively provide comprehensive visibility into your Azure environment. Shared components include:
Add Cloud Account wizard
Manage Cloud Accounts page
Cloud Summary page
Optimize your Azure IaaS environment Monitor and track virtual machine (VM) and container infrastructure metrics.
Correlate infrastructure performance metrics Visualize VM performance and infrastructure metrics alongside Azure IaaS application performance.
Comprehensive Azure monitoring Complete Azure IaaS, PaaS, and Office 365 performance monitoring beside your existing infrastructure.
Complete Microsoft ecosphere monitoring Monitor your Microsoft systems, applications, and cloud resources in a single pane of glass.
Monitor your Azure environment with comprehensive, real-time performance metrics
Your Azure infrastructure can host multiple diverse cloud-based services, which is why an Azure monitoring solution needs to be flexible and powerful. With SolarWinds® AppOptics™, you have the tools you need to monitor services running on Azure virtual hosts or containers. AppOptics monitors key Azure services and the applications running on them. It provides side-by-side infrastructure metrics to help you visualize basic CPU, memory, disk, and network metrics and the services consuming those resources in a user-friendly dashboard.
Be the first to know about performance issues with end-to-end visibility across your Azure platform
AppOptics helps you identify Azure performance issues as soon as they arise. With AppOptics, you can visualize, alert, and act on data in real time. Use built-in or custom metrics and thresholds to set the alerts you need. AppOptics is built to send alerts over SMS, email, Slack, and a range of other platforms. By sending proactive alerts as soon as thresholds are breached, AppOptics can help point you toward relevant metrics in your Azure hosts and containers, so you can resolve performance issues more quickly.
Get up and running fast with out-of-the-box integrations for key Azure services and more
Integrating your Azure metrics with your AppOptics dashboards is designed to be an automated, intuitive process. In addition to key out-of-the-box Azure dashboards and metrics collection, AppOptics has over 150 out-of-the-box integrations and plugins to support your Azure environment. Some examples of the out-of-the-box, pre-populated, and customizable dashboards for Azure services includes monitoring of VMs, virtual networks, key vaults, Redis, app services, load balancers, Cosmos Databases (DB), and more.
Troubleshoot accurately and efficiently with a deep dive into code-level performance
For efficient and accurate troubleshooting, AppOptics can help you identify code-level errors at the root of application performance issues. With distributed tracing, live code profiling, and exception tracking, AppOptics offers holistic code-level application performance troubleshooting. Just click through to drill down from traces to relevant logs within Loggly® or Papertrail™, two SolarWinds log management services.
Proactively address website speed and performance issues before end users are affected
Examine every aspect of your webpageQuickly troubleshoot issues by identifying which components in a webpage are slow like CSS, HTML, and JavaScript.
Test website speeds from anywhereDetermine if the page is loading slowly everywhere, or if it’s isolated to a specific location.
Get notified in case of slow response or downtimeHelp improve search engine results with faster page load speeds.
Automatically monitor quality of service to improve the end-user experience
SolarWinds® Web Performance Monitor (WPM) lets you constantly monitor web-based application and website responsiveness from the view of your end users.
WPM is designed to help you:
Measure the impact of website and web app changes by testing transaction responsiveness
Install players in multiple locations and monitor for differences in the responsiveness and availability of centralized intranet services
Ensure processes perform as users expect
Find out where web app bottlenecks come from and identify their causes
Best practices for monitoring website uptime and performance
Continuously monitor website and web server uptimeDetect performance issues that could affect your website uptime and performance.
Monitor front-end website performanceSee website components and their response time metrics to identify and troubleshoot site load issues.
Test end-user experience from multiple locationsSee the global user experience by recording, then playing back transactions in different locations.
Monitor website user experienceMonitor individual pages for greater insight into what makes up a transaction to identify where problems are occurring.
[mark thinks the (preview) versions are trials, but we should confirm
See details here (each bullet has 4-5 steps)- https://documentation.solarwinds.com/en/Success_Center/orionplatform/Content/install-orion-azure-azure-marketplace.htm