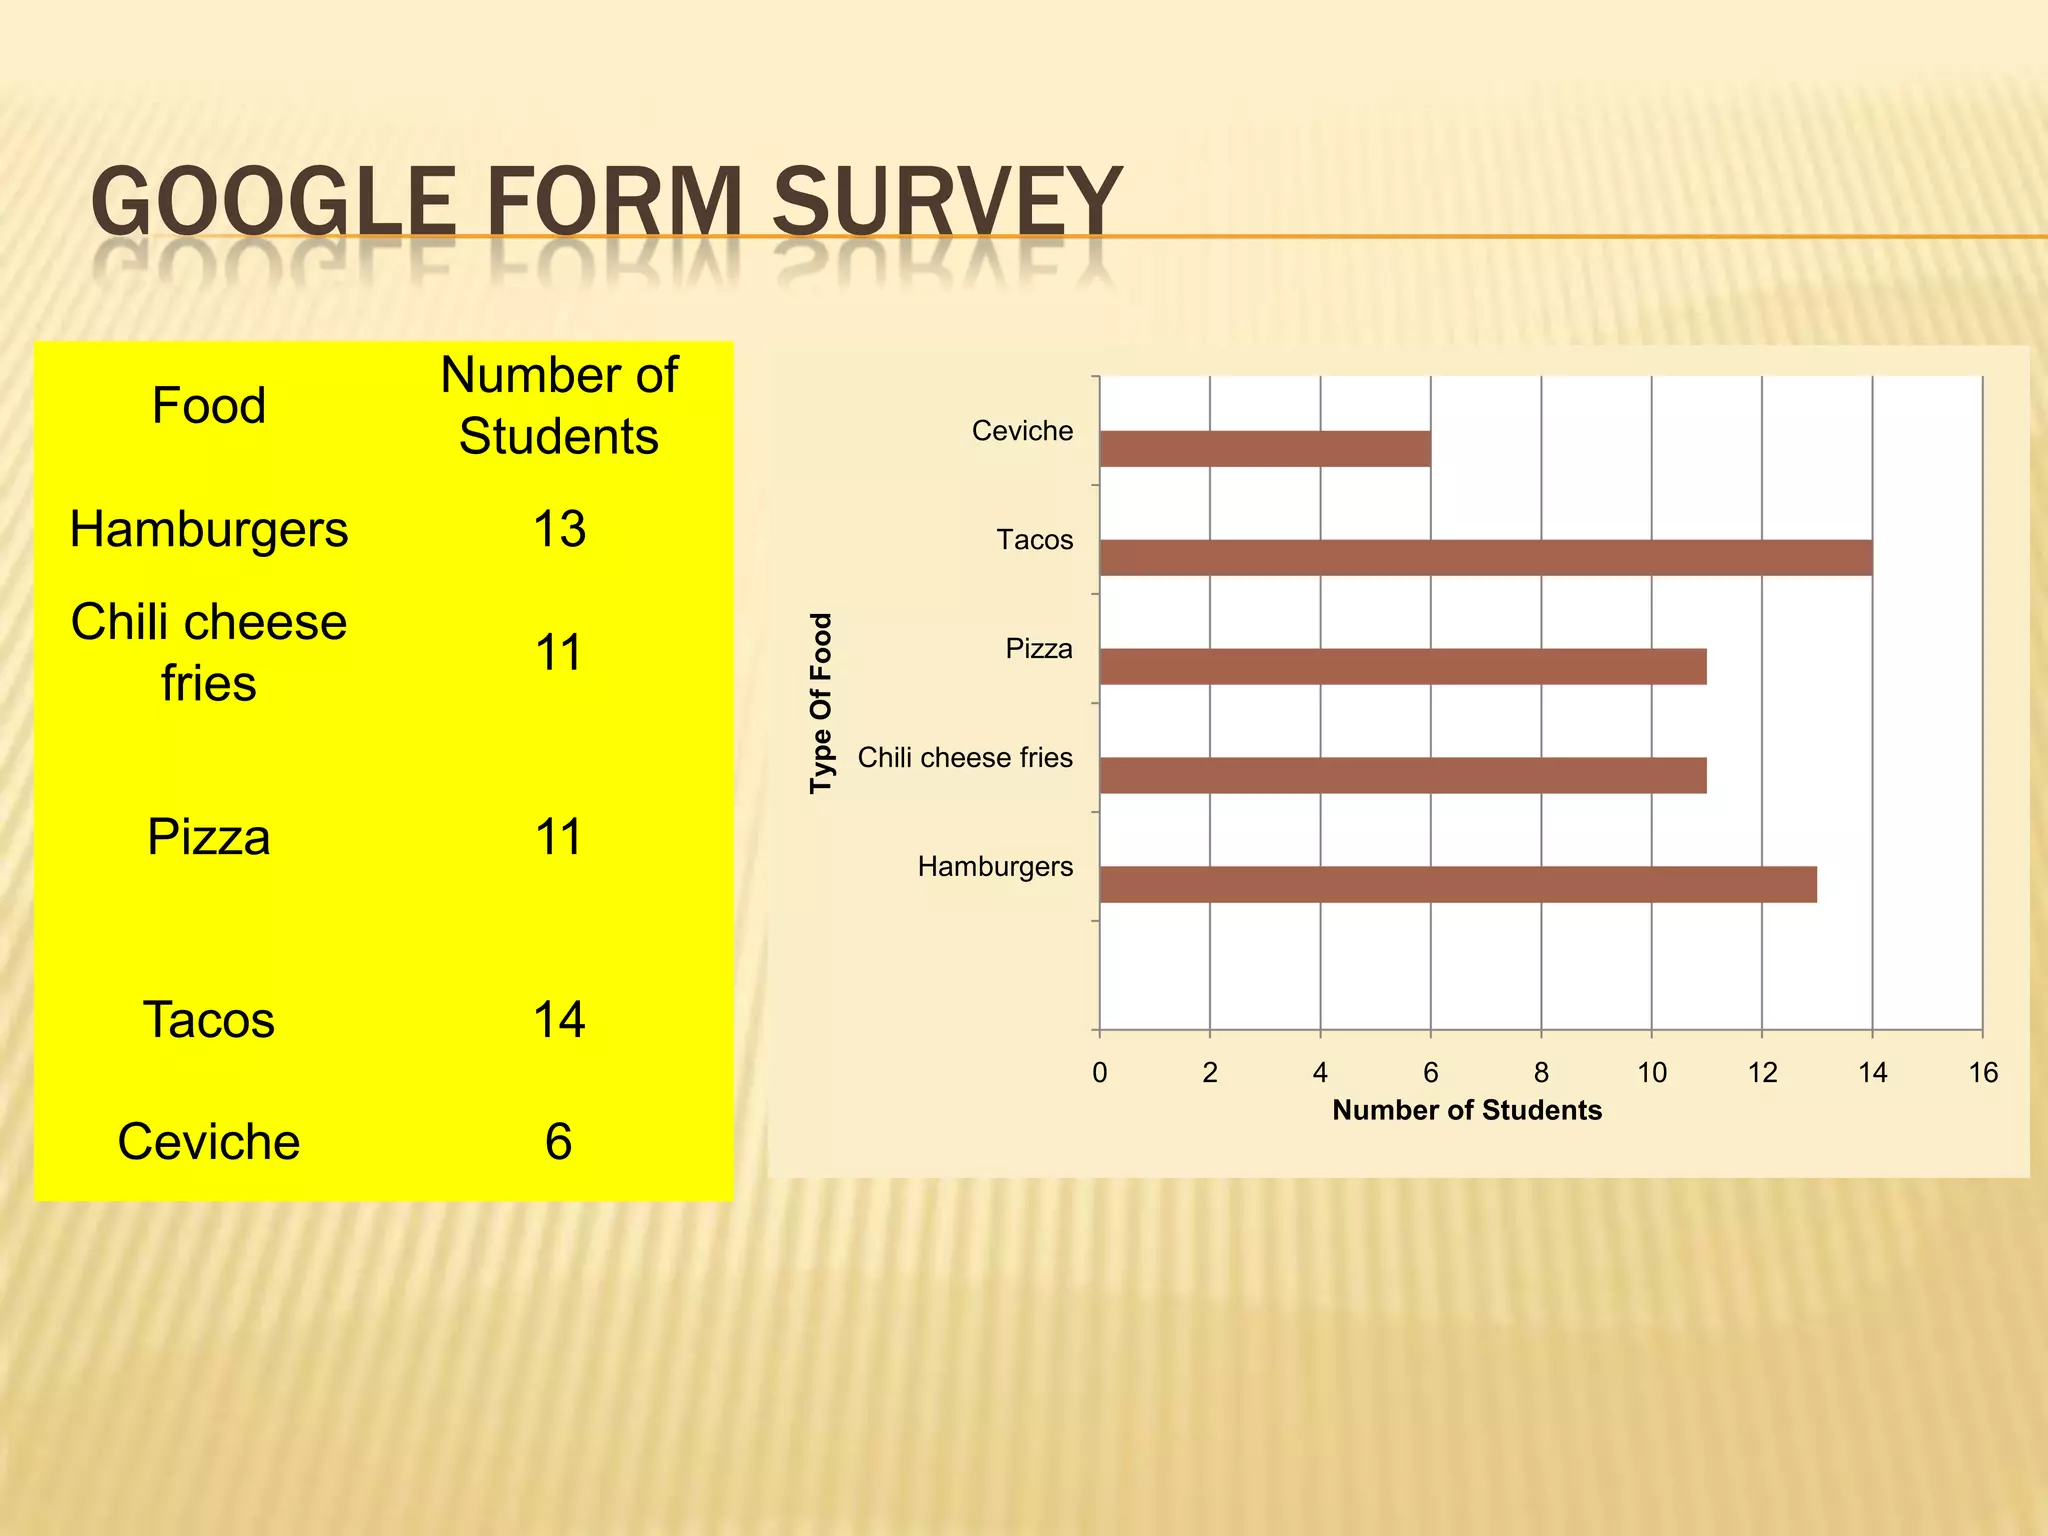
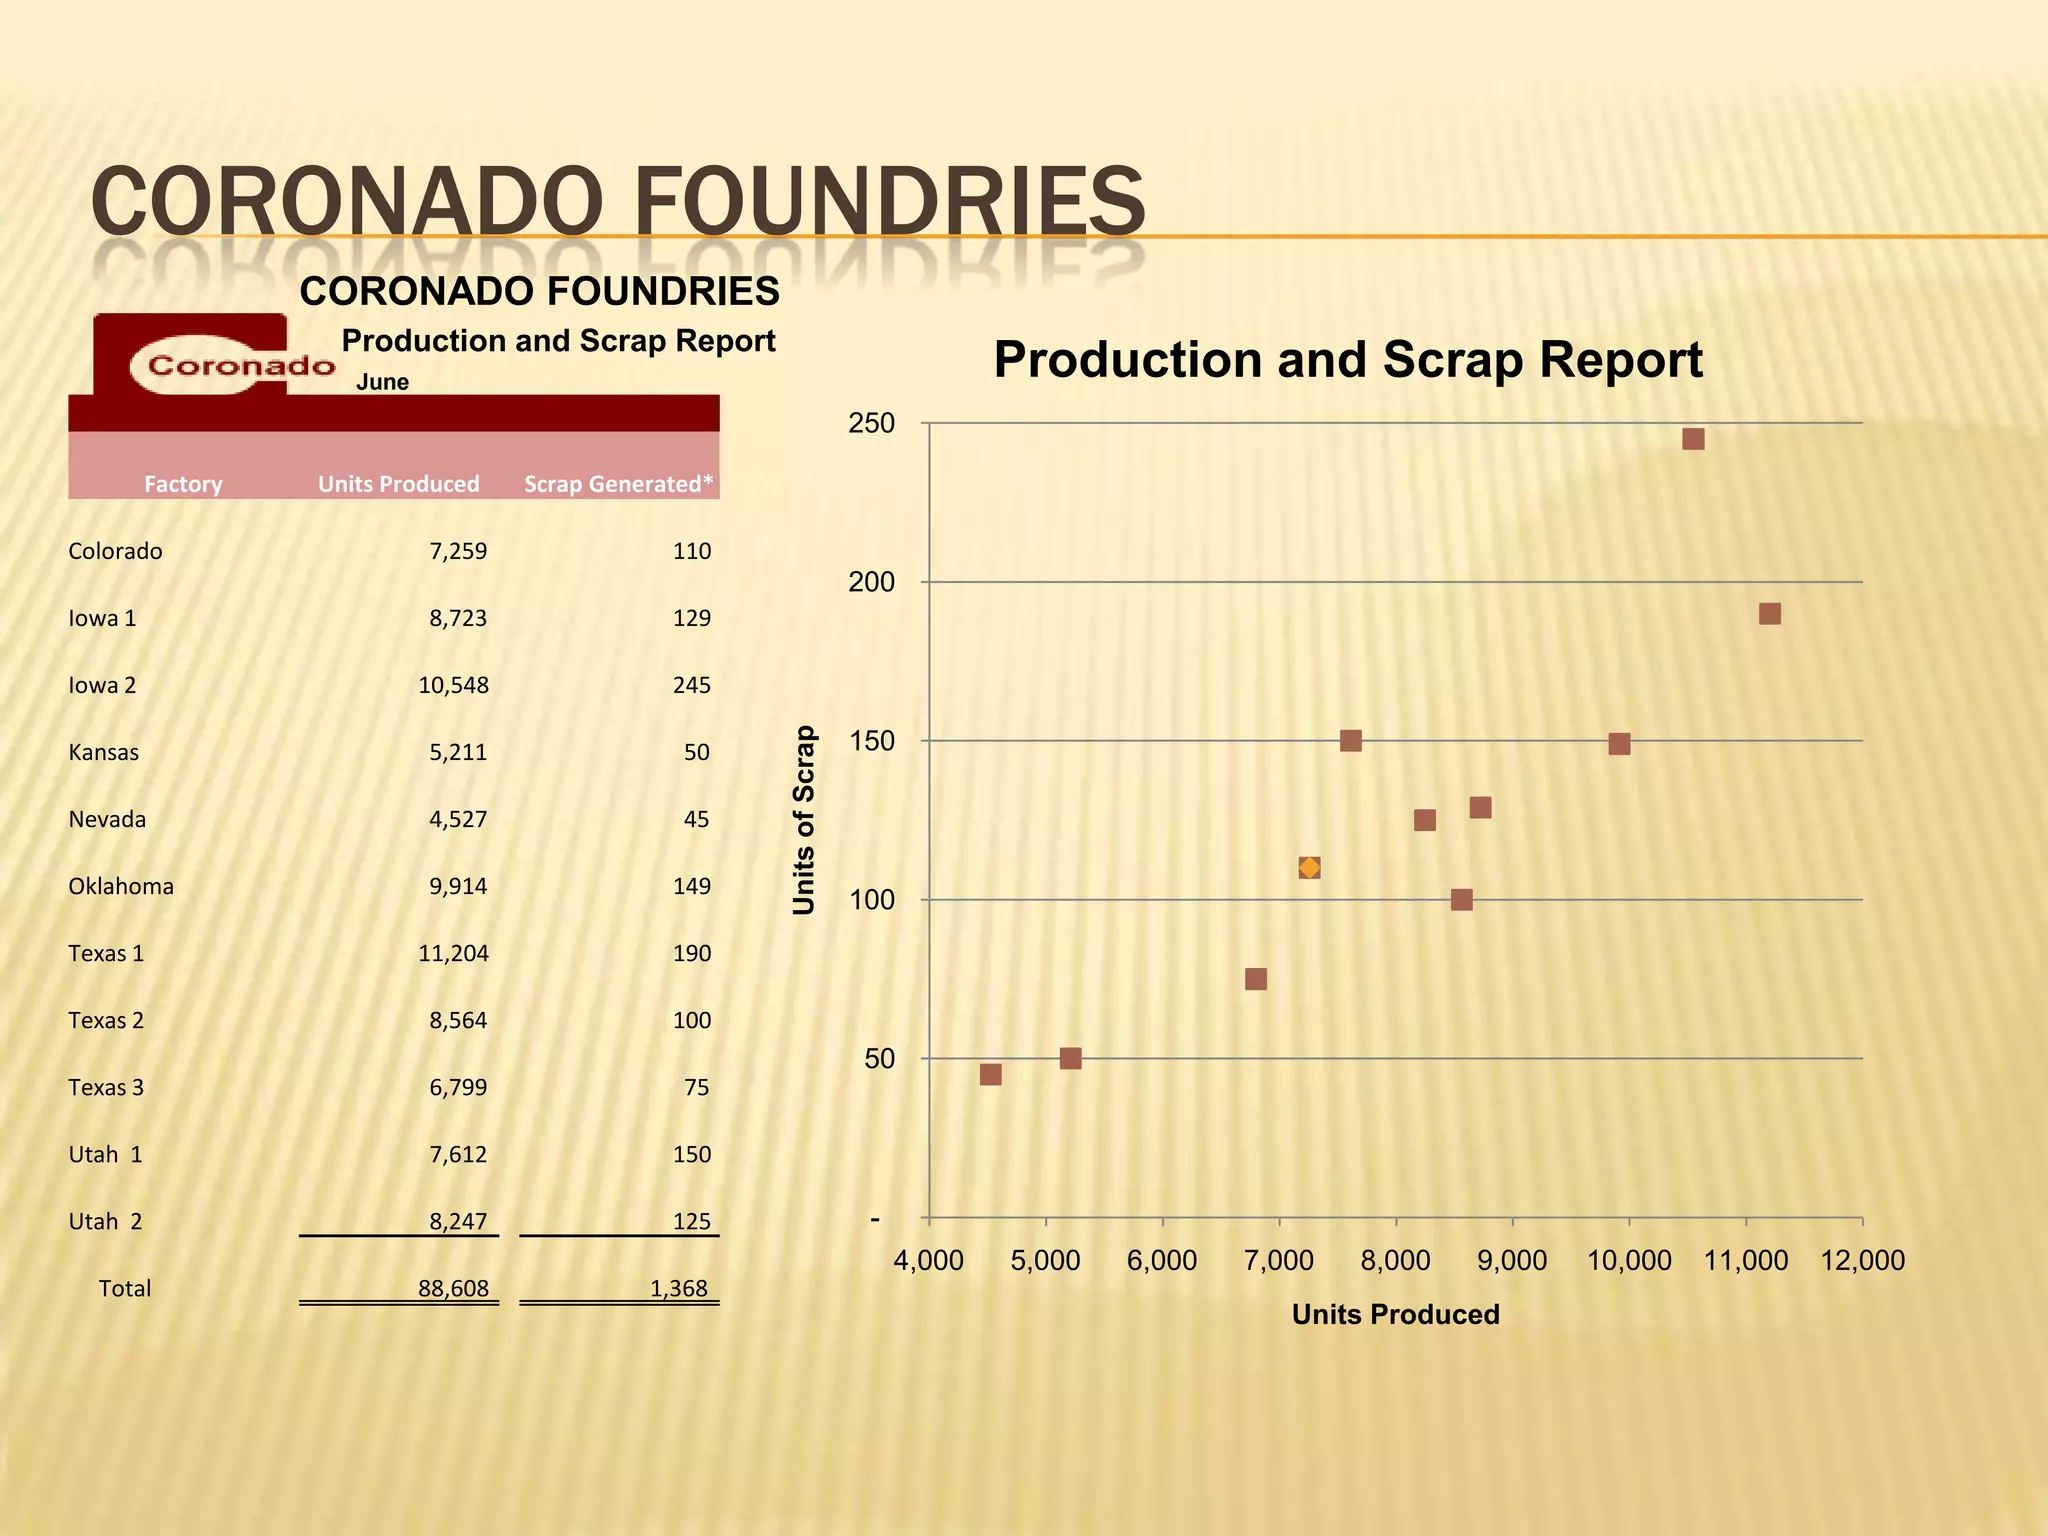
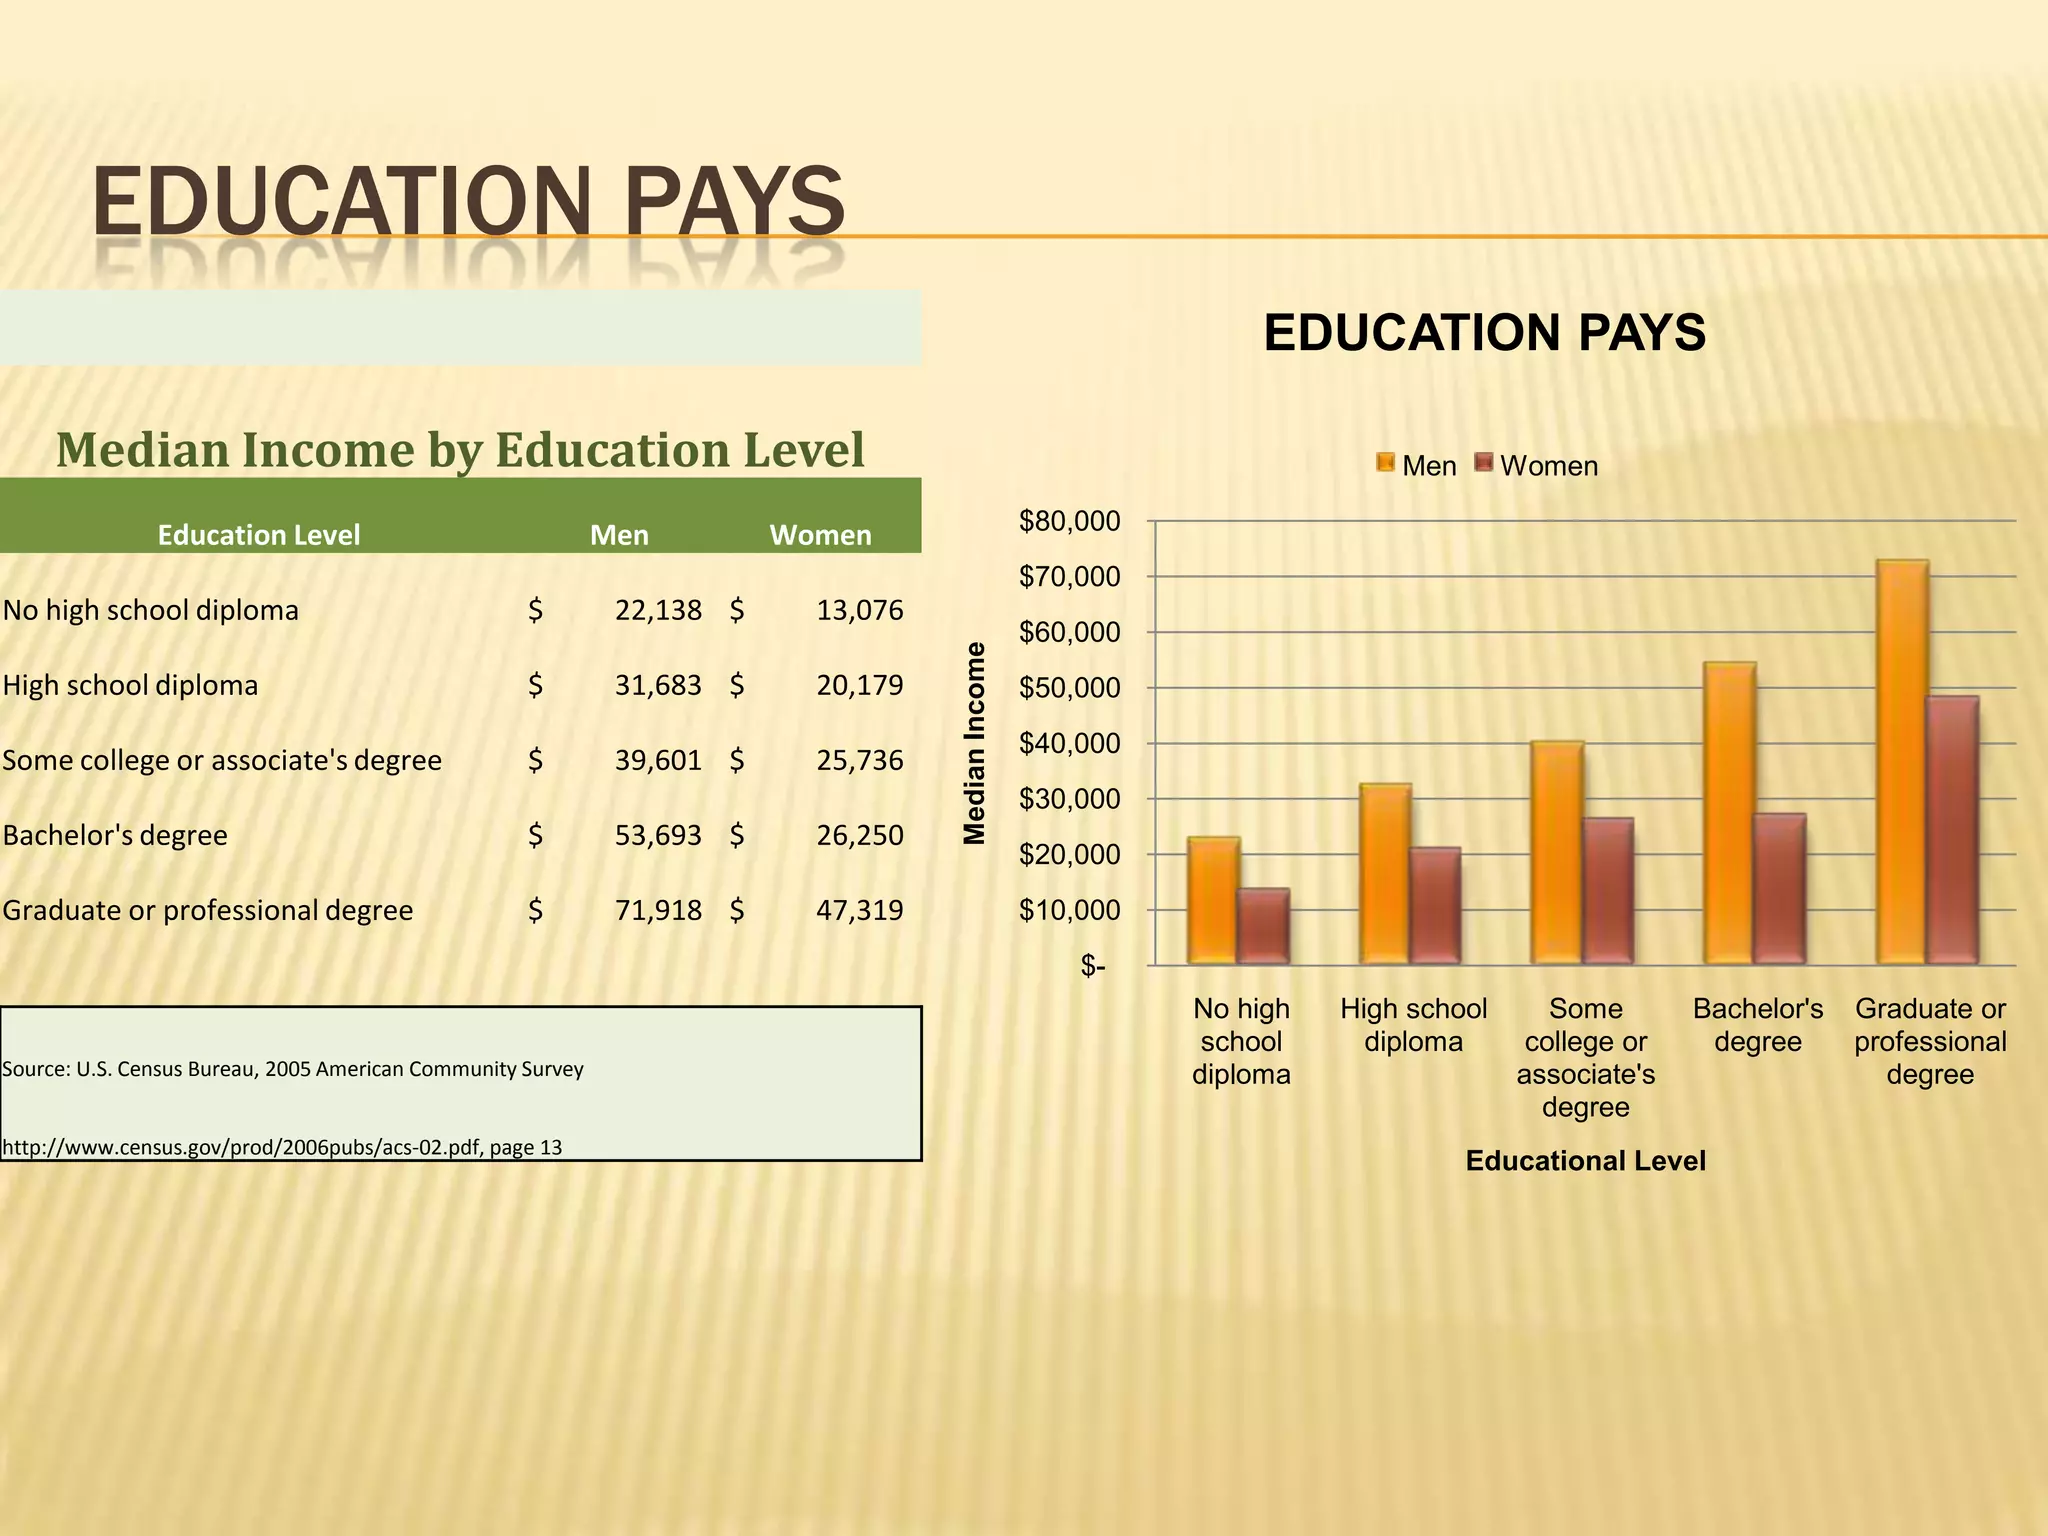
GOOGLE FORM SURVEY
               Number of
   Food
               Students                            Ceviche


Hamburgers        13                                 Tacos


Chili cheese


                           Type Of Food
                  11                                  Pizza
    fries
                                          Chili cheese fries


   Pizza          11                           Hamburgers


   Tacos          14
                                                               0   2   4        6       8       10   12   14   16
                                                                           Number of Students
  Ceviche         6
CORONADO FOUNDRIES
                   CORONADO FOUNDRIES
                     Production and Scrap Report
                      June
                                                                                       Production and Scrap Report
                                                                          250

         Factory   Units Produced     Scrap Generated*

Colorado                     7,259                110
                                                                          200
Iowa 1                       8,723                129

Iowa 2                       10,548               245


                                                         Units of Scrap
Kansas                       5,211                 50                     150

Nevada                       4,527                 45

Oklahoma                     9,914                149
                                                                          100
Texas 1                      11,204               190

Texas 2                      8,564                100
                                                                           50
Texas 3                      6,799                 75

Utah 1                       7,612                150

Utah 2                       8,247                125                      -
                                                                               4,000   5,000   6,000   7,000   8,000   9,000   10,000   11,000   12,000
  Total                      88,608             1,368
                                                                                                          Units Produced
EDUCATION PAYS
                                                                                                                  EDUCATION PAYS

     Median Income by Education Level                                                                                       Men       Women

               Education Level                               Men         Women                      $80,000
                                                                                                    $70,000
No high school diploma                              $         22,138 $     13,076
                                                                                                    $60,000


                                                                                    Median Income
High school diploma                                 $         31,683 $     20,179                   $50,000
                                                                                                    $40,000
Some college or associate's degree                  $         39,601 $     25,736
                                                                                                    $30,000
Bachelor's degree                                   $         53,693 $     26,250
                                                                                                    $20,000
Graduate or professional degree                     $         71,918 $     47,319                   $10,000
                                                                                                        $-
                                                                                                              No high   High school      Some       Bachelor's   Graduate or
                                                                                                               school     diploma      college or    degree      professional
Source: U.S. Census Bureau, 2005 American Community Survey                                                    diploma                 associate's                  degree
                                                                                                                                        degree
http://www.census.gov/prod/2006pubs/acs-02.pdf, page 13
                                                                                                                                  Educational Level
GRAINS SALES
                                                Annual Sales by Segment


Annual Sales (in thousands)                           Wheat
                                                      10%
                                                                Alfalfa
                                                                 19%

      Segment          Sales

Alfalfa          $       1,723       Soybeans
                                       31%


Corn                     3,627
                                                                          Corn
Soybeans                 2,785                                            40%


Wheat                          895
 Total           $       9,030
POPULATIONS OF LARGE CITIES
          Most Populated Cities in the World            35


                                                        30
                                  Population
               City              (in millions)
                                                        25
Tokyo/Yokohama                                   33.2
New York                                         17.8
                                                        20
Sao Paulo                                        17.7
Seoul/Incheon                                    17.5   15
Mexico City                                      17.4        Series1
Osaka/Kobe/Kyoto                               16.425   10
Manila                                          14.75
Mumbai                                          14.35    5

Delhi                                            14.3
Jakarta                                         14.25    0
RED CROSS

                                 Operating Expenses                                       American Red Cross
                                 Years ending June 30                                     Operating Expenses
                                 (in millions)                          $6,000.0


                                                                        $5,000.0
          Year      Expenses
          1997 $     1,721.8
          1998 $     1,790.9                                            $4,000.0

                                                        (in millions)
          1999 $     2,062.7
          2000 $     2,226.6
          2001 $     2,489.0                                            $3,000.0

          2002 $     3,259.8
          2003 $     3,071.0                                            $2,000.0
          2004 $     3,199.5
          2005 $     3,427.9
          2006 $     5,628.1                                            $1,000.0


                                                                             $-
Source: Annual Reports of the American Red Cross                                   1997   1998   1999   2000   2001   2002   2003   2004   2005   2006
http://www.redcross.org
                                                                                                                 Year
RUNNING TIMES
                                             36


     Running Times
10-Week Workout Program                     35.5


Week        Time                             35

        1       35.5


                          Time In Minutes
        2      35.25                        34.5

        3      35.25                                                                        Series1


        4         35                         34

        5      35.25
        6      34.75                        33.5
        7       34.5
        8      34.15
                                             33
        9      34.25                               1   2   3   4   5   6   7   8   9   10

       10         34                                               Week
MCDONALDS RESTAURANTS
                                                                   Total Restaurants
               McDonald's Corporation                              Company operated   Franchises   Affiliated
                            Restaurants

Company operated                     8,785

Franchises                          18,687

Affiliated                           4,195                                    13%
                                                                                             28%
   Total                            31,667


Source: McDonald's Corporation 2006 Annual Report
                                                                         59%
http://www.mcdonalds.com/corp/invest/pub/2006_Annual_Report.html
END OF SLIDE SHOW

   Thank you for watching !

Google form survey powerpoint

  • 1.
    GOOGLE FORM SURVEY Number of Food Students Ceviche Hamburgers 13 Tacos Chili cheese Type Of Food 11 Pizza fries Chili cheese fries Pizza 11 Hamburgers Tacos 14 0 2 4 6 8 10 12 14 16 Number of Students Ceviche 6
  • 2.
    CORONADO FOUNDRIES CORONADO FOUNDRIES Production and Scrap Report June Production and Scrap Report 250 Factory Units Produced Scrap Generated* Colorado 7,259 110 200 Iowa 1 8,723 129 Iowa 2 10,548 245 Units of Scrap Kansas 5,211 50 150 Nevada 4,527 45 Oklahoma 9,914 149 100 Texas 1 11,204 190 Texas 2 8,564 100 50 Texas 3 6,799 75 Utah 1 7,612 150 Utah 2 8,247 125 - 4,000 5,000 6,000 7,000 8,000 9,000 10,000 11,000 12,000 Total 88,608 1,368 Units Produced
  • 3.
    EDUCATION PAYS EDUCATION PAYS Median Income by Education Level Men Women Education Level Men Women $80,000 $70,000 No high school diploma $ 22,138 $ 13,076 $60,000 Median Income High school diploma $ 31,683 $ 20,179 $50,000 $40,000 Some college or associate's degree $ 39,601 $ 25,736 $30,000 Bachelor's degree $ 53,693 $ 26,250 $20,000 Graduate or professional degree $ 71,918 $ 47,319 $10,000 $- No high High school Some Bachelor's Graduate or school diploma college or degree professional Source: U.S. Census Bureau, 2005 American Community Survey diploma associate's degree degree http://www.census.gov/prod/2006pubs/acs-02.pdf, page 13 Educational Level
  • 4.
    GRAINS SALES Annual Sales by Segment Annual Sales (in thousands) Wheat 10% Alfalfa 19% Segment Sales Alfalfa $ 1,723 Soybeans 31% Corn 3,627 Corn Soybeans 2,785 40% Wheat 895 Total $ 9,030
  • 5.
    POPULATIONS OF LARGECITIES Most Populated Cities in the World 35 30 Population City (in millions) 25 Tokyo/Yokohama 33.2 New York 17.8 20 Sao Paulo 17.7 Seoul/Incheon 17.5 15 Mexico City 17.4 Series1 Osaka/Kobe/Kyoto 16.425 10 Manila 14.75 Mumbai 14.35 5 Delhi 14.3 Jakarta 14.25 0
  • 6.
    RED CROSS Operating Expenses American Red Cross Years ending June 30 Operating Expenses (in millions) $6,000.0 $5,000.0 Year Expenses 1997 $ 1,721.8 1998 $ 1,790.9 $4,000.0 (in millions) 1999 $ 2,062.7 2000 $ 2,226.6 2001 $ 2,489.0 $3,000.0 2002 $ 3,259.8 2003 $ 3,071.0 $2,000.0 2004 $ 3,199.5 2005 $ 3,427.9 2006 $ 5,628.1 $1,000.0 $- Source: Annual Reports of the American Red Cross 1997 1998 1999 2000 2001 2002 2003 2004 2005 2006 http://www.redcross.org Year
  • 7.
    RUNNING TIMES 36 Running Times 10-Week Workout Program 35.5 Week Time 35 1 35.5 Time In Minutes 2 35.25 34.5 3 35.25 Series1 4 35 34 5 35.25 6 34.75 33.5 7 34.5 8 34.15 33 9 34.25 1 2 3 4 5 6 7 8 9 10 10 34 Week
  • 8.
    MCDONALDS RESTAURANTS Total Restaurants McDonald's Corporation Company operated Franchises Affiliated Restaurants Company operated 8,785 Franchises 18,687 Affiliated 4,195 13% 28% Total 31,667 Source: McDonald's Corporation 2006 Annual Report 59% http://www.mcdonalds.com/corp/invest/pub/2006_Annual_Report.html
  • 10.
    END OF SLIDESHOW  Thank you for watching !