This document contains information from several charts and tables about various topics:
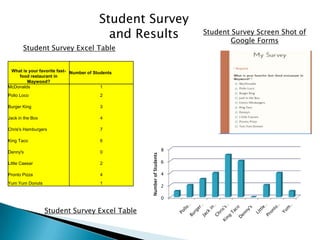
1) A student survey from Maywood shows that Chris's Hamburgers was the favorite fast food restaurant with 7 students, followed by King Taco with 6 students.
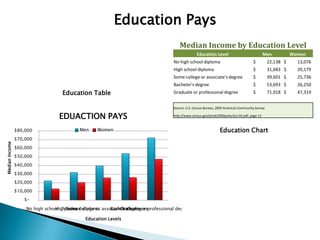
2) A table shows median income increases with higher levels of education for both men and women. Graduate or professional degrees have the highest median income.
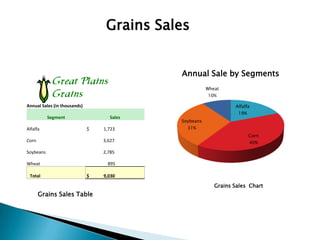
3) A grains sales chart indicates that soybeans accounted for 31% of annual grain sales of $9.03 million, followed by corn at 40%.
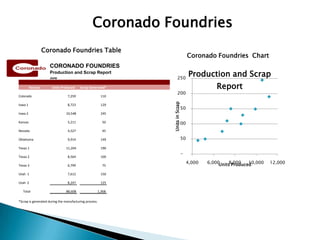
4) A foundry production report lists output and scrap amounts for various foundry locations, with the highest production coming from Texas 1 and 2.
5