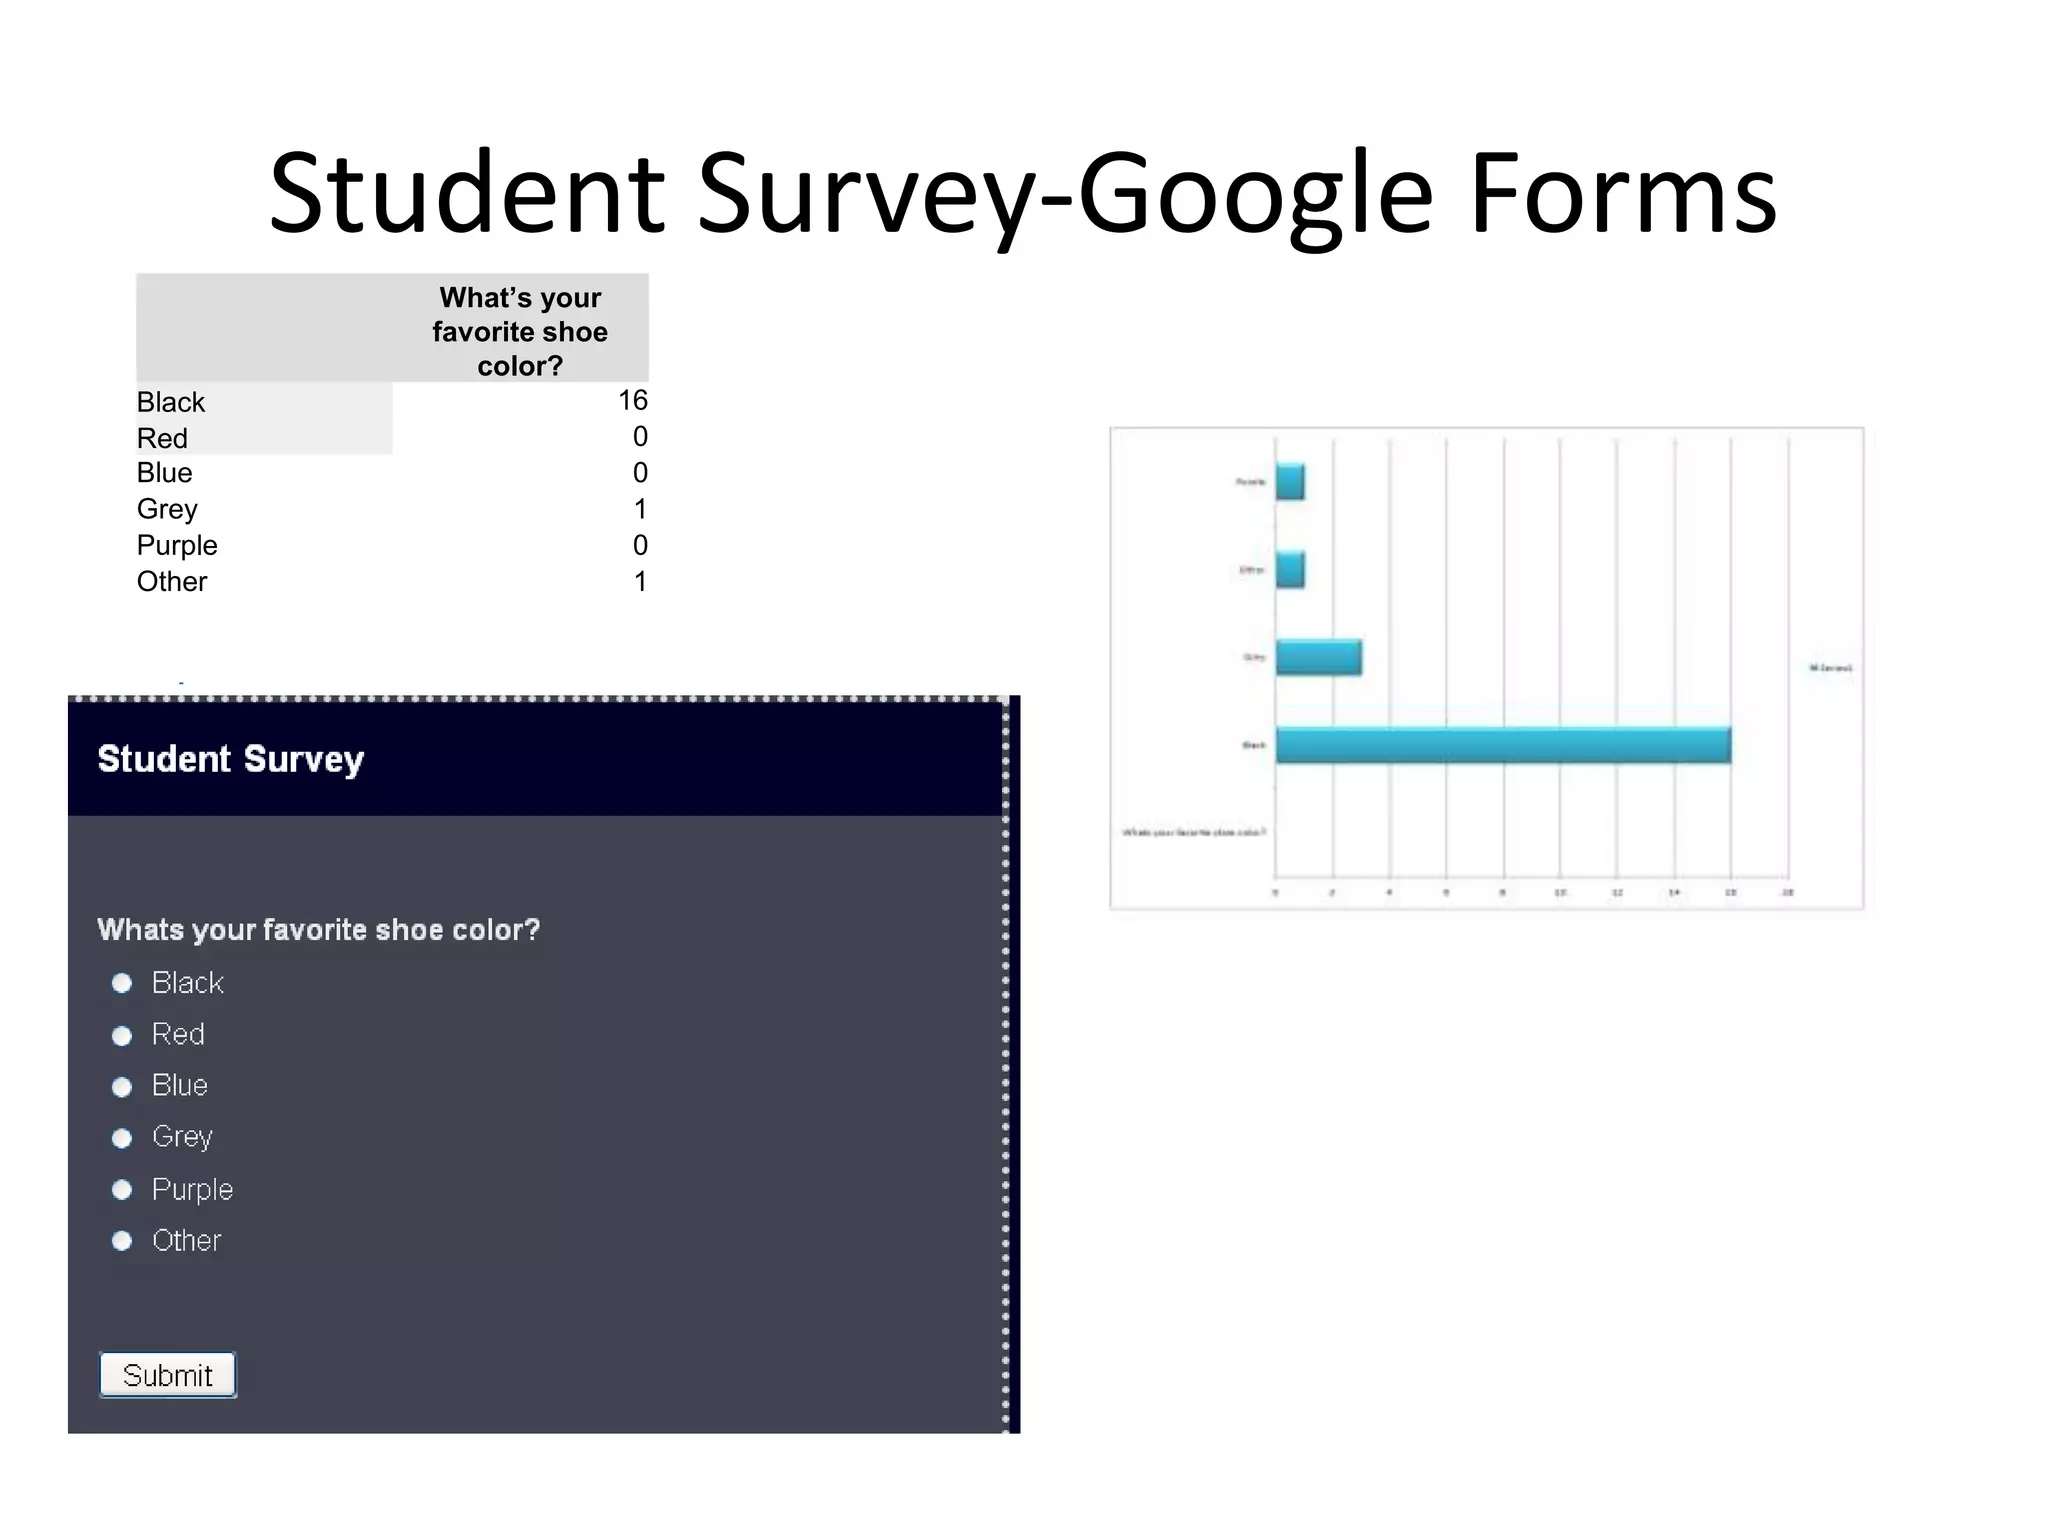
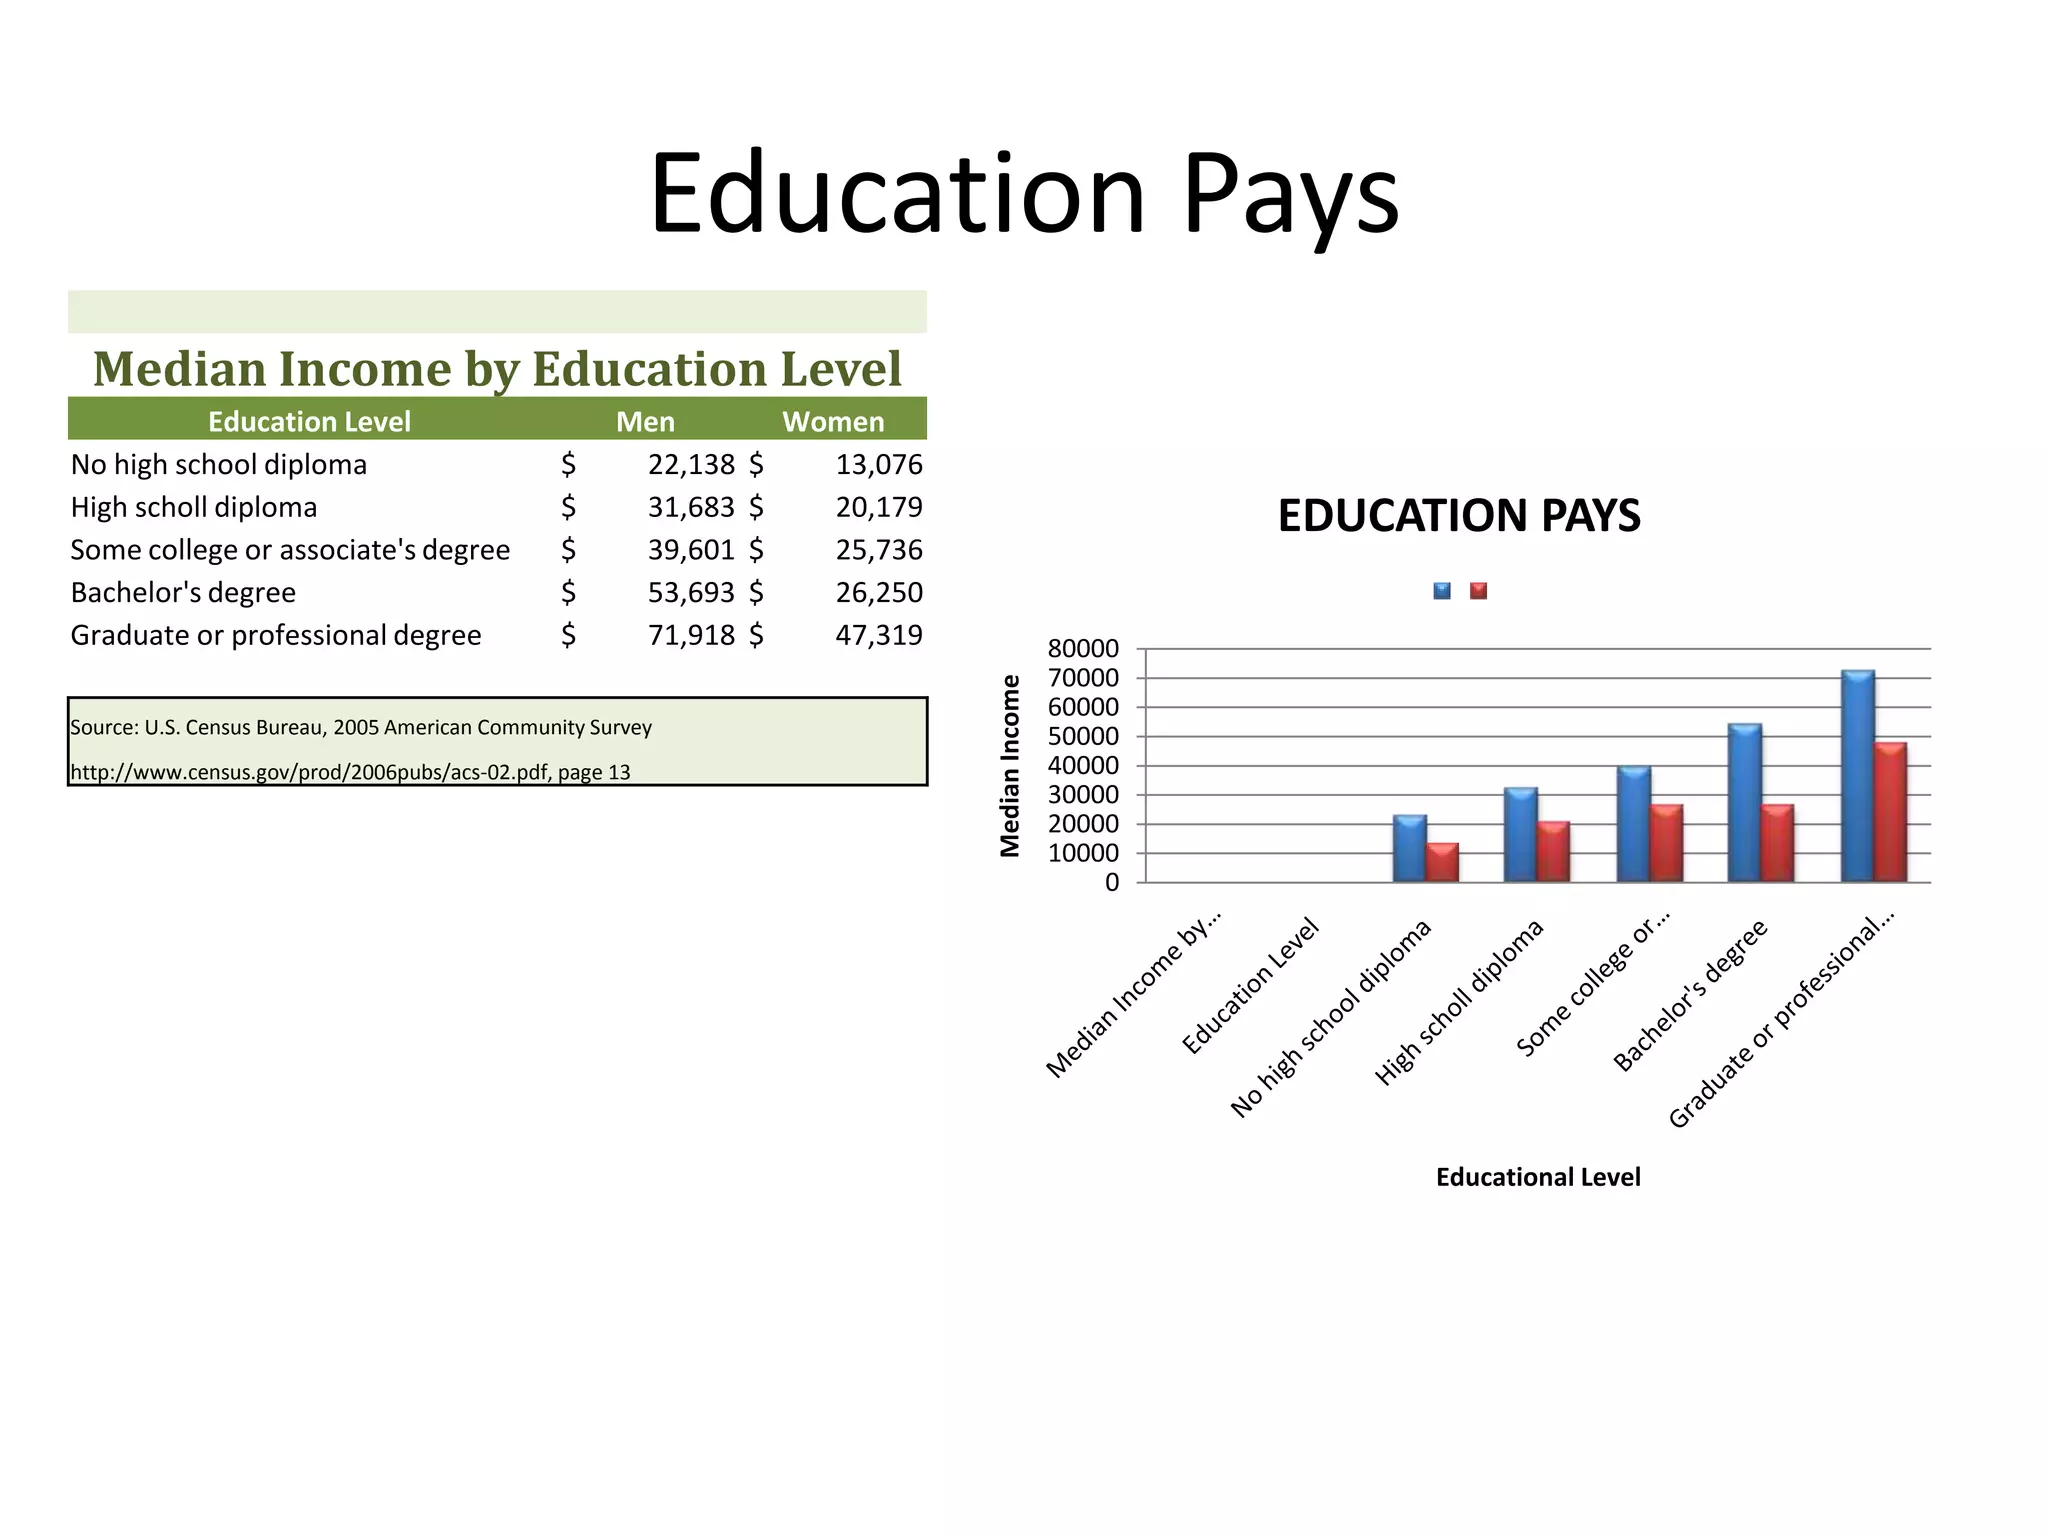
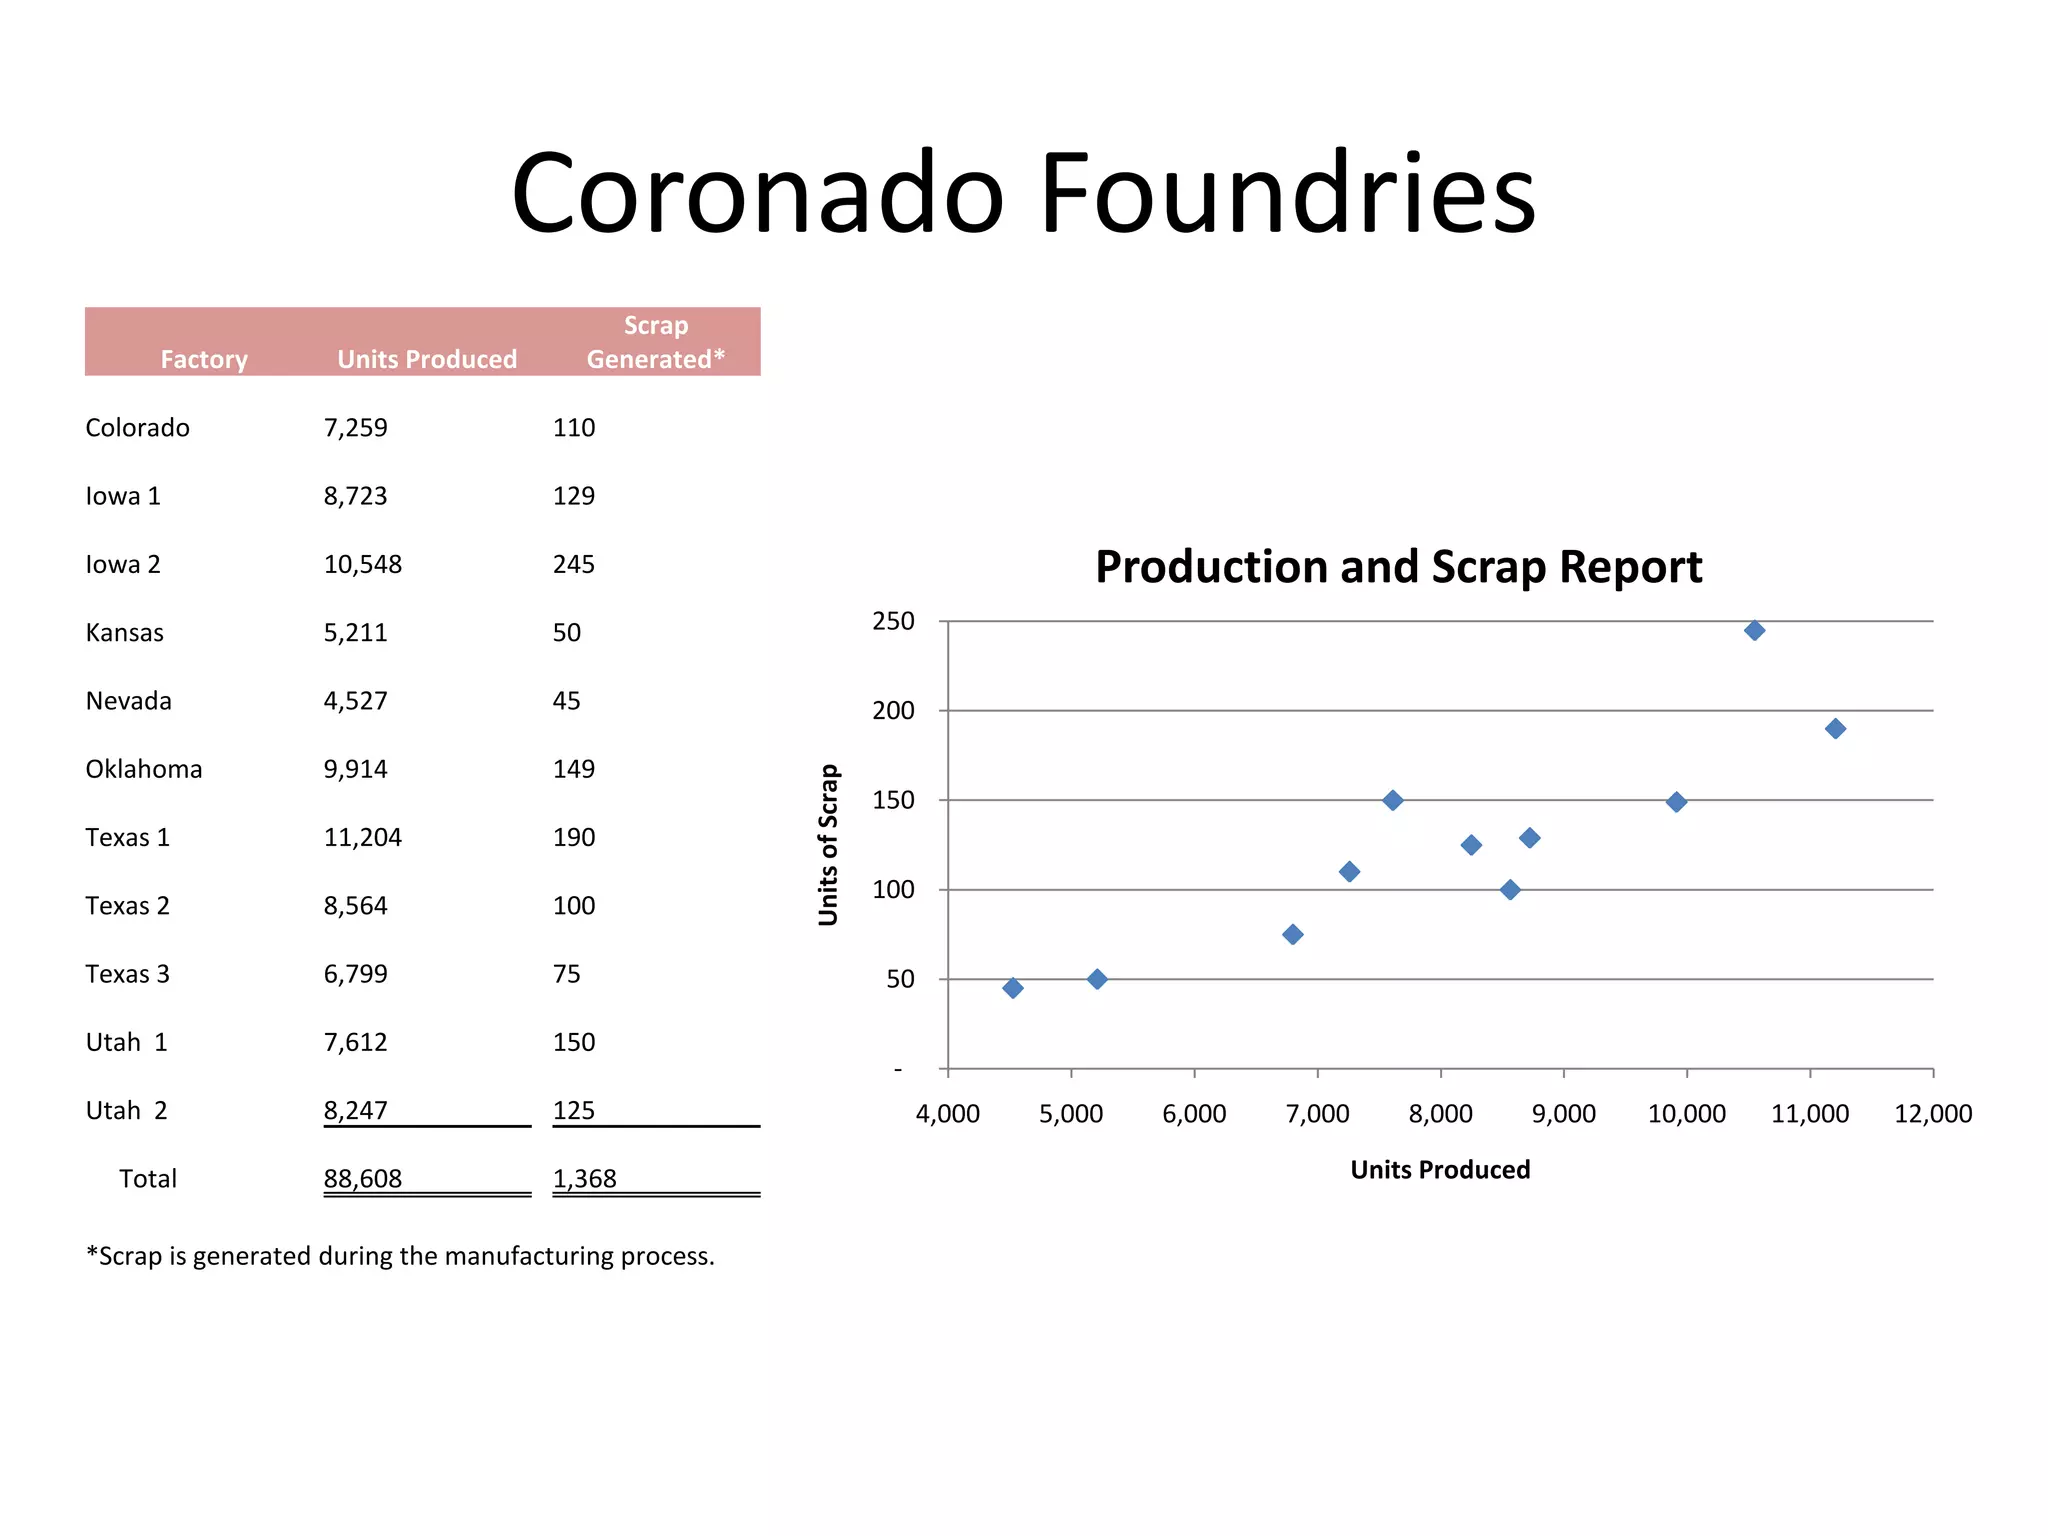
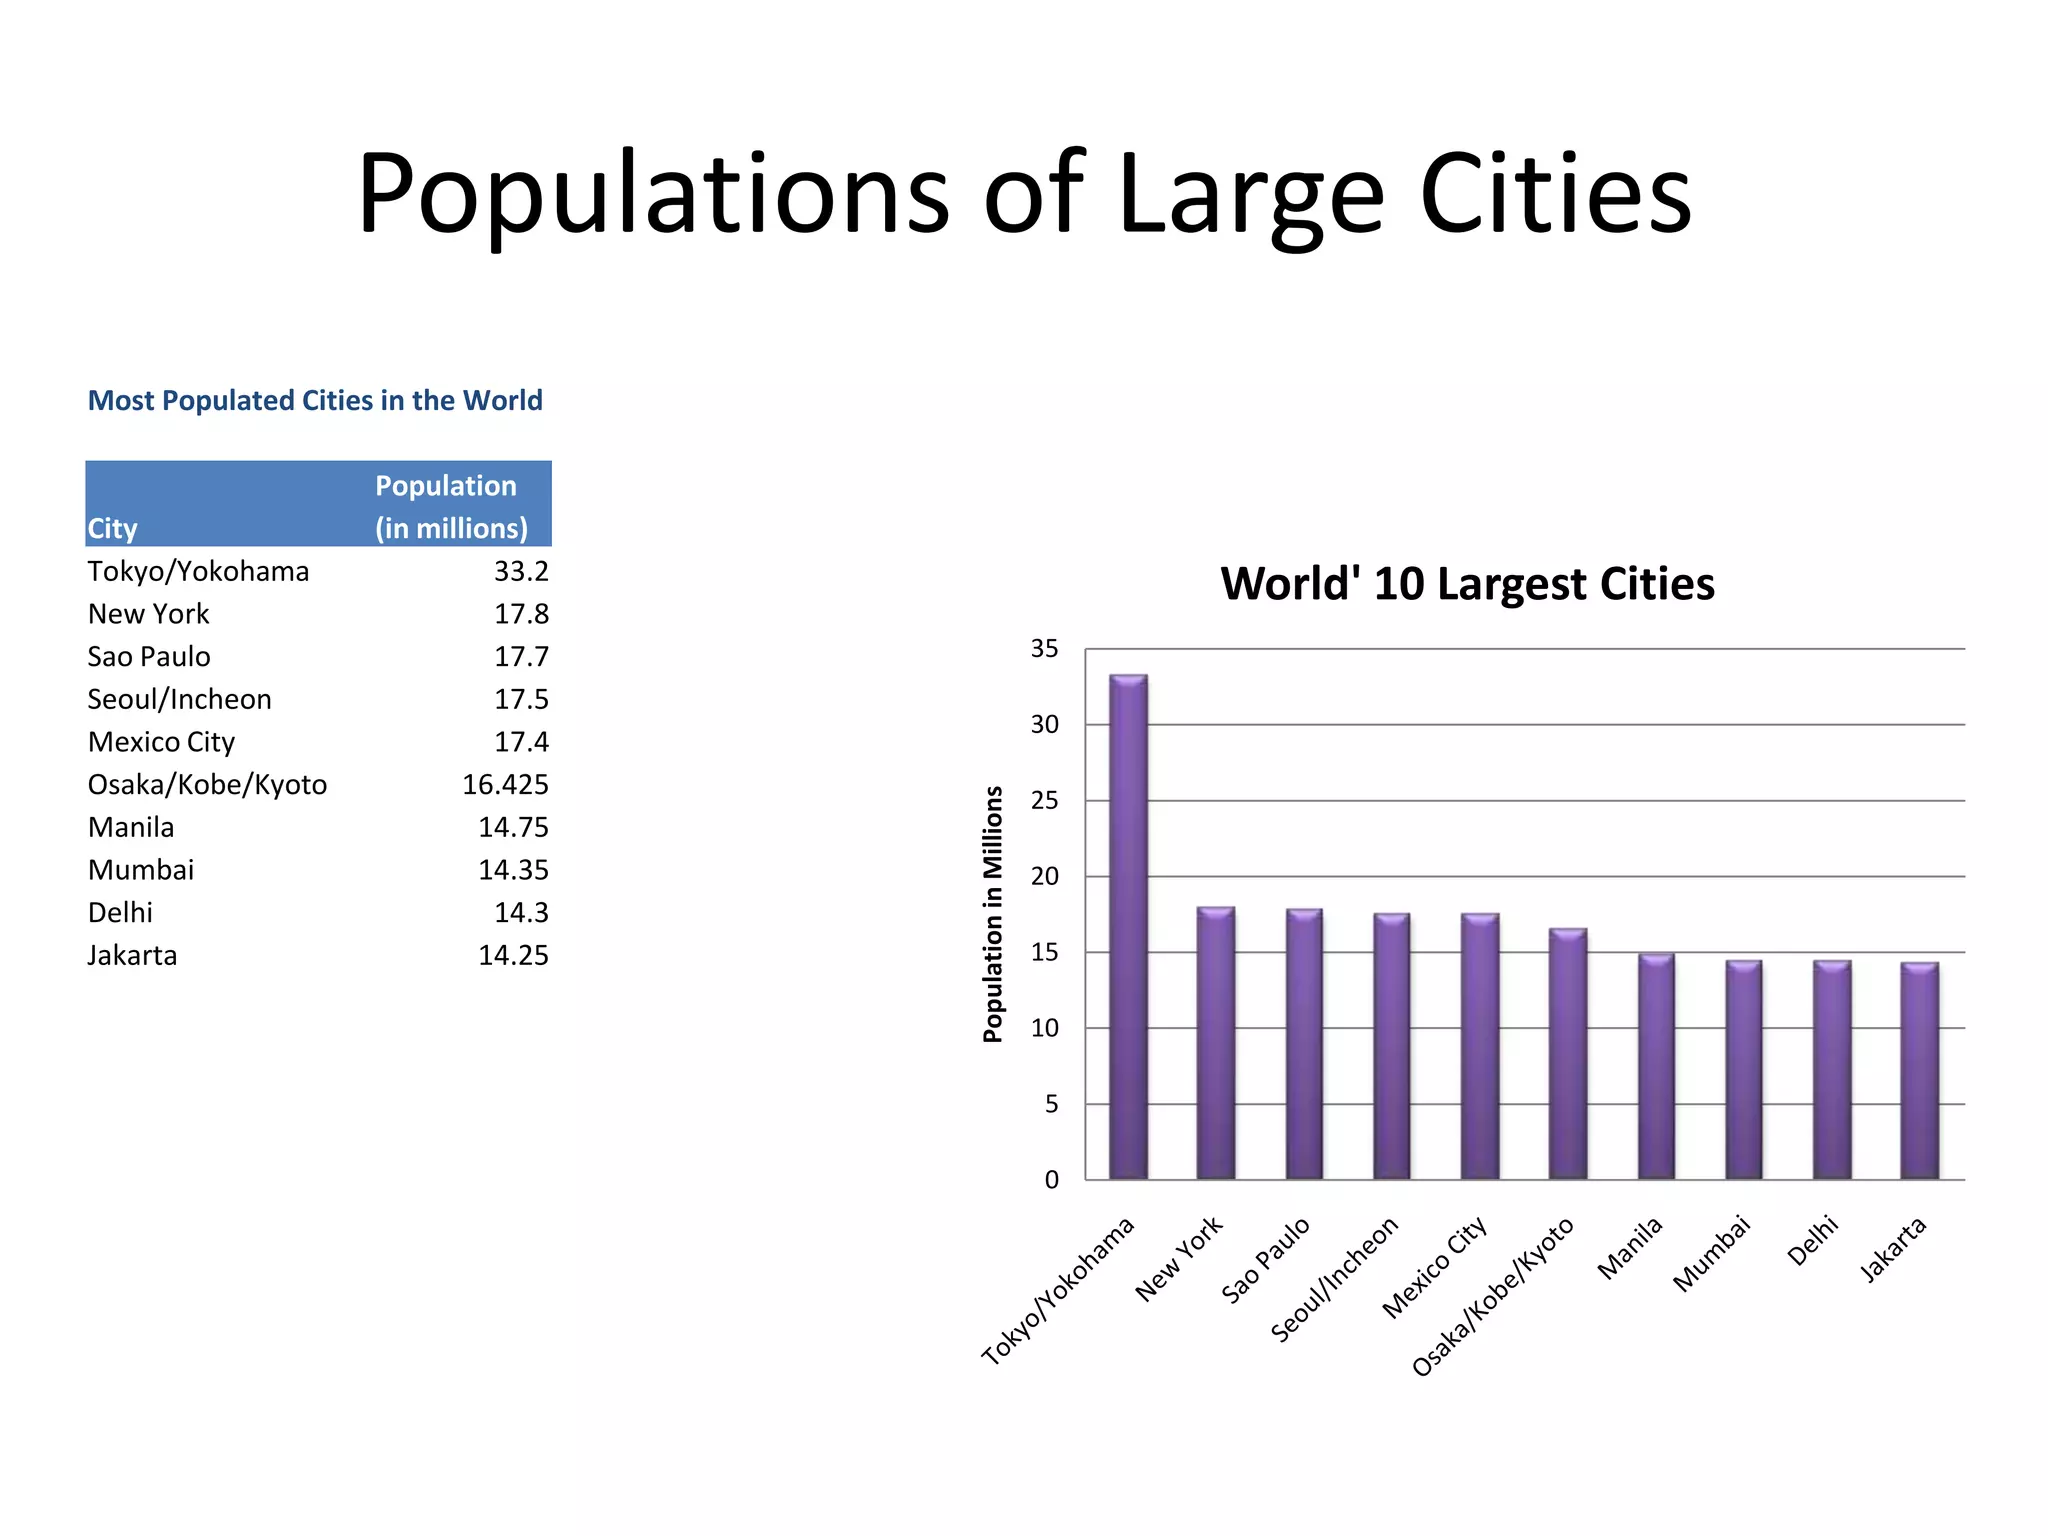
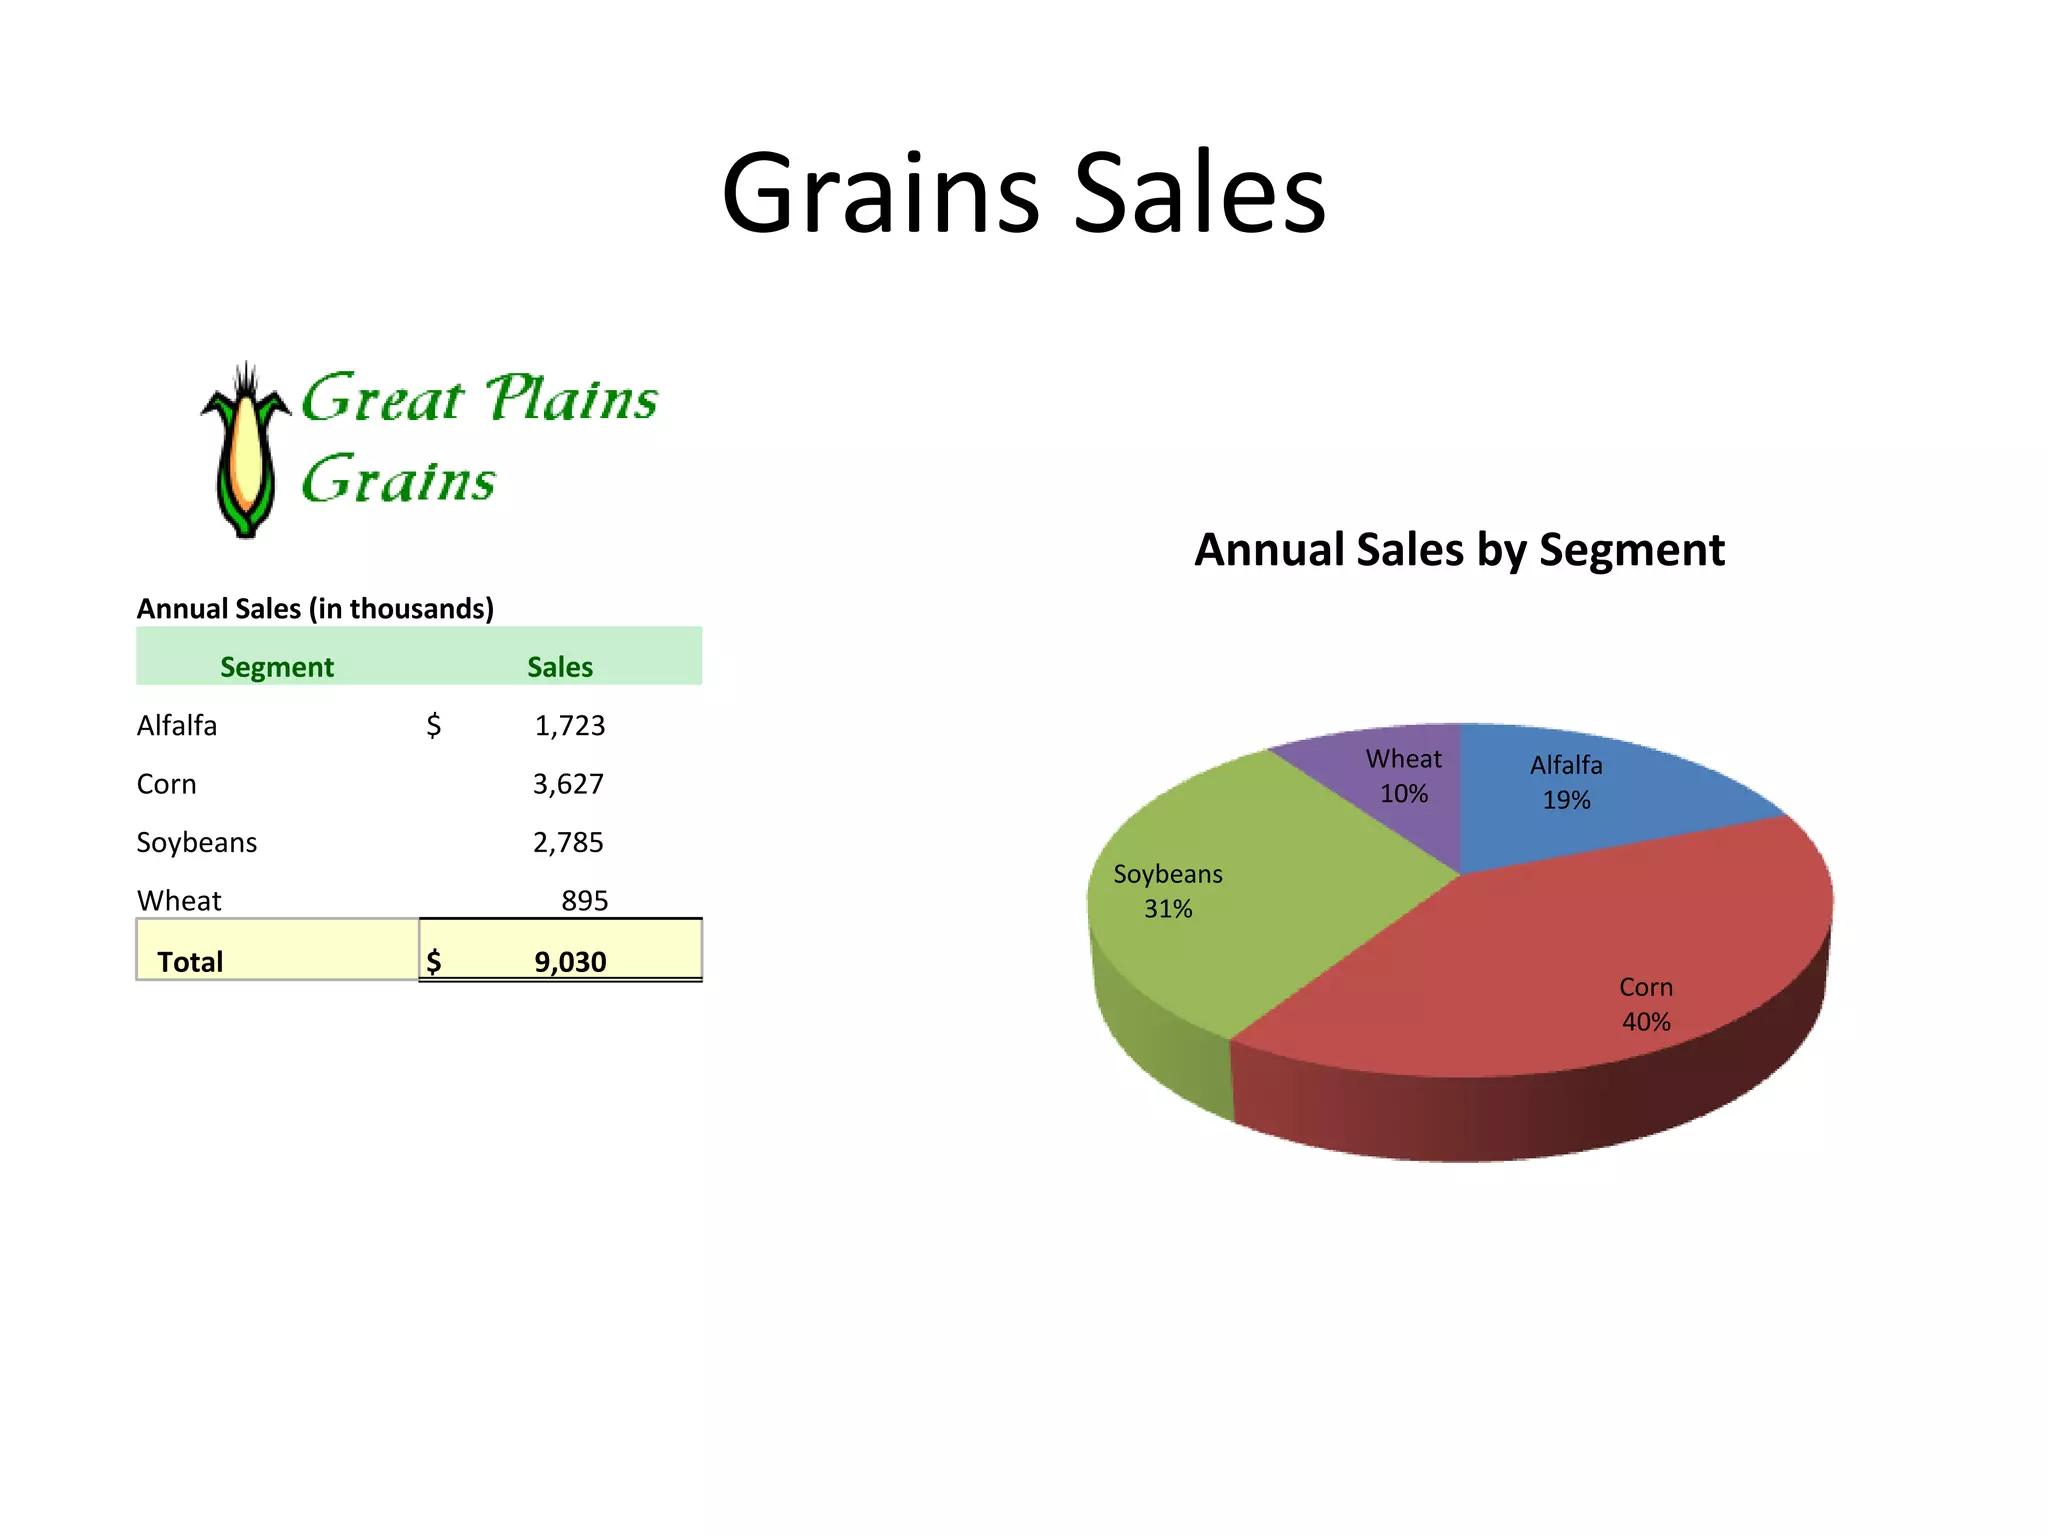
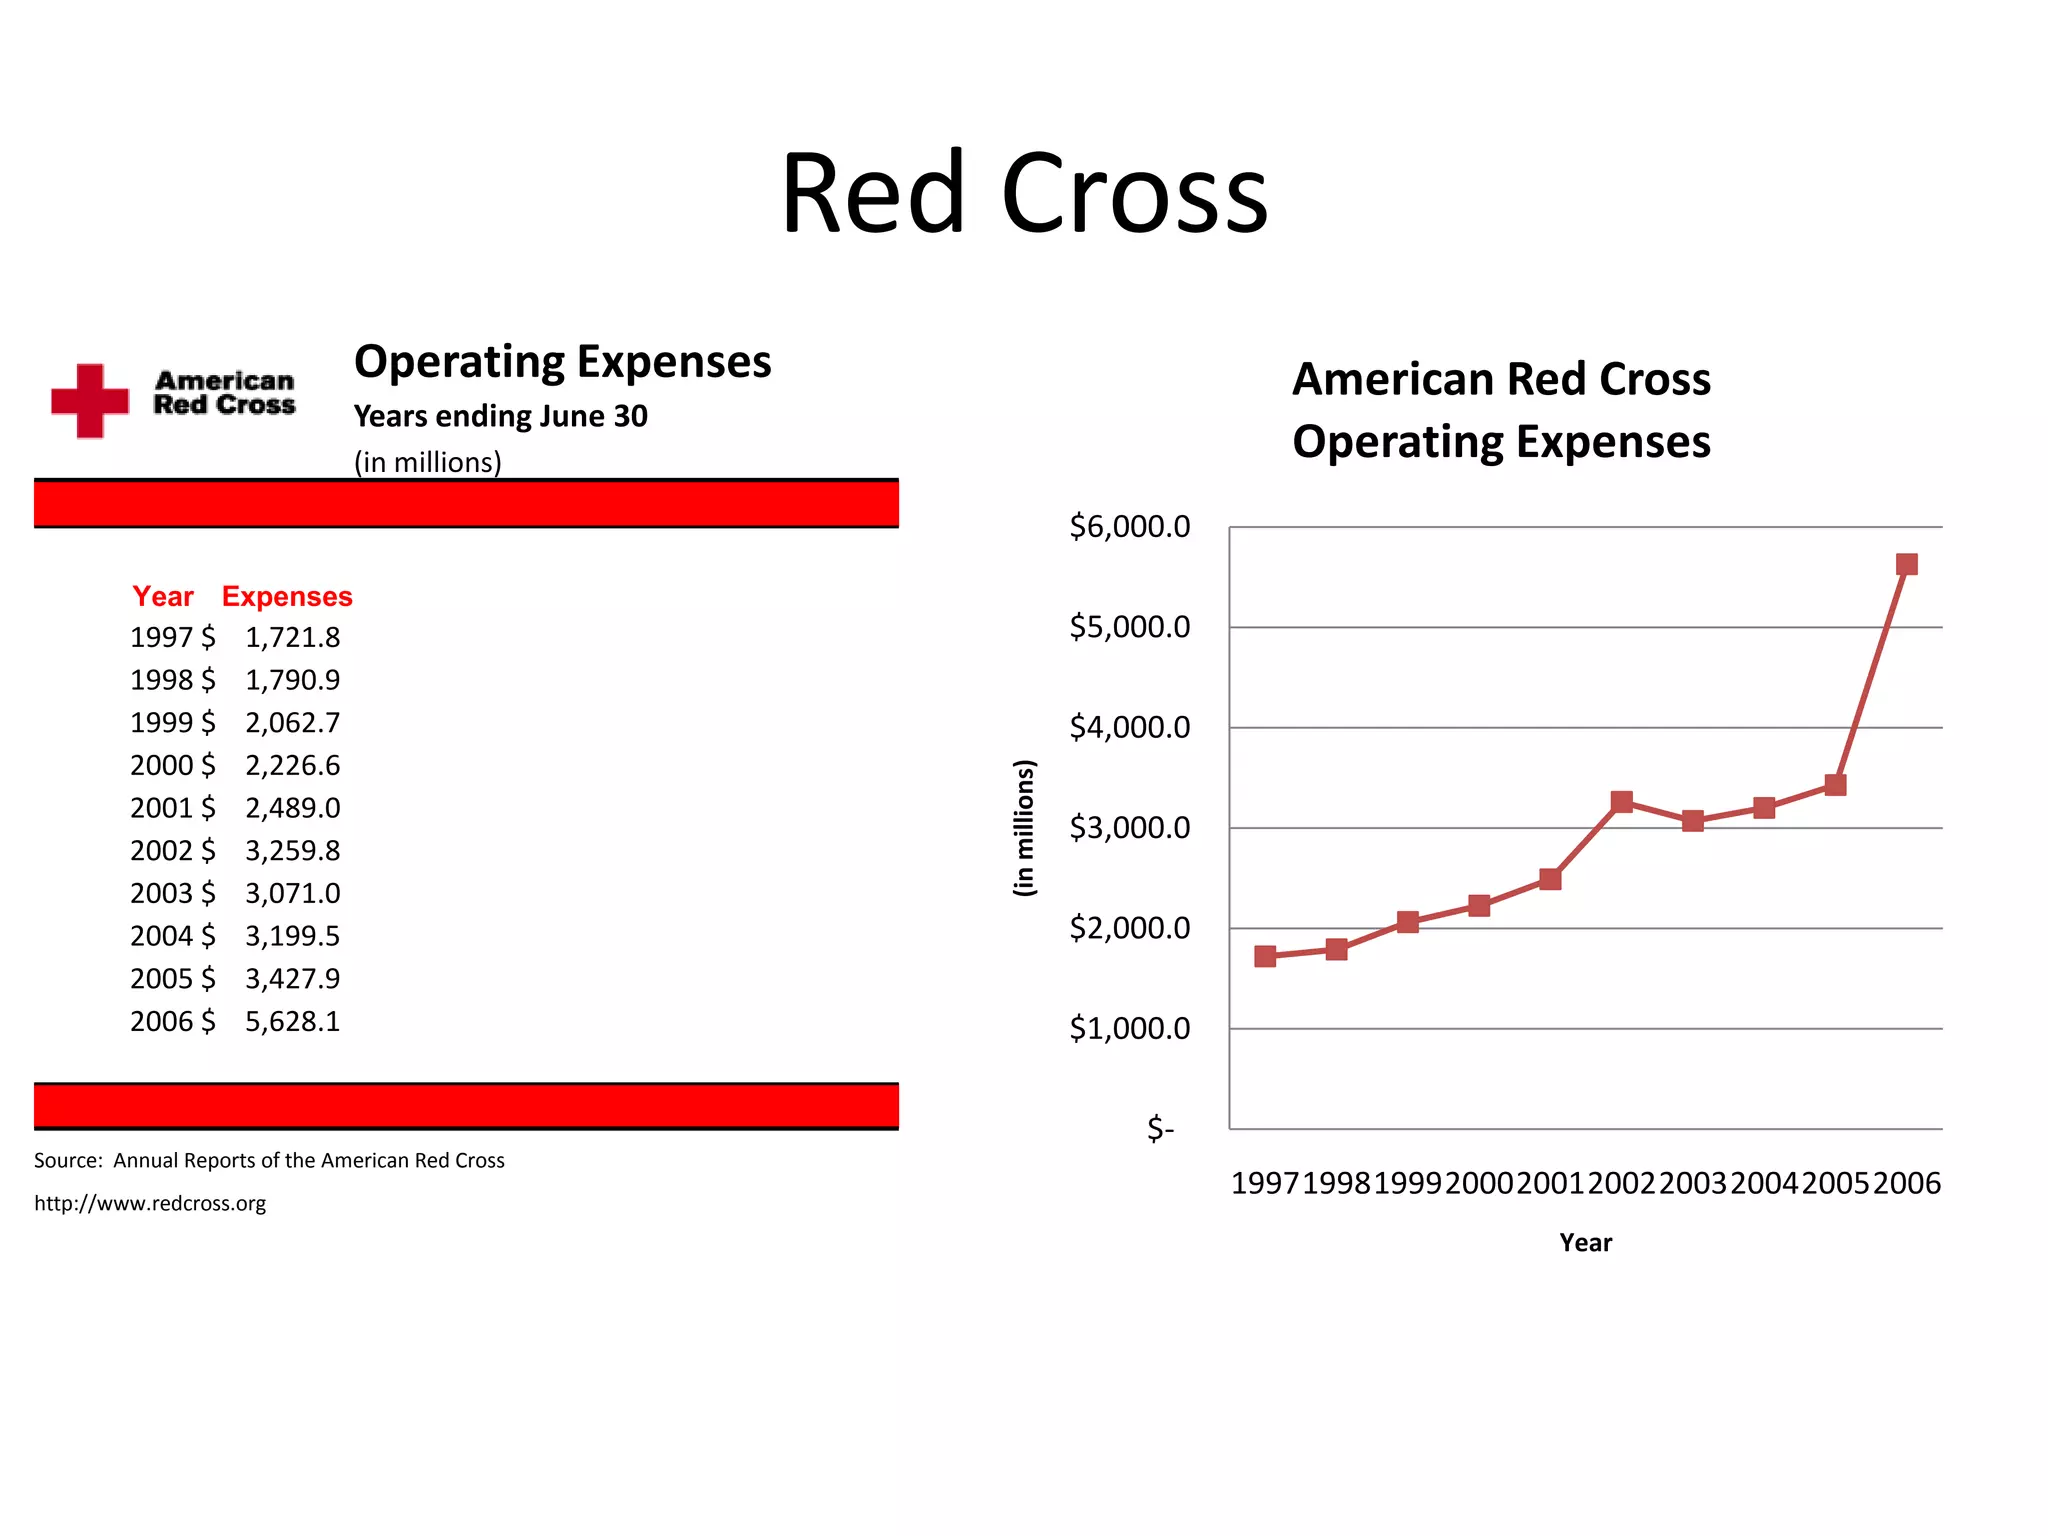
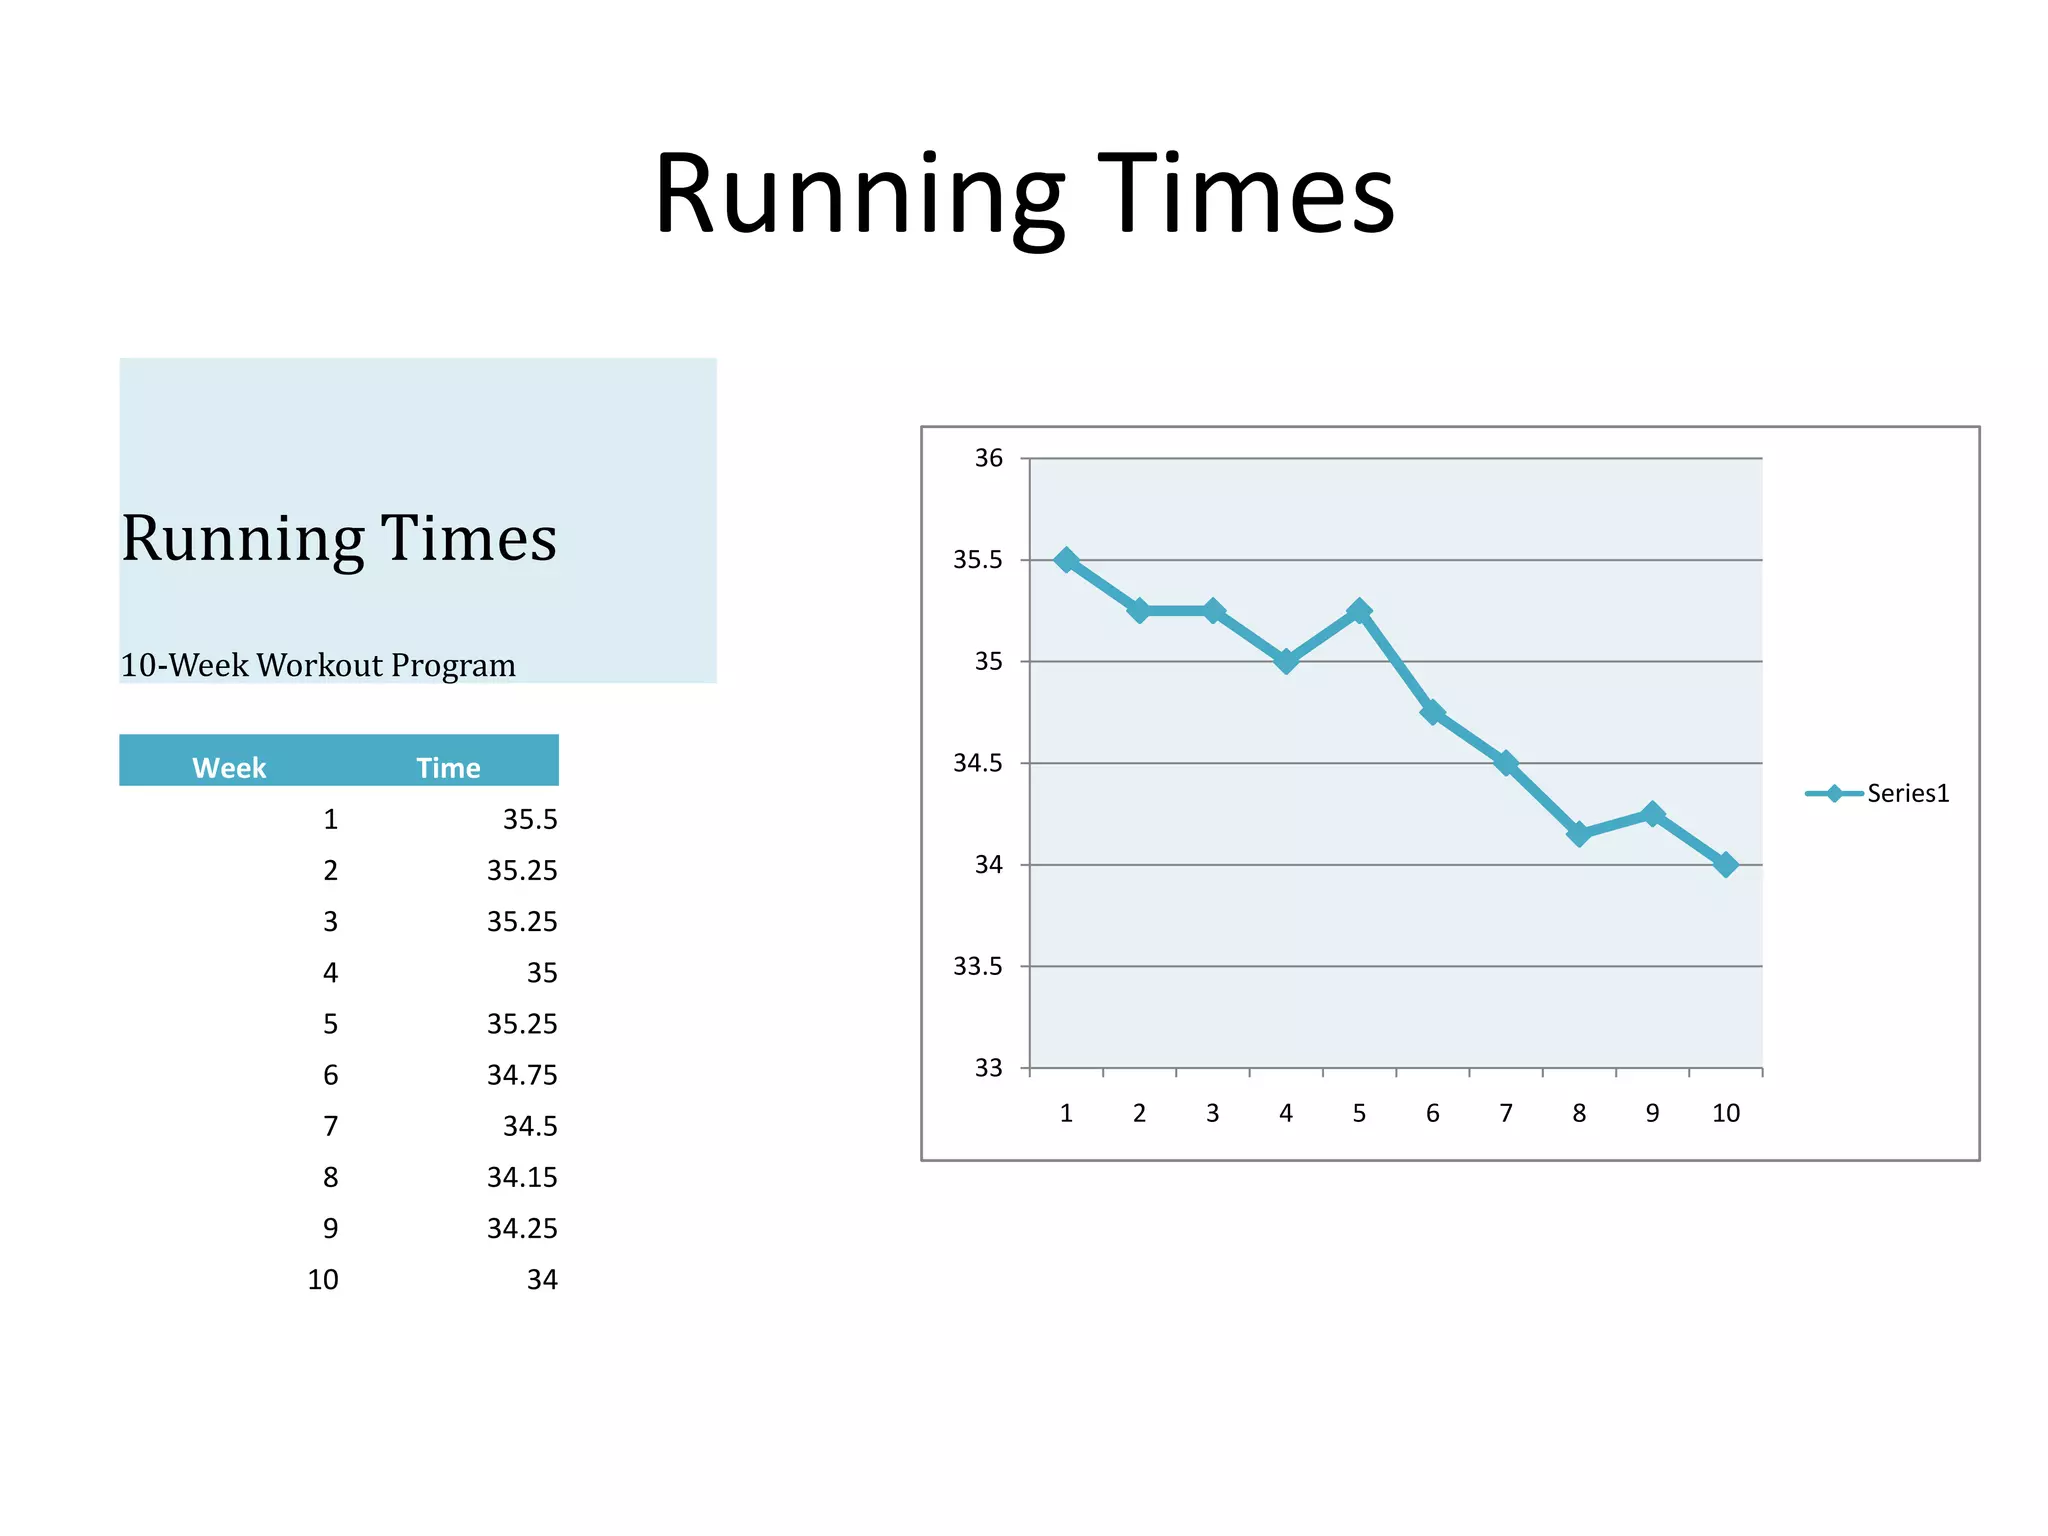
Lesson 8 Presentation

     Edward Tapia
Student Survey-Google Forms
            What’s your
           favorite shoe
              color?
Black                      16
Red                         0
Blue                        0
Grey                        1
Purple                      0
Other                       1
Education Pays
  Median Income by Education Level
           Education Level                            Men           Women
No high school diploma                          $      22,138   $     13,076
High scholl diploma                             $      31,683   $     20,179                           EDUCATION PAYS
Some college or associate's degree              $      39,601   $     25,736
Bachelor's degree                               $      53,693   $     26,250
Graduate or professional degree                 $      71,918   $     47,319                   80000
                                                                                               70000


                                                                               Median Income
                                                                                               60000
Source: U.S. Census Bureau, 2005 American Community Survey                                     50000
http://www.census.gov/prod/2006pubs/acs-02.pdf, page 13                                        40000
                                                                                               30000
                                                                                               20000
                                                                                               10000
                                                                                                   0


                                                                                                             Educational Level
Coronado Foundries
                                              Scrap
      Factory        Units Produced         Generated*

Colorado            7,259              110

Iowa 1              8,723              129

Iowa 2              10,548             245                                                  Production and Scrap Report
Kansas              5,211              50                                 250

Nevada              4,527              45                                 200

Oklahoma            9,914              149

                                                         Units of Scrap
                                                                          150
Texas 1             11,204             190
                                                                          100
Texas 2             8,564              100

Texas 3             6,799              75                                 50

Utah 1              7,612              150
                                                                           -
Utah 2              8,247              125                                      4,000   5,000   6,000   7,000       8,000        9,000   10,000   11,000   12,000

  Total             88,608             1,368                                                                    Units Produced


*Scrap is generated during the manufacturing process.
Populations of Large Cities
Most Populated Cities in the World

                     Population
City                 (in millions)
Tokyo/Yokohama                 33.2
New York                       17.8
                                                                    World' 10 Largest Cities
Sao Paulo                      17.7                            35
Seoul/Incheon                  17.5
                                                               30
Mexico City                    17.4
Osaka/Kobe/Kyoto             16.425


                                      Population in Millions
                                                               25
Manila                        14.75
Mumbai                        14.35                            20
Delhi                          14.3
Jakarta                       14.25                            15

                                                               10

                                                                5

                                                                0
Grains Sales

                                                  Annual Sales by Segment
Annual Sales (in thousands)
          Segment             Sales
Alfalfa              $        1,723
                                                         Wheat   Alfalfa
Corn                          3,627                       10%     19%
Soybeans                      2,785
                                             Soybeans
Wheat                           895            31%
 Total               $        9,030
                                                                           Corn
                                                                           40%
Red Cross
                                Operating Expenses                                       American Red Cross
                                Years ending June 30
                                (in millions)                                            Operating Expenses
                                                                           $6,000.0

          Year Expenses
         1997 $      1,721.8                                               $5,000.0
         1998 $      1,790.9
         1999 $      2,062.7                                               $4,000.0
         2000 $      2,226.6


                                                           (in millions)
         2001 $      2,489.0
                                                                           $3,000.0
         2002 $      3,259.8
         2003 $      3,071.0
         2004 $      3,199.5                                               $2,000.0
         2005 $      3,427.9
         2006 $      5,628.1                                               $1,000.0

                                                                                $-
Source: Annual Reports of the American Red Cross
http://www.redcross.org
                                                                                      1997199819992000200120022003200420052006
                                                                                                        Year
Running Times
                                      36


Running Times                        35.5


10-Week Workout Program               35


    Week         Time                34.5
                                                                                     Series1
            1            35.5
            2           35.25         34

            3           35.25
            4             35         33.5

            5           35.25
            6           34.75         33

            7            34.5               1   2   3   4   5   6   7   8   9   10

            8           34.15
            9           34.25
           10             34

Lesson 8 presentation

  • 1.
  • 2.
    Student Survey-Google Forms What’s your favorite shoe color? Black 16 Red 0 Blue 0 Grey 1 Purple 0 Other 1
  • 3.
    Education Pays Median Income by Education Level Education Level Men Women No high school diploma $ 22,138 $ 13,076 High scholl diploma $ 31,683 $ 20,179 EDUCATION PAYS Some college or associate's degree $ 39,601 $ 25,736 Bachelor's degree $ 53,693 $ 26,250 Graduate or professional degree $ 71,918 $ 47,319 80000 70000 Median Income 60000 Source: U.S. Census Bureau, 2005 American Community Survey 50000 http://www.census.gov/prod/2006pubs/acs-02.pdf, page 13 40000 30000 20000 10000 0 Educational Level
  • 4.
    Coronado Foundries Scrap Factory Units Produced Generated* Colorado 7,259 110 Iowa 1 8,723 129 Iowa 2 10,548 245 Production and Scrap Report Kansas 5,211 50 250 Nevada 4,527 45 200 Oklahoma 9,914 149 Units of Scrap 150 Texas 1 11,204 190 100 Texas 2 8,564 100 Texas 3 6,799 75 50 Utah 1 7,612 150 - Utah 2 8,247 125 4,000 5,000 6,000 7,000 8,000 9,000 10,000 11,000 12,000 Total 88,608 1,368 Units Produced *Scrap is generated during the manufacturing process.
  • 5.
    Populations of LargeCities Most Populated Cities in the World Population City (in millions) Tokyo/Yokohama 33.2 New York 17.8 World' 10 Largest Cities Sao Paulo 17.7 35 Seoul/Incheon 17.5 30 Mexico City 17.4 Osaka/Kobe/Kyoto 16.425 Population in Millions 25 Manila 14.75 Mumbai 14.35 20 Delhi 14.3 Jakarta 14.25 15 10 5 0
  • 6.
    Grains Sales Annual Sales by Segment Annual Sales (in thousands) Segment Sales Alfalfa $ 1,723 Wheat Alfalfa Corn 3,627 10% 19% Soybeans 2,785 Soybeans Wheat 895 31% Total $ 9,030 Corn 40%
  • 7.
    Red Cross Operating Expenses American Red Cross Years ending June 30 (in millions) Operating Expenses $6,000.0 Year Expenses 1997 $ 1,721.8 $5,000.0 1998 $ 1,790.9 1999 $ 2,062.7 $4,000.0 2000 $ 2,226.6 (in millions) 2001 $ 2,489.0 $3,000.0 2002 $ 3,259.8 2003 $ 3,071.0 2004 $ 3,199.5 $2,000.0 2005 $ 3,427.9 2006 $ 5,628.1 $1,000.0 $- Source: Annual Reports of the American Red Cross http://www.redcross.org 1997199819992000200120022003200420052006 Year
  • 8.
    Running Times 36 Running Times 35.5 10-Week Workout Program 35 Week Time 34.5 Series1 1 35.5 2 35.25 34 3 35.25 4 35 33.5 5 35.25 6 34.75 33 7 34.5 1 2 3 4 5 6 7 8 9 10 8 34.15 9 34.25 10 34