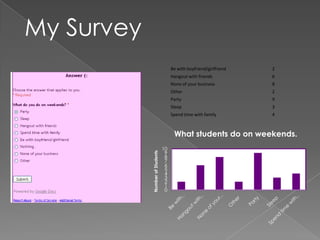
The third document displays the results of a survey asking students what they do on weekends. Partying was the most popular response at 9 students, while hanging out with friends was second most popular at 6 students.
Education Pays
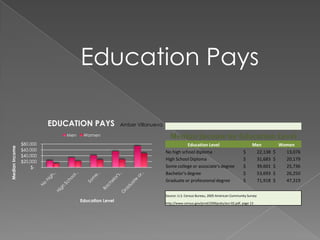
EDUCATION PAYS Amber Villanueva
Men Women Median Income by Education Level
$80,000 Education Level Men Women
Median Income
$60,000 No high school diploma $ 22,138 $ 13,076
$40,000
High School Diploma $ 31,683 $ 20,179
$20,000
$- Some college or associate's degree $ 39,601 $ 25,736
Bachelor's degree $ 53,693 $ 26,250
Graduate or professional degree $ 71,918 $ 47,319
Source: U.S. Census Bureau, 2005 American Community Survey
Education Level
http://www.census.gov/prod/2006pubs/acs-02.pdf, page 13
Amber Villanueva
Production and Scrap Report
P2
250
200
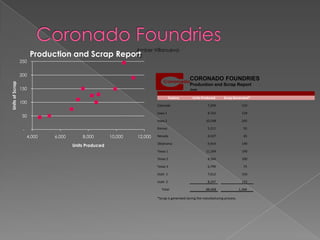
CORONADO FOUNDRIES
Units of Scrap
Production and Scrap Report
150 June
Factory Units Produced Scrap Generated*
100
Colorado 7,259 110
Iowa 1 8,723 129
50
Iowa 2 10,548 245
- Kansas 5,211 50
4,000 6,000 8,000 10,000 12,000 Nevada 4,527 45
Oklahoma 9,914 149
Units Produced
Texas 1 11,204 190
Texas 2 8,564 100
Texas 3 6,799 75
Utah 1 7,612 150
Utah 2 8,247 125
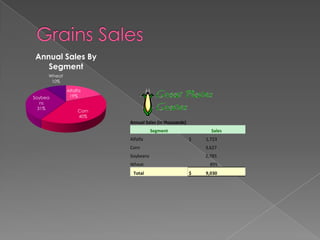
Total 88,608 1,368
*Scrap is generated during the manufacturing process.
5.
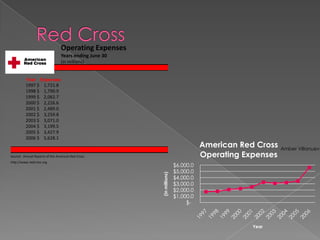
Operating Expenses
Years ending June 30
(in millions)
Year Expenses
1997 $ 1,721.8
1998 $ 1,790.9
1999 $ 2,062.7
2000 $ 2,226.6
2001 $ 2,489.0
2002 $ 3,259.8
2003 $ 3,071.0
2004 $ 3,199.5
2005 $ 3,427.9
2006 $ 5,628.1
American Red Cross Amber Villanueva
Source: Annual Reports of the American Red Cross Operating Expenses
http://www.redcross.org
$6,000.0
$5,000.0
(in millions)
$4,000.0
$3,000.0
$2,000.0
$1,000.0
$-
Year
6.
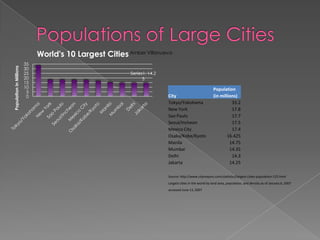
World's 10 LargestCities Amber Villanueva
35
Population in Millions
30
25 Series1, 14.2
20 5
15
10 Population
5
0 City (in millions)
Tokyo/Yokohama 33.2
New York 17.8
Sao Paulo 17.7
Seoul/Incheon 17.5
Mexico City 17.4
Osaka/Kobe/Kyoto 16.425
Manila 14.75
Mumbai 14.35
Delhi 14.3
Jakarta 14.25
Source: http://www.citymayors.com/statistics/largest-cities-population-125.html
Largest cities in the world by land area, population, and density as of January 6, 2007
accessed June 13, 2007
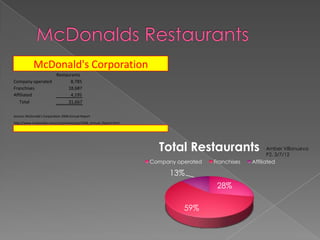
McDonald's Corporation
Restaurants
Company operated 8,785
Franchises 18,687
Affiliated 4,195
Total 31,667
Source: McDonald's Corporation 2006 Annual Report
http://www.mcdonalds.com/corp/invest/pub/2006_Annual_Report.html
Total Restaurants Amber Villanueva
P2. 3/7/12
Company operated Franchises Affiliated
13%
28%
59%
9.
Entertainme
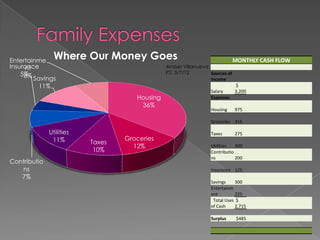
Where Our Money Goes MONTHLY CASH FLOW
Insurance
nt Amber Villanueva
5% P2. 3/7/12 Sources of
8% Savings Income
11% $
Salary 3,200
Housing Expenses
36%
Housing 975
Groceries 315
Utilities Taxes 275
11% Groceries
Taxes
12% Utilities 300
10% Contributio
ns 200
Contributio
ns Insurance 125
7%
Savings 300
Entertainm
ent 225
Total Uses $
of Cash 2,715
Surplus $485
10.
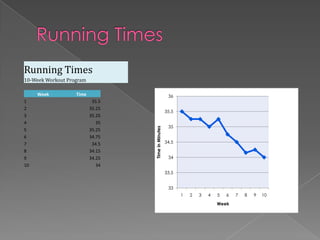
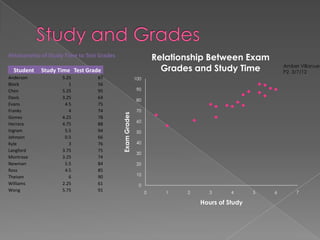
Relationship of StudyTime to Test Grades Relationship Between Exam
Student Study Time Test Grade Grades and Study Time Amber Villanuev
P2. 3/7/12
Anderson 5.25 87 100
Block 1 56
Chen 5.25 95 90
Davis 3.25 64
80
Evans 4.5 75
Franks 4 74 70
Exam Grades
Gomez 4.25 78
60
Herrera 4.75 88
Ingram 5.5 94 50
Johnson 0.5 66
Kyle 3 76 40
Langford 3.75 75
30
Montrose 3.25 74
Newman 5.5 84 20
Ross 4.5 85
Theisen 6 90 10
Williams 2.25 61 0
Wong 5.75 91 0 1 2 3 4 5 6 7
Hours of Study
11.
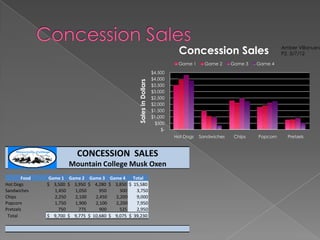
Concession Sales Amber Villanuev
P2. 3/7/12
Game 1 Game 2 Game 3 Game 4
$4,500
$4,000
Sales in Dollars
$3,500
$3,000
$2,500
$2,000
$1,500
$1,000
$500
$-
Hot Dogs Sandwiches Chips Popcorn Pretzels
CONCESSION SALES
Mountain College Musk Oxen
Food Game 1 Game 2 Game 3 Game 4 Total
Hot Dogs $ 3,500 $ 3,950 $ 4,280 $ 3,850 $ 15,580
Sandwiches 1,450 1,050 950 300 3,750
Chips 2,250 2,100 2,450 2,200 9,000
Popcorn 1,750 1,900 2,100 2,200 7,950
Pretzels 750 775 900 525 2,950
Total $ 9,700 $ 9,775 $ 10,680 $ 9,075 $ 39,230
12.
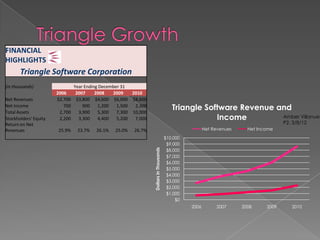
FINANCIAL
HIGHLIGHTS
Triangle Software Corporation
(in thousands) Year Ending December 31
2006 2007 2008 2009 2010
Net Revenues $2,700 $3,800 $4,600 $6,000 $8,600
Net Income
Total Assets
700
2,700
900
3,900
1,200
5,300
1,500 2,300
7,300 10,000
Triangle Software Revenue and
Stockholders' Equity 2,200 3,300 4,400 5,200 7,000 Income Amber Villanuev
Return on Net P2. 3/8/12
Revenues 25.9% 23.7% 26.1% 25.0% 26.7% Net Revenues Net Income
$10,000
$9,000
Dollars in Thousands
$8,000
$7,000
$6,000
$5,000
$4,000
$3,000
$2,000
$1,000
$0
2006 2007 2008 2009 2010
13.
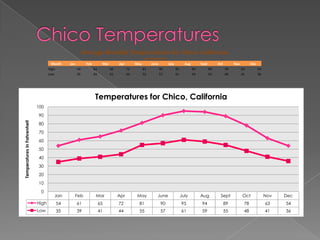
Average Monthly Temperaturesfor Chico, California
(in Fahrenheit)
Month Jan Feb Mar Apr May June July Aug Sept Oct Nov Dec
High 54 61 65 72 81 90 95 94 89 78 63 54
Low 35 39 41 44 55 57 61 59 55 48 41 36
Temperatures for Chico, California
100
90
Temperatures in Fahrenheit
80
70
60
50
40
30
20
10
0
Jan Feb Mar Apr May June July Aug Sept Oct Nov Dec
High 54 61 65 72 81 90 95 94 89 78 63 54
Low 35 39 41 44 55 57 61 59 55 48 41 36
14.
My Survey
Be with boyfriend/girlfriend 2
Hangout with friends 6
None of your business 8
Other 2
Party 9
Sleep 3
Spend time with family 4
What students do on weekends.
10
9
Number of Students 8
7
6
5
4
3
2
1
0