Downloaded 12 times
![20/05/14 17:44Good Ol' Excel Is The Ultimate Data Visualization Tool (In Most Cases)
Página 9 de 17http://insights.qunb.com/good-ol-excel-is-the-ultimate-data-visualization-tool-in-most-cases
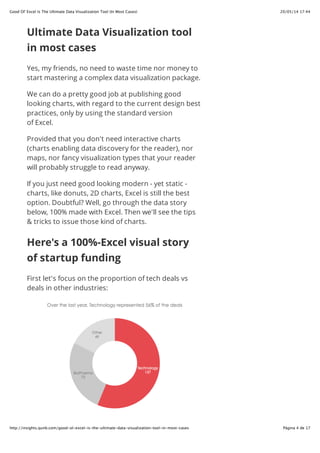
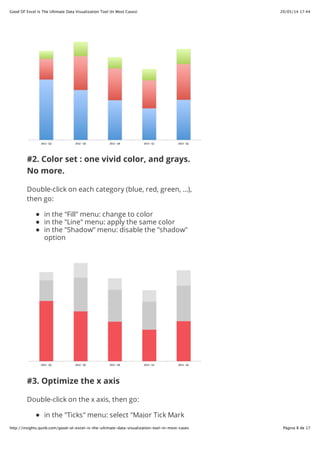
in the "Ticks" menu: select "Major Tick Mark
Type" [none]
In the "Fill" menu: change Color from
[Automatic] to [No Fill]
in the "Line" menu : change Color from
[Automatic] to [no Line]
Then tweak the x axis labels:
Change the font (Calibri smells MS Office like
hell). I personally like "Century Gothic".
Enlarge the font
Chage the Font Color (black => gray)
#4. Add Data Labels
Legends should be banned from Excel. You should
make sure you use direct labelling only, not only for
values, but also for your categories. Here is a little
trick.
First add data labels on every category (right click >
"Add Data Labels"). Change the font, the font size, and
the font color.](https://image.slidesharecdn.com/goodolexcelistheultimatedatavisualizationtoolinmostcases-140618183513-phpapp02/85/Good-ol-excel-is-the-ultimate-data-visualization-tool-in-most-cases-9-320.jpg)
![20/05/14 17:44Good Ol' Excel Is The Ultimate Data Visualization Tool (In Most Cases)
Página 12 de 17http://insights.qunb.com/good-ol-excel-is-the-ultimate-data-visualization-tool-in-most-cases
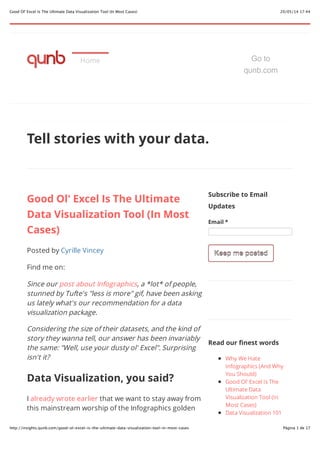
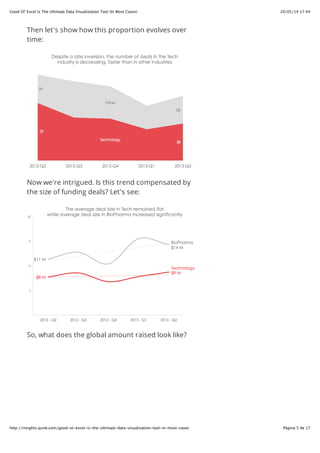
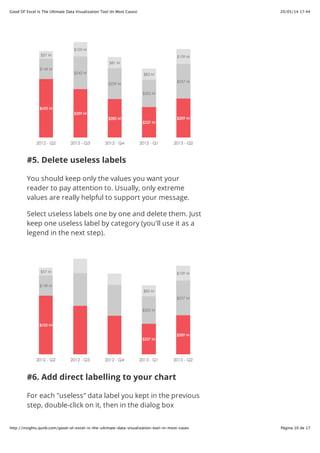
#8. Remove frames and borders
If you copy your chart like this, you'll see an ugly
border. Go in the "Chart Format" dialog box (right
click outside the plotting area > "Format Chart Area").
Then
In the "Fill" menu: change Color from
[Automatic] to [No Fill]
In the "Line" menu: change Color from
[Automatic] to [No Line]
Your chart is ready to get copied and paste wherever
you want.
Congrats, your data looks better
naked, just with excel
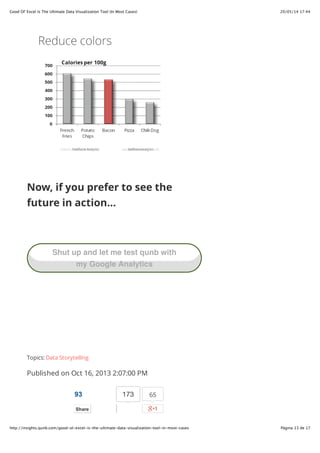
To conclude, here's a Darkhorse Analytics's awesome
gif summarizing this loooooong post.](https://image.slidesharecdn.com/goodolexcelistheultimatedatavisualizationtoolinmostcases-140618183513-phpapp02/85/Good-ol-excel-is-the-ultimate-data-visualization-tool-in-most-cases-12-320.jpg)


![20/05/14 17:44Good Ol' Excel Is The Ultimate Data Visualization Tool (In Most Cases)
Página 16 de 17http://insights.qunb.com/good-ol-excel-is-the-ultimate-data-visualization-tool-in-most-cases
• Reply •
actions; when the two are confused the decisions
made and the actions taken make matters (the
process' performance) worse.
["In the land of the blind, the one-eyed man is
king."]
1
• Reply •
Jordan Goldmeier
• 7 months ago
waynergf
I was thinking the same thing - perhaps not
has harshly - but it's fair to say Tufte would
not approve of the solution attributed to him
here.
• Reply •
The Daily Graph • 7 months ago
Couldn't have said it better. There is a blog at
http://www.apptrac.net/en/blog... about using
Excel to
re-create charts that have appeared on the website
of The Economist.
It's all plain-vanilla Excel, no macros or VBA, and
you can download
workbooks with the charts for free.
1
• Reply •
Cyrille Vincey
• 7 months ago
The Daily Graph
Awesome site, we've just spent 1h on
apptrac. Thanks for the link!
• Reply •
Chris • 7 months ago
Might want to fix the typo unless this was done on
purpose. Also, great post. Never thought about
simplifying the charts to make them look more
elegant.
"To conclude, here's a Darkhorse Analytics's
awesome gif summarizing this loooooonb post."
• Reply •
Cyrille Vincey • 7 months agoChris
Oops. Done. Thanks Chris.
Share ›
Share ›
Share ›
Share ›
Share ›
Share ›](https://image.slidesharecdn.com/goodolexcelistheultimatedatavisualizationtoolinmostcases-140618183513-phpapp02/85/Good-ol-excel-is-the-ultimate-data-visualization-tool-in-most-cases-16-320.jpg)

This document discusses how Excel can be an effective data visualization tool with some modifications. It provides an 8-step process to improve Excel charts based on Edward Tufte's principles of data visualization. This includes removing unnecessary elements, limiting the color palette, optimizing axes, adding direct data labels, and removing borders/frames. An example visualization of startup funding data is presented to demonstrate how Excel charts can be "tufterized" to provide clean, informative visuals. With some tweaks, Excel remains a useful option for basic static visualizations in many cases.