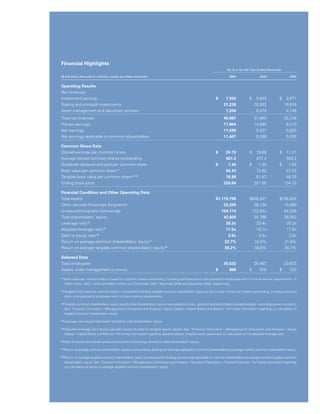
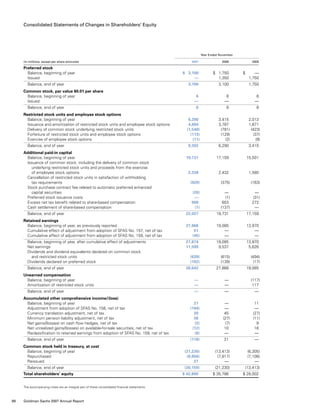
goldman sachs
2007 annual report
We See Opportunity
www.gs.com
WESEEOPPORTUNITYgoldmansachs2007annualreport
Every day,
we see unique opportunities for growth — 
for our clients and for Goldman Sachs. With
expanding markets and growing capital flows, in
countries around the world, amidst constantly
shifting conditions, we see new potential and new
challenges.
As long-term growth and global finance continue
to transform economies even in challenging
circumstances, capital markets will play an
increasingly vital role as people, capital and ideas
come together in new ways. Goldman Sachs
helps allocate capital and manage risk, and thus
helps foster entrepreneurship, drive efficiency
and encourage economic reform.
As this year’s report illustrates, our clients’
aspirations and the risks they take drive change.
Clients fund strategic initiatives, build new
businesses and strengthen existing ones.
They look for new ways to improve investment
performance and take advantage of the
opportunities that arise every day.
1
Our clients’ interests always come first. Our experience shows
that if we serve our clients well, our own success will follow.
2
Our assets are our people, capital and reputation. If any of these
is ever diminished, the last is the most difficult to restore. We are
dedicated to complying fully with the letter and spirit of the laws,
rules and ethical principles that govern us. Our continued success
depends upon unswerving adherence to this standard.
3
Our goal is to provide superior returns to our shareholders.
Profitability is critical to achieving superior returns, building our
capital, and attracting and keeping our best people. Significant
employee stock ownership aligns the interests of our employees
and our shareholders.
4
We take great pride in the professional quality of our work.
We have an uncompromising determination to achieve excellence
in everything we undertake. Though we may be involved in a
wide variety and heavy volume of activity, we would, if it came
to a choice, rather be best than biggest.
5
We stress creativity and imagination in everything we do.
While recognizing that the old way may still be the best way, we
constantly strive to find a better solution to a client’s problems.
We pride ourselves on having pioneered many of the practices
and techniques that have become standard in the industry.
6
We make an unusual effort to identify and recruit the very best
person for every job. Although our activities are measured in
billions of dollars, we select our people one by one. In a service
business, we know that without the best people, we cannot be
the best firm.
7
We offer our people the opportunity to move ahead more rapidly
than is possible at most other places. Advancement depends on
merit and we have yet to find the limits to the responsibility our
best people are able to assume. For us to be successful, our men
and women must reflect the diversity of the communities and
cultures in which we operate. That means we must attract, retain
and motivate people from many backgrounds and perspectives.
Being diverse is not optional; it is what we must be.
8
We stress teamwork in everything we do. While individual
creativity is always encouraged, we have found that team effort
often produces the best results. We have no room for those
who put their personal interests ahead of the interests of the firm
and its clients.
9
The dedication of our people to the firm and the intense
effort they give their jobs are greater than one finds in most
other organizations. We think that this is an important part
of our success.
10
We consider our size an asset that we try hard to preserve. We
want to be big enough to undertake the largest project that
any of our clients could contemplate, yet small enough to maintain
the loyalty, the intimacy and the esprit de corps that we all
treasure and that contribute greatly to our success.
11
We constantly strive to anticipate the rapidly changing needs
of our clients and to develop new services to meet those needs.
We know that the world of finance will not stand still and that
complacency can lead to extinction.
12
We regularly receive confidential information as part of our
normal client relationships. To breach a confidence or to use
confidential information improperly or carelessly would be
unthinkable.
13
Our business is highly competitive, and we aggressively seek to
expand our client relationships. However, we must always be fair
competitors and must never denigrate other firms.
14
Integrity and honesty are at the heart of our business. We expect
our people to maintain high ethical standards in everything
they do, both in their work for the firm and in their personal lives.
The Goldman Sachs Business Principles
objectives are often multifaceted and difficult to
execute. Solutions to their complex problems can
create significant value for corporations, investors
and the societies they serve.
Goldman Sachs advises, finances and invests in
client initiatives in both well-established and
emerging economies. We operate at the center of
the global markets, offering clients products and
services that help them manage and take advantage
of the unique opportunities they face.
Our people and the culture they represent are the
foundation of our ability to create value for clients.
Teamwork, integrity and a daily commitment to
excellence are the hallmarks of our culture. In 2007,
clients both new and long-standing, in markets
both emerging and well-established, have valued
Goldman Sachs’ deep understanding of the ever-
changing global markets as a source of advice and
outstanding execution.
Our clients’
1Goldman Sachs 2007 Annual Report
Lloyd Blankfein, Chairman and Chief Executive Officer
In last year’s letter, we discussed
Goldman Sachs’ performance
within the context of favorable
market and economic conditions.
We also said that our job is to
plan for markets and conditions
that won’t always be as benign.
While the first half of 2007 was largely
characterized by a positive operating environment,
the latter half of the year saw significant
turbulence across global markets. Despite these
more difficult conditions, Goldman Sachs
produced very strong performance for the year
because of the talent and dedication of our
people, a culture of teamwork and a deep and
broad client franchise.
In 2007, net revenues increased 22 percent to
$46.0 billion and net earnings rose 22 percent to
$11.6 billion. Diluted earnings per common
share were $24.73, an increase of 26 percent from
$19.69 for the previous year. Our return on
average common shareholders’ equity was
32.7 percent. The firm also returned $9 billion
of capital to shareholders by repurchasing
41 million shares of our common stock. Book
value per common share increased 25 percent
during 2007, and has grown from $20.94 at the
Fellow
Shareholders:
3Goldman Sachs 2007 Annual Report
Gary D. Cohn, President and Co-Chief Operating Officer
Jon Winkelried, President and Co-Chief Operating Officer
3Goldman Sachs 2007 Annual Report
end of our first year as a public company in
1999 to $90.43, a compounded annual growth rate
of 20 percent over this period.
As we have stated before, our business does not lend
itself to predictable earnings. However, over the long
term, we are committed to the goal of providing
our shareholders with returns on equity at or near the
top of our industry while continuing to grow book
value and earnings per share.
In this year’s letter, we will discuss some of the
changes that financial markets are undergoing and
how the firm’s institutional strengths help us to
respond to these changes. In particular, we want to
highlight what we believe to be the differentiating
element of Goldman Sachs — our culture — and how
it infuses our approach to risk management and
client service. While the value of “culture” may not
lend itself to empirical analysis, we know that it is
the bedrock of our financial performance.
The Credit Cycle
During the last several years, the global economy
has benefited from a number of developments.
The global integration of markets and economies,
the rise of emerging markets, the growth of private
pools of capital and the ability of central banks
to combat inflation coalesced to help make capital
historically cheap.
A world awash in liquidity led to an influx of
investments across different asset classes and markets.
We saw significant increases in real estate prices,
for instance, and a growing role for financial
sponsors in global MA. Significant value was
being created, but many were asking if a credit
bubble was taking shape.
Not surprisingly, the broad availability of credit had
implications on the pricing of risk. As capital flows
increased around the world, the search for excess
yield drove credit spreads down to unprecedented
levels. The tightness in credit spreads, extraordinarily
low default rates and the run-up in housing prices
in the U.S. and much of Europe simply were not
sustainable.
In hindsight, it seems easy to identify precisely what
happened. In the day-to-day management of our
business, identifying a bubble and calling its exact
end is much more difficult. As the number one global
adviser in MA, we are also a significant financier
of many of the largest corporate transactions. As a
co-investor with our clients, we are active in private
equity and real estate investing. In our mortgage
business, we price assets and structure securities for
institutions and other large investors.
Our strong market share comes, in part, from the
fact that we are active in these and other markets,
and because we are willing to assume risk on behalf
of our clients. But, at the same time, when conditions
deteriorate, losses are unavoidable. And in the course
of the year, we were not immune to them.
The Strength of our Client Franchise
Some commentators have speculated that our overall
performance was due to a few so-called smart bets
to mitigate losses. The fact is that we have a diverse
set of businesses and no single business or trading
opportunity dictated our performance.
What drove performance was the quality of our
client franchise. To us, franchise describes the extent
to which clients come to us for advice, execution
and, sometimes, partnership. And through these
relationships, business opportunities are made available
to the firm.
In Investment Banking, we have a broad franchise
that serves corporations, financial sponsors, institutions
and governments. In the last year, we advised on
each of the five largest sponsor transactions. When
conditions became more difficult over the summer,
clients sought us out as an advisor in challenging
situations they faced — for example, Countrywide,
Home Depot Supply and, in connection with Northern
Rock, the U.K. Treasury, the Bank of England and
the Financial Services Authority.
During the same period, we priced an $896 million
equity offering for Apollo Management on our
innovative GSTrUE platform, which we developed
earlier in the year. GSTrUE pioneered the offering
and trading of privately placed securities, bringing
4 Goldman Sachs 2007 Annual Report
the liquidity of an exchange with the flexibility
of a private placement. We are proud that
GSTrUE will be integrated into The PORTAL 
Alliance — an industry-wide platform for the
trading of unregistered securities.
Investment Banking remains the front end of our
growing franchise. This is particularly true within
the context of our principal investing activity. The
majority of our principal investing opportunities are
sourced through our client franchise as clients seek
us out as a co-investor and other principals seek us
out as partners. And while retaining our leadership
position in global MA, we also launched merchant
banking funds with aggregate commitments of
$50 billion during the year.
In our Securities businesses, we are, first and foremost,
a market maker. We price assets, manage risk and
execute transactions on behalf of our clients. This
was particularly visible during the many tumultuous
trading days during the summer. On some occasions,
our U.S. shares trading platforms processed over two
billion shares a day, more than double our average
volume. We also experienced record customer activity
in our credit, rates and currency businesses, not
only during the summer, but for much of the year.
In our Asset Management business, we manage
$868 billion in total assets under management.
In the last year alone, we attracted inflows of
$161 billion. Our ability to offer clients access
to a broad range of investment strategies, from
active equity to private equity fund of funds, to
plain vanilla fixed income and money market
products has been a key differentiating factor.
There are, however, important areas for us to continue
to address. Like many others in the quantitative
fund space, we have had issues with the performance
of certain of our quantitative funds. We know that
we disappointed our clients in those funds, and, we
are focused on learning from this past year’s events.
In addition, direct quantitative hedge funds represent
only five percent of our assets under management,
and we realize the importance of expanding our
product portfolio in actively managed strategies.
Our Stake in the Global Economy
Each of our businesses benefits from a number of
different factors or trends — from the development
of products and instruments to specific market
dynamics. All of our businesses, however, will
continue to be positively driven by the global
integration of economies and markets.
In 2007, our pre-tax earnings outside the U.S.
exceeded 50 percent for the first time.
In a seminal research piece that coined the term
“BRICs,” we identified early on the breakout potential
of the high-growth countries of Brazil, Russia, India
and China. Historically, however, we have not built
much physical infrastructure in the emerging markets.
That changed in the last two years as we opened
offices in Mumbai, Moscow, São Paulo, Dubai, Doha
and Tel Aviv.
We are also making strategic investments in these
markets. We are currently negotiating a strategic alliance
in Saudi Arabia with NCB Capital, the securities
arm of National Commercial Bank, the largest bank
in the Middle East. We have invested over $1 billion
in India and plan to invest more. And we have
recently acquired an asset management platform
in South Korea with $7 billion in assets under
management to further develop our distribution
capabilities in the region.
The next step for us is to build out our securities
capabilities in these growth markets. In Brazil,
we are now licensed to do onshore fixed income
activities. In Russia, we have built a platform to
trade both cash equity and fixed income products
and select over-the-counter derivative products.
In India, we have cash, futures and options capabilities.
In China, we can trade cash products through
Gao Hua Securities Company Limited, our joint
venture partner. And in South Korea, we received
our banking license, which allows us to offer a
broader range of products to our clients. We continue
to see more opportunities in these and other
developing markets.
Globally, Private Wealth Management (PWM)
also represents a significant opportunity for the firm,
and we are determined to grow our footprint.
5Goldman Sachs 2007 Annual Report
While important as a revenue source in its own right,
our PWM business connects us with a growing class
of entrepreneurs around the world, who not only
benefit from our private banking skills, but also rely
upon our investment banking and securities expertise.
We have made key management hires in PWM
and are developing onshore capabilities in China
and Brazil. We are expanding our Swiss banking
capabilities to grow our offshore franchise in important
markets. We also have GS Bank USA, an industrial
loan corporation in the U.S., and a fully operational
bank in Ireland to augment our global private
banking platform.
Our strategy of being an advisor, financier and investor
is proving especially effective as we expand globally.
Although we are relatively new to some of these markets,
we have been able to win important mandates
because of the attraction of our model, the strength
of our reputation and our commitment to the local
region. For example, we opened offices in Dubai and
Mumbai in 2007 and were #2 in announced MA
in both the Middle East and India.
This is all part of a broader strategy of identifying
high-growth areas around the world and building
our franchise in tandem with these economies.
Our Culture
Our ability to perform rests on a shared passion for
teamwork, integrity and excellence. Teamwork
is not an abstract goal, but a reality. It allows us to
complement an individual’s skills and expertise with
those of his or her colleagues to provide exceptional
client service across different parts of the firm.
Our people are also results-driven and measure their
effectiveness by the successes of our clients.
Culture is a difficult concept to define, but we believe
it is what truly differentiates Goldman Sachs.
Goldman Sachs’ partnership ethos still runs
throughout the firm. This mentality creates a sense of
ownership of the firm’s capital, risk and profitability
at all levels. We have over 30,000 employees, but we
try every day to make the firm feel smaller. Whether
we communicate with people divisionally, regionally
or at the senior leadership level, we reinforce the
same values. Each person at Goldman Sachs is a
steward of our legacy and the culture it represents.
One example of this is The Chairman’s Forum. For
the past year, the three of us conducted over 30 half-
day sessions in the U.S., Europe and Asia with every
Managing Director (MD) to talk about his or her
role in advancing our client franchise. We spent more
time on this initiative than any other. Given the fact
that our MDs set the tone throughout the firm, there
were few more important ways to invest our time.
The firm also imbues a sense of partnership through
our compensation process. We take a comprehensive
view on performance versus one limited to individual
results. While individual performance matters,
everyone’s pay is dependent on how Goldman Sachs
performs overall. People are incentivized to act in a
way that supports the firm as a whole and not to be
parochial about their specific division or business unit.
Ultimately, our success depends on the quality of the
people we attract and retain. We spend enormous
amounts of time on these issues. It begins with
recruiting. At Goldman Sachs, everyone from our
junior to our most senior people commits time
and focus to our recruiting efforts. Our Management
Committee members have participated in nearly 80
recruiting events over the last year. The priority we
place on recruiting is one reason why more than 80
percent of the offers we extended globally to under-
graduates and graduates in 2007 were accepted.
Once they come into the firm, our people expect
ongoing training and development. Within GS
University, there are over 2,400 online and classroom
courses. Ninety percent of our people participated —
completing 950,000 hours of training during the
year. Our people also expect to have a broad range
of experiences over the course of their careers. Many
of us, including most of our senior leadership, have
worked in multiple divisions and in multiple regions.
6 Goldman Sachs 2007 Annual Report
Even after people leave Goldman Sachs, they still
tend to identify with our firm and we foster that
connection. In the last two years, we have held
15 events for alumni in the U.S., Europe and this
year, Asia. Over 50 percent of our retired partners
have attended at least one event and nearly 12,000
former GS professionals have registered on our
alumni web site. In October 2006, we held an alumni
event in London and over 1,000 people attended.
We have a rich history and tradition, and we invest
in it. Our alumni help us recruit, participate in
volunteer activities and come back to speak to our
people. In many cases, they are also clients of the firm.
Not only does all of this help validate our culture, it
provides a real, tangible value that transcends any single
generation. Good people hire good people. Through
this process, the feeling of ownership is passed on.
Our culture is self-sustaining and self-perpetuating.
Risk Management
Not surprisingly, the culture of our firm anchors our
approach to risk management.
That approach is characterized by accountability,
escalation and communication. A large part of this
discipline is represented in the marking process,
which assigns value to a position based on its currently
traded market price. We believe that rigorous mark-
to-market accounting for financial instruments
is fundamental to prudent management because it
facilitates a clear view of risk. It allows us to manage
market risk limits, monitor exposure to credit risk
and manage our liquidity requirements. Effective risk
management is demanding and often difficult, but it
lies at the heart of the management of a financial
institution, and, we believe it is a core competence
that helps define Goldman Sachs.
We also put great value in our firmwide committees
such as the Risk Committee, which monitors financial
risk; the Commitments Committee, which looks at
our underwriting and distribution activities; the Capital
Committee, which focuses on credit extension; and
the Business Practices Committee, which reviews
operational and reputational risk. These committees
create a system of checks and balances that encourage
communication between people in both control and
business positions and, when necessary, the speedy
escalation of a potential issue. Over one-half of the
members of our firmwide committees have worked
in two or more divisions. And the average tenure at
the firm of committee members is 17 years.
More broadly, we place great importance on
communication between revenue and control areas.
This translates into a constant flow of risk reports,
and the end result is a better understanding of the
risks we are taking.
Closely related to communication and escalation is
accountability. People have to feel responsible for
the decisions they make, and for the decisions their
subordinates make. If we suffer a credit loss, the
relevant business is not absolved of the consequences
simply because the risk was approved by the Credit
department. Taken together, all flow into one another:
communication encourages escalation and escalation
reinforces accountability.
Because we are in the business of assuming risk on
behalf of our clients, we know we will have losses
from time to time. That’s why it is important to give
people the confidence and support to stay committed
to those businesses during difficult times. Our appetite
for risk taking is central to our ability to accomplish
our clients’ objectives and to be profitable. But our
appetite is calibrated by balancing potential risk and
reward as market conditions shift and evolve and
meaningful opportunities ebb and flow. Clearly, market
conditions can change abruptly. We must never forget
that risk is just that — risk, with all its consequences.
Goldman Sachs Gives
Another important part of our culture is philanthropy
and service. We are proud that so many of our people
support hundreds of non-profit organizations around
the world, serving on the boards of educational
institutions, charities and environmental organizations.
Earlier this year, building on Goldman Sachs’ long
tradition of philanthropy, we announced one of our
most significant philanthropic initiatives to date.
7Goldman Sachs 2007 Annual Report
In launching Goldman Sachs Gives, a donor-advised
fund, the firm’s partners agreed to commit a part of
their overall compensation to charitable organizations.
Individual accounts have been established within
Goldman Sachs Gives for participating partners, who
will recommend charitable organizations as recipients,
thereby diversifying the overall philanthropy of our
firm and our people. In addition, the firm made
a separate contribution to Goldman Sachs Gives.
Through the collective generosity of our people, we
expect that Goldman Sachs Gives will grow to more
than $1 billion over the next few years and will become
a significant source of dedicated charitable funds.
This important initiative will provide a meaningful
way for our people to increase their current support
of non-profit organizations around the world.
Looking Ahead
Some may characterize culture and the attributes
we described above as soft issues. To us, our culture
sustains our client franchise and reputation. In
that sense, it is a tangible driver of our performance.
The relative strength of our franchise can sometimes
be masked by generally favorable markets. The
second half of the year’s more difficult conditions,
we believe, highlighted the depth and breadth of
our client franchise.
Conditions across various markets remain
challenging. Our industry is a cyclical one with
little predictability in the short term. As a firm that
operates in the center of the global economy, we
grow at a multiple of GDP growth and are directly
affected by the macroeconomic environment.
It is important to remember that, given our stake in
the global economy, the recent pace of earnings
growth simply is not sustainable.
However, over the longer term, we remain optimistic
that secular growth trends, notably the rise of the
BRICs and the evolution of markets and instruments,
will play to the strengths of our businesses and allow
us to grow our franchise.
Behind the hard numbers of financial performance
is an internal set of shared values at Goldman Sachs.
These values fuel a culture of teamwork and the
rigor of our risk management. We will make our fair
share of mistakes and we will experience losses.
Guaranteed. However, we manage our business over
the long term and we believe that the cultural
attributes of Goldman Sachs will continue to enable
us to generate strong returns for our shareholders.
Lloyd C. Blankfein
Chairman and Chief Executive Officer
Jon Winkelried
President and Co-Chief Operating Officer
Gary D. Cohn
President and Co-Chief Operating Officer
8 Goldman Sachs 2007 Annual Report
Financial Highlights
	 As of or for the Year Ended November
($ and share amounts in millions, except per share amounts)			 2007 	 2006	 2005
Operating Results
Net revenues
Investment banking				 $    7,555	 $   5,629	 $   3,671
Trading and principal investments				 31,226	 25,562 	 16,818
Asset management and securities services				 7,206 	 6,474	 4,749
Total net revenues				 45,987 	 37,665 	 25,238
Pre-tax earnings				 17,604 	 14,560 	 8,273
Net earnings				 11,599 	 9,537	 5,626
Net earnings applicable to common shareholders			 11,407	 9,398 	 5,609
Common Share Data
Diluted earnings per common share				 $    24.73 	 $   19.69 	 $   11.21
Average diluted common shares outstanding				 461.2 	 477.4 	 500.2
Dividends declared and paid per common share			 $     1.40 	 $    1.30 	 $    1.00
Book value per common share (1)
				 90.43	 72.62 	 57.02
Tangible book value per common share (2) (3)
				 78.88	 61.47 	 46.76
Ending stock price				 226.64	 201.60 	 134.12
Financial Condition and Other Operating Data
Total assets 				 $1,119,796 	 $838,201 	 $706,804
Other secured financings (long-term)				 33,300	 26,134 	 15,669
Unsecured long-term borrowings				 164,174 	 122,842 	 84,338
Total shareholders’ equity				 42,800	 35,786 	 28,002
Leverage ratio (4)
				 26.2x	 23.4x 	 25.2x
Adjusted leverage ratio (5)
				 17.5x	 16.1x 	 17.9x
Debt to equity ratio (6)
				 3.8x	 3.4x 	 3.0x
Return on average common shareholders’ equity (7)
			 32.7%	 32.8% 	 21.8%
Return on average tangible common shareholders’ equity (8)
			 38.2%	 39.8% 	 26.7%
Selected Data
Total employees				 30,522 	 26,467 	 23,623
Assets under management (in billions)				 $      868	 $    676 	 $    532
(1) Book value per common share is based on common shares outstanding, including restricted stock units granted to employees with no future service requirements, of
439.0 million, 450.1 million and 460.4 million as of November 2007, November 2006 and November 2005, respectively.
(2) Tangible book value per common share is computed by dividing tangible common shareholders’ equity by the number of common shares outstanding, including restricted
stock units granted to employees with no future service requirements.
(3) Tangible common shareholders’ equity equals total shareholders’ equity less preferred stock, goodwill and identifiable intangible assets, excluding power contracts.
See “Financial Information — Management’s Discussion and Analysis — Equity Capital — Capital Ratios and Metrics” for further information regarding our calculation of
tangible common shareholders’ equity.
(4) Leverage ratio equals total assets divided by total shareholders’ equity.
(5) Adjusted leverage ratio equals adjusted assets divided by tangible equity capital. See “Financial Information — Management’s Discussion and Analysis — Equity
Capital — Capital Ratios and Metrics” for further information regarding adjusted assets, tangible equity capital and our calculation of the adjusted leverage ratio.
(6) Debt to equity ratio equals unsecured long-term borrowings divided by total shareholders’ equity.
(7) Return on average common shareholders’ equity is computed by dividing net earnings applicable to common shareholders by average monthly common shareholders’ equity.
(8) Return on average tangible common shareholders’ equity is computed by dividing net earnings applicable to common shareholders by average monthly tangible common
shareholders’ equity. See “Financial Information — Management’s Discussion and Analysis — Results of Operations — Financial Overview” for further information regarding
our calculation of return on average tangible common shareholders’ equity.
10 Goldman Sachs 2007 Annual Report
We see opportunity
In extending
our reach
bovespa Holding S.A.
In 2007, Goldman Sachs made a
series of significant commitments
to building our presence in Brazil.
We established a bank and
supported the management team
with important new hires and
transfers. We have built upon our
long history as one of the
country’s premier MA advisors
to become a diversified provider
of products and services, including
Fixed Income, Currency and
Commodities, Asset Management,
Research, Principal Investing,
Corporate Finance and Equities.
In 2007, we participated as the
lead bookrunner in the country’s
largest recorded IPO for
Bovespa Holding, which
controls the São Paulo Stock
Exchange. The IPO was the
culmination of over a year of
working as an exclusive advisor
to Bovespa Holding during its
demutualization and preparation
to become a publicly traded entity.
In preparation for the IPO,
Goldman Sachs worked with the
Bovespa Holding management
board to develop a profile that
would appeal to a broad base of
international investors. Key to the
success of the offering was helping
them demonstrate how their
evolving culture supported the
financial disclosure, compliance
and independent board oversight
practices expected by the global
investment community. Our
commitment throughout the
process, from the demutualization
to the pricing of the IPO, is an
important factor in our efforts to
grow our franchise in new markets
through strong client relationships
and innovative services.
11Goldman Sachs 2007 Annual Report
12 Goldman Sachs 2007 Annual Report
We see opportunity
In leading
innovation
GSTrUE
Successful companies may find
themselves needing capital to
meet strategic objectives, such as
funding further growth, but not
wanting to list on an exchange as
a publicly traded company.
Potential investors are always
looking for strong opportunities,
but also value the liquidity and
pricing transparency that a trading
market can provide. In 2007,
Goldman Sachs took several steps
to help create a platform where
issuers and qualified institutional
investors can trade restricted
Rule 144A equity securities.
In May 2007, we launched
Goldman Sachs Tradable
Unregistered Equity (GSTrUE).
The inaugural issue was an over
$1 billion offering for Los
Angeles-based Oaktree Capital
Management, and was followed
by an $896 million offering for
Apollo Management. The GSTrUE
platform is notable, among other
things, for its innovative method
of tracking settled trades to ensure
the total number of shareholders
meets regulatory guidelines.
The platform provides the
traditional benefits of being
public — access to capital, liquidity,
pricing transparency and support
for a longer‑term business model.
The creation of this kind of
platform can also enhance the
dialogue between issuers and
a group of qualified investors.
In October, Goldman Sachs helped
broaden this market for 144A
equity listings by working with
NASDAQ and 11 other securities
firms to create The PORTAL
Alliance. The PORTAL Alliance
will be accessible to all eligible
participants and will further benefit
both investors and issuers.
13Goldman Sachs 2007 Annual Report
We see opportunity
In building global
businesses
GE PLASTICS
In late 2006, General Electric
Company (GE) engaged Goldman
Sachs to help identify strategic
solutions for its plastics business.
GE Plastics was one of the largest
industrial divisions within GE,
and had been a critical part of the
company for decades. However,
when the increased volatility of
raw material costs began impacting
earnings, GE sought a partner
with the strategic profile to
maintain and grow an already
sizeable business.
Goldman Sachs worked closely
with GE to define its objectives, the
strengths of its plastics business
and the reason for its unique value
to a number of potential partners.
Goldman Sachs helped GE to
conclude that the optimal
transaction would most likely be
a sale of GE Plastics, and helped
coordinate an accelerated process
involving a diverse group of
potential buyers from multiple
geographic regions.
As the largest public company in
Saudi Arabia with significant growth
plans in its core operations,
Saudi Basic Industries Corporation
(SABIC) emerged as the best
potential owner of GE Plastics.
Combining SABIC’s low-cost
polycarbonate manufacturing
capabilities and access to low-cost
raw materials with GE Plastics’
globally recognized brands,
unparalleled access to the industry’s
most important customers
and market-leading product-
development skills helped create
a new global market leader in
high-performance plastics,
renamed SABIC Innovative Plastics.
Goldman Sachs understood the
value of GE Plastics and was able
to find the right buyer to grow
the business. With our help, GE
quickly completed the deal
at an attractive valuation while
navigating complex market
conditions and a challenging
financial market. The sale of
GE Plastics to SABIC for
$11.6 billion represented the
largest divestiture in the chemicals
sector and one of the largest
divestitures in GE’s history.
14 Goldman Sachs 2007 Annual Report
15Goldman Sachs 2007 Annual Report
16 Goldman Sachs 2007 Annual Report
We see opportunity
In new
relationships
icici Bank Limited
ICICI Bank Limited has established
itself as one of the financial leaders
of the fast growing Indian economy.
To fund its growth, ICICI selected
Goldman Sachs to lead manage
its $4.9 billion equity offering — 
the largest equity offering in history
by an Indian issuer. This complex
transaction entailed simultaneous
domestic and international tranches.
In addition to its responsibilities as
joint bookrunner, Goldman Sachs
served as lead bank for regulatory
processes and international
marketing. The marketing exercise
included a four-day global road
show with over 80 meetings with
a broad range of sophisticated
investors including domestic and
international mutual funds, pension
funds, hedge funds and private
equity investors.
ICICI’s confidence in Goldman
Sachs, and the success of this large
and complex transaction, were
particularly gratifying as it came
only six months after we received
our merchant banking license in
India. This confidence was further
reiterated when ICICI also selected
Goldman Sachs to lead manage
its $2 billion offering of senior
notes. This transaction was a
testament to Goldman Sachs’
commitment to building strong
relationships in India by delivering
a full range of products and
services to our clients.
17Goldman Sachs 2007 Annual Report
18 Goldman Sachs 2007 Annual Report
We see opportunity
In every step
Taiwan Semiconductor
Manufacturing Company
Limited
The Goldman Sachs approach
in Asia mirrors its practice in the
U.S. and Europe — a focus on
developing long-term client
relationships that promote both
the client’s growth and ours. In this
dynamic market, Goldman Sachs
has pursued the model of building
relationships with high-quality
companies at the beginning of
their life cycle where our experience
and expertise can make an
immediate impact.
Our relationship with Taiwan
Semiconductor Manufacturing
Company Limited (TSMC) is a
perfect example. Since leading their
first international equity offering
over 10 years ago, Goldman Sachs
has played a role in virtually every
significant market transaction
TSMC has undertaken, totaling
over $12 billion.
At the beginning of 2007, Goldman
Sachs worked with TSMC and
Royal Philips Electronics (Philips),
a significant TSMC stockholder,
to devise a plan to facilitate an
orderly disposal of TSMC shares
by Philips. In a multiphased
plan announced in March 2007,
Goldman Sachs first executed a
$1.75 billion block trade with
domestic Taiwanese institutions,
then successfully marketed a
follow-on offering of secondary
shares totaling $2.56 billion, and
finally advised on the buyback
of $1.5 billion of TSMC shares.
19Goldman Sachs 2007 Annual Report
20 Goldman Sachs 2007 Annual Report
We see opportunity
In complex
restructurings and
lasting solutions
Eurotunnel Group
Eurotunnel developed and operates
two rail tunnels below the English
Channel, connecting the United
Kingdom and France. Since opening
in the spring of 1994, Eurotunnel
has transported 212 million
passengers and 195 million tonnes
of merchandise. However, as a
result of overly optimistic revenue
projections and construction cost
overruns, Eurotunnel carried an
unsustainable debt burden. After
a series of temporary restructurings,
the Eurotunnel Group was
seeking a permanent solution.
Combining expertise from our
Infrastructure Investment Group,
Investment Banking and distressed
debt trading teams, Goldman
Sachs approached Eurotunnel to
discuss potential solutions. In
an extremely complex transaction,
Goldman Sachs worked
collaboratively with Eurotunnel
and existing creditors to provide
a number of cash and partial
cash alternatives to accelerate the
restructuring process. This
included involvement by numerous
creditors, multiple financial
advisors, the French and U.K.
governments, and specialty
monoline insurance companies.
In the end, Goldman Sachs and
bank partners funded £2.84 billion
in new capital, replacing the
existing £6.2 billion in debt. In
addition to the cash, creditors
received convertible debt bonds
totaling £1.3 billion.
Post-closing, total Eurotunnel assets
increased significantly in value
and the company is conservatively
capitalized for the first time since
construction.
21Goldman Sachs 2007 Annual Report
22 Goldman Sachs 2007 Annual Report
We see opportunity
In environmentally
responsible
transactions
TXU CORPORATION
In 2007, Goldman Sachs joined
an investor group including
Kohlberg Kravis Roberts  Co.
(KKR) and the Texas Pacific
Group (TPG) to acquire the TXU
Corporation, the largest power
generator in Texas. The transaction
represents the largest leveraged
buyout in U.S. history with a total
value of $44 billion.
Our cross-functional team of
professionals from Investment
Banking, the Financing Group,
Credit Products, Commodities
and our Center for Environmental
Markets helped execute the
transaction and related financing
in the midst of turbulent markets
and a high-profile public debate.
Goldman Sachs served as financial
advisor, led the largest corporate
high-yield financing in history and
created an innovative commodity
risk management program to
support the acquisition.
The transaction was notable for the
rigor of the environmental debate
that preceded it and ultimately
shaped the outcome. A strong and
sustained public outreach campaign
was key to building legislative and
public support for the transaction.
Thanks to the leadership of
KKR, TPG, Environmental Defense,
the National Resources Defense
Council, Goldman Sachs and
others, the parties reached
an agreement to substantially
limit future carbon emissions.
Specifically, the number of
planned coal plants has been
reduced from 11 to three. In
addition, under new ownership,
TXU doubled its energy efficiency
investment, strengthened its
environmental policies and
is making significant investments
in alternative energy.
23Goldman Sachs 2007 Annual Report
24 Goldman Sachs 2007 Annual Report
We see opportunity
In developing
creative solutions
Marmon Holdings, Inc.
The Pritzker Family of Chicago
has been a long-standing client
of Goldman Sachs. Most recently,
they asked us to help analyze
strategic options for Marmon
Holdings, Inc., one of their
significant investments. An
international grouping of more
than 125 manufacturing and
service businesses, Marmon has
achieved impressive growth and
profitability, and is well positioned
to continue that success. Indeed,
part of the family’s objective was
to continue to participate in the
company’s growth.
Rather than recommend a public
auction, Goldman Sachs advised
the Pritzkers that there was one
strategic buyer whose objectives in
the transaction would be a perfect
complement to the Pritzkers’ — 
Berkshire Hathaway. Based on
our experience working with
Berkshire Hathaway, we had a
good sense of what its concerns
would be, and were able to
develop a proposal that appealed
to both buyer and seller.
Following the distribution of
substantial cash and other assets
to the selling shareholders,
Berkshire Hathaway will acquire
60% of Marmon for $4.5 billion.
The remaining 40% will be
acquired in stages over the next
five to six years, priced on the basis
of future earnings. In the words of
Tom Pritzker, Marmon’s Chairman,
“Pre-existing relationships infused
the transaction with credibility
and an understanding of the
common ground that allows a
deal to be made . Goldman Sachs
was more than involved — they
were committed.”
25Goldman Sachs 2007 Annual Report
We see opportunity
In negotiating
a common ground
Alex Rodriguez
Goldman Sachs’ relationship with
the New York Yankees dates to
2001. The following year, together
we launched what would become
the #1 most watched regional
sports network in the country, the
YES Network. The deal marked
one of the largest private equity
investments at the time, and
the beginning of an ongoing
relationship with the Yankees.
As a result of this relationship,
Alex Rodriguez approached
Goldman Sachs in November
of 2007 to explore options
for resuming a dialogue with the
Yankees after opting out of his
contract. Goldman Sachs worked
to help both parties find their
common ground after negotiations
had stalled. After facilitating the
conversation, Goldman Sachs
brought its negotiations expertise
to bear in helping to define the
terms of the deal — a $275 million
contract over the course of
10 years, keeping Rodriguez with
the Yankees for the duration
of his career.
The deal reflects the firm’s leading
Business Principle of putting clients’
interests first. Goldman Sachs is
committed to its relationship with
the Yankees and is the lead financial
advisor for their new stadium
due to open in April of 2009.
26 Goldman Sachs 2007 Annual Report
27Goldman Sachs 2007 Annual Report
Clients turn to the people of Goldman Sachs for
advice on a range of strategic, financial and business
issues. Integrity, expertise and an ability to deliver
the entire intellectual capital of our global firm are
attributes that make people successful within the
Goldman Sachs culture while making them trusted
advisors to our clients.
We maintain decades-long advisory relationships
with some of the most important corporations and
governments around the world. Our Investment
Banking teams provide insight across products,
industries and regions. Clients may turn to us to
structure effective hedging strategies, orchestrate a
cross-border merger or handle the sale of a subsidiary.
Regardless of assignment, clients can expect the
same level of expert advice and commitment to their
needs that have made us the leading merger advisor
globally every year since 1997.
Our global Investment Strategy Group (ISG) is an
excellent example of our approach to advising
investing clients. Serving many of the world’s largest
and most sophisticated investors, ISG professionals
offer global expertise in areas such as strategic asset
allocation, tactical asset allocation and active risk
budgeting. Clients have turned to us with issues
related to investment policy, economic and financial
forecasting and alpha-focused investment portfolios.
Advice is at the core of our interaction with every
client, every day around the world.
We See Opportunity in
The Face
of Advising
top
New York
Left to Right
Charles P.
Himmelberg
Global Investment
Research
Ramiro E. Menchaca
Fixed Income,
Currency and
Commodities
Stephanie Cohen
Investment Banking
Miyuki Matsumoto
Investment
Management
center left
London
Left to Right
Amir Levy
Investment
Management
Ashwin T. Jacob
Equities
Luca Ferrari
Investment Banking
Sarah C. Lawlor
Fixed Income,
Currency and
Commodities
center right
Tokyo
Left to Right
Midori Ezoe
Investment Banking
Channa Jayaweera
Investment
Management
Krishnan Sankaran
Technology
Akio Shima
Operations
Hiroko Imaeda
Equities
bottom
Hong Kong
Left to Right
Angel Young 
Investment
Management
Kenneth K. Hui
Investment
Management
Stephanie Leung
Global Investment
Research
Ricky Ho
Technology
Janet Kong
Investment
Management
28 Goldman Sachs 2007 Annual Report
We work closely with clients to create financing
solutions that meet their objectives. The options for
meeting clients’ financing needs have expanded
dramatically in recent years as markets evolve and as
we create new products and services. Professionals
from every part of the firm are actively engaged in
helping our institutional and individual clients meet
their increasingly global financing needs.
Our Financing Group teams work closely with
corporate clients, pension funds, financial sponsors
and governments to structure and execute complex
financing and risk management solutions. Drawing
upon expertise from across the firm, solutions may
include equity, debt, derivatives, structured finance
and leveraged finance. Regardless of the financing
instrument, the Financing Group leverages Goldman
Sachs’ brand and strength in the global markets to
achieve outstanding results for our clients.
Our Investment Management Division has responded
to client demand by creating private banking
services through Goldman Sachs Bank USA and
Goldman Sachs Bank (Europe) plc. As a result,
our advisory teams are able to help our Private
Wealth Management clients better manage their
finances with a wide variety of loan products to
finance investments and other client activities,
as well as deposit products and payment services.
We See Opportunity in
The Face
of Financing
30 Goldman Sachs 2007 Annual Report
With the growth of the hedge fund community, our
financing business has expanded over the past
10 years to better serve this client base. An industry
leader, our prime brokerage team helps hedge fund
clients at every stage of development. As part of this
service, our financing professionals work closely
with their clients to deliver tailored lending solutions.
Across the firm, and in markets around the world,
client demand for financing solutions from Goldman
Sachs is increasing. Whether it be for specialty lending
products, financing solutions for the energy industry
or credit solutions for individual investors, our
financing specialists around the world are actively
engaged in helping clients achieve their goals.
left
New York
Left to Right
Vivek Bantwal
Investment Banking
Kenneth Springer
Operations
Christina Minnis
Investment Banking
center
London
Left to Right
Matt Seager
Operations
Elizabeth Gilbert
Investment Banking
Lachlan Edwards
Investment Banking
top right
Tokyo
Left to Right
Junko Hamamoto
Investment Banking
Masahiro Ehara
Operations
Jessica Wright
Operations
Jun Ohama
Investment Banking
bottom right
Hong Kong
Left to Right
Julianne Lee
Operations
Udhay Furtado
Investment Banking
Jie Lian
Investment Banking
31Goldman Sachs 2007 Annual Report
Our clients regard Goldman Sachs people as
disciplined and experienced global investors. Clients
work with us because of the breadth of our
product offering, the quality of our advice and our
commitment to helping clients grow their wealth.
Our Principal Investing business is integral to our
firmwide strategy and has created significant long-
term value for our investing clients and shareholders.
The benefit of our co-investing capabilities continues
to grow, reflecting the expansion of our client base
to include more international and middle-market
companies. Often, these companies are seeking more
than our advice — they desire our commitment
through direct co-investment.
In the Investment Management Division, we have
tapped some of the best talent from inside and outside
the firm to offer institutional and individual investors
access to a growing range of investment products.
A team of highly skilled investment professionals
from our proprietary investing business in the Securities
businesses recently moved into Asset Management
to provide clients access to a new, broader range of
alternative investment opportunities. We have hired
into the firm exceptional external managers, such as
the team that has launched the Liberty Harbor group,
to create new investment programs for our clients.
And in our Private Equity Group, we offer clients
access to a strong selection of global external
diversified funds of funds, structured portfolios and
liquidity solutions.
With a strong position in the global markets and
access to the most significant issuers and investors,
our investment teams have established a strong track
record of success for our clients. Our culture of
teamwork and the global perspective of our people
make us confident that clients will continue to
value our investing expertise.
top
Hong Kong
Left to Right
Priscilla Mok
Operations
Benson Lu
Fixed Income,
Currency and
Commodities
Jenny Sun
Equities
center left
London
Left to Right
Gabriel Möllerberg
Investment
Management
Heather Mulahasani 
Merchant Banking
Cedric Choffat
Equities
center right
Tokyo
Left to Right
Eiji Shibata
Merchant Banking
Yoko Nakahama
Technology
Shinya Matsuguma
Fixed Income,
Currency and
Commodities
bottom
New York
Left to Right
Farai Mtetwa
Technology
A. Ewa Kozicz
Equities
Gerry Cardinale
Merchant Banking
Jennifer A. Barbetta
Investment
Management
We See Opportunity in
The Face
of Investing
32 Goldman Sachs 2007 Annual Report
The face of our culture reflects 158 nationalities and
106 languages. Although they have diverse experiences
and skills, the people of Goldman Sachs share a set
of values that creates our unique culture of excellence.
Our culture is what sets us apart from other firms.
It is what earns us our reputation, helps define our
brand and makes Goldman Sachs a rewarding place
to work. It is a culture that expects the best from all
of us in professional expertise, personal integrity and
innovative spirit. Our people have a passion for
results, an inspiration to lead and a desire to work
with the best and the brightest in business, government
and the non-profit sector. Ours is a culture that
rewards individuals who do not merely accept
change but welcome it as a chance to expand the
scope of their talent and imagination.
Our 14 Business Principles codify our culture.
At the heart of this framework for how we conduct
ourselves and our business is the confidence our
clients place in us each and every day. While the
concept of client service may seem elementary,
we believe it is an area that requires continual
renewal as our clients’ needs evolve and become
increasingly multi-faceted. This was the focus of
our 2007 Chairman’s Forum.
The Chairman’s Forum is a topical forum for the
firm’s Managing Directors. In 2007, Chairman and
CEO Lloyd Blankfein personally led over 1,700
of the firm’s Managing Directors through more than
30 small group sessions that focused on the firm’s
strategy and the central role of our client franchise.
We See Opportunity in
The Face
of Our Culture
34 Goldman Sachs 2007 Annual Report
Programs like The Chairman’s Forum underscore
the personal stake each of us has in maintaining
our culture, and the emphasis we place on leadership
through teamwork. We realize that honoring the
culture that has sustained us for 139 years is not
enough. We must renew that culture in a rapidly
changing world. And most importantly, we must
live it day by day.
left
Lloyd Blankfein
leading a Chairman’s
Forum session
top center
Left to Right
Gavin O’Connor
Finance
Edith Cooper
Equities
Stacy Bash-Polley
Fixed Income,
Currency and
Commodities
bottom center
Left to Right
R. Martin Chavez
Fixed Income,
Currency and
Commodities
Kaysie Uniacke
Investment
Management
Jeff Schroeder
Finance
top right
Left to Right
Liz Beshel
Finance
Steve Strongin
Global Investment
Research
Lisa Shalett
Global Compliance
Tracy Wolstencroft
Investment Banking
center right
Left to Right
Steve Scopellite
Technology
Robin Vince
Operations
Clare Scherrer
Investment Banking
bottom right
Left to Right
Eiji Ueda
Fixed Income,
Currency and
Commodities
Miho Kusaka
Technology
Yoshiaki Hashimoto
Investment Banking
35Goldman Sachs 2007 Annual Report
$
7,206
$
6,474
$
4,749
Asset Management
and Securities Services
Net Revenues
(in millions)
05 06 07
Goldman Sachs is a leading global investment banking, securities
and investment management firm that provides a wide range of
services worldwide to a substantial and diversified client base that
includes corporations, financial institutions, governments and
high-net-worth individuals.
Our activities are divided into three segments:
Investment Banking
We provide a broad range of
investment banking services to a
diverse group of corporations,
financial institutions, investment
funds, governments and individuals.
Trading and Principal Investments
We facilitate client transactions
with a diverse group of corporations,
financial institutions, investment
funds, governments and individuals
and take proprietary positions
through market making in, trading
of and investing in fixed income
and equity products, currencies,
commodities and derivatives on
these products. In addition, we
engage in market-making and
specialist activities on equities and
options exchanges and clear client
transactions on major stock, options
and futures exchanges worldwide.
In connection with our merchant
banking and other investing activities,
we make principal investments
directly and through funds that we
raise and manage.
Asset Management
and Securities Services
We provide investment advisory and
financial planning services and offer
investment products (primarily
through separately managed
accounts and commingled vehicles,
such as mutual funds and private
investment funds) across all major
asset classes to a diverse group of
institutions and individuals worldwide
and provide prime brokerage services,
financing services and securities
lending services to institutional
clients, including hedge funds,
mutual funds, pension funds and
foundations, and to high-net-worth
individuals worldwide.
05 06 07
$
7,555
$
5,629
$
3,671
Investment Banking
Net Revenues
(in millions)
$
31,226
$
25,562
$
16,818
Trading and
Principal Investments
Net Revenues
(in millions)
05 06 07
36 Goldman Sachs 2007 Annual Report
Financial Information — Table of Contents
Management’s Discussion and Analysis
Introduction .  .  .  .  .  .  .  .  .  .  .  .  .  .  .  .  .  .  .  .  .  .  .  .  .  .  .  .  .  .  .  .  .  .  .  .  .  .  .  .  .  .  .  .  .  .  .  .  .  .  . 38
Executive Overview .  .  .  .  .  .  .  .  .  .  .  .  .  .  .  .  .  .  .  .  .  .  .  .  .  .  .  .  .  .  .  .  .  .  .  .  .  .  .  .  .  .  . 38
Business Environment . .  .  .  .  .  .  .  .  .  .  .  .  .  .  .  .  .  .  .  .  .  .  .  .  .  .  .  .  .  .  .  .  .  .  .  .  .  .  .  . 39
Certain Risk Factors That May Affect Our Business  .  .  .  .  .  .  .  . 41
Critical Accounting Policies . .  .  .  .  .  .  .  .  .  .  .  .  .  .  .  .  .  .  .  .  .  .  .  .  .  .  .  .  .  .  .  .  .  . 43
  Fair Value .  .  .  .  .  .  .  .  .  .  .  .  .  .  .  .  .  .  .  .  .  .  .  .  .  .  .  .  .  .  .  .  .  .  .  .  .  .  .  .  .  .  .  .  .  .  .  .  .  .  . 43
  Goodwill and Identifiable Intangible Assets .  .  .  .  .  .  .  .  .  .  .  .  .  .  . 48
Use of Estimates . .  .  .  .  .  .  .  .  .  .  .  .  .  .  .  .  .  .  .  .  .  .  .  .  .  .  .  .  .  .  .  .  .  .  .  .  .  .  .  .  .  .  .  .  .  . 50
Results of Operations .  .  .  .  .  .  .  .  .  .  .  .  .  .  .  .  .  .  .  .  .  .  .  .  .  .  .  .  .  .  .  .  .  .  .  .  .  .  .  .  . 51
  Financial Overview .  .  .  .  .  .  .  .  .  .  .  .  .  .  .  .  .  .  .  .  .  .  .  .  .  .  .  .  .  .  .  .  .  .  .  .  .  .  .  .  . 51
  Segment Operating Results . .  .  .  .  .  .  .  .  .  .  .  .  .  .  .  .  .  .  .  .  .  .  .  .  .  .  .  .  .  .  .  . 55
  Geographic Data .  .  .  .  .  .  .  .  .  .  .  .  .  .  .  .  .  .  .  .  .  .  .  .  .  .  .  .  .  .  .  .  .  .  .  .  .  .  .  .  .  .  . 61
Off-Balance-Sheet Arrangements .  .  .  .  .  .  .  .  .  .  .  .  .  .  .  .  .  .  .  .  .  .  .  .  .  .  .  .  . 61
Equity Capital . .  .  .  .  .  .  .  .  .  .  .  .  .  .  .  .  .  .  .  .  .  .  .  .  .  .  .  .  .  .  .  .  .  .  .  .  .  .  .  .  .  .  .  .  .  .  .  . 62
Contractual Obligations and Commitments .  .  .  .  .  .  .  .  .  .  .  .  .  .  .  .  . 66
Risk Management . .  .  .  .  .  .  .  .  .  .  .  .  .  .  .  .  .  .  .  .  .  .  .  .  .  .  .  .  .  .  .  .  .  .  .  .  .  .  .  .  .  .  .  . 68
  Risk Management Structure . .  .  .  .  .  .  .  .  .  .  .  .  .  .  .  .  .  .  .  .  .  .  .  .  .  .  .  .  .  .  . 68
  Market Risk .  .  .  .  .  .  .  .  .  .  .  .  .  .  .  .  .  .  .  .  .  .  .  .  .  .  .  .  .  .  .  .  .  .  .  .  .  .  .  .  .  .  .  .  .  .  .  . 69
  Credit Risk . .  .  .  .  .  .  .  .  .  .  .  .  .  .  .  .  .  .  .  .  .  .  .  .  .  .  .  .  .  .  .  .  .  .  .  .  .  .  .  .  .  .  .  .  .  .  .  .  . 73
  Derivatives .  .  .  .  .  .  .  .  .  .  .  .  .  .  .  .  .  .  .  .  .  .  .  .  .  .  .  .  .  .  .  .  .  .  .  .  .  .  .  .  .  .  .  .  .  .  .  .  .  . 73
  Liquidity and Funding Risk .  .  .  .  .  .  .  .  .  .  .  .  .  .  .  .  .  .  .  .  .  .  .  .  .  .  .  .  .  .  .  . 76
  Operational Risk .  .  .  .  .  .  .  .  .  .  .  .  .  .  .  .  .  .  .  .  .  .  .  .  .  .  .  .  .  .  .  .  .  .  .  .  .  .  .  .  .  .  . 81
Recent Accounting Developments .  .  .  .  .  .  .  .  .  .  .  .  .  .  .  .  .  .  .  .  .  .  .  .  .  .  .  . 82
Management’s Report on Internal Control
  over Financial Reporting .  .  .  .  .  .  .  .  .  .  .  .  .  .  .  .  .  .  .  .  .  .  .  .  .  .  .  .  .  .  .  . 84
Report of Independent Registered
  Public Accounting Firm . .  .  .  .  .  .  .  .  .  .  .  .  .  .  .  .  .  .  .  .  .  .  .  .  .  .  .  .  .  .  .  .  . 85
Consolidated Financial Statements
Consolidated Statements of Earnings . .  .  .  .  .  .  .  .  .  .  .  .  .  .  .  .  .  .  .  .  .  .  .  . 86
Consolidated Statements of Financial Condition . .  .  .  .  .  .  .  .  .  .  .  . 87
Consolidated Statements of Changes
  in Shareholders’ Equity . .  .  .  .  .  .  .  .  .  .  .  .  .  .  .  .  .  .  .  .  .  .  .  .  .  .  .  .  .  .  .  .  .  .  .  . 88
Consolidated Statements of Cash Flows . .  .  .  .  .  .  .  .  .  .  .  .  .  .  .  .  .  .  .  .  . 89
Consolidated Statements of Comprehensive Income . .  .  .  .  .  .  .  . 90
Notes to Consolidated Financial Statements
Note 1 — Description of Business .  .  .  .  .  .  .  .  .  .  .  .  .  .  .  .  .  .  .  .  .  .  .  .  .  .  .  .  . 91
Note 2 — Significant Accounting Policies .  .  .  .  .  .  .  .  .  .  .  .  .  .  .  .  .  .  .  .  . 91
Note 3 — Financial Instruments .  .  .  .  .  .  .  .  .  .  .  .  .  .  .  .  .  .  .  .  .  .  .  .  .  .  .  .  .  .  . 99
Note 4 — Unsecured Short-Term Borrowings . .  .  .  .  .  .  .  .  .  .  .  .  .  .  . 110
Note 5 — Unsecured Long-Term Borrowings .  .  .  .  .  .  .  .  .  .  .  .  .  .  .  . 111
Note 6 — Commitments, Contingencies and Guarantees . .  .  . 113
Note 7 — Shareholders’ Equity .  .  .  .  .  .  .  .  .  .  .  .  .  .  .  .  .  .  .  .  .  .  .  .  .  .  .  .  .  .  . 117
Note 8 — Earnings Per Common Share .  .  .  .  .  .  .  .  .  .  .  .  .  .  .  .  .  .  .  .  .  . 119
Note 9 — Goodwill and Identifiable Intangible Assets . .  .  .  .  .  . 119
Note 10 — Other Assets and Other Liabilities .  .  .  .  .  .  .  .  .  .  .  .  .  .  . 121
Note 11 — Employee Benefit Plans . .  .  .  .  .  .  .  .  .  .  .  .  .  .  .  .  .  .  .  .  .  .  .  .  .  . 122
Note 12 — Employee Incentive Plans .  .  .  .  .  .  .  .  .  .  .  .  .  .  .  .  .  .  .  .  .  .  .  . 127
Note 13 — Transactions with Affiliated Funds . .  .  .  .  .  .  .  .  .  .  .  .  .  . 130
Note 14 — Income Taxes .  .  .  .  .  .  .  .  .  .  .  .  .  .  .  .  .  .  .  .  .  .  .  .  .  .  .  .  .  .  .  .  .  .  .  .  . 131
Note 15 — Regulation .  .  .  .  .  .  .  .  .  .  .  .  .  .  .  .  .  .  .  .  .  .  .  .  .  .  .  .  .  .  .  .  .  .  .  .  .  .  .  . 133
Note 16 — Business Segments .  .  .  .  .  .  .  .  .  .  .  .  .  .  .  .  .  .  .  .  .  .  .  .  .  .  .  .  .  .  .  . 134
Supplemental Financial Information
Quarterly Results  .  .  .  .  .  .  .  .  .  .  .  .  .  .  .  .  .  .  .  .  .  .  .  .  .  .  .  .  .  .  .  .  .  .  .  .  .  .  .  .  .  .  .  . 137
Common Stock Price Range .  .  .  .  .  .  .  .  .  .  .  .  .  .  .  .  .  .  .  .  .  .  .  .  .  .  .  .  .  .  .  .  . 138
Common Stock Price Performance .  .  .  .  .  .  .  .  .  .  .  .  .  .  .  .  .  .  .  .  .  .  .  .  .  . 138
Selected Financial Data .  .  .  .  .  .  .  .  .  .  .  .  .  .  .  .  .  .  .  .  .  .  .  .  .  .  .  .  .  .  .  .  .  .  .  .  .  . 139
37Goldman Sachs 2007 Annual Report
Management’s Discussion and Analysis
Introduction
Goldman Sachs is a leading global investment banking, securities
and investment management firm that provides a wide range
of services worldwide to a substantial and diversified client base
that includes corporations, financial institutions, governments
and high-net-worth individuals.
Our activities are divided into three segments:
■	 Investment Banking. We provide a broad range of
investment banking services to a diverse group of corporations,
financial institutions, investment funds, governments and
individuals.
■	 Trading and Principal Investments. We facilitate client
transactions with a diverse group of corporations, financial
institutions, investment funds, governments and individuals
and take proprietary positions through market making in,
trading of and investing in fixed income and equity products,
currencies, commodities and derivatives on these products. In
addition, we engage in market-making and specialist activities
on equities and options exchanges and clear client transactions
on major stock, options and futures exchanges worldwide. In
connection with our merchant banking and other investing
activities, we make principal investments directly and through
funds that we raise and manage.
■	 Asset Management and Securities Services. We provide
investment advisory and financial planning services and offer
investment products (primarily through separately managed
accounts and commingled vehicles, such as mutual funds and
private investment funds) across all major asset classes to a
diverse group of institutions and individuals worldwide and
provide prime brokerage services, financing services and
securities lending services to institutional clients, including
hedge funds, mutual funds, pension funds and foundations,
and to high-net-worth individuals worldwide.
Unless specifically stated otherwise, all references to 2007,
2006 and 2005 refer to our fiscal years ended, or the dates, as
the context requires, November 30, 2007, November 24, 2006
and November 25, 2005, respectively.
When we use the terms “Goldman Sachs,” “we,” “us” and
“our,” we mean The Goldman Sachs Group, Inc. (Group Inc.),
a Delaware corporation, and its consolidated subsidiaries.
References herein to the Annual Report on Form 10-K are to
our Annual Report on Form 10-K for the fiscal year ended
November 30, 2007.
In this discussion, we have included statements that may
constitute “forward-looking statements” within the meaning
of the safe harbor provisions of the Private Securities Litigation
Reform Act of 1995. Forward-looking statements are not
historical facts but instead represent only our beliefs regarding
future events, many of which, by their nature, are inherently
uncertain and outside our control. These statements include
statements other than historical information or statements of
current condition and may relate to our future plans and
objectives and results, among other things, and may also include
statements about the objectives and effectiveness of our risk
management and liquidity policies, statements about trends in
or growth opportunities for our businesses and statements
about our investment banking transaction backlog. By identifying
these statements for you in this manner, we are alerting you to
the possibility that our actual results and financial condition
may differ, possibly materially, from the anticipated results and
financial condition indicated in these forward-looking statements.
Important factors that could cause our actual results and financial
condition to differ from those indicated in these forward-looking
statements include, among others, those discussed below under
“— Certain Risk Factors That May Affect Our Business” as
well as “Risk Factors” in Part I, Item 1A of the Annual Report
on Form 10-K and “Cautionary Statement Pursuant to the
Private Securities Litigation Reform Act of 1995” in Part I,
Item 1 of the Annual Report on Form 10-K.
Executive Overview
Our diluted earnings per common share were $24.73 for 2007
compared with $19.69 for 2006. During 2007, we achieved
record results in the Americas, Europe and Asia, and derived
over one-half of our pre-tax earnings outside of the Americas.
Return on average tangible common shareholders’ equity (1)
was
38.2% and return on average common shareholders’ equity was
32.7% for 2007. Book value per common share increased 25%
to $90.43 at year end. During 2007, we repurchased 41.2 million
shares of our common stock for a total cost of $8.96 billion.
In 2007, we generated record diluted earnings per common
share, which exceeded the prior year record results by 26%.
Each of our three segments produced record net revenues. The
increase in Trading and Principal Investments reflected higher
net revenues in Equities, Fixed Income, Currency and
Commodities (FICC) and Principal Investments. Net revenues
in Equities increased 33% compared with 2006, reflecting
significantly higher net revenues in both our customer franchise
businesses and principal strategies. During 2007, Equities
operated in an environment characterized by strong customer-
driven activity, generally higher equity prices and higher levels
of volatility, particularly during the second half of the year. The
increase in FICC reflected significantly higher net revenues in
currencies and interest rate products. In addition, net revenues
in mortgages were higher despite a significant deterioration in the
(1)	Return on average tangible common shareholders’ equity (ROTE) is computed by
dividing net earnings applicable to common shareholders by average monthly
tangible common shareholders’ equity. See “— Results of Operations — Financial
Overview” below for further information regarding our calculation of ROTE.
38 Goldman Sachs 2007 Annual Report
Management’s Discussion and Analysis
mortgage market throughout the year, while net revenues in
credit products were strong, but slightly lower compared with
2006. Credit products included substantial gains from equity
investments, including a gain of approximately $900 million
related to the disposition of Horizon Wind Energy L.L.C., as
well as a loss of approximately $1 billion, net of hedges, related
to non-investment-grade credit origination activities. During
2007, FICC operated in an environment generally characterized
by strong customer-driven activity and favorable market
opportunities. However, during the year, the mortgage market
experienced significant deterioration and, in the second half of
the year, the broader credit markets were characterized by
wider spreads and reduced levels of liquidity. We continued to
capitalize on trading and investing opportunities for our clients
and ourselves and, accordingly, our market risk increased,
particularly in interest rate and equity products. In addition,
our total assets surpassed $1 trillion during the year, as we
grew our balance sheet in order to support these opportunities,
as well as to support increased activity in Securities Services.
The increase in Principal Investments reflected strong results in
both corporate and real estate investing.
The increase in Investment Banking reflected a 64% increase
in Financial Advisory net revenues and a strong performance in
our Underwriting business. The increase in Financial Advisory
primarily reflected growth in industry-wide completed mergers
and acquisitions. The increase in Underwriting reflected higher
net revenues in debt underwriting, as leveraged finance activity
was strong during the first half of our fiscal year, while net
revenues in equity underwriting were strong but essentially
unchanged from 2006. Our investment banking transaction
backlog at the end of 2007 was higher than it was at the end
of 2006. (1)
Net revenues in Asset Management and Securities Services
also increased. The increase in Securities Services primarily
reflected significant growth in global customer balances. The
increase in Asset Management reflected significantly higher
asset management fees, partially offset by significantly lower
incentive fees. During the year, assets under management
increased $192 billion, or 28%, to a record $868 billion,
including net inflows of $161 billion.
In 2008, we will remain focused on our clients, geographic
expansion and the importance of effective risk management.
We continue to see opportunities for growth in the businesses
and geographic areas in which we operate and, in particular, we
believe continued expansion of the economies of Brazil, Russia,
India and China, as well as those of the Middle East, will offer
opportunities for us to increase our presence in those markets.
Though we generated particularly strong results in 2007, our
business, by its nature, does not produce predictable earnings.
Our results in any given period can be materially affected by
conditions in global financial markets and economic conditions
generally. For a further discussion of the factors that may affect
our future operating results, see “— Certain Risk Factors That
May Affect Our Business” below as well as “Risk Factors” in
Part I, Item 1A of the Annual Report on Form 10-K.
Business Environment
As an investment banking, securities and investment management
firm, our businesses are materially affected by conditions in the
financial markets and economic conditions generally, both in
the United States and elsewhere around the world. A favorable
business environment is generally characterized by, among
other factors, high global gross domestic product growth,
stable geopolitical conditions, transparent, liquid and efficient
capital markets, low inflation, high business and investor
confidence and strong business earnings. These factors provide
a positive climate for our investment banking activities, for
many of our trading and investing businesses and for wealth
creation, which contributes to growth in our asset management
business. During the first half of 2007, global economic growth
was generally solid, inflation remained contained, global equity
markets rose and corporate activity levels were strong.
However, during the second half of 2007, significant weakness
and volatility in global credit markets, particularly in the U.S.
and Europe, spread to broader financial markets and began to
affect global economic growth. For a further discussion of how
market conditions can affect our businesses, see “— Certain
Risk Factors That May Affect Our Business” below as well as
“Risk Factors” in Part I, Item 1A of the Annual Report on
Form 10-K. A further discussion of the business environment
in 2007 is set forth below.
(1)	Our investment banking transaction backlog represents an estimate of our future
net revenues from investment banking transactions where we believe that future
revenue realization is more likely than not.
39Goldman Sachs 2007 Annual Report
Management’s Discussion and Analysis
Europe. Real gross domestic product growth in the Eurozone
economies slowed to an estimated 2.7% in calendar year 2007,
down from 2.9% in 2006. Industrial production and fixed
investment slowed as the year progressed, while growth in
consumer expenditure was weak throughout the year. Surveys
of business and consumer confidence declined. However, the
labor market strengthened, as evidenced by a decline in the
unemployment rate. Measures of core inflation increased during
the year. The European Central Bank (ECB) continued to raise
interest rates, increasing its main refinancing operations rate
by a total of 75 basis points to 4.00% by the end of June. The
ECB left the rate unchanged for the rest of our fiscal year, but
engaged in measures to improve liquidity conditions in the last
four months of the year. In the United Kingdom, real gross
domestic product rose by an estimated 3.1% for calendar year
2007, up from 2.9% in 2006, but showed signs of slowing late
in the year due to credit market concerns and a slowdown in
the U.K. housing market. Measures of inflation remained
elevated during the year. The Bank of England increased interest
rates, raising its official bank rate by a total of 75 basis points
to 5.75%. Long-term bond yields in both the Eurozone and the
U.K. ended the year higher. The Euro and British pound
appreciated by 11% and 7%, respectively, against the U.S. dollar
during our fiscal year. Major European equity markets ended
our fiscal year higher.
Asia. In Japan, real gross domestic product growth slowed to
an estimated 1.9% in calendar year 2007 from 2.4% in 2006.
Measures of investment activity in the housing sector and
growth in consumption declined during the year. Export growth
remained solid but showed signs of deterioration towards year
end as the environment outside of Japan worsened. The rate of
inflation remained near zero percent during the year. The Bank
of Japan raised its target overnight call rate by 25 basis points
for the second consecutive year, bringing it to 0.50%, while the
yield on 10-year Japanese government bonds declined slightly
during our fiscal year. The yen appreciated by 4% against the
U.S. dollar. The Nikkei 225 Index rose during the first eight
months of our fiscal year but declined significantly in August,
and ended our fiscal year essentially unchanged.
In China, real gross domestic product growth accelerated to an
estimated 11.4% in calendar year 2007 from 11.1% in 2006,
with continued strength in exports, as demonstrated by China’s
large and growing current account surplus and foreign exchange
reserves. Industrial production accelerated during the year,
while domestic demand softened but remained solid. The rate
of inflation increased, particularly during the second half of the
year. The People’s Bank of China raised its one-year benchmark
lending rate by a total of 117 basis points to 7.29% and took
additional measures to reduce liquidity in the financial system.
The government continued to allow the steady appreciation of
its currency, which ended our fiscal year nearly 6% higher
against the U.S. dollar. Elsewhere in Asia, real gross domestic
Global. Growth in the global economy slowed over the course
of 2007. Although the pace of economic growth was solid
through the beginning of our third fiscal quarter, global growth
in the latter part of our fiscal year was impacted by volatility
in the credit markets, particularly in the U.S. and Europe, and
accelerated weakness in the U.S. housing market. Fixed income
and equity markets experienced high volatility, particularly
during the second half of the year. The U.S. mortgage market
experienced significant deterioration throughout the year,
particularly in subprime loans and securities. The broader
global credit markets were characterized by significant weakness
in the second half of the year, which was evident in the significant
dislocation in money market rates in the U.S. and Europe. The
U.S. Federal Reserve lowered its federal funds target rate
towards the end of our fiscal year, while central banks in the
Eurozone, United Kingdom, Japan and China all raised rates
during the year. Oil prices rose significantly during our fiscal
year and, in the currency markets, the U.S. dollar weakened
against most major currencies, particularly against the Euro
and the British pound. Corporate activity was generally strong
during our fiscal year, reflecting significant growth in mergers
and acquisitions and equity underwritings, as well as strength
in leveraged finance during the first half of our fiscal year.
United States. Real gross domestic product growth in the
U.S. economy slowed to an estimated 2.2% in calendar year
2007, down from 2.9% in 2006. While economic growth was
generally solid during the first nine months of our fiscal year,
activity appeared to decelerate sharply during the fourth quarter.
Much of the slowdown was attributable to the housing market,
as sales of new and existing homes and residential real estate
investment declined, as well as to the weakness in credit markets.
Growth in industrial production slowed from 2006 levels,
reflecting reduced growth in domestic demand, partially offset by
stronger growth in net exports. Although business confidence
remained fairly strong, consumer confidence declined over the
course of the year. Growth in consumer expenditure was strong
in the first quarter but declined thereafter, as concerns about the
housing market intensified and oil prices rose. The unemployment
rate rose during the second half of our fiscal year and ended
the year higher. The rate of inflation increased sharply over our
fiscal year, as energy prices rose significantly. Measures of core
inflation, while slowing from 2006 levels, accelerated towards
the end of the year. The U.S. Federal Reserve reduced its federal
funds target rate by a total of 75 basis points to 4.50% during
our fourth quarter, the first reductions since 2003. Beginning
in August, the U.S. Federal Reserve also took other measures
to improve liquidity in credit markets. Although the 10-year
U.S. Treasury note yield rose during the first half of our fiscal
year, it subsequently declined as credit concerns took hold, and
ended the year 58 basis points lower at 3.97%. The Dow Jones
Industrial Average, the SP 500 Index and the NASDAQ
Composite Index ended our fiscal year higher by 9%, 6% and
8%, respectively.
40 Goldman Sachs 2007 Annual Report
Management’s Discussion and Analysis
confidence in capital markets; natural disasters or pandemics;
or a combination of these or other factors, have adversely
affected, and may in the future adversely affect, our business
and profitability in many ways, including the following:
■	 Increasing or high interest rates and/or widening credit
spreads, especially if such changes are rapid, may create a less
favorable environment for certain of our businesses, and may
affect the fair value of financial instruments that we issue or
hold. For example, beginning in the second half of 2007,
difficulties in the mortgage and broader credit markets
resulted in a relatively sudden and substantial decrease in the
availability of credit and credit spreads widened significantly,
affecting volatility and liquidity in the debt and equity markets.
■	 We have been committing increasing amounts of capital in
many of our businesses and generally maintain large trading,
specialist and investing positions. Market fluctuations and
volatility may adversely affect the value of those positions or
may reduce our willingness to enter into new transactions.
Conversely, certain of our trading businesses depend on market
volatility to provide trading and arbitrage opportunities, and
decreases in volatility may reduce these opportunities and
adversely affect the results of these businesses.
■	 Increases in interest rates or credit spreads, as well as
limitations on the availability of credit, can affect our ability
to borrow on a secured or unsecured basis, which may
adversely affect our liquidity and results of operations. We
seek to finance our less liquid assets on a secured basis
and disruptions in the credit markets are likely to make it
harder and more expensive to fund these assets. In difficult
credit markets, we may be forced to fund our operations at a
higher cost or we may be unable to raise as much funding as
we need to support our business activities. This could cause
us to curtail our business activities and could increase our cost
of funding, both of which could reduce our profitability.
■	 Industry-wide declines in the size and number of underwritings
and mergers and acquisitions may have an adverse effect on
our revenues and, because we may be unable to reduce
expenses correspondingly, our profit margins. Our clients
engaging in mergers and acquisitions often rely on access to
the secured and unsecured credit markets to finance their
transactions. The lack of available credit or increased cost of
credit may adversely affect the size, volume and timing of our
clients’ merger and acquisition transactions — particularly
large transactions — and adversely affect our financial advisory
and underwriting businesses.
product growth in India slowed to an estimated 8.7% in
calendar year 2007 from 9.4% in 2006, as its currency
strengthened and the central bank tightened monetary policy.
The rate of wholesale inflation fell, but the rate of consumer
price inflation remained elevated. Other currencies in the region
also generally appreciated against the U.S. dollar. Equity markets
rose sharply across the region, with the Shanghai Composite
Index up 138%, and markets in Hong Kong, India and South
Korea ending the year significantly higher.
Other Markets. Real gross domestic product in Brazil rose by
an estimated 5.4% in calendar year 2007, supported by strong
capital inflows, strong demand and rising prices in commodities,
and expansionary fiscal and monetary policies. The central
bank reduced interest rates even as the rate of inflation rose. In
Russia, real gross domestic product rose by an estimated 7.3% in
calendar year 2007, supported by strong household consumption
and increased capital investment, particularly in the first half
of the year. The rate of inflation rose sharply in the latter part
of the year. Brazilian and Russian equity prices ended our fiscal
year significantly higher.
Certain Risk Factors
That May Affect Our Business
We face a variety of risks that are substantial and inherent in
our businesses, including market, liquidity, credit, operational,
legal and regulatory risks. For a discussion of how management
seeks to manage some of these risks, see “— Risk Management”
below. A summary of the more important factors that could
affect our business follows below. For a further discussion of
these and other important factors that could affect our business,
see “Risk Factors” in Part I, Item 1A of the Annual Report on
Form 10-K.
Market Conditions and Market Risk. Our businesses are
materially affected by conditions in the global financial markets
and economic conditions generally, and these conditions
may change suddenly and dramatically. A favorable business
environment is generally characterized by, among other factors,
high global gross domestic product growth, stable geopolitical
conditions, transparent, liquid and efficient capital markets,
low inflation, high business and investor confidence, and strong
business earnings. Unfavorable or uncertain economic and
market conditions, which can be caused by: outbreaks of
hostilities or other geopolitical instability; declines in economic
growth, business activity or investor or business confidence;
limitations on the availability or increases in the cost of credit
and capital; increases in inflation, interest rates, exchange rate
volatility, default rates or the price of basic commodities;
corporate, political or other scandals that reduce investor
41Goldman Sachs 2007 Annual Report
Management’s Discussion and Analysis
Liquidity Risk. Liquidity is essential to our businesses. Our
liquidity could be impaired by an inability to access secured
and/or unsecured debt markets, an inability to access funds
from our subsidiaries, an inability to sell assets or redeem our
investments, or unforeseen outflows of cash or collateral. This
situation may arise due to circumstances that we may be unable
to control, such as a general market disruption or an operational
problem that affects third parties or us, or even by the perception
among market participants that we are experiencing greater
liquidity risk. The financial instruments that we hold and the
contracts to which we are a party are increasingly complex, as we
employ structured products to benefit our clients and ourselves,
and these complex structured products often do not have readily
available markets to access in times of liquidity stress. Growth
of our proprietary investing activities may lead to situations
where the holdings from these activities represent a significant
portion of specific markets, which could restrict liquidity for
our positions. Further, our ability to sell assets may be impaired
if other market participants are seeking to sell similar assets at
the same time, as is likely to occur in a liquidity or other market
crisis. In addition, financial institutions with which we interact
may exercise set-off rights or the right to require additional
collateral, including in difficult market conditions, which could
further impair our access to liquidity.
Our credit ratings are important to our liquidity. A reduction
in our credit ratings could adversely affect our liquidity and
competitive position, increase our borrowing costs, limit
our access to the capital markets or trigger our obligations
under certain bilateral provisions in some of our trading and
collateralized financing contracts. Under these provisions,
counterparties could be permitted to terminate contracts with
Goldman Sachs or require us to post additional collateral.
Termination of our trading and collateralized financing
contracts could cause us to sustain losses and impair our
liquidity by requiring us to find other sources of financing or
to make significant cash payments or securities movements.
For a discussion of the potential impact on Goldman Sachs of
a reduction in our credit ratings, see “— Liquidity and Funding
Risk — Credit Ratings” below.
■	 Reductions in the level of the equity markets or increases in
interest rates tend to reduce the value of our clients’ portfolios,
which in turn may reduce the fees we earn for managing
assets. Increases in interest rates or attractive conditions in
other investments could cause our clients to transfer their
assets out of our funds or other products. Even in the absence
of uncertain or unfavorable economic or market conditions,
investment performance by our asset management business
below the performance of benchmarks or competitors could
result in a decline in assets under management and in the
incentive and management fees we receive and might make it
more difficult to attract new investors.
■	 Concentration of risk increases the potential for significant
losses in our market-making, proprietary trading and investing,
block trading, merchant banking, underwriting and lending
businesses. This risk may increase to the extent we expand
our proprietary trading and investing businesses or commit
capital to facilitate customer-driven business.
■	 An increase in market volatility increases our measured
risk, which might cause us to reduce our proprietary
positions or to reduce certain of our business activities. In
such circumstances, we may not be able to reduce our
positions or our exposure in a timely, cost-effective way or in
a manner sufficient to offset the increase in measured risk.
■	 The volume of transactions that we execute for our clients
and as a specialist or market maker may decline, which would
reduce the revenues we receive from commissions and
spreads. In our specialist businesses, we are obligated by
stock exchange rules to maintain an orderly market, including
by purchasing shares in a declining market. This may result
in trading losses and an increased need for liquidity. Weakness
in global equity markets and the trading of securities in
multiple markets and on multiple exchanges could adversely
impact our trading businesses and impair the value of our
goodwill and identifiable intangible assets.
42 Goldman Sachs 2007 Annual Report
Management’s Discussion and Analysis
we provide to clients, often must adhere to client-specific
guidelines, as well as legal and regulatory standards. Despite
the contingency plans and facilities we have in place, our
ability to conduct business may be adversely impacted by a
disruption in the infrastructure that supports our businesses
and the communities in which we are located. This may include
a disruption involving electrical, communications, transportation
or other services used by us or third parties with which we
conduct business.
Legal and Regulatory Risk. We are subject to extensive and
evolving regulation in jurisdictions around the world. Several of
our subsidiaries are subject to regulatory capital requirements
and, as a Consolidated Supervised Entity (CSE), we are subject
to minimum capital standards on a consolidated basis.
Substantial legal liability or a significant regulatory action
against us could have material adverse financial effects or cause
significant reputational harm to us, which in turn could seriously
harm our business prospects. Firms in the financial services
industry have been operating in a difficult regulatory environment.
We face significant legal risks in our businesses, and the volume
of claims and amount of damages and penalties claimed in
litigation and regulatory proceedings against financial institutions
remain high. For a discussion of how we account for our legal
and regulatory exposures, see “— Use of Estimates” below.
Critical Accounting Policies
Fair Value
The use of fair value to measure financial instruments, with
related unrealized gains or losses generally recognized in
“Trading and principal investments” in our consolidated
statements of earnings, is fundamental to our financial statements
and our risk management processes and is our most critical
accounting policy. The fair value of a financial instrument is
the amount that would be received to sell an asset or paid to
transfer a liability in an orderly transaction between market
participants at the measurement date (the exit price).
Instruments that we own (long positions) are marked to bid
prices, and instruments that we have sold, but not yet purchased
(short positions) are marked to offer prices.
We adopted Statement of Financial Accounting Standards
(SFAS) No. 157, “Fair Value Measurements,” as of the beginning
of 2007. See Notes 2 and 3 to the consolidated financial
statements for further information on SFAS No. 157.
Credit Risk. The amount and duration of our credit exposures
have been increasing over the past several years, as has the
breadth and size of the entities to which we have credit exposures.
We are exposed to the risk that third parties that owe us money,
securities or other assets will not perform their obligations.
These parties may default on their obligations to us due to
bankruptcy, lack of liquidity, operational failure or other reasons.
We are also subject to the risk that our rights against third
parties may not be enforceable in all circumstances. In addition,
deterioration in the credit quality of third parties whose securities
or obligations we hold could result in losses and/or adversely
affect our ability to rehypothecate or otherwise use those
securities or obligations for liquidity purposes. A significant
downgrade in the credit ratings of our counterparties could also
have a negative impact on our results. While in many cases we
are permitted to require additional collateral for counterparties
that experience financial difficulty, disputes may arise as to the
amount of collateral we are entitled to receive and the value of
pledged assets.
In addition, as part of our clearing business, we finance our client
positions, and we could be held responsible for the defaults or
misconduct of our clients. Although we regularly review credit
exposures to specific clients and counterparties and to specific
industries, countries and regions that we believe may
present credit concerns, default risk may arise from events or
circumstances that are difficult to detect or foresee, particularly
as new business initiatives lead us to transact with a broader
array of clients and expose us to new asset classes and new
markets. In addition, concerns about, or a default by, one
institution could lead to significant liquidity problems, losses
or defaults by other institutions, which in turn could adversely
affect us.
We have experienced, due to competitive factors, pressure to
extend and price credit at levels that may not always fully
compensate us for the risks we take. In particular, corporate
clients sometimes seek to require credit commitments from us
in connection with investment banking and other assignments.
Operational Risk. Shortcomings or failures in our internal
processes, people or systems, or external events could lead
to impairment of our liquidity, financial loss, disruption of
our businesses, liability to clients, regulatory intervention or
reputational damage. Our businesses are highly dependent on
our ability to process and monitor, on a daily basis, a large
number of transactions, many of which are highly complex,
across numerous and diverse markets in many currencies.
These transactions, as well as information technology services
43Goldman Sachs 2007 Annual Report
Management’s Discussion and Analysis
In determining fair value, we separate our “Financial instruments, owned at fair value” and “Financial instruments sold, but not
yet purchased, at fair value” into two categories: cash instruments and derivative contracts, as set forth in the following table:
Financial Instruments by Category
	 As of November
	 2007	 	 2006
				 Financial		 Financial
			 Financial	 Instruments Sold,	 Financial 	 Instruments Sold,
			 Instruments	 but not Yet	 Instruments	 but not Yet
			 Owned, 	 Purchased,	 Owned, 	 Purchased,
(in millions)			 at Fair Value	 at Fair Value	 at Fair Value	 at Fair Value
Cash trading instruments			 $324,181	 $112,018	 $253,056	 $  87,244
  ICBC			 6,807 (2)
	 —	 5,194 (2)
	 —
  SMFG (1)
			 4,060	 3,627 (5)
	 4,505	 3,065 (5)
  Other principal investments			 11,933 (3)
	 —	 4,263 (3)
	 —
Principal investments			 22,800	 3,627	 13,962	 3,065
Cash instruments			 346,981	 115,645	 267,018	 90,309
  Exchange-traded			 13,541	 12,280	 14,407	 13,851
  Over-the-counter			 92,073	 87,098	 53,136	 51,645
Derivative contracts			 105,614 (4)
	 99,378 (6)
	 67,543 (4)
	 65,496 (6)
Total			 $452,595	 $215,023	 $334,561	 $155,805
(1)	The fair value of our Japanese yen-denominated investment in the convertible preferred stock of Sumitomo Mitsui Financial Group, Inc. (SMFG) includes the effect of
foreign exchange revaluation, for which we maintain an economic currency hedge.
(2)	Includes interests of $4.30 billion and $3.28 billion as of November 2007 and November 2006, respectively, held by investment funds managed by Goldman Sachs. The
fair value of our investment in the ordinary shares of Industrial and Commercial Bank of China Limited (ICBC), which trade on The Stock Exchange of Hong Kong, includes
the effect of foreign exchange revaluation for which we maintain an economic currency hedge.
(3)	The following table sets forth the principal investments (in addition to our investments in ICBC and SMFG) included within the Principal Investments component of our
Trading and Principal Investments segment:
	 As of November
	 2007	 	 2006
(in millions)	 Corporate	 Real Estate	 Total	 Corporate	 Real Estate	 Total
Private	 $7,297	 $2,361	 $  9,658	 $2,741	 $555	 $3,296
Public	 2,208	 67	 2,275	 934	 33	 967
Total	 $9,505	 $2,428	 $11,933	 $3,675	 $588	 $4,263
(4)	Net of cash received pursuant to credit support agreements of $59.05 billion and $24.06 billion as of November 2007 and November 2006, respectively.
(5)	Represents an economic hedge on the shares of common stock underlying our investment in the convertible preferred stock of SMFG.
(6)	Net of cash paid pursuant to credit support agreements of $27.76 billion and $16.00 billion as of November 2007 and November 2006, respectively.
44 Goldman Sachs 2007 Annual Report
Management’s Discussion and Analysis
■	 Public Principal Investments. Our public principal
investments held within the Principal Investments component
of our Trading and Principal Investments segment tend to be
large, concentrated holdings resulting from initial public
offerings or other corporate transactions, and are valued
based on quoted market prices. For positions that are not
traded in active markets or are subject to transfer restrictions,
valuations are adjusted to reflect illiquidity and/or non-
transferability, and such adjustments are generally based on
available market evidence. In the absence of such evidence,
management’s best estimate is used.
Our most significant public principal investment is our
investment in the ordinary shares of ICBC. Our investment
in ICBC is valued using the quoted market prices adjusted
for transfer restrictions. The ordinary shares acquired from
ICBC are subject to transfer restrictions that, among other
things, prohibit any sale, disposition or other transfer until
April 28, 2009. From April 28, 2009 to October 20, 2009,
we may transfer up to 50% of the aggregate ordinary shares
of ICBC that we owned as of October 20, 2006. We may
transfer the remaining shares after October 20, 2009. A
portion of our interest is held by investment funds managed
by Goldman Sachs.
We also have an investment in the convertible preferred stock
of SMFG. This investment is valued using a model that is
principally based on SMFG’s common stock price. As of
November 2007, the conversion price of our SMFG convertible
preferred stock into shares of SMFG common stock was
¥318,800. This price is subject to downward adjustment if
the price of SMFG common stock at the time of conversion is
less than the conversion price (subject to a floor of ¥105,100).
As a result of downside protection on the conversion stock
price, the relationship between changes in the fair value of
our investment and changes in SMFG’s common stock price
would be nonlinear for a significant decline in the SMFG
common stock price. As of November 2007, we had hedged
approximately 90% of the common stock underlying our
investment in SMFG and there were no restrictions on our
ability to hedge the remainder.
Cash Instruments. Cash instruments include cash trading
instruments, public principal investments and private principal
investments.
■	 Cash Trading Instruments. Our cash trading instruments
are generally valued using quoted market prices in active
markets, broker or dealer quotations, or alternative pricing
sources with reasonable levels of price transparency. The
types of instruments valued based on quoted market prices in
active markets include most U.S. government and agency
securities, many other sovereign government obligations,
active listed equities and most money market securities.
The types of instruments valued based on quoted prices in
markets that are not active, broker or dealer quotations, or
alternative pricing sources with reasonable levels of price
transparency include most investment-grade and high-yield
corporate bonds, most mortgage products, certain corporate
bank and bridge loans, less liquid listed equities, state,
municipal and provincial obligations, most physical
commodities and certain loan commitments.
Certain cash trading instruments trade infrequently and
therefore have little or no price transparency. Such instruments
include private equity and real estate fund investments,
certain corporate bank and bridge loans, less liquid mortgage
whole loans, distressed debt instruments and certain loan
commitments. The transaction price is initially used as the
best estimate of fair value. Accordingly, when a pricing model
is used to value such an instrument, the model is adjusted so
that the model value at inception equals the transaction price.
This valuation is adjusted only when changes to inputs and
assumptions are corroborated by evidence such as transactions
in similar instruments, completed or pending third-party
transactions in the underlying investment or comparable
entities, subsequent rounds of financing, recapitalizations and
other transactions across the capital structure, offerings in the
equity or debt capital markets, and changes in financial ratios
or cash flows.
For positions that are not traded in active markets or are
subject to transfer restrictions, valuations are adjusted to reflect
illiquidity and/or non-transferability, and such adjustments
are generally based on available market evidence. In the
absence of such evidence, management’s best estimate is used.
45Goldman Sachs 2007 Annual Report
Management’s Discussion and Analysis
Certain OTC derivatives trade in less liquid markets with limited
pricing information, and the determination of fair value for
these derivatives is inherently more difficult. Where we do not
have corroborating market evidence to support significant
model inputs and cannot verify the model to market transactions,
transaction price is initially used as the best estimate of fair
value. Accordingly, when a pricing model is used to value such
an instrument, the model is adjusted so that the model value
at inception equals the transaction price. Subsequent to initial
recognition, we only update valuation inputs when corroborated
by evidence such as similar market transactions, third-party
pricing services and/or broker or dealer quotations, or other
empirical market data. In circumstances where we cannot
verify the model value to market transactions, it is possible that
a different valuation model could produce a materially different
estimate of fair value. See “— Credit Risk — Derivatives” below
for further information on our OTC derivatives.
When appropriate, valuations are adjusted for various factors
such as liquidity, bid/offer spreads and credit considerations.
Such adjustments are generally based on available market
evidence. In the absence of such evidence, management’s best
estimate is used.
Fair Value Hierarchy— Level 3 Assets. SFAS No. 157
establishes a fair value hierarchy that prioritizes the inputs to
valuation techniques used to measure fair value. The objective
of a fair value measurement is to determine the price that
would be received to sell an asset or paid to transfer a liability
in an orderly transaction between market participants at the
measurement date (an exit price). The hierarchy gives the highest
priority to unadjusted quoted prices in active markets for
identical assets or liabilities (level 1 measurements) and the
lowest priority to unobservable inputs (level 3 measurements).
Assets and liabilities are classified in their entirety based on the
lowest level of input that is significant to the fair value
measurement. See Notes 2 and 3 to the consolidated financial
statements for further information regarding SFAS No. 157.
■	 Private Principal Investments.  Our private principal
investments held within the Principal Investments component
of our Trading and Principal Investments segment include
investments in private equity, debt and real estate, primarily
held through investment funds. By their nature, these
investments have little or no price transparency. We value
such instruments initially at transaction price and adjust
valuations when evidence is available to support such
adjustments. Such evidence includes transactions in similar
instruments, completed or pending third-party transactions
in the underlying investment or comparable entities,
subsequent rounds of financing, recapitalizations and other
transactions across the capital structure, offerings in the
equity or debt capital markets, and changes in financial ratios
or cash flows.
Derivative Contracts. Derivative contracts can be exchange-
traded or over-the-counter (OTC). We generally value exchange-
traded derivatives within portfolios using models which calibrate
to market clearing levels and eliminate timing differences
between the closing price of the exchange-traded derivatives
and their underlying cash instruments.
OTC derivatives are valued using market transactions and
other market evidence whenever possible, including market-
based inputs to models, model calibration to market clearing
transactions, broker or dealer quotations or alternative pricing
sources with reasonable levels of price transparency. Where
models are used, the selection of a particular model to value an
OTC derivative depends upon the contractual terms of, and
specific risks inherent in, the instrument as well as the availability
of pricing information in the market. We generally use similar
models to value similar instruments. Valuation models require
a variety of inputs, including contractual terms, market prices,
yield curves, credit curves, measures of volatility, prepayment
rates and correlations of such inputs. For OTC derivatives that
trade in liquid markets, such as generic forwards, swaps and
options, model inputs can generally be verified and model
selection does not involve significant management judgment.
46 Goldman Sachs 2007 Annual Report
Management’s Discussion and Analysis
The following table sets forth the fair values of assets classified as level 3 within the fair value hierarchy, along with a brief
description of the valuation technique for each type of asset:
Level 3 Assets at Fair Value
(in millions)
	 As of
Description	 November 2007	 Valuation Technique
Private equity and real estate fund investments (1)
	 $ 18,006	Initially valued at transaction price. Subsequently
valued based on third-party investments, pending
transactions or changes in financial ratios (e.g.,
earnings multiples) and discounted cash flows.
Bank loans (2)
	 13,334	Initially valued at transaction price. Subsequently
valued using market data for similar instruments
(e.g., recent transactions or broker quotes), comparisons
to benchmark derivative indices or movements in
Corporate debt securities and other debt obligations (3)
	 6,111	 underlying credit spreads.
Mortgage and other asset-backed loans and securities
  Loans and securities backed by commercial real estate (4)
	 7,410	Initially valued at transaction price. Subsequently
valued transactions for similar instruments and
discounted cash flow techniques (calibrated to trading
activity, where applicable).
  Loans and securities backed by residential real estate (5)
	 2,484	Initially valued at transaction price. Subsequently
valued by comparison to transactions in instruments
with similar collateral and risk profiles, discounted
cash flow techniques, option adjusted spread analyses,
and hypothetical securitization analyses.
  Loan portfolios (6)
	 6,106	Initially valued at transaction price. Subsequently
valued using transactions for similar instruments and
discounted cash flow techniques.
Cash instruments	 53,451
Derivative contracts	 15,700	Valuation models are calibrated to initial trade price.
Subsequent valuations are based on observable inputs to
the valuation model (e.g., interest rates, credit spreads,
volatilities, etc.). Model inputs are changed only when
corroborated by market data.
Total level 3 assets at fair value	 69,151
Level 3 assets for which we do not
  bear economic exposure (7)
	 (14,437)
Level 3 assets for which we bear economic exposure	 $ 54,714
(1)	Includes $7.06 billion of assets for which we do not bear economic exposure. Also includes $2.02 billion of real estate fund investments.
(2)	Includes mezzanine financing, leveraged loans arising from capital market transactions and other corporate bank debt.
(3)	Includes $2.49 billion of collateralized debt obligations (CDOs) backed by corporate obligations.
(4)	Loans and securities backed by commercial real estate were $19.02 billion, of which $7.41 billion were classified as level 3.
(5)	Includes subprime mortgage exposure of $507 million, including $316 million of CDOs backed by subprime mortgages.
(6)	Consists of acquired portfolios of distressed loans. These loans are primarily backed by commercial and residential real estate collateral.
(7)	We do not bear economic exposure to these level 3 assets as they are financed by nonrecourse debt, attributable to minority investors or attributable to employee
interests in certain consolidated funds.
47Goldman Sachs 2007 Annual Report
Management’s Discussion and Analysis
We employ an oversight structure that includes appropriate
segregation of duties. Senior management, independent of the
trading and investing functions, is responsible for the oversight
of control and valuation policies and for reporting the results
of these policies to our Audit Committee. We seek to maintain
the necessary resources to ensure that control functions are
performed to the highest standards. We employ procedures for
the approval of new transaction types and markets, price
verification, review of daily profit and loss, and review of valuation
models by personnel with appropriate technical knowledge of
relevant products and markets. These procedures are performed
by personnel independent of the trading and investing functions.
For trading and principal investments where prices or valuations
that require inputs are less observable, we employ, where possible,
procedures that include comparisons with similar observable
positions, analysis of actual to projected cash flows, comparisons
with subsequent sales and discussions with senior business
leaders. See “— Market Risk” below for a further discussion of
how we manage the risks inherent in our trading and principal
investing businesses.
Goodwill and Identifiable Intangible Assets
As a result of our acquisitions, principally SLK LLC (SLK) in
2000, The Ayco Company, L.P. (Ayco) in 2003 and our variable
annuity and life insurance business in 2006, we have acquired
goodwill and identifiable intangible assets. Goodwill is the cost
of acquired companies in excess of the fair value of net assets,
including identifiable intangible assets, at the acquisition date.
Goodwill. We test the goodwill in each of our operating
segments, which are components one level below our three
business segments, for impairment at least annually in accordance
with SFAS No. 142, “Goodwill and Other Intangible Assets,”
by comparing the estimated fair value of each operating segment
with its estimated net book value. We derive the fair value of
each of our operating segments primarily based on price-earnings
and price-book multiples. We derive the net book value of our
operating segments by estimating the amount of shareholders’
equity required to support the activities of each operating
segment. Our last annual impairment test was performed during
our 2007 fourth quarter and no impairment was identified.
Subprime mortgage exposure. We securitize, underwrite and
make markets in subprime mortgages. As of November 2007,
the fair value of our long position in subprime mortgage cash
instruments was $2.11 billion (of which $507 million was
classified as level 3 within the fair value hierarchy), including
$316 million of collateralized debt obligations (CDOs) backed
by subprime mortgages. At any point in time, we may use cash
instruments as well as derivatives to manage our long or short
risk position in the subprime mortgage market.
Other Financial Assets and Financial Liabilities. In addition
to “Financial instruments owned, at fair value” and “Financial
instruments sold, but not yet purchased, at fair value,” we
have elected to account for certain of our other financial assets
and financial liabilities at fair value under SFAS No. 155,
“Accounting for Certain Hybrid Financial Instruments — an
amendment of FASB Statements No. 133 and 140,” or SFAS
No. 159, “The Fair Value Option for Financial Assets and
Financial Liabilities.” Such financial assets and financial liabilities
include (i) certain unsecured short-term borrowings, consisting
of all promissory notes and commercial paper and certain
hybrid financial instruments; (ii) certain other secured financings,
primarily transfers accounted for as financings rather than sales
under SFAS No. 140 and debt raised through our William
Street program; (iii) certain unsecured long-term borrowings,
including prepaid physical commodity transactions; (iv) resale
and repurchase agreements; (v) securities borrowed and loaned
within Trading and Principal Investments, consisting of our
matched book and certain firm financing activities; (vi) corporate
loans, loan commitments and certificates of deposit issued by
Goldman Sachs Bank USA (GS Bank USA) as well as securities
held by GS Bank USA (previously accounted for as available-
for-sale); (vii) receivables from customers and counterparties
arising from transfers accounted for as secured loans rather
than purchases under SFAS No. 140; and (viii) in general,
investments acquired after the adoption of SFAS No. 159
where we have significant influence over the investee and
would otherwise apply the equity method of accounting. See
“— Recent Accounting Developments” below for a discussion
of the impact of adopting SFAS No. 159.
Controls Over Valuation of Financial Instruments. A
control infrastructure, independent of the trading and investing
functions, is fundamental to ensuring that our financial
instruments are appropriately valued and that fair value
measurements are reliable. This is particularly important where
prices or valuations that require inputs are less observable.
48 Goldman Sachs 2007 Annual Report
Management’s Discussion and Analysis
The following table sets forth the carrying value of our goodwill by operating segment:
Goodwill by Operating Segment
	 As of November
(in millions)					 2007	 2006
Investment Banking
  Financial Advisory					 $    —	 $    —
  Underwriting					 125	 125
Trading and Principal Investments
  FICC					 123	 136
  Equities (1)
					 2,381	 2,381
  Principal Investments					 11	 4
Asset Management and Securities Services
  Asset Management (2)
					 564	 421
  Securities Services					 117	 117
Total					 $3,321	 $3,184
(1)	Primarily related to SLK.
(2)	Primarily related to Ayco. The increase in goodwill from November 2006 relates to our acquisition of Macquarie — IMM Investment Management.
Identifiable Intangible Assets. We amortize our identifiable intangible assets over their estimated useful lives in accordance
with SFAS No. 142, and test for potential impairment whenever events or changes in circumstances suggest that an asset’s or asset
group’s carrying value may not be fully recoverable in accordance with SFAS No. 144, “Accounting for the Impairment or
Disposal of Long-Lived Assets.” An impairment loss, calculated as the difference between the estimated fair value and the carrying
value of an asset or asset group, is recognized if the sum of the estimated undiscounted cash flows relating to the asset or asset group
is less than the corresponding carrying value.
The following table sets forth the carrying value and range of remaining useful lives of our identifiable intangible assets by major
asset class:
Identifiable Intangible Assets by Asset Class
	 As of November
	 2007	 	 2006
					 Range of Estimated
					 Remaining
				 Carrying	 Useful Lives	 Carrying
($ in millions) 				 Value	 (in years)	 Value
Customer lists (1)
				 $  732	 3 – 18	 $  737
New York Stock Exchange (NYSE) specialist rights			 502	 14	 542
Insurance-related assets (2)
				 372	 7	 362
Exchange-traded fund (ETF) specialist rights				 100	 20	 105
Power contracts (3)		
		 20	 1 – 18	 667
Other (4)
				 45	 1 – 5	 89
Total				 $1,771		 $2,502
(1)	Primarily includes our clearance and execution and NASDAQ customer lists related to SLK and financial counseling customer lists related to Ayco.
(2)	Consists of the value of business acquired (VOBA) and deferred acquisition costs (DAC). VOBA represents the present value of estimated future gross profits of the
variable annuity and life insurance business. DAC results from commissions paid by Goldman Sachs to the primary insurer (ceding company) on life and annuity reinsurance
agreements as compensation to place the business with us and to cover the ceding company’s acquisition expenses. VOBA and DAC are amortized over the estimated
life of the underlying contracts based on estimated gross profits, and amortization is adjusted based on actual experience. The seven-year useful life represents the
weighted average remaining amortization period of the underlying contracts (certain of which extend for approximately 30 years).
(3)	The reduction in power contracts from November 2006 is due to the sale of the majority of our ownership interests in 14 power generation facilities during 2007.
(4)	Primarily includes marketing and technology-related assets.
49Goldman Sachs 2007 Annual Report
Management’s Discussion and Analysis
There can be no assurance that the assumptions, rule or structure
changes described above will result in sufficient cash flows to
avoid future impairment of our NYSE specialist rights. As of
November 30, 2007, the carrying value of our NYSE specialist
rights was $502 million. To the extent that there were to be
an impairment in the future, it could result in a significant
writedown in the carrying value of these specialist rights.
Use of Estimates
The use of generally accepted accounting principles requires
management to make certain estimates and assumptions. In
addition to the estimates we make in connection with fair value
measurements and the accounting for goodwill and identifiable
intangible assets, the use of estimates and assumptions is also
important in determining provisions for potential losses that may
arise from litigation and regulatory proceedings and tax audits.
We estimate and provide for potential losses that may arise out
of litigation and regulatory proceedings and tax audits to the
extent that such losses are probable and can be estimated, in
accordance with SFAS No. 5, “Accounting for Contingencies.”
Significant judgment is required in making these estimates and
our final liabilities may ultimately be materially different. Our
total estimated liability in respect of litigation and regulatory
proceedings is determined on a case-by-case basis and represents
an estimate of probable losses after considering, among other
factors, the progress of each case or proceeding, our experience
and the experience of others in similar cases or proceedings,
and the opinions and views of legal counsel. Given the inherent
difficulty of predicting the outcome of our litigation and
regulatory matters, particularly in cases or proceedings in
which substantial or indeterminate damages or fines are
sought, we cannot estimate losses or ranges of losses for cases or
proceedings where there is only a reasonable possibility that
a loss may be incurred. See “— Legal Proceedings” in Part I,
Item 3 of the Annual Report on Form 10-K, for information
on our judicial, regulatory and arbitration proceedings.
A prolonged period of weakness in global equity markets and
the trading of securities in multiple markets and on multiple
exchanges could adversely impact our businesses and impair
the value of our goodwill and/or identifiable intangible assets.
In addition, certain events could indicate a potential impairment
of our identifiable intangible assets, including (i) changes
in market structure that could adversely affect our specialist
businesses (see discussion below), (ii) an adverse action or
assessment by a regulator, or (iii) adverse actual experience on the
contracts in our variable annuity and life insurance business.
During the fourth quarter of 2007, as a result of continuing
weak operating results in our NYSE specialist business, we
tested our NYSE specialist rights for impairment in accordance
with SFAS No. 144, “Accounting for the Impairment or Disposal
of Long-Lived Assets.” Under SFAS No. 144, an impairment
loss is recognized if the carrying amount of our NYSE specialist
rights exceeds the projected undiscounted cash flows of the
business over the estimated remaining useful life of our NYSE
specialist rights. Projected undiscounted cash flows exceeded the
carrying amount of our NYSE specialist rights, and accordingly,
we did not record an impairment loss.
We expect that the NYSE will enact numerous rule changes in
2008 that will further align its model with investor requirements
for speed and efficiency of execution and will establish specialists
as Designated Market Makers (DMMs). As DMMs, specialists
will retain their obligation to commit capital but for the first
time, specialists will be able to trade on parity with other market
participants. In addition, we understand that the NYSE plans to
introduce a reserve order system that will allow for anonymous
trade execution and is expected to increase liquidity and market
share. The new rules are expected to bolster the NYSE’s
competitive position by simplifying trading and advancing the
NYSE’s goal of increasing execution speeds.
In projecting the undiscounted cash flows of the business for
the purpose of performing our impairment test, we made several
important assumptions about the potential beneficial effects of
the expected rule and market structure changes described
above. Specifically, we assumed that:
■	 overall equity trading volumes will continue to grow at a rate
consistent with recent historical trends;
■	 the NYSE will be able to recapture approximately one-half
of the market share that it lost in 2007; and
■	 we will increase the market share of our NYSE specialist
business and, as a DMM, the profitability of each share traded.
50 Goldman Sachs 2007 Annual Report
Management’s Discussion and Analysis
Results of Operations
The composition of our net revenues has varied over time as financial markets and the scope of our operations have changed.
The composition of net revenues can also vary over the shorter term due to fluctuations in U.S. and global economic and market
conditions. See “— Certain Risk Factors That May Affect Our Business” above, and “Risk Factors” in Part I, Item 1A of the
Annual Report on Form 10-K.
Financial Overview
The following table sets forth an overview of our financial results:
Financial Overview
		Year Ended November
($ in millions, except per share amounts)				 2007	 2006	 2005
Net revenues				 $45,987	 $37,665	 $25,238
Pre-tax earnings				 17,604	 14,560	 8,273
Net earnings				 11,599	 9,537	 5,626
Net earnings applicable to common shareholders			 11,407	 9,398	 5,609
Diluted earnings per common share				 24.73	 19.69	 11.21
Return on average common shareholders’ equity (1)
			 32.7%	 32.8%	 21.8%
Return on average tangible common shareholders’ equity (2)
			 38.2%	 39.8%	 26.7%
(1)	Return on average common shareholders’ equity is computed by dividing net earnings applicable to common shareholders by average monthly common shareholders’ equity.
(2)	Tangible common shareholders’ equity equals total shareholders’ equity less preferred stock, goodwill and identifiable intangible assets, excluding power contracts.
Identifiable intangible assets associated with power contracts are not deducted from total shareholders’ equity because, unlike other intangible assets, less than 50%
of these assets are supported by common shareholders’ equity.
	 Management believes that return on average tangible common shareholders’ equity (ROTE) is meaningful because it measures the performance of businesses consistently,
whether they were acquired or developed internally. ROTE is computed by dividing net earnings applicable to common shareholders by average monthly tangible common
shareholders’ equity.
	 The following table sets forth a reconciliation of average total shareholders’ equity to average tangible common shareholders’ equity:
	 Average for the Year Ended November
(in millions)				 2007	 2006	 2005
Total shareholders’ equity				 $37,959	 $31,048	 $26,264
Preferred stock				 (3,100)	 (2,400)	 (538)
Common shareholders’ equity				 34,859	 28,648	 25,726
Goodwill and identifiable intangible assets, excluding power contracts			 (4,971)	 (5,013)	 (4,737)
Tangible common shareholders’ equity				 $29,888	 $23,635	 $20,989
51Goldman Sachs 2007 Annual Report
Management’s Discussion and Analysis
2006 versus 2005. Our net revenues were $37.67 billion in
2006, an increase of 49% compared with 2005, reflecting
significantly higher net revenues in Trading and Principal
Investments, Investment Banking, and Asset Management and
Securities Services. The increase in Trading and Principal
Investments reflected significantly higher net revenues in FICC,
Equities and Principal Investments. The increase in FICC
reflected particularly strong performances across all major
businesses. During 2006, FICC operated in an environment
characterized by strong customer-driven activity and favorable
market opportunities. In addition, corporate credit spreads
tightened, the yield curve flattened and volatility levels were
generally low in interest rate and currency markets. The
increase in Equities primarily reflected significantly higher net
revenues in our customer franchise businesses. During 2006,
Equities operated in a favorable environment characterized by
strong customer-driven activity, generally higher equity prices
and favorable market opportunities, although volatility levels
were generally low. The increase in Principal Investments
reflected a significant gain related to our investment in the
ordinary shares of ICBC and higher gains and overrides from
other principal investments, partially offset by a smaller, but
still significant, gain related to our investment in the convertible
preferred stock of SMFG.
The increase in Investment Banking was due to significantly
higher net revenues in Underwriting and Financial Advisory,
as we benefited from strong client activity levels, reflecting
favorable equity and financing markets, strong CEO confidence
and growth in financial sponsor activity.
The increase in Asset Management and Securities Services was
primarily due to higher assets under management and
significantly higher incentive fees, as well as significantly
higher global customer balances in Securities Services. Assets
under management increased $144 billion or 27% to a
record $676 billion, including net asset inflows of $94 billion
during 2006.
Operating Expenses
Our operating expenses are primarily influenced by compensation,
headcount and levels of business activity. A substantial portion
of our compensation expense represents discretionary bonuses
which are significantly impacted by, among other factors, the
level of net revenues, prevailing labor markets, business mix
and the structure of our share-based compensation programs.
For 2007, our ratio of compensation and benefits to net revenues
was 43.9% compared with 43.7% for 2006.
Net Revenues
2007 versus 2006. Our net revenues were $45.99 billion in
2007, an increase of 22% compared with 2006, reflecting
significantly higher net revenues in Trading and Principal
Investments and Investment Banking, and higher net revenues
in Asset Management and Securities Services. The increase in
Trading and Principal Investments reflected higher net revenues
in Equities, FICC and Principal Investments. Net revenues
in Equities increased 33% compared with 2006, reflecting
significantly higher net revenues in both our customer franchise
businesses and principal strategies. During 2007, Equities
operated in an environment characterized by strong customer-
driven activity, generally higher equity prices and higher levels
of volatility, particularly during the second half of the year. The
increase in FICC reflected significantly higher net revenues in
currencies and interest rate products. In addition, net revenues
in mortgages were higher despite a significant deterioration in the
mortgage market throughout the year, while net revenues in
credit products were strong, but slightly lower compared with
2006. Credit products included substantial gains from equity
investments, including a gain of approximately $900 million
related to the disposition of Horizon Wind Energy L.L.C.,
as well as a loss of approximately $1 billion, net of hedges,
related to non-investment-grade credit origination activities.
During 2007, FICC operated in an environment generally
characterized by strong customer-driven activity and favorable
market opportunities. However, during the year, the mortgage
market experienced significant deterioration and, in the second
half of the year, the broader credit markets were characterized
by wider spreads and reduced levels of liquidity. The increase in
Principal Investments reflected strong results in both corporate
and real estate investing.
The increase in Investment Banking reflected a 64% increase
in Financial Advisory net revenues and a strong performance
in our Underwriting business. The increase in Financial Advisory
primarily reflected growth in industry-wide completed mergers
and acquisitions. The increase in Underwriting reflected higher
net revenues in debt underwriting, as leveraged finance activity
was strong during the first half of our fiscal year, while net
revenues in equity underwriting were strong but essentially
unchanged from 2006.
Net revenues in Asset Management and Securities Services also
increased. The increase in Securities Services primarily reflected
significant growth in global customer balances. The increase
in Asset Management reflected significantly higher asset
management fees, partially offset by significantly lower incentive
fees. During the year, assets under management increased
$192 billion, or 28%, to a record $868 billion, including net
inflows of $161 billion.
52 Goldman Sachs 2007 Annual Report
Management’s Discussion and Analysis
The following table sets forth our operating expenses and number of employees:
Operating Expenses and Employees
	 Year Ended November
($ in millions)				 2007	 2006	 2005
Compensation and benefits (1)
				 $20,190	 $16,457	 $11,758
Brokerage, clearing, exchange and distribution fees			 2,758	 1,985	 1,416
Market development				 601	 492	 378
Communications and technology				 665	 544	 490
Depreciation and amortization				 624	 521	 501
Amortization of identifiable intangible assets				 195	 173	 124
Occupancy				 975	 850	 728
Professional fees				 714	 545	 475
Cost of power generation				 335	 406	 386
Other expenses				 1,326	 1,132	 709
Total non-compensation expenses				 8,193	 6,648	 5,207
Total operating expenses				 $28,383	 $23,105	 $16,965
Employees at year end (2)
				 30,522	 26,467	 23,623
(1)	Compensation and benefits includes $168 million, $259 million and $137 million for the years ended November 2007, November 2006 and November 2005, respectively,
attributable to consolidated entities held for investment purposes. Consolidated entities held for investment purposes are entities that are held strictly for capital appreciation,
have a defined exit strategy and are engaged in activities that are not closely related to our principal businesses.
(2)	Excludes 4,572, 3,868 and 7,382 employees as of November 2007, November 2006 and November 2005, respectively, of consolidated entities held for investment
purposes (see footnote 1 above).
The following table sets forth non-compensation expenses of consolidated entities held for investment purposes and our remaining
non-compensation expenses by line item:
Non-Compensation Expenses
	 Year Ended November
(in millions)				 2007	 2006	 2005
Non-compensation expenses of consolidated investments (1)
			 $  446	 $  501	 $  265
Non-compensation expenses excluding consolidated investments
Brokerage, clearing, exchange and distribution fees			 2,758	 1,985	 1,416
Market development				 593	 461	 361
Communications and technology				 661	 537	 487
Depreciation and amortization				 509	 444	 467
Amortization of identifiable intangible assets				 189	 169	 124
Occupancy				 892	 738	 674
Professional fees				 711	 534	 468
Cost of power generation				 335	 406	 386
Other expenses				 1,099	 873	 559
Subtotal				 7,747	 6,147	 4,942
Total non-compensation expenses, as reported				 $8,193	 $6,648	 $5,207
(1)	Consolidated entities held for investment purposes are entities that are held strictly for capital appreciation, have a defined exit strategy and are engaged in activities that
are not closely related to our principal businesses. For example, these investments include consolidated entities that hold real estate assets, such as hotels, but exclude
investments in entities that primarily hold financial assets. We believe that it is meaningful to review non-compensation expenses excluding expenses related to these
consolidated entities in order to evaluate trends in non-compensation expenses related to our principal business activities. Revenues related to such entities are included
in “Trading and principal investments” in the consolidated statements of earnings.
53Goldman Sachs 2007 Annual Report
Management’s Discussion and Analysis
Non-compensation expenses of $6.65 billion for 2006
increased 28% compared with 2005. Excluding non-
compensation expenses related to consolidated entities held for
investment purposes, non-compensation expenses were 24%
higher than 2005, primarily due to higher brokerage, clearing,
exchange and distribution fees in Equities and FICC, and
increased other expenses, primarily due to costs related to our
insurance business, which was acquired in 2006. In addition,
market development costs and professional fees were higher,
reflecting increased levels of business activity, and occupancy
expenses increased, primarily reflecting new office space and
higher facility expenses.
Provision for Taxes
The effective income tax rate was 34.1% for 2007, down from
34.5% for 2006, primarily due to changes in the geographic
mix of earnings. The effective income tax rate was 34.5% for
2006, up from 32.0% for 2005. The increase in the effective
income tax rate for 2006 compared with 2005 was primarily
related to a reduction in the impact of permanent benefits due to
higher levels of earnings in 2006 and audit settlements in 2005.
Our effective income tax rate can vary from period to period
depending on, among other factors, the geographic and
business mix of our earnings, the level of our pre-tax earnings,
the level of our tax credits and the effect of tax audits. Certain
of these and other factors, including our history of pre-tax
earnings, are taken into account in assessing our ability to realize
our net deferred tax assets. See Note 14 to the consolidated
financial statements for further information regarding our
provision for taxes.
2007 versus 2006. Operating expenses were $28.38 billion for
2007, 23% higher than 2006. Compensation and benefits
expenses of $20.19 billion increased 23% compared with
2006, reflecting increased discretionary compensation and
growth in employment levels. The ratio of compensation and
benefits to net revenues for 2007 was 43.9% compared with
43.7% for 2006. Employment levels increased 15% compared
with November 2006.
Non-compensation expenses of $8.19 billion for 2007
increased 23% compared with 2006, primarily attributable
to higher levels of business activity and continued geographic
expansion. One-half of this increase was attributable to
brokerage, clearing, exchange and distribution fees, principally
reflecting higher transaction volumes in Equities. Other
expenses, professional fees and communications and technology
expenses also increased, primarily due to higher levels of business
activity. Occupancy and depreciation and amortization
expenses included exit costs of $128 million related to the
firm’s office space.
2006 versus 2005. Operating expenses were $23.11 billion for
2006, 36% higher than 2005. Compensation and benefits
expenses of $16.46 billion increased 40% compared with
2005, primarily reflecting increased discretionary compensation
due to higher net revenues, and increased levels of employment.
The ratio of compensation and benefits to net revenues for 2006
was 43.7% compared with 46.6% for 2005. This lower ratio
primarily reflected our strong net revenues in 2006. Employment
levels increased 12% compared with November 2005.
In the first quarter of 2006, we adopted SFAS No. 123-R,
which requires that share-based awards granted to retirement-
eligible employees be expensed in the year of grant. In addition
to expensing current year awards, prior year awards must continue
to be amortized over the relevant service period. Therefore, our
compensation and benefits in 2006 included both amortization
of prior year share-based awards held by employees that were
retirement-eligible on the date of adoption of SFAS No. 123-R
and new awards granted to those employees.
Compensation and benefits expenses in 2006 included
$637 million in continued amortization of prior year awards
held by employees that were retirement-eligible on the date of
adoption of SFAS No. 123-R. This amount represents the majority
of the expense to be recognized with respect to these awards.
54 Goldman Sachs 2007 Annual Report
Management’s Discussion and Analysis
Investment Banking
Our Investment Banking segment is divided into two
components:
■	 Financial Advisory. Financial Advisory includes advisory
assignments with respect to mergers and acquisitions, divestitures,
corporate defense activities, restructurings and spin-offs.
■	 Underwriting. Underwriting includes public offerings and
private placements of a wide range of securities and other
financial instruments.
Net revenues in our segments include allocations of interest
income and interest expense to specific securities, commodities
and other positions in relation to the cash generated by, or
funding requirements of, such underlying positions. See Note 16
to the consolidated financial statements for further information
regarding our business segments.
The cost drivers of Goldman Sachs taken as a whole — compensation,
headcount and levels of business activity — are broadly similar
in each of our business segments. Compensation and benefits
expenses within our segments reflect, among other factors,
the overall performance of Goldman Sachs as well as the
performance of individual business units. Consequently, pre-tax
margins in one segment of our business may be significantly
affected by the performance of our other business segments.
A discussion of segment operating results follows.
Segment Operating Results
The following table sets forth the net revenues, operating expenses and pre-tax earnings of our segments:
Segment Operating Results
	 Year Ended November
(in millions)				 2007	 2006	 2005
Investment Banking	 Net revenues	 $ 7,555	 $  5,629 	 $  3,671
	 Operating expenses	 4,985	 4,062	 3,258
	 Pre-tax earnings	 $  2,570	 $  1,567	 $   413
Trading and Principal Investments	 Net revenues	 $31,226	 $25,562	 $16,818
	 Operating expenses	 17,998	 14,962	 10,600
	 Pre-tax earnings	 $13,228	 $10,600	 $  6,218
Asset Management and Securities Services	 Net revenues	 $ 7,206	 $  6,474	 $  4,749
	 Operating expenses	 5,363	 4,036	 3,070
	 Pre-tax earnings	 $  1,843	 $  2,438	 $  1,679
Total	 Net revenues	 $45,987	 $37,665	 $25,238
	 Operating expenses (1)
	 28,383	 23,105	 16,965
	 Pre-tax earnings	 $17,604	 $14,560 	 $  8,273
(1)	Operating expenses include net provisions for a number of litigation and regulatory proceedings of $37 million, $45 million and $37 million for the years ended
November 2007, November 2006 and November 2005, respectively, that have not been allocated to our segments.
55Goldman Sachs 2007 Annual Report
Management’s Discussion and Analysis
2006 versus 2005. Net revenues in Investment Banking of
$5.63 billion for 2006 increased 53% compared with 2005.
Net revenues in Financial Advisory of $2.58 billion increased
35% compared with 2005, primarily reflecting strong growth in
industry-wide completed mergers and acquisitions. Net revenues
in our Underwriting business of $3.05 billion increased 73%
compared with 2005. Net revenues were significantly higher in
equity underwriting, reflecting increased client activity. Net
revenues were also significantly higher in debt underwriting,
primarily due to a significant increase in leveraged finance
activity and, to a lesser extent, an increase in investment-grade
activity. Our investment banking transaction backlog at the
end of 2006 was at its highest level since 2000. (1)
Operating expenses of $4.06 billion for 2006 increased 25%
compared with 2005, substantially all of which was due to
increased compensation and benefits expenses resulting from
higher levels of discretionary compensation. Pre-tax earnings
were $1.57 billion in 2006 compared with $413 million in 2005.
The following table sets forth the operating results of our Investment Banking segment:
Investment Banking Operating Results
	 Year Ended November
(in millions)				 2007	 2006	 2005
Financial Advisory				 $4,222	 $2,580	 $1,905
  Equity underwriting				 1,382	 1,365	 704
  Debt underwriting				 1,951	 1,684	 1,062
Total Underwriting				 3,333	 3,049	 1,766
Total net revenues				 7,555	 5,629	 3,671
Operating expenses				 4,985	 4,062	 3,258
Pre-tax earnings				 $2,570	 $1,567	 $  413
The following table sets forth our financial advisory and underwriting transaction volumes:
Goldman Sachs Global Investment Banking Volumes (1)
	 Year Ended November
(in billions)				 2007	 2006	 2005
Announced mergers and acquisitions				 $1,494	 $1,104	 $747
Completed mergers and acquisitions				 1,424	 864	 584
Equity and equity-related offerings (2)
				 71	 80	 49
Debt offerings (3)
				 312	 320	 270
(1)	Source: Thomson Financial. Announced and completed mergers and acquisitions volumes are based on full credit to each of the advisors in a transaction. Equity and
equity-related offerings and debt offerings are based on full credit for single book managers and equal credit for joint book managers. Transaction volumes may not be
indicative of net revenues in a given period.
(2)	Includes Rule 144A and public common stock offerings, convertible offerings and rights offerings.
(3)	Includes non-convertible preferred stock, mortgage-backed securities, asset-backed securities and taxable municipal debt. Includes publicly registered and Rule 144A issues.
(1)	Our investment banking transaction backlog represents an estimate of our future net revenues from investment banking transactions where we believe that future
revenue realization is more likely than not.
2007 versus 2006. Net revenues in Investment Banking of
$7.56 billion for 2007 increased 34% compared with 2006.
Net revenues in Financial Advisory of $4.22 billion increased
64% compared with 2006, primarily reflecting growth in industry-
wide completed mergers and acquisitions. Net revenues in our
Underwriting business of $3.33 billion increased 9% compared
with 2006, due to higher net revenues in debt underwriting,
primarily reflecting strength in leveraged finance during the first
half of 2007. Net revenues in equity underwriting were also
strong, but essentially unchanged from 2006. Our investment
banking transaction backlog at the end of 2007 was higher
than at the end of 2006. (1)
Operating expenses of $4.99 billion for 2007 increased 23%
compared with 2006, primarily due to increased compensation
and benefits expenses resulting from higher discretionary
compensation and growth in employment levels. Pre-tax earnings
of $2.57 billion in 2007 increased 64% compared with 2006.
56 Goldman Sachs 2007 Annual Report
Management’s Discussion and Analysis
The following table sets forth the operating results of our Trading and Principal Investments segment:
Trading and Principal Investments Operating Results
	 Year Ended November
(in millions)				 2007	 2006	 2005
FICC				 $16,165	 $14,262 	 $  8,940
  Equities trading				 6,725	 4,965	 2,675
  Equities commissions				 4,579	 3,518	 2,975
Total Equities				 11,304	 8,483	 5,650
  ICBC				 495	 937	 —
  SMFG				 (129)	 527	 1,475
  Gross gains				 3,728	 1,534	 767
  Gross losses				 (814)	 (585)	 (198)
   Net other corporate and real estate investments			 2,914	 949	 569
  Overrides				 477	 404	 184
Total Principal Investments				 3,757	 2,817	 2,228
Total net revenues				 31,226	 25,562	 16,818
Operating expenses				 17,998	 14,962	 10,600
Pre-tax earnings				 $13,228	 $10,600	 $  6,218
of SMFG. We generate net revenues from returns on these
investments and from the increased share of the income and
gains derived from our merchant banking funds when the
return on a fund’s investments over the life of the fund exceeds
certain threshold returns (typically referred to as an override).
Substantially all of our inventory is marked-to-market daily
and, therefore, its value and our net revenues are subject to
fluctuations based on market movements. In addition, net
revenues derived from our principal investments in privately
held concerns and in real estate may fluctuate significantly
depending on the revaluation of these investments in any given
period. We also regularly enter into large transactions as part of
our trading businesses. The number and size of such transactions
may affect our results of operations in a given period.
Net revenues from Principal Investments do not include
management fees generated from our merchant banking funds.
These management fees are included in the net revenues of the
Asset Management and Securities Services segment.
Trading and Principal Investments
Our Trading and Principal Investments segment is divided into
three components:
■	 FICC. We make markets in and trade interest rate and credit
products, mortgage-related securities and loan products and
other asset-backed instruments, currencies and commodities,
structure and enter into a wide variety of derivative
transactions, and engage in proprietary trading and investing.
■	 Equities. We make markets in and trade equities and equity-
related products, structure and enter into equity derivative
transactions and engage in proprietary trading. We generate
commissions from executing and clearing client transactions
on major stock, options and futures exchanges worldwide
through our Equities customer franchise and clearing activities.
We also engage in specialist and insurance activities.
■	 Principal Investments. We make real estate and corporate
principal investments, including our investments in the
ordinary shares of ICBC and the convertible preferred stock
57Goldman Sachs 2007 Annual Report
Management’s Discussion and Analysis
2006 versus 2005.  Net revenues in Trading and Principal
Investments of $25.56 billion for 2006 increased 52% compared
with 2005.
Net revenues in FICC of $14.26 billion increased 60%
compared with 2005, primarily due to significantly higher net
revenues in credit products (which includes distressed investing)
and commodities. In addition, net revenues were higher in
interest rate products, currencies and mortgages. During 2006,
the business operated in an environment characterized by strong
customer-driven activity and favorable market opportunities.
In addition, corporate credit spreads tightened, the yield curve
flattened and volatility levels were generally low in interest rate
and currency markets.
Net revenues in Equities of $8.48 billion increased 50%
compared with 2005, primarily reflecting significantly higher
net revenues in derivatives, across all regions, as well as higher
net revenues in shares. The increase also reflected the contribution
from our insurance business, which was acquired in 2006. In
addition, principal strategies performed well, although net
revenues were lower than a particularly strong 2005. During
2006, Equities operated in a favorable environment characterized
by strong customer-driven activity, generally higher equity
prices and favorable market opportunities, although volatility
levels were generally low.
Principal Investments recorded net revenues of $2.82 billion
for 2006, reflecting a $937 million gain related to our investment
in the ordinary shares of ICBC, a $527 million gain related to
our investment in the convertible preferred stock of SMFG and
$1.35 billion in gains and overrides from other principal
investments.
Operating expenses of $14.96 billion for 2006 increased 41%
compared with 2005, due to increased compensation and
benefits expenses, primarily resulting from higher levels of
discretionary compensation due to higher net revenues and
increased levels of employment, as well as higher non-compensation
expenses. Excluding non-compensation expenses related to
consolidated entities held for investment purposes, the increase
in non-compensation expenses was primarily due to higher
brokerage, clearing, exchange and distribution fees, in Equities
and FICC, and increased other expenses, primarily due to costs
related to our insurance business, which was acquired in 2006,
and higher levels of business activity. In addition, professional
fees were higher, due to increased legal and consulting fees.
Pre-tax earnings of $10.60 billion in 2006 increased 70%
compared with 2005.
2007 versus 2006.  Net revenues in Trading and Principal
Investments of $31.23 billion for 2007 increased 22% compared
with 2006.
Net revenues in FICC of $16.17 billion for 2007 increased
13% compared with 2006, reflecting significantly higher net
revenues in currencies and interest rate products. In addition,
net revenues in mortgages were higher despite a significant
deterioration in the mortgage market throughout 2007, while
net revenues in credit products were strong, but slightly lower
compared with 2006. Credit products included substantial
gains from equity investments, including a gain of approximately
$900 million related to the disposition of Horizon Wind
Energy L.L.C., as well as a loss of approximately $1 billion,
net of hedges, related to non-investment-grade credit origination
activities. Net revenues in commodities were also strong but
lower compared with 2006. During 2007, FICC operated in
an environment generally characterized by strong customer-
driven activity and favorable market opportunities. However,
during 2007, the mortgage market experienced significant
deterioration and, in the second half of the year, the broader
credit markets were characterized by wider spreads and reduced
levels of liquidity.
Net revenues in Equities of $11.30 billion for 2007 increased
33% compared with 2006, reflecting significantly higher net
revenues in both our customer franchise businesses and principal
strategies. The customer franchise businesses benefited from
significantly higher commission volumes. During 2007, Equities
operated in an environment characterized by strong customer-
driven activity, generally higher equity prices and higher levels
of volatility, particularly during the second half of the year.
Principal Investments recorded net revenues of $3.76 billion
for 2007, reflecting gains and overrides from corporate and real
estate principal investments. Results in Principal Investments
included a $495 million gain related to our investment in the
ordinary shares of ICBC and a $129 million loss related to our
investment in the convertible preferred stock of SMFG.
Operating expenses of $18.00 billion for 2007 increased 20%
compared with 2006, primarily due to increased compensation
and benefits expenses, resulting from higher discretionary
compensation and growth in employment levels. Non-
compensation expenses increased due to the impact of higher
levels of business activity and continued geographic expansion.
The majority of this increase was in brokerage, clearing,
exchange and distribution fees, which primarily reflected higher
transaction volumes in Equities. Other expenses and professional
fees also increased, reflecting increased business activity. Pre-tax
earnings of $13.23 billion in 2007 increased 25% compared
with 2006.
58 Goldman Sachs 2007 Annual Report
Management’s Discussion and Analysis
Assets under management typically generate fees as a percentage
of asset value, which is affected by investment performance
and by inflows or redemptions. The fees that we charge vary by
asset class, as do our related expenses. In certain circumstances,
we are also entitled to receive incentive fees based on a percentage
of a fund’s return or when the return on assets under management
exceeds specified benchmark returns or other performance targets.
Incentive fees are recognized when the performance period
ends and they are no longer subject to adjustment. We have
numerous incentive fee arrangements, many of which have
annual performance periods that end on December 31. For
that reason, incentive fees have been seasonally weighted to
our first quarter.
Asset Management and Securities Services
Our Asset Management and Securities Services segment is
divided into two components:
■	 Asset Management. Asset Management provides investment
advisory and financial planning services and offers investment
products (primarily through separately managed accounts
and commingled vehicles, such as mutual funds and private
investment funds) across all major asset classes to a diverse
group of institutions and individuals worldwide and
primarily generates revenues in the form of management
and incentive fees.
■	 Securities Services. Securities Services provides prime
brokerage services, financing services and securities lending
services to institutional clients, including hedge funds, mutual
funds, pension funds and foundations, and to high-net-worth
individuals worldwide, and generates revenues primarily in
the form of interest rate spreads or fees.
The following table sets forth the operating results of our Asset Management and Securities Services segment:
Asset Management and Securities Services Operating Results
	 Year Ended November
(in millions)				 2007	 2006	 2005
  Management and other fees				 $4,303	 $3,332	 $2,629
  Incentive fees 				 187	 962	 327
Total Asset Management 				 4,490	 4,294	 2,956
Securities Services				 2,716	 2,180	 1,793
Total net revenues				 7,206	 6,474	 4,749
Operating expenses				 5,363	 4,036	 3,070
Pre-tax earnings				 $1,843	 $2,438	 $1,679
Assets under management include our mutual funds, alternative investment funds and separately managed accounts for institutional
and individual investors. Substantially all assets under management are valued as of calendar month end. Assets under management
do not include assets in brokerage accounts that generate commissions, mark-ups and spreads based on transactional activity,
or our own investments in funds that we manage.
The following table sets forth our assets under management by asset class:
Assets Under Management by Asset Class
	 As of November 30
(in billions)				 2007	 2006	 2005
Alternative investments (1)
				 $151	 $145	 $110
Equity				 255	 215	 167
Fixed income				 256	 198	 154
Total non-money market assets				 662	 558	 431
Money markets				 206	 118	 101
Total assets under management				 $868	 $676	 $532
(1)	Primarily includes hedge funds, private equity, real estate, currencies, commodities and asset allocation strategies.
59Goldman Sachs 2007 Annual Report
Management’s Discussion and Analysis
The following table sets forth a summary of the changes in our assets under management:
Changes in Assets Under Management
	 Year Ended November 30
(in billions)				 2007	 2006	 2005
Balance, beginning of year				 $676	 $532	 $452
Net inflows/(outflows)
  Alternative investments 				 9	 32	 11
  Equity				 26	 16	 25
  Fixed income				 38	 29	 16
Total non-money market net inflows/(outflows)				 73 (1)
	 77	 52
  Money markets				 88	 17 (2)
	 11
Total net inflows/(outflows)				 161	 94 (3)
	 63
Net market appreciation/(depreciation)				 31	 50	 17
Balance, end of year				 $868	 $676	 $532
(1)	Includes $7 billion in net asset inflows in connection with our acquisition of Macquarie — IMM Investment Management.
(2)	Net of the transfer of $8 billion of money market assets under management to interest-bearing deposits at GS Bank USA, a wholly owned subsidiary of Goldman Sachs.
These deposits are not included in assets under management.
(3)	Includes $3 billion of net asset inflows in connection with the acquisition of our variable annuity and life insurance business.
2006 versus 2005. Net revenues in Asset Management and
Securities Services of $6.47 billion for 2006 increased 36%
compared with 2005.
Asset Management net revenues of $4.29 billion increased
45% compared with 2005, reflecting significantly higher
management and other fees, principally due to strong growth
in assets under management, and significantly higher incentive
fees. During the year, assets under management increased
$144 billion or 27% to $676 billion, reflecting non-money
market net inflows of $77 billion, spread across all asset
classes, money market net inflows of $17 billion (2)
, and market
appreciation of $50 billion, primarily in equity and fixed
income assets.
Securities Services net revenues of $2.18 billion increased 22%
compared with 2005, as our prime brokerage business continued
to generate strong results, primarily reflecting significantly
higher global customer balances in securities lending and
margin lending.
Operating expenses of $4.04 billion for 2006 increased 31%
compared with 2005, primarily due to increased compensation
and benefits expenses, resulting from higher levels of discretionary
compensation due to higher net revenues, and increased levels
of employment. Non-compensation expenses also increased,
primarily due to higher distribution fees. In addition, market
development costs were higher, reflecting increased levels of
business activity. Pre-tax earnings of $2.44 billion in 2006
increased 45% compared with 2005.
(2)	Includes the transfer of $8 billion of money market assets under management to
interest-bearing deposits at GS Bank USA. These deposits are not included in
assets under management.
2007 versus 2006. Net revenues in Asset Management and
Securities Services of $7.21 billion for 2007 increased 11%
compared with 2006.
Asset Management net revenues of $4.49 billion for 2007
increased 5% compared with 2006, reflecting a 29% increase
in management and other fees, partially offset by significantly
lower incentive fees. Incentive fees were $187 million for 2007
compared with $962 million for 2006. During 2007, assets under
management increased $192 billion, or 28%, to $868 billion,
reflecting non-money market net inflows of $73 billion (1)
,
primarily in fixed income and equity assets, money market
net inflows of $88 billion, and net market appreciation of
$31 billion, reflecting appreciation in fixed income and
equity assets, partially offset by depreciation in alternative
investment assets.
Securities Services net revenues of $2.72 billion for 2007
increased 25% compared with 2006, as our prime brokerage
business continued to generate strong results, primarily reflecting
significantly higher customer balances in securities lending and
margin lending.
Operating expenses of $5.36 billion for 2007 increased 33%
compared with 2006, primarily due to increased compensation
and benefits expenses resulting from higher discretionary
compensation and growth in employment levels, and higher
distribution fees (included in brokerage, clearing, exchange and
distribution fees). Pre-tax earnings of $1.84 billion in 2007
decreased 24% compared with 2006.
(1)	Includes $7 billion in net asset inflows in connection with our acquisition of
Macquarie — IMM Investment Management.
60 Goldman Sachs 2007 Annual Report
Management’s Discussion and Analysis
residential mortgages, home equity and auto loans, government
and corporate bonds, and other types of financial assets. Other
reasons for entering into these arrangements include underwriting
client securitization transactions; providing secondary market
liquidity; making investments in performing and nonperforming
debt, equity, real estate and other assets; providing investors
with credit-linked and asset-repackaged notes; and receiving
or providing letters of credit to satisfy margin requirements
and to facilitate the clearance and settlement process.
We engage in transactions with variable interest entities (VIEs)
and qualifying special-purpose entities (QSPEs). Such vehicles
are critical to the functioning of several significant investor
markets, including the mortgage-backed and other asset-
backed securities markets, since they offer investors access to
specific cash flows and risks created through the securitization
process. Our financial interests in, and derivative transactions
with, such nonconsolidated entities are accounted for at fair
value, in the same manner as our other financial instruments,
except in cases where we apply the equity method of accounting.
While we are routinely involved with VIEs and QSPEs in
connection with our securitization activities, we did not have
off-balance-sheet commitments to purchase or finance
collateralized debt obligations held by structured investment
vehicles as of November 2007.
Geographic Data
For a summary of the net revenues and pre-tax earnings
of Goldman Sachs by geographic region, see Note 16 to the
consolidated financial statements.
Off-Balance-Sheet Arrangements
We have various types of off-balance-sheet arrangements that
we enter into in the ordinary course of business. Our involvement
in these arrangements can take many different forms, including
purchasing or retaining residual and other interests in mortgage-
backed and other asset-backed securitization vehicles; holding
senior and subordinated debt, interests in limited and general
partnerships, and preferred and common stock in other
nonconsolidated vehicles; entering into interest rate, foreign
currency, equity, commodity and credit derivatives, including
total return swaps; entering into operating leases; and providing
guarantees, indemnifications, loan commitments, letters of
credit and representations and warranties.
We enter into these arrangements for a variety of business
purposes, including the securitization of commercial and
The following table sets forth where a discussion of these and other off-balance-sheet arrangements may be found in this
Annual Report:
Type of Off-Balance-Sheet Arrangement	 Disclosure in Annual Report
Retained interests or contingent interests in assets 	 See Note 3 to the consolidated financial statements.
transferred by us to nonconsolidated entities
Leases, letters of credit, and loans and other commitments	 See “— Contractual Obligations and Commitments” below 	
	 and Note 6 to the consolidated financial statements.
Guarantees 	 See Note 6 to the consolidated financial statements.
Other obligations, including contingent obligations, arising out 	 See Note 3 to the consolidated financial statements.
of variable interests we have in nonconsolidated entities
Derivative contracts	 See “— Critical Accounting Policies” above and
	 “— Risk Management” below and Notes 3 and 5
	 to the consolidated financial statements.
In addition, see Note 2 to the consolidated financial statements for a discussion of our consolidation policies.
61Goldman Sachs 2007 Annual Report
Management’s Discussion and Analysis
Subsidiary Capital Requirements
Many of our principal subsidiaries are subject to separate
regulation and capital requirements in the United States and/or
elsewhere. Goldman, Sachs  Co. and Goldman Sachs
Execution  Clearing, L.P. are registered U.S. broker-dealers and
futures commissions merchants, and are subject to regulatory
capital requirements, including those imposed by the SEC, the
Commodity Futures Trading Commission, the Chicago Board
of Trade, The Financial Industry Regulatory Authority
(FINRA) and the National Futures Association. Goldman
Sachs International, our regulated U.K. broker-dealer, is subject
to minimum capital requirements imposed by the U.K.’s
Financial Services Authority. Goldman Sachs Japan Co., Ltd.,
our regulated Japanese broker-dealer, is subject to minimum
capital requirements imposed by Japan’s Financial Services
Agency. Several other subsidiaries of Goldman Sachs are
regulated by securities, investment advisory, banking, insurance,
and other regulators and authorities around the world. As of
November 2007 and November 2006, these subsidiaries were
in compliance with their local capital requirements.
As discussed above, many of our subsidiaries are subject to
regulatory capital requirements in jurisdictions throughout the
world. Subsidiaries not subject to separate regulation may hold
capital to satisfy local tax guidelines, rating agency requirements
(for entities with assigned credit ratings) or internal policies,
including policies concerning the minimum amount of capital
a subsidiary should hold based on its underlying level of risk.
See “— Liquidity and Funding Risk — Conservative Liability
Structure” below for a discussion of our potential inability to
access funds from our subsidiaries.
Equity investments in subsidiaries are generally funded with
parent company equity capital. As of November 2007, Group Inc.’s
equity investment in subsidiaries was $40.00 billion compared
with its total shareholders’ equity of $42.80 billion.
Our capital invested in non-U.S. subsidiaries is generally exposed
to foreign exchange risk, substantially all of which is managed
through a combination of derivative contracts and non-U.S.
denominated debt. In addition, we generally manage the non-
trading exposure to foreign exchange risk that arises from
transactions denominated in currencies other than the transacting
entity’s functional currency.
See Note 15 to the consolidated financial statements for further
information regarding our regulated subsidiaries.
Equity Capital
The level and composition of our equity capital are principally
determined by our consolidated regulatory capital requirements
but may also be influenced by rating agency guidelines, subsidiary
capital requirements, the business environment, conditions in
the financial markets and assessments of potential future losses
due to extreme and adverse changes in our business and market
environments. As of November 2007, our total shareholders’
equity was $42.80 billion (consisting of common shareholders’
equity of $39.70 billion and preferred stock of $3.10 billion)
compared with total shareholders’ equity of $35.79 billion as of
November 2006 (consisting of common shareholders’ equity of
$32.69 billion and preferred stock of $3.10 billion). In addition
to total shareholders’ equity, we consider the $5.00 billion of
junior subordinated debt issued to trusts (see discussion below)
to be part of our equity capital, as it qualifies as capital for
regulatory and certain rating agency purposes.
Consolidated Regulatory Capital Requirements
Goldman Sachs is regulated by the Securities and Exchange
Commission (SEC) as a CSE and, as such, is subject to group-
wide supervision and examination by the SEC and to minimum
capital adequacy standards on a consolidated basis. Minimum
capital adequacy standards are principally driven by the
amount of our market risk, credit risk and operational risk as
calculated by methodologies approved by the SEC. Eligible
sources of regulatory capital include common equity and certain
types of preferred stock, debt and hybrid capital instruments,
including our junior subordinated debt issued to trusts. The
recognition of preferred stock, debt and hybrid capital instruments
as regulatory capital is subject to limitations. Goldman Sachs
was in compliance with the CSE capital adequacy standards as
of November 2007 and November 2006.
Rating Agency Guidelines
The credit rating agencies assign credit ratings to the obligations
of The Goldman Sachs Group, Inc., which directly issues or
guarantees substantially all of Goldman Sachs’ senior unsecured
obligations. The level and composition of our equity capital
are among the many factors considered in determining our
credit ratings. Each agency has its own definition of eligible
capital and methodology for evaluating capital adequacy, and
assessments are generally based on a combination of factors
rather than a single calculation. See “— Liquidity and Funding
Risk — Credit Ratings” below for further information regarding
our credit ratings.
62 Goldman Sachs 2007 Annual Report
Management’s Discussion and Analysis
Preferred Stock. As of November 2007, Goldman Sachs had 124,000 shares of perpetual non-cumulative preferred stock
issued and outstanding in four series as set forth in the following table:
Preferred Stock by Series
	 Shares	 Shares			 Earliest	 Redemption Value	
Series	 Issued	 Authorized	 Dividend Rate	 Redemption Date	 (in millions)
A	 30,000	 50,000	 3 month LIBOR + 0.75%, with floor of 3.75% per annum	 April 25, 2010	 $  750
B	 32,000	 50,000 	 6.20% per annum	 October 31, 2010	 800
C	 8,000	 25,000 	 3 month LIBOR + 0.75%, with floor of 4% per annum	 October 31, 2010	 200
D	 54,000	 60,000	 3 month LIBOR + 0.67%, with floor of 4% per annum	 May 24, 2011	 1,350
	 124,000	 185,000	
		
	 $3,100
by general market conditions and the prevailing price and trading
volumes of our common stock.
The following table sets forth the level of share repurchases for
the years ended November 2007 and November 2006:
	 As of November
(in millions, except per share amounts)	 2007	 2006
Number of shares repurchased	 41.22	 50.23
Total cost	 $  8,956	 $  7,817
Average cost per share	 $217.29	 $155.64
The repurchase program was increased by 60.0 million shares
on December 17, 2007. Taking into account this increased
authorization, the total remaining authorization under the
repurchase program was 65.4 million shares as of January 18, 2008.
For additional information on our repurchase program, see
“Market for Registrant’s Common Equity, Related Stockholder
Matters and Issuer Purchases of Equity Securities” in Part ll,
Item 5 of the Annual Report on Form 10-K.
Our ability to declare or pay dividends on, or purchase, redeem
or otherwise acquire, our common stock is subject to certain
restrictions in the event that we fail to pay or set aside full
dividends on our preferred stock for the latest completed dividend
period. All series of preferred stock are pari passu and have a
preference over our common stock upon liquidation.
Equity Capital Management
Our objective is to maintain a sufficient level and optimal
composition of equity capital. We manage our capital through
repurchases of our common stock and issuances of preferred stock,
junior subordinated debt issued to trusts and other subordinated
debt. We manage our capital requirements principally by setting
limits on balance sheet assets and/or limits on risk, in each case
at both the consolidated and business unit levels. We attribute
capital usage to each of our business units based upon the CSE
regulatory capital framework and manage the levels of usage
based upon the balance sheet and risk limits established.
Share Repurchase Program. We use our share repurchase
program to help maintain the appropriate level of common
equity and to substantially offset increases in share count over
time resulting from employee share-based compensation. The
repurchase program is effected primarily through regular open-
market purchases, the amounts and timing of which are
determined primarily by our current and projected capital
positions (i.e., comparisons of our desired level of capital to
our actual level of capital) but which may also be influenced
Each share of preferred stock issued and outstanding has a
par value of $0.01, has a liquidation preference of $25,000, is
represented by 1,000 depositary shares and is redeemable at
our option at a redemption price equal to $25,000 plus
declared and unpaid dividends. Dividends on each series of
preferred stock, if declared, are payable quarterly in arrears.
63Goldman Sachs 2007 Annual Report
Management’s Discussion and Analysis
Junior Subordinated Debt Issued to a Trust in
Connection with Trust Preferred Securities. We issued
$2.84 billion of junior subordinated debentures in the first
quarter of 2004 to Goldman Sachs Capital I, a Delaware
statutory trust that, in turn, issued $2.75 billion of guaranteed
preferred beneficial interests to third parties and $85 million
of common beneficial interests to Goldman Sachs. The junior
subordinated debentures are included in “Unsecured long-term
borrowings” in the consolidated statements of financial condition.
Because of certain characteristics of the junior subordinated
debt (and the associated trust preferred securities), including
its long-term nature, our ability to defer coupon interest for up
to ten consecutive semiannual periods and the subordinated
nature of the debt in our capital structure, it qualifies as
regulatory capital for CSE purposes and is included as part of
our equity capital.
Subordinated Debt. In addition to junior subordinated debt
issued to trusts, we had other outstanding subordinated debt
of $11.23 billion as of November 2007. Although not part of our
shareholders’ equity, subordinated debt may be used to meet a
portion of our consolidated capital requirements as a CSE.
Junior Subordinated Debt Issued to Trusts in Connection
with Normal Automatic Preferred Enhanced Capital
Securities.  In the second quarter of 2007, we issued
$1.75 billion of fixed rate junior subordinated debt to
Goldman Sachs Capital II and $500 million of floating rate
junior subordinated debt to Goldman Sachs Capital III,
Delaware statutory trusts that, in turn, issued $2.25 billion of
guaranteed perpetual Automatic Preferred Enhanced Capital
Securities (APEX) to third parties and a de minimis amount of
common securities to Goldman Sachs. The junior subordinated
debt is included in “Unsecured long-term borrowings” in the
consolidated statements of financial condition. In connection
with the APEX issuance, we entered into stock purchase contracts
with Goldman Sachs Capital II and III under which we will be
obligated to sell and these entities will be obligated to purchase
$2.25 billion of perpetual non-cumulative preferred stock that
we will issue in the future. Goldman Sachs Capital II and III
are required to remarket the junior subordinated debt in order
to fund their purchase of the preferred stock, but in the event
that a remarketing is unsuccessful, they will relinquish the
subordinated debt to us in exchange for the preferred stock.
Because of certain characteristics of the junior subordinated
debt (and the associated APEX), including its long-term nature,
the future issuance of perpetual non-cumulative preferred stock
under the stock purchase contracts, our ability to defer payments
due on the debt and the subordinated nature of the debt in our
capital structure, it qualifies as regulatory capital for CSE
purposes and is included as part of our equity capital.
64 Goldman Sachs 2007 Annual Report
Management’s Discussion and Analysis
	 The following table sets forth the reconciliation of total shareholders’ equity to
tangible equity capital:
	 As of November
(in millions)	 2007	 2006
Total shareholders’ equity	 $42,800	 $35,786
Add: 	 Junior subordinated debt
	  issued to trusts	 5,000	 2,750
Deduct:	 Goodwill and identifiable intangible
	  assets, excluding power contracts	 (5,072)	 (5,019)
Tangible equity capital	 $42,728	 $33,517
(3)	Leverage ratio equals total assets divided by total shareholders’ equity.
(4)	Adjusted leverage ratio equals adjusted assets divided by tangible equity capital.
We believe that the adjusted leverage ratio is a more meaningful measure of our
capital adequacy than the leverage ratio because it excludes certain low-risk
collateralized assets that are generally supported with little or no capital and
reflects the tangible equity capital deployed in our businesses.
(5)	Debt to equity ratio equals unsecured long-term borrowings divided by total
shareholders’ equity.
(6)	Tangible common shareholders’ equity equals total shareholders’ equity less
preferred stock, goodwill and identifiable intangible assets, excluding power
contracts. We do not deduct identifiable intangible assets associated with power
contracts from total shareholders’ equity because, unlike other intangible assets,
less than 50% of these assets are supported by common shareholders’ equity.
	 The following table sets forth a reconciliation of total shareholders’ equity to
tangible common shareholders’ equity:
	 As of November
(in millions)	 2007	 2006
Total shareholders’ equity	 $42,800	 $35,786
Deduct: 	Preferred stock	 (3,100)	 (3,100)
Common shareholders’ equity	 39,700	 32,686
Deduct:	 Goodwill and identifiable intangible
	  assets, excluding power contracts	 (5,072)	 (5,019)
Tangible common shareholders’ equity	 $34,628	 $27,667
(7)	Book value per common share is based on common shares outstanding, including
restricted stock units granted to employees with no future service requirements,
of 439.0 million and 450.1 million as of November 2007 and November 2006,
respectively.
(8)	Tangible book value per common share is computed by dividing tangible common
shareholders’ equity by the number of common shares outstanding, including
restricted stock units granted to employees with no future service requirements.
Capital Ratios and Metrics
The following table sets forth information on our assets,
shareholders’ equity, leverage ratios and book value per
common share:
	 As of November
($ in millions, except per share amounts)	 2007	 2006
Total assets	 $1,119,796	 $838,201
Adjusted assets (1)
	 747,300	 541,033
Total shareholders’ equity	 42,800	 35,786
Tangible equity capital (2)
	 42,728	 33,517
Leverage ratio (3)
	 26.2x	 23.4x
Adjusted leverage ratio (4)
	 17.5x	 16.1x
Debt to equity ratio (5)
	 3.8x	 3.4x
Common shareholders’ equity	 39,700	 32,686
Tangible common
  shareholders’ equity (6)
	 34,628	 27,667
Book value per common share (7)
	 $     90.43	 $   72.62
Tangible book value
  per common share (8)
	 78.88	 61.47
(1)	Adjusted assets excludes (i) low-risk collateralized assets generally associated
with our matched book and securities lending businesses (which we calculate by
adding our securities borrowed and financial instruments purchased under
agreements to resell, at fair value, and then subtracting our nonderivative short
positions), (ii) cash and securities we segregate for regulatory and other purposes
and (iii) goodwill and identifiable intangible assets, excluding power contracts. We
do not deduct identifiable intangible assets associated with power contracts from
total assets in order to be consistent with the calculation of tangible equity capital
and the adjusted leverage ratio (see footnote 2 below).
	 The following table sets forth a reconciliation of total assets to adjusted assets:
	 As of November
(in millions)	 2007	 2006
Total assets	 $1,119,796	 $ 838,201
Deduct:	 Securities borrowed	 (277,413)	 (219,342)
	 Financial instruments
	  purchased under agreements
	  to resell, at fair value	 (85,717)	 (82,126)
Add:	 Financial instruments sold,
	  but not yet purchased,
	  at fair value	 215,023	 155,805
	 Less derivative liabilities	 (99,378)	 (65,496)
	 Subtotal	 115,645	 90,309
Deduct:	 Cash and securities segregated
	  for regulatory and other purposes	 (119,939)	 (80,990)
	 Goodwill and identifiable intangible
	  assets, excluding power contracts	 (5,072)	 (5,019)
Adjusted assets	 $  747,300	 $ 541,033
(2)	Tangible equity capital equals total shareholders’ equity and junior subordinated
debt issued to trusts less goodwill and identifiable intangible assets, excluding
power contracts. We do not deduct identifiable intangible assets associated with
power contracts from total shareholders’ equity because, unlike other intangible
assets, less than 50% of these assets are supported by common shareholders’
equity. We consider junior subordinated debt issued to trusts to be a component
of our tangible equity capital base due to certain characteristics of the debt, including
its long-term nature, our ability to defer payments due on the debt and the
subordinated nature of the debt in our capital structure.
65Goldman Sachs 2007 Annual Report
Management’s Discussion and Analysis
Contractual Obligations and Commitments
Goldman Sachs has contractual obligations to make future payments related to our unsecured long-term borrowings, secured
long-term financings, long-term noncancelable lease agreements and purchase obligations and has commitments under a variety
of commercial arrangements.
The following table sets forth our contractual obligations by fiscal maturity date as of November 2007:
Contractual Obligations
						
(in millions) 		 2008	 2009 – 2010	 2011– 2012	 2013 – Thereafter	 Total
Unsecured long-term borrowings (1) (2) (3)
		 $    —	 $36,885	 $29,295	 $97,994	 $164,174
Secured long-term financings (1) (2) (4)
		 —	 5,204	7,400	 20,696	 33,300
Minimum rental payments		 450	 850	 568	 2,022	 3,890
Purchase obligations (5)
		 2,176	 309	 21	 27	 2,533
(1)	Obligations maturing within one year of our financial statement date or redeemable within one year of our financial statement date at the option of the holder are excluded
from this table and are treated as short-term obligations. See Note 3 to the consolidated financial statements for further information regarding our secured financings.
(2)	Obligations that are repayable prior to maturity at the option of Goldman Sachs are reflected at their contractual maturity dates. Obligations that are redeemable prior to
maturity at the option of the holder are reflected at the dates such options become exercisable.
(3)	Includes $15.93 billion accounted for at fair value under SFAS No. 155 or SFAS No. 159 as of November 2007, primarily consisting of hybrid financial instruments.
(4)	These obligations are reported within “Other secured financings” in the consolidated statements of financial condition and include $18.53 billion accounted for at fair
value under SFAS No. 159 as of November 2007.
(5)	Primarily includes amounts related to the acquisition of Litton Loan Servicing LP (Litton) and construction-related obligations.
As of November 2007 and November 2006, we had construction-
related obligations of $769 million and $1.63 billion, respectively,
including outstanding commitments of $642 million and
$500 million as of November 2007 and November 2006,
respectively, related to our new world headquarters in New
York City, which is expected to cost between $2.3 billion and
$2.5 billion. We are partially financing this construction
project with tax-exempt Liberty Bonds. We borrowed
approximately $1.40 billion and approximately $250 million
in 2005 and 2007, respectively, through the issuance of
Liberty Bonds.
In addition, we entered into an agreement in 2007 to acquire
Litton, the mortgage servicing unit of Credit-Based Asset
Servicing and Securitization LLC (C-BASS). The transaction
closed in December 2007 at a purchase price of $428 million,
plus repayment of $916 million of outstanding Litton debt
obligations.
As of November 2007, our unsecured long-term borrowings
were $164.17 billion, with maturities extending to 2043, and
consisted principally of senior borrowings. See Note 5 to the
consolidated financial statements for further information
regarding our unsecured long-term borrowings.
As of November 2007, our future minimum rental payments,
net of minimum sublease rentals, under noncancelable leases
were $3.89 billion. These lease commitments, principally for
office space, expire on various dates through 2069. Certain
agreements are subject to periodic escalation provisions for
increases in real estate taxes and other charges. See Note 6 to
the consolidated financial statements for further information
regarding our leases.
Our occupancy expenses include costs associated with office
space held in excess of our current requirements. This excess
space, the cost of which is charged to earnings as incurred, is
being held for potential growth or to replace currently occupied
space that we may exit in the future. We regularly evaluate our
current and future space capacity in relation to current and
projected staffing levels. In 2007, we incurred exit costs of
$128 million (included in “occupancy” and “depreciation and
amortization” expenses in the consolidated statements of
earnings). We may incur additional exit costs in 2008 and
thereafter to the extent we (i) reduce our space capacity or
(ii) commit to, or occupy, new properties in the locations in
which we operate and, consequently, dispose of existing space
that had been held for potential growth. These exit costs may
be material to our results of operations in a given period.
66 Goldman Sachs 2007 Annual Report
Management’s Discussion and Analysis
of Group Inc. The commitments extended by Commitment
Corp. are supported, in part, by funding raised by William
Street Funding Corporation (Funding Corp.), another consolidated
wholly owned subsidiary of Group Inc. whose assets and
liabilities are also legally separated from other assets and
liabilities of Goldman Sachs. With respect to most of the
William Street commitments, SMFG provides us with credit
loss protection that is generally limited to 95% of the first loss
we realize on approved loan commitments, up to a maximum
of $1.00 billion. In addition, subject to the satisfaction of certain
conditions, upon our request, SMFG will provide protection for
70% of the second loss on such commitments, up to a maximum
of $1.13 billion. We also use other financial instruments to
mitigate credit risks related to certain William Street commitments
not covered by SMFG.
Our commitments to extend credit also include financing for
the warehousing of financial assets to be securitized. These
financings are expected to be repaid from the proceeds of
the related securitizations for which we may or may not act
as underwriter. These arrangements are secured by the
warehoused assets, primarily consisting of corporate bank
loans and commercial mortgages as of November 2007 and
residential mortgages and mortgage-backed securities, corporate
bank loans and commercial mortgages as of November 2006.
See Note 6 to the consolidated financial statements for further
information regarding our commitments, contingencies and
guarantees.
The following table sets forth our commitments as of November 2007:
Commitments
	 Commitment Amount by Fiscal Period of Expiration
(in millions) 		 2008	 2009 – 2010	 2011– 2012	 2013 – Thereafter	 Total
Commitments to extend credit
  Commercial lending:
   Investment-grade		 $  4,456	 $  3,108	 $  3,248	 $   907	 $  11,719
   Non-investment-grade		 2,956	 2,969	 6,845	 29,160	 41,930
  William Street program		 2,571	 4,046	 16,929	 942	 24,488
  Warehouse financing		 3,386	 1,224	—	—	 4,610
Total commitments to extend credit		 13,369	 11,347	 27,022	 31,009	 82,747
Forward starting resale and securities
  borrowing agreements		 24,269	 3,867	—	—	 28,136
Forward starting repurchase and securities
  lending agreements		 15,392	—	—	—	 15,392
Commitments under letters of credit
  issued by banks to counterparties		 8,281	 271	 183	 12	 8,747
Investment commitments		 6,180	7,827	 1,594	 2,157	 17,758
Underwriting commitments		 88	—	—	—	 88
Total		 $67,579	 $23,312	 $28,799	 $33,178	 $152,868
Our commitments to extend credit are agreements to lend
to counterparties that have fixed termination dates and are
contingent on the satisfaction of all conditions to borrowing
set forth in the contract. In connection with our lending
activities, we had outstanding commitments to extend credit
of $82.75 billion as of November 2007 compared with
$100.48 billion as of November 2006. Since these commitments
may expire unused or be reduced or cancelled at the counter-
party’s request, the total commitment amount does not necessarily
reflect the actual future cash flow requirements. Our commercial
lending commitments are generally extended in connection
with contingent acquisition financing and other types of corporate
lending as well as commercial real estate financing. We
may seek to reduce our credit risk on these commitments by
syndicating all or substantial portions of commitments to other
investors. In addition, commitments that are extended for
contingent acquisition financing are often intended to be short-
term in nature, as borrowers often seek to replace them with
other funding sources.
Substantially all of the commitments provided under the
William Street credit extension program are to investment-
grade corporate borrowers. Commitments under the program
are extended by William Street Commitment Corporation
(Commitment Corp.), a consolidated wholly owned subsidiary
of Group Inc. whose assets and liabilities are legally separated
from other assets and liabilities of Goldman Sachs, William
Street Credit Corporation, GS Bank USA, Goldman Sachs Credit
Partners L.P. or other consolidated wholly owned subsidiaries
67Goldman Sachs 2007 Annual Report
Management’s Discussion and Analysis
Market risk limits are monitored by the Finance Division and
are reviewed regularly by the appropriate risk committee. Limit
violations are reported to the appropriate risk committee and
business unit managers and addressed, as necessary. Credit risk
limits are also monitored by the Finance Division and reviewed
by the appropriate risk committee.
Business Practices Committee.  The Business Practices
Committee assists senior management in its oversight of
compliance and operational risks and related reputational
concerns, seeks to ensure the consistency of our policies,
practices and procedures with our Business Principles, and
makes recommendations on ways to mitigate potential risks.
Firmwide Capital Committee.  The Firmwide Capital
Committee reviews and approves transactions involving
commitments of our capital. Such capital commitments
include, but are not limited to, extensions of credit, alternative
liquidity commitments, certain bond underwritings and certain
distressed debt and principal finance activities. The Firmwide
Capital Committee is also responsible for establishing business
and reputational standards for capital commitments and
seeking to ensure that they are maintained on a global basis.
Commitments Committee. The Commitments Committee
reviews and approves underwriting and distribution activities,
primarily with respect to offerings of equity and equity-related
securities, and sets and maintains policies and procedures
designed to ensure that legal, reputational, regulatory and
business standards are maintained in conjunction with these
activities. In addition to reviewing specific transactions, the
Commitments Committee periodically conducts strategic
reviews of industry sectors and products and establishes
policies in connection with transaction practices.
Credit Policy Committee. The Credit Policy Committee
establishes and reviews broad credit policies and parameters
that are implemented by the Credit Department.
Finance Committee. The Finance Committee establishes and
oversees our liquidity policies, sets certain inventory position
limits and has oversight responsibility for liquidity risk, the size
and composition of our balance sheet and capital base, and our
credit ratings. The Finance Committee regularly reviews our
funding position and capitalization and makes adjustments in
light of current events, risks and exposures.
New Products Committee. The New Products Committee,
under the oversight of the Firmwide Risk Committee, is
responsible for reviewing and approving new products and
businesses globally.
Operational Risk Committee.  The Operational Risk
Committee provides oversight of the ongoing development and
implementation of our operational risk policies, framework
and methodologies, and monitors the effectiveness of operational
risk management.
Risk Management
Management believes that effective risk management is of primary
importance to the success of Goldman Sachs. Accordingly, we
have a comprehensive risk management process to monitor,
evaluate and manage the principal risks we assume in conducting
our activities. These risks include market, credit, liquidity,
operational, legal and reputational exposures.
Risk Management Structure
We seek to monitor and control our risk exposure through
a variety of separate but complementary financial, credit,
operational, compliance and legal reporting systems. In addition,
a number of committees are responsible for monitoring risk
exposures and for general oversight of our risk management
process, as described further below. These committees (including
their subcommittees), meet regularly and consist of senior
members of both our revenue-producing units and departments
that are independent of our revenue-producing units.
Segregation of duties and management oversight are fundamental
elements of our risk management process. In addition to the
committees described below, functions that are independent of
the revenue-producing units, such as Compliance, Finance,
Legal, Management Controls (Internal Audit) and Operations,
perform risk management functions, which include monitoring,
analyzing and evaluating risk.
Management Committee. All risk control functions ultimately
report to our Management Committee. Through both direct
and delegated authority, the Management Committee approves
all of our operating activities and trading risk parameters.
Risk Committees. The Firmwide Risk Committee reviews the
activities of existing trading businesses, approves new businesses
and products, approves firmwide market risk limits, reviews
business unit market risk limits, approves market risk limits
for selected sovereign markets and business units, approves
sovereign credit risk limits and credit risk limits by ratings
group, and reviews scenario analyses based on abnormal or
“catastrophic” market movements.
The Divisional Risk Committee sets market risk limits for our
trading activities subject to overall firmwide risk limits, based on
a number of measures, including VaR, stress tests and scenario
analyses. Several other committees oversee various risk, valuation,
operational, credit and business practice issues related to our
asset management business.
Business unit risk limits are established by the various risk
committees and may be further allocated by the business unit
managers to individual trading desks. Trading desk managers
have the first line of responsibility for managing risk within
prescribed limits. These managers have in-depth knowledge of
the primary sources of risk in their respective markets and the
instruments available to hedge their exposures.
68 Goldman Sachs 2007 Annual Report
Management’s Discussion and Analysis
■	 scenario analyses, stress tests and other analytical tools
that measure the potential effects on our trading net
revenues of various market events, including, but not limited
to, a large widening of credit spreads, a substantial decline
in equity markets and significant moves in selected emerging
markets; and
■	 inventory position limits for selected business units.
VaR
VaR is the potential loss in value of trading positions due to
adverse market movements over a defined time horizon with a
specified confidence level.
For the VaR numbers reported below, a one-day time horizon
and a 95% confidence level were used. This means that there is
a 1 in 20 chance that daily trading net revenues will fall below
the expected daily trading net revenues by an amount at least
as large as the reported VaR. Thus, shortfalls from expected
trading net revenues on a single trading day greater than the
reported VaR would be anticipated to occur, on average, about
once a month. Shortfalls on a single day can exceed reported
VaR by significant amounts. Shortfalls can also accumulate
over a longer time horizon such as a number of consecutive
trading days.
The modeling of the risk characteristics of our trading positions
involves a number of assumptions and approximations. While
management believes that these assumptions and approximations
are reasonable, there is no standard methodology for estimating
VaR, and different assumptions and/or approximations could
produce materially different VaR estimates.
We use historical data to estimate our VaR and, to better reflect
current asset volatilities, we generally weight historical data to
give greater importance to more recent observations. Given its
reliance on historical data, VaR is most effective in estimating
risk exposures in markets in which there are no sudden
fundamental changes or shifts in market conditions. An inherent
limitation of VaR is that the distribution of past changes in
market risk factors may not produce accurate predictions of
future market risk. Different VaR methodologies and distributional
assumptions could produce a materially different VaR. Moreover,
VaR calculated for a one-day time horizon does not fully capture
the market risk of positions that cannot be liquidated or offset
with hedges within one day.
Structured Products Committee. The Structured Products
Committee reviews and approves structured product transactions
entered into with our clients that raise legal, regulatory, tax or
accounting issues or present reputational risk to Goldman Sachs.
Market Risk
The potential for changes in the market value of our trading
and investing positions is referred to as market risk. Such
positions result from market-making, proprietary trading,
underwriting, specialist and investing activities. Substantially
all of our inventory positions are marked-to-market on a daily
basis and changes are recorded in net revenues.
Categories of market risk include exposures to interest rates,
equity prices, currency rates and commodity prices. A description
of each market risk category is set forth below:
■	 Interest rate risks primarily result from exposures to changes
in the level, slope and curvature of the yield curve, the
volatility of interest rates, mortgage prepayment speeds and
credit spreads.
■	 Equity price risks result from exposures to changes in prices
and volatilities of individual equities, equity baskets and
equity indices.
■	 Currency rate risks result from exposures to changes in spot
prices, forward prices and volatilities of currency rates.
■	 Commodity price risks result from exposures to changes in
spot prices, forward prices and volatilities of commodities,
such as electricity, natural gas, crude oil, petroleum products,
and precious and base metals.
We seek to manage these risks by diversifying exposures,
controlling position sizes and establishing economic hedges in
related securities or derivatives. For example, we may hedge a
portfolio of common stocks by taking an offsetting position in
a related equity-index futures contract. The ability to manage
an exposure may, however, be limited by adverse changes in
the liquidity of the security or the related hedge instrument and
in the correlation of price movements between the security and
related hedge instrument.
In addition to applying business judgment, senior management
uses a number of quantitative tools to manage our exposure to
market risk for “Financial instruments owned, at fair value”
and “Financial instruments sold, but not yet purchased, at fair
value” in the consolidated statements of financial condition.
These tools include:
■	 risk limits based on a summary measure of market risk
exposure referred to as VaR;
69Goldman Sachs 2007 Annual Report
Management’s Discussion and Analysis
The following tables set forth the daily VaR:
Average Daily VaR (1)
(in millions)
	 Year Ended November
Risk Categories				 2007	 2006	 2005
Interest rates				 $  85	 $  49	 $ 37
Equity prices				 100	 72	 34
Currency rates				 23	 21	 17
Commodity prices				 26	 30	 26
Diversification effect (2)
				 (96)	 (71)	 (44)
Total				 $138	 $101	 $ 70
(1)	Certain portfolios and individual positions are not included in VaR, where VaR is not the most appropriate measure of risk (e.g., due to transfer restrictions and/or illiquidity).
See “— Other Market Risk Measures” below.
(2)	Equals the difference between total VaR and the sum of the VaRs for the four risk categories. This effect arises because the four market risk categories are not
perfectly correlated.
Our average daily VaR increased to $138 million in 2007 from $101 million in 2006. The increase was primarily due to higher
levels of exposure and volatility in interest rates and equity prices.
Our average daily VaR increased to $101 million in 2006 from $70 million in 2005. We increased our level of exposure across
all risk categories, particularly equity prices and interest rates.
Daily VaR
(in millions)
	 As of November	 	 Year Ended November 2007
Risk Categories			 2007	 2006	 High	 Low
Interest rates			 $ 105	 $  51	 $152	 $  42
Equity prices			 82	 84	 167	 59
Currency rates			 35	 15	 41	 12
Commodity prices			 33	 21	 51	 17
Diversification effect (1)
			 (121)	 (52)		
Total			 $ 134	 $119	 $181	 $104
(1)	Equals the difference between total VaR and the sum of the VaRs for the four risk categories. This effect arises because the four market risk categories are not
perfectly correlated.
70 Goldman Sachs 2007 Annual Report
Management’s Discussion and Analysis
Our daily VaR increased to $134 million as of November 2007 from $119 million as of November 2006. The increase primarily
reflected higher levels of exposure to interest rates, currency rates and commodity prices, as well as increased levels of volatility
in interest rates, partially offset by the benefit of increased diversification effects among different risk categories.
The following chart presents our daily VaR during 2007:
Daily VaR
($ in millions)
0
First Quarter
2007
Second Quarter
2007
Third Quarter
2007
Fourth Quarter
2007
20
40
60
80
100
120
140
160
180
200
DailyTradingVaR
Trading Net Revenues Distribution
The following chart sets forth the frequency distribution of our daily trading net revenues for substantially all inventory positions
included in VaR for the year ended November 2007:
Daily Trading Net Revenues
($ in millions)
0
(100)
15
(100)–(75)
4
(75)–(50)
5
(50)–(25)
12
(25)–0
16
0–25
25
25–50
30
50–75
36
75–100
33
100
10
20
30
40
50
60
70
80
90
100
NumberofDays
88
Daily Trading Net Revenues
As part of our overall risk control process, daily trading net revenues are compared with VaR calculated as of the end of the
prior business day. Trading losses incurred on a single day exceeded our 95% one-day VaR on ten occasions during 2007.
71Goldman Sachs 2007 Annual Report
Management’s Discussion and Analysis
instruments, completed or pending third-party transactions in
the underlying investment or comparable entities, subsequent
rounds of financing, recapitalizations and other transactions
across the capital structure, offerings in the equity or debt capital
markets, and changes in financial ratios or cash flows.
The sensitivity analysis of our investment in the ordinary shares
of ICBC excludes interests held by investment funds managed
by Goldman Sachs.
The sensitivity analysis of our investment in the convertible
preferred stock of SMFG, net of the economic hedge on a
substantial portion of the common stock underlying our
investment, is measured by the impact of a decline in the SMFG
common stock price. This sensitivity should not be extrapolated
to a significant decline in the SMFG common stock price, as
the relationship between the fair value of our investment and
the SMFG common stock price would be nonlinear due to
downside protection on the conversion stock price.
In addition, as of November 2007 and November 2006, in
our bank and insurance subsidiaries we held approximately
$10.58 billion and $9.95 billion of securities, respectively,
primarily consisting of mortgage-backed, federal agency and
investment-grade corporate bonds.
The following table sets forth market risk for positions not included in VaR. These measures do not reflect diversification benefits
across asset categories and, given the differing likelihood of the potential declines in asset categories, these measures have not
been aggregated:
(in millions)	 10% Sensitivity
	 Amount as of November
Asset Categories	 10% Sensitivity Measure	 2007	 2006
Trading Risk (1)
  Equity	 Underlying asset value	 $1,325	 $377
  Debt	 Underlying asset value	 1,020	 725
Non-trading Risk
  ICBC	 ICBC ordinary share price	 250	 191
  SMFG	 SMFG common stock price	 41	 140
  Other Equity 	 Underlying asset value	 1,013	 390
  Debt 	 Underlying asset value 	 500	 199
  Real Estate (2)
	 Underlying asset value	 1,108	 341
(1)	In addition to the positions in these portfolios, which are accounted for at fair value, we make investments accounted for under the equity method and we also make
direct investments in real estate, both of which are included in “Other assets” in the consolidated statements of financial condition. Direct investments in real estate
are accounted for at cost less accumulated depreciation. See Note 10 to the consolidated financial statements for information on “Other assets.”
(2)	Relates to interests in our real estate investment funds.
Other Market Risk Measures
Certain portfolios and individual positions are not included in
VaR, where VaR is not the most appropriate measure of risk
(e.g., due to transfer restrictions and/or illiquidity). The market
risk related to our investments in the ordinary shares of ICBC
and the convertible preferred stock of SMFG is measured by
estimating the potential reduction in net revenues associated
with a 10% decline in the ICBC ordinary share price and a
10% decline in the SMFG common stock price, respectively.
The market risk related to the remaining positions is measured
by estimating the potential reduction in net revenues associated
with a 10% decline in asset values.
The sensitivity analyses for equity and debt positions in
our trading portfolio and equity, debt (primarily mezzanine
instruments) and real estate positions in our non-trading
portfolio are measured by the impact of a decline in the asset
values (including the impact of leverage in the underlying
investments for real estate positions in our non-trading portfolio)
of such positions. The fair value of the underlying positions
may be impacted by factors such as transactions in similar
The increase in our 10% sensitivity measures during 2007 in
our trading and non-trading portfolios (excluding ICBC and
SMFG) was primarily due to new investments.
72 Goldman Sachs 2007 Annual Report
Management’s Discussion and Analysis
(3% of total assets) and $23.64 billion (3% of total assets),
respectively, of other sovereign obligations, principally consisting
of securities issued by the governments of Japan and the
United Kingdom. In addition, as of November 2007 and
November 2006, $144.92 billion and $104.76 billion of our
financial instruments purchased under agreements to resell
and securities borrowed, respectively, were collateralized by
U.S. government and federal agency obligations. As of
November 2007 and 2006, $41.26 billion and $38.22 billion
of our financial instruments purchased under agreements to
resell and securities borrowed, respectively, were collateralized
by other sovereign obligations. As of November 2007 and
November 2006, we did not have credit exposure to any other
counterparty that exceeded 2% of our total assets. However,
over the past several years, the amount and duration of our
credit exposures have been increasing, due to, among other
factors, the growth of our lending and OTC derivative activities
and market evolution toward longer dated transactions. A further
discussion of our derivative activities follows below.
Derivatives
Derivative contracts are instruments, such as futures, forwards,
swaps or option contracts, that derive their value from
underlying assets, indices, reference rates or a combination of
these factors. Derivative instruments may be privately negotiated
contracts, which are often referred to as OTC derivatives, or
they may be listed and traded on an exchange.
Substantially all of our derivative transactions are entered into
to facilitate client transactions, to take proprietary positions
or as a means of risk management. In addition to derivative
transactions entered into for trading purposes, we enter into
derivative contracts to manage currency exposure on our net
investment in non-U.S. operations and to manage the interest
rate and currency exposure on our long-term borrowings and
certain short-term borrowings.
Derivatives are used in many of our businesses, and we believe
that the associated market risk can only be understood relative
to all of the underlying assets or risks being hedged, or as
part of a broader trading strategy. Accordingly, the market
risk of derivative positions is managed together with our
nonderivative positions.
The fair value of our derivative contracts is reflected net of cash
paid or received pursuant to credit support agreements and is
reported on a net-by-counterparty basis in our consolidated
statements of financial condition when management believes a
legal right of setoff exists under an enforceable netting agreement.
For an OTC derivative, our credit exposure is directly with our
counterparty and continues until the maturity or termination
of such contract.
Credit Risk
Credit risk represents the loss that we would incur if a counter-
party or an issuer of securities or other instruments we hold
fails to perform under its contractual obligations to us, or upon
a deterioration in the credit quality of third parties whose
securities or other instruments, including OTC derivatives, we
hold. Our exposure to credit risk principally arises through our
trading, investing and financing activities. To reduce our credit
exposures, we seek to enter into netting agreements with
counterparties that permit us to offset receivables and payables
with such counterparties. In addition, we attempt to further
reduce credit risk with certain counterparties by (i) entering
into agreements that enable us to obtain collateral from a
counterparty on an upfront or contingent basis, (ii) seeking
third-party guarantees of the counterparty’s obligations, and/or
(iii) transferring our credit risk to third parties using credit
derivatives and/or other structures and techniques.
To measure and manage our credit exposures, we use a variety
of tools, including credit limits referenced to both current
exposure and potential exposure. Potential exposure is generally
based on projected worst-case market movements over the
life of a transaction. In addition, as part of our market risk
management process, for positions measured by changes in
credit spreads, we use VaR and other sensitivity measures. To
supplement our primary credit exposure measures, we also use
scenario analyses, such as credit spread widening scenarios,
stress tests and other quantitative tools.
Our global credit management systems monitor credit exposure
to individual counterparties and on an aggregate basis to
counterparties and their affiliates. These systems also provide
management, including the Firmwide Risk and Credit Policy
Committees, with information regarding credit risk by product,
industry sector, country and region.
While our activities expose us to many different industries
and counterparties, we routinely execute a high volume of
transactions with counterparties in the financial services industry,
including brokers and dealers, commercial banks, investment
funds and other institutional clients, resulting in significant
credit concentration with respect to this industry. In the ordinary
course of business, we may also be subject to a concentration
of credit risk to a particular counterparty, borrower or issuer.
As of November 2007 and November 2006, we held
$45.75 billion (4% of total assets) and $46.20 billion (6% of
total assets), respectively, of U.S. government and federal
agency obligations (including securities guaranteed by the
Federal National Mortgage Association and the Federal
Home Loan Mortgage Corporation) included in “Financial
instruments owned, at fair value” and “Cash and securities
segregated for regulatory and other purposes” in the
consolidated statements of financial condition. As of
November 2007 and November 2006, we held $31.65 billion
73Goldman Sachs 2007 Annual Report
Management’s Discussion and Analysis
The following tables set forth the fair values of our OTC derivative assets and liabilities by product and by remaining
contractual maturity:
OTC Derivatives
(in millions)
	 As of November 2007
	 0 – 6	 6 – 12	 1 – 5	 5 – 10	 10 Years	
Assets	 Months	 Months	 Years	 Years	 or Greater	 Total
Contract Type							
Interest rates (1)
	 $  5,970 	 $4,301	 $10,417 	 $ 7,402	 $20,614	 $48,704
Currencies	 10,614	 2,342	 3,623	 901	 405	 17,885
Commodities	 3,335	 1,538	 8,464	 1,299	 657	 15,293
Equities	 4,616	 1,329	 1,560	 2,114	 572	 10,191
Total	 $24,535	 $9,510	 $24,064	 $11,716	 $22,248	 $92,073
	 0 – 6	 6 – 12	 1 – 5	 5 – 10	 10 Years	
Liabilities	 Months	 Months	 Years	 Years	 or Greater	 Total
Contract Type
Interest rates (1)
	 $  6,980	 $1,212	 $11,675	 $  6,614	 $11,579	 $38,060
Currencies	 9,662	 1,977	 3,641	 680	 657	 16,617
Commodities	 3,912	 2,082	 5,827	 1,304	 338	 13,463
Equities	 7,526	 3,804	 3,823	 3,393	 412	 18,958
Total	 $28,080	 $9,075	 $24,966	 $11,991	 $12,986	 $87,098
	 As of November 2006
	 0 – 6	 6 – 12	 1 – 5	 5 – 10	 10 Years	
Assets	 Months	 Months	 Years	 Years	 or Greater	 Total
Contract Type
Interest rates (1)
	 $  2,432	 $1,706	 $  5,617 	 $  5,217	 $6,201	 $21,173
Currencies	 5,578	 943	 3,103	 1,669	 966	 12,259
Commodities	 3,892	 1,215	 5,836	 1,258	 231	 12,432
Equities	 1,430	 1,134	 1,329	 2,144	 1,235	 7,272
Total	 $13,332	 $4,998	 $15,885	 $10,288	 $8,633	 $53,136
	 0 – 6	 6 – 12	 1 – 5	 5 – 10	 10 Years	
Liabilities	 Months	 Months	 Years	 Years	 or Greater	 Total
Contract Type
Interest rates (1)
	 $  2,807	 $1,242 	 $  6,064 	 $  3,582	 $5,138	 $18,833
Currencies	 6,859	 1,290	 2,582	 494	 634	 11,859
Commodities	 3,078	 658	 4,253	 1,643	 273	 9,905
Equities	 3,235	 1,682	 2,615	 3,239	 277	 11,048
Total	 $15,979 	 $4,872	 $15,514	 $  8,958	 $6,322	 $51,645
(1)	Includes credit derivatives.
74 Goldman Sachs 2007 Annual Report
Management’s Discussion and Analysis
instrument, the remaining contractual maturity is generally
classified based upon the maturity date of the underlying
derivative instrument. In those instances where the underlying
instrument does not have a maturity date or either counter-
party has the right to settle in cash, the remaining contractual
maturity is generally based upon the option expiration date.
We enter into certain OTC option transactions that provide
us or our counterparties with the right to extend the maturity
of the underlying contract. The fair value of these option
contracts is not material to the aggregate fair value of our OTC
derivative portfolio. In the tables above, for option contracts
that require settlement by delivery of an underlying derivative
The following table sets forth the distribution, by credit rating, of substantially all of our exposure with respect to OTC derivatives
as of November 2007, after taking into consideration the effect of netting agreements. The categories shown reflect our internally
determined public rating agency equivalents:
OTC Derivative Credit Exposure
($ in millions)
	 As of November
	 2007	 	 2006
				 Exposure	 Percentage of	 Percentage of
			 Collateral	 Net of	 Total Exposure	 Total Exposure
Credit Rating Equivalent		 Exposure (1)
	 Held	 Collateral	 Net of Collateral	 Net of Collateral
AAA/Aaa		 $16,683	 $  2,087	 $14,596	 21%	 12%
AA/Aa2		 28,562	 4,143	 24,419	 35	 29
A/A2		 20,742	 4,553	 16,189	 23	 29
BBB/Baa2		 9,896	 3,338	 6,558	9	 15
BB/Ba2 or lower		 13,696	 6,218	7,478	 10	 13
Unrated		 2,494	 1,325	 1,169	2	 2
Total		 $92,073	 $21,664	 $70,409	 100%	 100%
(1)	Net of cash received pursuant to credit support agreements of $59.05 billion.
The following tables set forth our OTC derivative credit exposure, net of collateral, by remaining contractual maturity:
Exposure Net of Collateral
(in millions)
	 As of November 2007
	 0 – 6	 6 – 12	 1 – 5	 5 – 10	 10 Years	
Credit Rating Equivalent	 Months	 Months	 Years	 Years	 or Greater	 Total (1)
AAA/Aaa	 $  3,669	 $1,132	 $  2,453	 $1,904	 $  5,438	 $14,596
AA/Aa2	 5,569	 3,024	 4,815	 2,683	 8,328	 24,419
A/A2	 5,913	 1,242	 4,288	 1,544	 3,202	 16,189
BBB/Baa2	 2,087	 650	 2,236	 564	 1,021	 6,558
BB/Ba2 or lower	 2,159	 670	 2,626	 1,257	766	7,478
Unrated	 271	 321	 422	 90	 65	 1,169
Total	 $19,668	 $7,039	 $16,840	 $8,042	 $18,820	 $70,409
	 0 – 6	 6 – 12	 1 – 5	 5 – 10	 10 Years	
Contract Type	 Months	 Months	 Years	 Years	 or Greater	 Total (1)
Interest rates (2)
	 $  5,454	 $3,291	 $ 7,255	 $5,788	 $17,341	 $39,129
Currencies	 8,266	 1,735	 3,037	 560	 381	 13,979
Commodities	 2,757	 1,352	 5,619	778	 586	 11,092
Equities	 3,191	 661	 929	 916	 512	 6,209
Total	 $19,668	 $7,039	 $16,840	 $8,042	 $18,820	 $70,409
(1)	Where we have obtained collateral from a counterparty under a master trading agreement that covers multiple products and transactions, we have allocated the collateral
ratably based on exposure before giving effect to such collateral.
(2)	Includes credit derivatives.
75Goldman Sachs 2007 Annual Report
Management’s Discussion and Analysis
Excess Liquidity
Our most important liquidity policy is to pre-fund what we
estimate will be our likely cash needs during a liquidity crisis
and hold such excess liquidity in the form of unencumbered,
highly liquid securities that may be sold or pledged to provide
same-day liquidity. This “Global Core Excess” liquidity is
intended to allow us to meet immediate obligations without
needing to sell other assets or depend on additional funding
from credit-sensitive markets. We believe that this pool of
excess liquidity provides us with a resilient source of funds and
gives us significant flexibility in managing through a difficult
funding environment. Our Global Core Excess reflects the
following principles:
■	 The first days or weeks of a liquidity crisis are the most
critical to a company’s survival.
■	 Focus must be maintained on all potential cash and collateral
outflows, not just disruptions to financing flows. Goldman
Sachs’ businesses are diverse, and its cash needs are driven by
many factors, including market movements, collateral
requirements and client commitments, all of which can
change dramatically in a difficult funding environment.
■	 During a liquidity crisis, credit-sensitive funding, including
unsecured debt and some types of secured financing
agreements, may be unavailable and the terms or availability
of other types of secured financing may change.
■	 As a result of our policy to pre-fund liquidity that we estimate
may be needed in a crisis, we hold more unencumbered
securities and have larger unsecured debt balances than our
businesses would otherwise require. We believe that our
liquidity is stronger with greater balances of highly liquid
unencumbered securities, even though it increases our
unsecured liabilities.
The size of our Global Core Excess is based on an internal
liquidity model together with a qualitative assessment of the
condition of the financial markets and of Goldman Sachs. Our
liquidity model identifies and estimates cash and collateral
outflows over a short-term horizon in a liquidity crisis, including,
but not limited to:
■	 upcoming maturities of unsecured debt and letters of credit;
■	 potential buybacks of a portion of our outstanding negotiable
unsecured debt;
■	 adverse changes in the terms or availability of secured funding;
■	 derivatives and other margin and collateral outflows, including
those due to market moves;
Derivative transactions may also involve legal risks including
the risk that they are not authorized or appropriate for a counter-
party, that documentation has not been properly executed or
that executed agreements may not be enforceable against the
counterparty. We attempt to minimize these risks by obtaining
advice of counsel on the enforceability of agreements as well
as on the authority of a counterparty to effect the derivative
transaction. In addition, certain derivative transactions
(e.g., credit derivative contracts) involve the risk that we
may have difficulty obtaining, or be unable to obtain, the
underlying security or obligation in order to satisfy any physical
settlement requirement.
Liquidity and Funding Risk
Liquidity is of critical importance to companies in the financial
services sector. Most failures of financial institutions have
occurred in large part due to insufficient liquidity resulting
from adverse circumstances. Accordingly, Goldman Sachs has
in place a comprehensive set of liquidity and funding policies
that are intended to maintain significant flexibility to address
both Goldman Sachs-specific and broader industry or market
liquidity events. Our principal objective is to be able to fund
Goldman Sachs and to enable our core businesses to continue
to generate revenues, even under adverse circumstances.
Management has implemented a number of policies according
to the following liquidity risk management framework:
■	 Excess Liquidity. We maintain substantial excess liquidity
to meet a broad range of potential cash outflows in a stressed
environment including financing obligations.
■	 Asset-Liability Management. We seek to maintain funding
sources that are sufficiently long-term in order to withstand
a prolonged or severe liquidity-stressed environment without
having to rely on asset sales.
■	 Conservative Liability Structure. We access funding
across a diverse range of markets, products and counter-
parties, emphasize less credit-sensitive sources of funding and
conservatively manage the distribution of funding across our
entity structure.
■	 Crisis Planning. We base our liquidity and funding
management on stress-scenario planning and maintain a crisis
plan detailing our response to a liquidity-threatening event.
76 Goldman Sachs 2007 Annual Report
Management’s Discussion and Analysis
We maintain Global Core Excess and other unencumbered
assets in an amount that, if pledged or sold, would provide the
funds necessary to replace at least 110% of our unsecured
obligations that are scheduled to mature (or where holders
have the option to redeem) within the next 12 months. We
assume conservative loan values that are based on stress-
scenario borrowing capacity and we regularly review these
assumptions asset class by asset class. The estimated aggregate
loan value of our Global Core Excess and our other unencumbered
assets averaged $156.74 billion and $134.38 billion for the
fiscal years ended 2007 and 2006, respectively.
Asset-Liability Management
We seek to maintain a highly liquid balance sheet and substantially
all of our inventory is marked-to-market daily. We utilize aged
inventory limits for certain financial instruments as a disincentive
to our businesses to hold inventory over longer periods of time.
We believe that these limits provide a complementary mechanism
for ensuring appropriate balance sheet liquidity in addition to
our standard position limits. Although our balance sheet fluctuates
due to seasonal activity, market conventions and periodic market
opportunities in certain of our businesses, our total assets and
adjusted assets at financial statement dates are not materially
different from those occurring within our reporting periods.
We seek to manage the maturity profile of our funding base
such that we should be able to liquidate our assets prior to our
liabilities coming due, even in times of prolonged or severe
liquidity stress. We do not rely on immediate sales of assets
(other than our Global Core Excess) to maintain liquidity in a
distressed environment, although we recognize orderly asset sales
may be prudent and necessary in a persistent liquidity crisis.
In order to avoid reliance on asset sales, our goal is to ensure
that we have sufficient total capital (unsecured long-term
borrowings plus total shareholders’ equity) to fund our balance
sheet for at least one year. The amount of our total capital is
based on an internal liquidity model, which incorporates,
among other things, the following long-term financing
requirements:
■	 the portion of financial instruments owned that we believe
could not be funded on a secured basis in periods of market
stress, assuming conservative loan values;
■	 goodwill and identifiable intangible assets, property, leasehold
improvements and equipment, and other illiquid assets;
■	 derivative and other margin and collateral requirements;
■	 anticipated draws on our unfunded loan commitments; and
■	 capital or other forms of financing in our regulated subsidiaries
that is in excess of their long-term financing requirements. See
“— Conservative Liability Structure” below for a further
discussion of how we fund our subsidiaries.
■	 potential cash outflows associated with our prime brokerage
business;
■	 additional collateral that could be called in the event of a
two-notch downgrade in our credit ratings;
■	 draws on our unfunded commitments not supported by
William Street Funding Corporation (1)
; and
■	 upcoming cash outflows, such as tax and other large
payments.
The following table sets forth the average loan value (the
estimated amount of cash that would be advanced by counter-
parties against these securities) of our Global Core Excess:
	 Year Ended November
(in millions)	 2007	 2006
U.S. dollar-denominated	 $48,635	 $40,862
Non-U.S. dollar-denominated	 11,928	 10,202
Total Global Core Excess	 $60,563	 $51,064
The U.S. dollar-denominated excess is comprised of only
unencumbered U.S. government securities, U.S. agency securities
and highly liquid U.S. agency mortgage-backed securities, all of
which are Federal Reserve repo-eligible, as well as overnight cash
deposits. Our non-U.S. dollar-denominated excess is comprised
of only unencumbered French, German, United Kingdom and
Japanese government bonds and euro, British pound and
Japanese yen overnight cash deposits. We strictly limit our
Global Core Excess to this narrowly defined list of securities
and cash because we believe they are highly liquid, even in a
difficult funding environment. We do not believe other potential
sources of excess liquidity, such as lower-quality unencumbered
securities or committed credit facilities, are as reliable in a
liquidity crisis.
The majority of our Global Core Excess is structured such that
it is available to meet the liquidity requirements of our parent
company, Group Inc., and all of its subsidiaries. The remainder
is held in our principal non-U.S. operating entities, primarily
to better match the currency and timing requirements for those
entities’ potential liquidity obligations.
In addition to our Global Core Excess, we have a significant
amount of other unencumbered securities as a result of our
business activities. These assets, which are located in the United
States, Europe and Asia, include other government bonds,
high-grade money market securities, corporate bonds and
marginable equities. We do not include these securities in our
Global Core Excess.
(1)	The Global Core Excess excludes liquid assets of $6.17 billion held separately
by William Street Funding Corporation. See “— Contractual Obligations
and Commitments” above for a further discussion of the William Street credit
extension program.
77Goldman Sachs 2007 Annual Report
Management’s Discussion and Analysis
■	 We fund a substantial portion of our inventory on a secured
basis. We believe secured financing provides Goldman Sachs
with a more stable source of liquidity than unsecured
financing, as it is less sensitive to changes in our credit due
to the underlying collateral.
■	 Our liquidity depends to an important degree on the stability
of our short-term unsecured financing base. Accordingly, we
prefer the use of promissory notes (in which Goldman Sachs
does not make a market) over commercial paper, which we
may repurchase prior to maturity through the ordinary course
of business as a market maker. As of November 2007 and
November 2006, our unsecured short-term borrowings,
including the current portion of unsecured long-term
borrowings, were $71.56 billion and $47.90 billion,
respectively. See Note 4 to the consolidated financial
statements for further information regarding our unsecured
short-term borrowings.
■	 We recognize that secured funding transactions have greater
refinancing risk when the underlying collateral is more difficult
to fund. Consequently, we seek longer maturities for secured
funding transactions collateralized by these assets. In some
cases, we use extendible maturity features to obtain a rolling
minimum term to the funding.
■	 We issue substantially all of our unsecured debt without
provisions that would, based solely upon an adverse change
in our credit ratings, financial ratios, earnings, cash flows
or stock price, trigger a requirement for an early payment,
collateral support, change in terms, acceleration of maturity
or the creation of an additional financial obligation.
We seek to maintain broad and diversified funding sources
globally for both secured and unsecured funding. We make
extensive use of the repurchase agreement and securities lending
markets, as well as other secured funding markets. In addition,
we issue debt through syndicated U.S. registered offerings, U.S.
registered and 144A medium-term note programs, offshore
medium-term note offerings and other bond offerings, U.S. and
non-U.S. commercial paper and promissory note issuances, and
other methods. We also arrange for letters of credit to be issued
on our behalf.
We benefit from distributing our debt issuances through
our own sales force to a large, diverse global creditor base and
we believe that our relationships with our creditors are critical
to our liquidity. Our creditors include banks, governments,
securities lenders, pension funds, insurance companies and
mutual funds. We access funding in a variety of markets in the
Americas, Europe and Asia. We have imposed various internal
guidelines on investor concentration, including the amount of our
commercial paper that can be owned and letters of credit that
can be issued by any single investor or group of investors.
Certain financial instruments may be more difficult to fund
on a secured basis during times of market stress. Accordingly,
we generally hold higher levels of total capital for these assets
than more liquid types of financial instruments. The table
below sets forth our aggregate holdings in these categories of
financial instruments:
	 As of November
(in millions)	 2007	 2006
Mortgage and other asset-backed
  loans and securities (1)
	 $46,436	 $41,017
Bank loans (2)
	 49,154	 28,196
High-yield securities	 12,807	 9,403
Emerging market debt securities	 3,343	 2,291
Private equity and real estate
  fund investments (3)
	 16,244	 5,968
Emerging market equity securities	 8,014	 3,046
ICBC ordinary shares (4)
	 6,807	 5,194
SMFG convertible preferred stock	 4,060	 4,505
Other restricted public
  equity securities	 3,455	 1,730
Other investments in funds (5)
	 3,437	 260
(1)	Excludes $7.64 billion of mortgage whole loans that were transferred to
securitization vehicles where such transfers were accounted for as secured
financings rather than sales under SFAS No. 140. We distributed to investors the
securities that were issued by the securitization vehicles and therefore do not
bear economic exposure to the underlying mortgage whole loans.
(2)	Includes funded commitments and inventory held in connection with our origination
and secondary trading activities.
(3)	Includes interests in our merchant banking funds. Such amounts exclude assets
related to consolidated investment funds of $8.13 billion and $6.03 billion as of
November 2007 and November 2006, respectively, for which Goldman Sachs
does not bear economic exposure.
(4)	Includes interests of $4.30 billion and $3.28 billion as of November 2007 and
November 2006, respectively, held by investment funds managed by
Goldman Sachs.
(5)	Includes interests in other investment funds that we manage.
A large portion of these assets are funded through secured
funding markets or nonrecourse financing. We focus on
demonstrating a consistent ability to fund these assets on a
secured basis for extended periods of time to reduce refinancing
risk and to help ensure that they have an established amount
of loan value in order that they can be funded in periods of
market stress.
See Note 3 to the consolidated financial statements for further
information regarding the financial instruments we hold.
Conservative Liability Structure
We seek to structure our liabilities conservatively to reduce
refinancing risk and the risk that we may redeem or
repurchase certain of our borrowings prior to their contractual
maturity. Our conservative liability structure reflects the
following policies:
78 Goldman Sachs 2007 Annual Report
Management’s Discussion and Analysis
To mitigate refinancing risk, we have created internal guidelines on the principal amount of debt maturing on any one day or
during any week or year. The following table sets forth our quarterly unsecured long-term borrowings maturity profile through 2013:
Unsecured Long-Term Borrowings Maturity Profile
($ in millions)
0
1Q
2009
2Q
2009
3Q
2009
4Q
2009
1Q
2010
2Q
2010
3Q
2010
4Q
2010
1Q
2011
2Q
2011
3Q
2011
4Q
2011
1Q
2012
2Q
2012
3Q
2012
4Q
2012
1Q
2013
2Q
2013
3Q
2013
4Q
2013
1,000
2,000
3,000
4,000
6,000
5,000
7,000
8,000
9,000
10,000
11,000
Fiscal Quarters
The weighted average maturity of our unsecured long-term borrowings as of November 2007 was approximately seven years.
We swap a substantial portion of our long-term borrowings into U.S. dollar obligations with short-term floating interest rates in
order to minimize our exposure to interest rates and foreign exchange movements.
For a discussion of factors that could impair our ability to access the capital markets, see “— Certain Risk Factors That May
Affect Our Business” above as well as “Risk Factors” in Part I, Item 1A of the Annual Report on Form 10-K.
79Goldman Sachs 2007 Annual Report
Management’s Discussion and Analysis
Crisis Planning
In order to be prepared for a liquidity event, or a period of
market stress, we base our liquidity risk management framework
and our resulting funding and liquidity policies on conservative
stress-scenario assumptions. Our planning incorporates
several market-based and operational stress scenarios. We also
periodically conduct liquidity crisis drills to test our lines of
communication and backup funding procedures.
In addition, we maintain a liquidity crisis plan that specifies an
approach for analyzing and responding to a liquidity-threatening
event. The plan provides the framework to estimate the likely
impact of a liquidity event on Goldman Sachs based on some
of the risks identified above and outlines which and to what
extent liquidity maintenance activities should be implemented
based on the severity of the event. It also lists the crisis
management team and internal and external parties to be
contacted to ensure effective distribution of information.
Credit Ratings
We rely upon the short-term and long-term debt capital markets
to fund a significant portion of our day-to-day operations.
The cost and availability of debt financing is influenced by
our credit ratings. Credit ratings are important when we are
competing in certain markets and when we seek to engage
in longer term transactions, including OTC derivatives. We
believe our credit ratings are primarily based on the credit
rating agencies’ assessment of our liquidity, market, credit and
operational risk management practices, the level and variability
of our earnings, our capital base, our franchise, reputation and
management, our corporate governance and the external
operating environment. See “— Certain Risk Factors That
May Affect Our Business” above for a discussion of the risks
associated with a reduction in our credit ratings.
Subsidiary Funding Policies. Substantially all of our
unsecured funding is raised by our parent company, Group Inc.
The parent company then lends the necessary funds to its
subsidiaries, some of which are regulated, to meet their asset
financing and capital requirements. In addition, the parent
company provides its regulated subsidiaries with the necessary
capital to meet their regulatory requirements. The benefits
of this approach to subsidiary funding include enhanced control
and greater flexibility to meet the funding requirements of
our subsidiaries.
Our intercompany funding policies are predicated on an
assumption that, unless legally provided for, funds or securities
are not freely available from a subsidiary to its parent company
or other subsidiaries. In particular, many of our subsidiaries
are subject to laws that authorize regulatory bodies to block
or limit the flow of funds from those subsidiaries to Group Inc.
Regulatory action of that kind could impede access to funds
that Group Inc. needs to make payments on obligations,
including debt obligations. As such, we assume that capital or
other financing provided to our regulated subsidiaries is not
available to our parent company or other subsidiaries. In
addition, we assume that the Global Core Excess held in our
principal non-U.S. operating entities will not be available to
our parent company or other subsidiaries and therefore is
available only to meet the potential liquidity requirements of
those entities.
We also manage our liquidity risk by requiring senior and
subordinated intercompany loans to have maturities equal to
or shorter than the maturities of the aggregate borrowings of
the parent company. This policy ensures that the subsidiaries’
obligations to the parent company will generally mature in
advance of the parent company’s third-party borrowings. In
addition, many of our subsidiaries and affiliates maintain
unencumbered assets to cover their intercompany borrowings
(other than subordinated debt) in order to mitigate parent
company liquidity risk.
Group Inc. has provided substantial amounts of equity
and subordinated indebtedness, directly or indirectly, to its
regulated subsidiaries; for example, as of November 2007,
Group Inc. had $24.49 billion of such equity and subordinated
indebtedness invested in Goldman, Sachs  Co., its principal
U.S. registered broker-dealer; $27.51 billion invested in
Goldman Sachs International, a regulated U.K. broker-dealer;
$2.40 billion invested in Goldman Sachs Execution 
Clearing, L.P., a U.S. registered broker-dealer; and $3.15 billion
invested in Goldman Sachs Japan Co., Ltd., a regulated
Japanese broker-dealer. Group Inc. also had $44.99 billion of
unsubordinated loans to these entities as of November 2007,
as well as significant amounts of capital invested in and loans
to its other regulated subsidiaries.
80 Goldman Sachs 2007 Annual Report
Management’s Discussion and Analysis
Operational Risk
Operational risk relates to the risk of loss arising from short-
comings or failures in internal processes, people or systems, or
from external events. Operational risk can arise from many
factors ranging from routine processing errors to potentially
costly incidents related to, for example, major systems failures.
Operational risk may also cause reputational harm. Thus,
efforts to identify, manage and mitigate operational risk must
be equally sensitive to the risk of reputational damage as well
as the risk of financial loss.
We manage operational risk through the application of long-
standing, but continuously evolving, firmwide control standards
which are supported by the training, supervision and development
of our people; the active participation and commitment of
senior management in a continuous process of identifying and
mitigating key operational risks across Goldman Sachs; and a
framework of strong and independent control departments
that monitor operational risk on a daily basis. Together, these
elements form a strong firmwide control culture that serves as the
foundation of our efforts to minimize operational risk exposure.
The Operational Risk Department, an independent risk
management function, is responsible for developing and
implementing a standardized framework to identify, measure,
monitor, and report operational risks to support active risk
management across Goldman Sachs. This framework, which
evolves with the changing needs of our businesses and regulatory
guidance, incorporates analysis of internal and external
operational risk events, business environment and internal
control factors, and scenario analysis. The framework also
provides regular reporting of our operational risk exposures to
our Board, risk committees and senior management. For a
further discussion of operational risk see “— Risk Factors” in
Part I, Item 1A of the Annual Report on Form 10-K.
As of November 2007, collateral or termination payments
pursuant to bilateral agreements with certain counterparties of
approximately $728 million would have been required in the
event of a one-notch reduction in our long-term credit ratings.
In evaluating our liquidity requirements, we consider additional
collateral or termination payments that would be required in
the event of a two-notch downgrade in our long-term credit
ratings, as well as collateral that has not been called by counter-
parties, but is available to them.
Cash Flows
As a global financial institution, our cash flows are complex
and interrelated and bear little relation to our net earnings and
net assets and, consequently, we believe that traditional cash
flow analysis is less meaningful in evaluating our liquidity position
than the excess liquidity and asset-liability management policies
described above. Cash flow analysis may, however, be helpful
in highlighting certain macro trends and strategic initiatives in
our business.
Year Ended November 2007. Our cash and cash equivalents
increased by $5.59 billion to $11.88 billion at the end of 2007.
We raised $73.79 billion in net cash from financing and investing
activities, primarily through the issuance of unsecured borrowings,
partially offset by common stock repurchases. We used net
cash of $68.20 billion in our operating activities, primarily to
capitalize on trading and investing opportunities for our clients
and ourselves.
Year Ended November 2006. Our cash and cash equivalents
decreased by $3.97 billion to $6.29 billion at the end of 2006.
We raised $64.09 billion in net cash from financing activities,
primarily in long-term borrowings as well as through secured
financings, partially offset by common stock repurchases. We
used net cash of $68.06 billion in our operating and investing
activities, primarily to capitalize on trading and investing
opportunities for our clients and ourselves.
The following table sets forth our unsecured credit ratings as of November 2007:
	 Short-Term Debt	 Long-Term Debt	 Subordinated Debt	 Preferred Stock
Dominion Bond Rating Service Limited	 R-1 (middle)	 AA (low)	 A (high)	 A
Fitch, Inc.	 F1+	 AA-	 A+	 A+
Moody’s Investors Service	 P-1	 Aa3	 A1	 A2
Standard  Poor’s	 A-1+	 AA-	 A+	 A
Rating and Investment Information, Inc.	 a-1+	 AA	 Not Applicable	 Not Applicable
81Goldman Sachs 2007 Annual Report
Management’s Discussion and Analysis
We adopted SFAS No. 157 as of the beginning of 2007. The
transition adjustment to beginning retained earnings was a
gain of $51 million, net of tax. For the first quarter of 2007,
the effect of the nullification of EITF Issue No. 02-3 and the
removal of liquidity discounts for actively traded positions was
not material. In addition, under SFAS No. 157, gains on principal
investments are recorded in the absence of substantial third-
party transactions if market evidence is sufficient. In the first
quarter of 2007, we recorded approximately $500 million of
such gains as a result of adopting SFAS No. 157.
SFAS No. 158. In September 2006, the FASB issued SFAS
No. 158, “Employers’ Accounting for Defined Benefit Pension
and Other Postretirement Plans, an amendment of FASB
Statements No. 87, 88, 106 and 132-R.” SFAS No. 158 requires
an entity to recognize in its statement of financial condition the
funded status of its defined benefit pension and postretirement
plans, measured as the difference between the fair value of
the plan assets and the benefit obligation. SFAS No. 158 also
requires an entity to recognize changes in the funded status
of a defined benefit pension and postretirement plan within
accumulated other comprehensive income, net of tax, to the
extent such changes are not recognized in earnings as components
of periodic net benefit cost. SFAS No. 158 is effective as of the
end of the fiscal year ending after December 15, 2006. We
adopted SFAS No. 158 as of the end of 2007. The adjustment to
accumulated other comprehensive loss for the initial application
of SFAS No. 158 was $194 million, net of tax.
SFAS No. 159. In February 2007, the FASB issued SFAS
No. 159, “The Fair Value Option for Financial Assets and
Financial Liabilities,” which gives entities the option to measure
eligible financial assets, financial liabilities and firm commitments
at fair value (i.e., the fair value option), on an instrument-by-
instrument basis, that are otherwise not accounted for at fair
value under other accounting standards. The election to use the
fair value option is available at specified election dates, such as
when an entity first recognizes a financial asset or financial
liability or upon entering into a firm commitment. Subsequent
changes in fair value must be recorded in earnings. Additionally,
SFAS No. 159 allows for a one-time election for existing positions
upon adoption, with the transition adjustment recorded to
beginning retained earnings.
Recent Accounting Developments
FIN No. 48.  In June 2006, the FASB issued FIN No. 48,
“Accounting for Uncertainty in Income Taxes — an Interpretation
of FASB Statement No. 109.” FIN No. 48 requires that we
determine whether a tax position is more likely than not to
be sustained upon examination, including resolution of any
related appeals or litigation processes, based on the technical
merits of the position. Once it is determined that a position
meets this recognition threshold, the position is measured to
determine the amount of benefit to be recognized in the financial
statements. We will adopt the provisions of FIN No. 48 in the
first quarter of 2008. Adoption of FIN No. 48 will not have a
material effect on our financial condition, results of operations
or cash flows.
SFAS No. 157. In September 2006, the FASB issued SFAS
No. 157, “Fair Value Measurements.” SFAS No. 157 clarifies
that fair value is an exit price, representing the amount that
would be received to sell an asset or paid to transfer a liability
in an orderly transaction between market participants. Under
SFAS No. 157, fair value measurements are not adjusted for
transaction costs.
SFAS No. 157 nullifies the guidance included in Emerging
Issues Task Force (EITF) Issue No. 02-3, “Issues Involved in
Accounting for Derivative Contracts Held for Trading Purposes
and Contracts Involved in Energy Trading and Risk
Management Activities,” that prohibited the recognition of a
day one gain or loss on derivative contracts (and hybrid financial
instruments measured at fair value under SFAS No. 155) where
we were unable to verify all of the significant model inputs to
observable market data and/or verify the model to market
transactions. However, SFAS No. 157 requires that a fair value
measurement reflect the assumptions market participants
would use in pricing an asset or liability based on the best
information available. Assumptions include the risks inherent
in a particular valuation technique (such as a pricing model)
and/or the risks inherent in the inputs to the model.
In addition, SFAS No. 157 prohibits the recognition of “block
discounts” for large holdings of unrestricted financial instruments
where quoted prices are readily and regularly available for an
identical asset or liability in an active market.
The provisions of SFAS No. 157 are to be applied prospectively,
except changes in fair value measurements that result from the
initial application of SFAS No. 157 to existing derivative financial
instruments measured under EITF Issue No. 02-3, existing
hybrid financial instruments measured at fair value and block
discounts, all of which are to be recorded as an adjustment to
beginning retained earnings in the year of adoption.
82 Goldman Sachs 2007 Annual Report
Management’s Discussion and Analysis
SOP No. 07-1 and FSP FIN No. 46-R-7.  In June 2007, the
American Institute of Certified Public Accountants (AICPA)
issued Statement of Position (SOP) No. 07-1, “Clarification of
the Scope of the Audit and Accounting Guide ‘Audits of
Investment Companies’ and Accounting by Parent Companies
and Equity Method Investors for Investments in Investment
Companies.’’ SOP No. 07-1 clarifies when an entity may apply
the provisions of the Audit and Accounting Guide for
Investment Companies (the Guide). In May 2007, the FASB
issued FSP FIN No. 46-R-7, “Application of FIN 46-R to
Investment Companies,” which amends FIN No. 46-R to make
permanent the temporary deferral of the application of FIN
No. 46-R to entities within the scope of the revised Guide
under SOP No. 07-1. FSP FIN No. 46-R-7 is effective upon
adoption of SOP No. 07-1. In November 2007, the FASB
issued Proposed FSP SOP No. 07-1-a, “The Effective Date
of AICPA Statement of Position 07-1,” which proposes to
indefinitely defer the effective date for SOP No. 07-01 and,
consequently, FSP FIN No. 46-R-7.
EITF Issue No. 06-11. In June 2007, the EITF reached consensus
on Issue No. 06-11, “Accounting for Income Tax Benefits
of Dividends on Share-Based Payment Awards.” EITF Issue
No. 06-11 requires that the tax benefit related to dividend
equivalents paid on restricted stock units, which are expected
to vest, be recorded as an increase to additional paid-in capital.
We currently account for this tax benefit as a reduction to
income tax expense. EITF Issue No. 06-11 is to be applied
prospectively for tax benefits on dividends declared in fiscal
years beginning after December 15, 2007, and we expect to
adopt the provisions of EITF Issue No. 06-11 beginning in the
first quarter of 2009. We are currently evaluating the impact
of adopting EITF Issue No. 06-11 on our financial condition,
results of operations and cash flows.
We adopted SFAS No. 159 as of the beginning of 2007 and
elected to apply the fair value option to the following financial
assets and liabilities existing at the time of adoption:
■	 certain unsecured short-term borrowings, consisting of all
promissory notes and commercial paper;
■	 certain other secured financings, primarily transfers accounted
for as financings rather than sales under SFAS No. 140 and
debt raised through our William Street program;
■	 certain unsecured long-term borrowings, including prepaid
physical commodity transactions;
■	 resale and repurchase agreements;
■	 securities borrowed and loaned within Trading and Principal
Investments, consisting of our matched book and certain firm
financing activities;
■	 securities held by GS Bank USA, which were previously
accounted for as available-for-sale; and
■	 receivables from customers and counterparties arising from
transfers accounted for as secured loans rather than purchases
under SFAS No. 140.
The transition adjustment to beginning retained earnings related
to the adoption of SFAS No. 159 was a loss of $45 million, net
of tax, substantially all of which related to applying the fair
value option to prepaid physical commodity transactions.
Subsequent to the adoption of SFAS No. 159, we have elected
to apply the fair value option (i) to new positions within
the above categories, (ii) to corporate loans, corporate loan
commitments and certificates of deposit issued by GS Bank
USA and (iii) generally to investments where we would otherwise
apply the equity method of accounting. In certain cases, we
may continue to apply the equity method of accounting to
those investments which are strategic in nature or closely
related to our principal business activities, where we have a
significant degree of involvement in the cash flows or operations
of the investee, and/or where cost-benefit considerations are
less significant.
The primary reasons for electing the fair value option are
mitigating volatility in earnings from using different measurement
attributes, simplification and cost-benefit considerations.
83Goldman Sachs 2007 Annual Report
Management’s Report on Internal Control over Financial Reporting
Our internal control over financial reporting includes policies
and procedures that pertain to the maintenance of records that,
in reasonable detail, accurately and fairly reflect transactions
and dispositions of assets; provide reasonable assurances that
transactions are recorded as necessary to permit preparation of
financial statements in accordance with U.S. generally accepted
accounting principles, and that receipts and expenditures
are being made only in accordance with authorizations of
management and the directors of the firm; and provide
reasonable assurance regarding prevention or timely detection of
unauthorized acquisition, use or disposition of the firm’s assets
that could have a material effect on our financial statements.
The firm’s internal control over financial reporting as of
November30,2007hasbeenauditedbyPricewaterhouseCoopersLLP,
an independent registered public accounting firm, as stated
in their report appearing on page 85, which expresses an
unqualified opinion on the effectiveness of the firm’s internal
control over financial reporting as of November 30, 2007.
Management of The Goldman Sachs Group, Inc., together
with its consolidated subsidiaries (the firm), is responsible for
establishing and maintaining adequate internal control over
financial reporting. The firm’s internal control over financial
reporting is a process designed under the supervision of the
firm’s principal executive and principal financial officers to
provide reasonable assurance regarding the reliability of
financial reporting and the preparation of the firm’s financial
statements for external reporting purposes in accordance with
U.S. generally accepted accounting principles.
As of the end of the firm’s 2007 fiscal year, management
conducted an assessment of the effectiveness of the firm’s
internal control over financial reporting based on the framework
established in Internal Control — Integrated Framework issued
by the Committee of Sponsoring Organizations of the
Treadway Commission (COSO). Based on this assessment,
management has determined that the firm’s internal control over
financial reporting as of November 30, 2007 was effective.
84 Goldman Sachs 2007 Annual Report
Report of Independent Registered Public Accounting Firm
As discussed in Note 2 to the consolidated financial statements,
the Company has adopted SFAS No. 157, “Fair Value
Measurements” and SFAS No. 159, “The Fair Value Option
for Financial Assets and Financial Liabilities.”
A company’s internal control over financial reporting is a process
designed to provide reasonable assurance regarding the reliability
of financial reporting and the preparation of financial statements
for external purposes in accordance with generally accepted
accounting principles. A company’s internal control over financial
reporting includes those policies and procedures that (i) pertain
to the maintenance of records that, in reasonable detail,
accurately and fairly reflect the transactions and dispositions
of the assets of the company; (ii) provide reasonable assurance
that transactions are recorded as necessary to permit preparation
of financial statements in accordance with generally accepted
accounting principles, and that receipts and expenditures of the
company are being made only in accordance with authorizations
of management and directors of the company; and (iii) provide
reasonable assurance regarding prevention or timely detection
of unauthorized acquisition, use, or disposition of the
company’s assets that could have a material effect on the
financial statements.
Because of its inherent limitations, internal control over financial
reporting may not prevent or detect misstatements. Also,
projections of any evaluation of effectiveness to future periods
are subject to the risk that controls may become inadequate
because of changes in conditions, or that the degree of compliance
with the policies or procedures may deteriorate.
PricewaterhouseCoopers LLP
New York, New York
January 24, 2008
To the Board of Directors and the Shareholders
of The Goldman Sachs Group, Inc.:
In our opinion, the accompanying consolidated statements of
financial condition and the related consolidated statements
of earnings, changes in shareholders’ equity, cash flows and
comprehensive income present fairly, in all material respects,
the financial position of The Goldman Sachs Group, Inc. and
its subsidiaries (the Company) at November 30, 2007 and
November 24, 2006, and the results of its operations and its
cash flows for each of the three fiscal years in the period ended
November 30, 2007 in conformity with accounting principles
generally accepted in the United States of America. Also in
our opinion, the Company maintained, in all material respects,
effective internal control over financial reporting as of
November 30, 2007, based on criteria established in Internal
Control — Integrated Framework issued by the Committee of
Sponsoring Organizations of the Treadway Commission (COSO).
The Company’s management is responsible for these financial
statements, for maintaining effective internal control over
financial reporting and for its assessment of the effectiveness
of internal control over financial reporting, included in
Management’s Report on Internal Control over Financial
Reporting appearing on page 84. Our responsibility is to express
opinions on these financial statements and on the Company’s
internal control over financial reporting based on our integrated
audits. We conducted our audits in accordance with the standards
of the Public Company Accounting Oversight Board (United
States). Those standards require that we plan and perform the
audits to obtain reasonable assurance about whether the financial
statements are free of material misstatement and whether
effective internal control over financial reporting was maintained
in all material respects. Our audits of the financial statements
included examining, on a test basis, evidence supporting the
amounts and disclosures in the financial statements, assessing
the accounting principles used and significant estimates made
by management, and evaluating the overall financial statement
presentation. Our audit of internal control over financial
reporting included obtaining an understanding of internal
control over financial reporting, assessing the risk that a material
weakness exists, and testing and evaluating the design and
operating effectiveness of internal control based on the assessed
risk. Our audits also included performing such other procedures
as we considered necessary in the circumstances. We believe
that our audits provide a reasonable basis for our opinion.
85Goldman Sachs 2007 Annual Report
Consolidated Statements of Earnings
The accompanying notes are an integral part of these consolidated financial statements.
	 Year Ended November
(in millions, except per share amounts)				 2007	 2006	 2005
Revenues
Investment banking				 $ 7,555	 $  5,613	 $  3,599
Trading and principal investments				 29,714	 24,027	 15,452
Asset management and securities services				 4,731	 4,527	 3,090
Interest income				 45,968	 35,186	 21,250
  Total revenues				 87,968	 69,353	 43,391
Interest expense				 41,981	 31,688	 18,153
  Revenues, net of interest expense				 45,987	 37,665	 25,238
Operating expenses
Compensation and benefits				 20,190	 16,457	 11,758
Brokerage, clearing, exchange and distribution fees			 2,758	 1,985	 1,416
Market development				 601	 492	 378
Communications and technology				 665	 544	 490
Depreciation and amortization				 624	 521	 501
Amortization of identifiable intangible assets				 195	 173	 124
Occupancy				 975	 850	 728
Professional fees				 714	 545	 475
Cost of power generation				 335	 406	 386
Other expenses				 1,326	 1,132	 709
  Total non-compensation expenses				 8,193	 6,648	 5,207
  Total operating expenses				 28,383	 23,105	 16,965
Pre-tax earnings				 17,604	 14,560	 8,273
Provision for taxes				 6,005	 5,023	 2,647
Net earnings				 11,599	 9,537	 5,626
Preferred stock dividends				 192	 139	 17
Net earnings applicable to common shareholders			 $11,407	 $  9,398	 $  5,609
Earnings per common share
Basic				 $  26.34	 $  20.93	 $  11.73
Diluted				 24.73	 19.69	 11.21
Average common shares outstanding
Basic				 433.0	 449.0	 478.1
Diluted				 461.2	 477.4	 500.2
86 Goldman Sachs 2007 Annual Report
Consolidated Statements of Financial Condition
	 As of November
(in millions, except share and per share amounts)					 2007 	 2006
Assets
Cash and cash equivalents					 $   11,882	 $   6,293
Cash and securities segregated for regulatory and other purposes (includes $94,018
  and $20,723 at fair value as of November 2007 and November 2006, respectively)		 119,939	 80,990
Receivables from brokers, dealers and clearing organizations				 19,078	 13,223
Receivables from customers and counterparties
  (includes $1,950 at fair value as of November 2007)				 129,105	 79,790
Collateralized agreements:
  Securities borrowed (includes $83,277 at fair value as of November 2007)			 277,413	 219,342
  Financial instruments purchased under agreements to resell
   (includes $85,717 at fair value as of November 2007)				 85,717	 82,126
Financial instruments owned, at fair value					 406,457	 298,563
Financial instruments owned and pledged as collateral, at fair value			 46,138	 35,998
  Total financial instruments owned, at fair value				 452,595	 334,561
Other assets					 24,067	 21,876
  Total assets					 $1,119,796	 $838,201
Liabilities and shareholders’ equity
Unsecured short-term borrowings, including the current portion of unsecured
  long-term borrowings (includes $48,331 and $10,220 at fair value as of
  November 2007 and November 2006, respectively)				 $   71,557	 $  47,904
Bank deposits (includes $463 at fair value as of November 2007)			 15,370	 10,697
Payables to brokers, dealers and clearing organizations				 8,335	 6,293
Payables to customers and counterparties					 310,118	 206,884
Collateralized financings:
  Securities loaned (includes $5,449 at fair value as of November 2007)			 28,624	 22,208
  Financial instruments sold under agreements to repurchase
   (includes $159,178 at fair value as of November 2007)				 159,178	 147,492
  Other secured financings (includes $33,581 and $3,300 at fair value as of November 2007
   and November 2006, respectively)					 65,710	 50,424
Financial instruments sold, but not yet purchased, at fair value				 215,023	 155,805
Other liabilities and accrued expenses					 38,907	 31,866
Unsecured long-term borrowings (includes $15,928 and $7,250 at fair value as of
  November 2007 and November 2006, respectively)				 164,174	 122,842
  Total liabilities					 1,076,996	 802,415
Commitments, contingencies and guarantees
Shareholders’ equity
Preferred stock, par value $0.01 per share; 150,000,000 shares authorized,
  124,000 shares issued and outstanding as of both November 2007 and November 2006,
  with liquidation preference of $25,000 per share				 3,100	 3,100
Common stock, par value $0.01 per share; 4,000,000,000 shares authorized, 618,707,032 and
  599,697,200 shares issued as of November 2007 and November 2006, respectively, and 390,682,013
  and 412,666,084 shares outstanding as of November 2007 and November 2006, respectively		 6	 6
Restricted stock units and employee stock options				 9,302	 6,290
Nonvoting common stock, par value $0.01 per share; 200,000,000 shares authorized,
  no shares issued and outstanding					 —	 —
Additional paid-in capital					 22,027	 19,731
Retained earnings					 38,642	 27,868
Accumulated other comprehensive income/(loss)				 (118)	 21
Common stock held in treasury, at cost, par value $0.01 per share; 228,025,019 and
  187,031,116 shares as of November 2007 and November 2006, respectively			 (30,159)	 (21,230)
  Total shareholders’ equity					 42,800	 35,786
  Total liabilities and shareholders’ equity					 $1,119,796	 $838,201
The accompanying notes are an integral part of these consolidated financial statements.
87Goldman Sachs 2007 Annual Report
Consolidated Statements of Changes in Shareholders’ Equity
	 Year Ended November
(in millions, except per share amounts)				 2007	 2006	 2005
Preferred stock
  Balance, beginning of year				 $  3,100	 $  1,750	 $     —
  Issued				 —	 1,350	 1,750
  Balance, end of year				 3,100	 3,100	 1,750
Common stock, par value $0.01 per share
  Balance, beginning of year				 6	 6	 6
  Issued				 —	 —	 —
  Balance, end of year				 6	 6	 6
Restricted stock units and employee stock options
  Balance, beginning of year				 6,290	 3,415	 2,013
  Issuance and amortization of restricted stock units and employee stock options	 4,684	 3,787	 1,871
  Delivery of common stock underlying restricted stock units			 (1,548)	 (781)	 (423)
  Forfeiture of restricted stock units and employee stock options		 (113)	 (129)	 (37)
  Exercise of employee stock options				 (11)	 (2)	 (9)
  Balance, end of year				 9,302	 6,290	 3,415
Additional paid-in capital
  Balance, beginning of year				 19,731	 17,159	 15,501
  Issuance of common stock, including the delivery of common stock
   underlying restricted stock units and proceeds from the exercise
   of employee stock options				 2,338	 2,432	 1,580
  Cancellation of restricted stock units in satisfaction of withholding
   tax requirements				 (929)	 (375)	 (163)
  Stock purchase contract fee related to automatic preferred enhanced
   capital securities				 (20)	 —	 —
  Preferred stock issuance costs				 —	 (1)	 (31)
  Excess net tax benefit related to share-based compensation			 908	 653	 272
  Cash settlement of share-based compensation			 (1)	 (137)	 —
  Balance, end of year				 22,027	 19,731	 17,159
Retained earnings
  Balance, beginning of year, as previously reported			 27,868	 19,085	 13,970
  Cumulative effect of adjustment from adoption of SFAS No. 157, net of tax		 51	 —	 —
  Cumulative effect of adjustment from adoption of SFAS No. 159, net of tax		 (45)	 —	 —
  Balance, beginning of year, after cumulative effect of adjustments		 27,874	 19,085	 13,970
  Net earnings				 11,599	 9,537	 5,626
  Dividends and dividend equivalents declared on common stock
   and restricted stock units				 (639)	 (615)	 (494)
  Dividends declared on preferred stock				 (192)	 (139)	 (17)
  Balance, end of year				 38,642	 27,868	 19,085
Unearned compensation
  Balance, beginning of year				 —	 —	 (117)
  Amortization of restricted stock units				 —	 —	 117
  Balance, end of year				 —	 —	 —
Accumulated other comprehensive income/(loss)
  Balance, beginning of year				 21	 —	 11
  Adjustment from adoption of SFAS No. 158, net of tax			 (194)	 —	 —
  Currency translation adjustment, net of tax				 39	 45	 (27)
  Minimum pension liability adjustment, net of tax			 38	 (27)	 (11)
  Net gains/(losses) on cash flow hedges, net of tax			 (2)	 (7)	 9
  Net unrealized gains/(losses) on available-for-sale securities, net of tax		 (12)	 10	 18
  Reclassification to retained earnings from adoption of SFAS No. 159, net of tax	 (8)	 —	 —
  Balance, end of year				 (118)	 21	 —
Common stock held in treasury, at cost
  Balance, beginning of year				 (21,230)	 (13,413)	 (6,305)
  Repurchased				 (8,956)	 (7,817)	 (7,108)
  Reissued				 27	 —	 —
  Balance, end of year				 (30,159)	 (21,230)	 (13,413)
Total shareholders’ equity				 $ 42,800	 $ 35,786	 $ 28,002
The accompanying notes are an integral part of these consolidated financial statements.
88 Goldman Sachs 2007 Annual Report
Consolidated Statements of Cash Flows
	 Year Ended November
(in millions)				 2007	 2006	 2005
Cash flows from operating activities
  Net earnings				 $  11,599	 $  9,537	 $  5,626
  Non-cash items included in net earnings
   Depreciation and amortization				 916	 749	 689
   Amortization of identifiable intangible assets			 251	 246	 165
   Deferred income taxes				 129	 (1,505)	 (450)
   Share-based compensation				 4,465	 3,654	 1,756
  Changes in operating assets and liabilities
   Cash and securities segregated for regulatory and other purposes		 (39,079)	 (21,044)	 (3,226)
   Net receivables from brokers, dealers and clearing organizations		 (3,811)	 (1,794)	 1,322
   Net payables to customers and counterparties			 53,857	 9,823	 2,953
   Securities borrowed, net of securities loaned			 (51,655)	 (28,666)	 (32,777)
   Financial instruments sold under agreements to repurchase,
    net of financial instruments purchased under agreements to resell		 8,095	 (42)	 62,269
   Financial instruments owned, at fair value				 (118,864)	 (48,479)	 (66,899)
   Financial instruments sold, but not yet purchased, at fair value		 57,938	 6,384	 16,974
   Other, net				 7,962	 12,823	 (815)
    Net cash used for operating activities				 (68,197)	 (58,314)	 (12,413)
Cash flows from investing activities
  Purchase of property, leasehold improvements and equipment		 (2,130)	 (1,744)	 (1,421)
  Proceeds from sales of property, leasehold improvements and equipment		 93	 69	 639
  Business acquisitions, net of cash acquired				 (1,900)	 (1,661)	 (556)
  Proceeds from sales of investments				 4,294	 2,114	 274
  Purchase of available-for-sale securities				 (872)	 (12,922)	 —
  Proceeds from sales of available-for-sale securities			 911	 4,396	 —
    Net cash provided by/(used for) investing activities			 396	 (9,748)	 (1,064)
Cash flows from financing activities
  Unsecured short-term borrowings, net				 12,262	 (4,031)	 (5)
  Other secured financings (short-term), net				 2,780	 16,856	 2,238
  Proceeds from issuance of other secured financings (long-term)		 21,703	 14,451	 7,279
  Repayment of other secured financings (long-term), including the current portion	 (7,355)	 (7,420)	 (5,941)
  Proceeds from issuance of unsecured long-term borrowings			 57,516	 48,839	 35,898
  Repayment of unsecured long-term borrowings, including the current portion		 (14,823)	 (13,510)	 (16,399)
  Derivative contracts with a financing element, net			 4,814	 3,494	 1,060
  Bank deposits, net				 4,673	 10,697	 —
  Common stock repurchased				 (8,956)	 (7,817)	 (7,108)
  Dividends and dividend equivalents paid on common stock,
   preferred stock and restricted stock units				 (831)	 (754)	 (511)
  Proceeds from issuance of common stock				 791	 1,613	 1,143
  Proceeds from issuance of preferred stock, net of issuance costs		 —	 1,349	 1,719
  Excess tax benefit related to share-based compensation			 817	 464	 —
  Cash settlement of share-based compensation			 (1)	 (137)	 —
    Net cash provided by financing activities			 73,390	 64,094	 19,373
   Net increase/(decrease) in cash and cash equivalents			 5,589	 (3,968)	 5,896
Cash and cash equivalents, beginning of year				 6,293	 10,261	 4,365
Cash and cash equivalents, end of year				 $  11,882	 $  6,293	 $ 10,261
Supplemental Disclosures:
Cash payments for interest, net of capitalized interest, were $40.74 billion, $30.98 billion and $17.49 billion for the years ended November 2007, November 2006 and
November 2005, respectively.
Cash payments for income taxes, net of refunds, were $5.78 billion, $4.56 billion and $2.47 billion for the years ended November 2007, November 2006 and
November 2005, respectively.
Non-cash activities:
The firm assumed $409 million, $498 million and $1.15 billion of debt in connection with business acquisitions for the years ended November 2007, November 2006 and
November 2005, respectively. For the year ended November 2007, the firm issued $17 million of common stock in connection with business acquisitions.
The accompanying notes are an integral part of these consolidated financial statements.
89Goldman Sachs 2007 Annual Report
Consolidated Statements of Comprehensive Income
	 Year Ended November
(in millions)				 2007	 2006	 2005
Net earnings				 $11,599	 $9,537	 $5,626
Currency translation adjustment, net of tax				 39	 45	 (27)
Minimum pension liability adjustment, net of tax			 38	 (27)	 (11)
Net gains/(losses) on cash flow hedges, net of tax			 (2)	 (7)	 9
Net unrealized gains/(losses) on available-for-sale securities, net of tax		 (12)	 10	 18
Comprehensive income				 $11,662	 $9,558	 $5,615
The accompanying notes are an integral part of these consolidated financial statements.
90 Goldman Sachs 2007 Annual Report
Notes to Consolidated Financial Statements
The firm determines whether it has a controlling financial
interest in an entity by first evaluating whether the entity is
a voting interest entity, a variable interest entity (VIE) or a
qualifying special-purpose entity (QSPE) under generally
accepted accounting principles.
■	 Voting Interest Entities. Voting interest entities are
entities in which (i) the total equity investment at risk is
sufficient to enable the entity to finance its activities
independently and (ii) the equity holders have the obligation
to absorb losses, the right to receive residual returns and the
right to make decisions about the entity’s activities. Voting
interest entities are consolidated in accordance with
Accounting Research Bulletin (ARB) No. 51, “Consolidated
Financial Statements,” as amended. ARB No. 51 states that
the usual condition for a controlling financial interest in an
entity is ownership of a majority voting interest. Accordingly,
the firm consolidates voting interest entities in which it has
a majority voting interest.
■	 Variable Interest Entities. VIEs are entities that lack
one or more of the characteristics of a voting interest entity.
A controlling financial interest in a VIE is present when an
enterprise has a variable interest, or a combination of
variable interests, that will absorb a majority of the VIE’s
expected losses, receive a majority of the VIE’s expected
residual returns, or both. The enterprise with a controlling
financial interest, known as the primary beneficiary,
consolidates the VIE. In accordance with Financial Accounting
Standards Board (FASB) Interpretation (FIN) No. 46-R,
“Consolidation of Variable Interest Entities,” the firm
consolidates VIEs for which it is the primary beneficiary. The
firm determines whether it is the primary beneficiary of a VIE
by first performing a qualitative analysis of the VIE that
includes a review of, among other factors, its capital
structure, contractual terms, which interests create or absorb
variability, related party relationships and the design of the
VIE. Where qualitative analysis is not conclusive, the firm
performs a quantitative analysis. For purposes of allocating
a VIE’s expected losses and expected residual returns to its
variable interest holders, the firm utilizes the “top down”
method. Under that method, the firm calculates its share of
the VIE’s expected losses and expected residual returns using
the specific cash flows that would be allocated to it, based on
contractual arrangements and/or the firm’s position in the
capital structure of the VIE, under various probability-
weighted scenarios.
■	 QSPEs. QSPEs are passive entities that are commonly used in
mortgage and other securitization transactions. Statement of
Financial Accounting Standards (SFAS) No. 140, “Accounting
for Transfers and Servicing of Financial Assets and
Extinguishments of Liabilities,” sets forth the criteria an
entity must satisfy to be a QSPE. These criteria include the
Note 1
Description of Business
The Goldman Sachs Group, Inc. (Group Inc.), a Delaware
corporation, together with its consolidated subsidiaries
(collectively, the firm), is a leading global investment banking,
securities and investment management firm that provides a
wide range of services worldwide to a substantial and diversified
client base that includes corporations, financial institutions,
governments and high-net-worth individuals.
The firm’s activities are divided into three segments:
■	 Investment Banking. The firm provides a broad range of
investment banking services to a diverse group of corporations,
financial institutions, investment funds, governments and
individuals.
■	 Trading and Principal Investments. The firm facilitates
client transactions with a diverse group of corporations,
financial institutions, investment funds, governments and
individuals and takes proprietary positions through market
making in, trading of and investing in fixed income and
equity products, currencies, commodities and derivatives on
these products. In addition, the firm engages in market-
making and specialist activities on equities and options
exchanges and clears client transactions on major stock,
options and futures exchanges worldwide. In connection with
the firm’s merchant banking and other investing activities, the
firm makes principal investments directly and through funds
that the firm raises and manages.
■	 Asset Management and Securities Services. The firm
provides investment advisory and financial planning services
and offers investment products (primarily through separately
managed accounts and commingled vehicles, such as mutual
funds and private investment funds) across all major asset
classes to a diverse group of institutions and individuals
worldwide and provides prime brokerage services, financing
services and securities lending services to institutional clients,
including hedge funds, mutual funds, pension funds and
foundations, and to high-net-worth individuals worldwide.
Note 2
Significant Accounting Policies
Basis of Presentation
These consolidated financial statements include the accounts
of Group Inc. and all other entities in which the firm has
a controlling financial interest. All material intercompany
transactions and balances have been eliminated.
91Goldman Sachs 2007 Annual Report
Notes to Consolidated Financial Statements
and tax audits. Although these and other estimates and
assumptions are based on the best available information,
actual results could be materially different from these estimates.
Revenue Recognition
Investment Banking. Underwriting revenues and fees
from mergers and acquisitions and other financial advisory
assignments are recognized in the consolidated statements of
earnings when the services related to the underlying transaction
are completed under the terms of the engagement. Expenses
associated with such transactions are deferred until the related
revenue is recognized or the engagement is otherwise concluded.
Underwriting revenues are presented net of related expenses.
Expenses associated with financial advisory transactions
are recorded as non-compensation expenses, net of client
reimbursements.
Financial Instruments. “Total financial instruments owned,
at fair value” and “Financial instruments sold, but not yet
purchased, at fair value” are reflected in the consolidated
statements of financial condition on a trade-date basis. Related
unrealized gains or losses are generally recognized in “Trading
and principal investments” in the consolidated statements of
earnings. The fair value of a financial instrument is the amount
that would be received to sell an asset or paid to transfer a
liability in an orderly transaction between market participants
at the measurement date (the exit price). Instruments that the
firm owns (long positions) are marked to bid prices, and
instruments that the firm has sold, but not yet purchased (short
positions), are marked to offer prices. Fair value measurements
are not adjusted for transaction costs.
The firm adopted SFAS No. 157, “Fair Value Measurements,”
as of the beginning of 2007. SFAS No. 157 establishes a fair
value hierarchy that prioritizes the inputs to valuation
techniques used to measure fair value. The hierarchy gives the
highest priority to unadjusted quoted prices in active markets
for identical assets or liabilities (level 1 measurements) and the
lowest priority to unobservable inputs (level 3 measurements).
The three levels of the fair value hierarchy under SFAS No. 157
are described below:
Basis of Fair Value Measurement
Level 1	 Unadjusted quoted prices in active markets that are
accessible at the measurement date for identical,
unrestricted assets or liabilities;
Level 2	 Quoted prices in markets that are not active or financial
instruments for which all significant inputs are
observable, either directly or indirectly;
Level 3	 Prices or valuations that require inputs that are both
significant to the fair value measurement and
unobservable.
types of assets a QSPE may hold, limits on asset sales, the use
of derivatives and financial guarantees, and the level of
discretion a servicer may exercise in attempting to collect
receivables. These criteria may require management to make
judgments about complex matters, including whether a
derivative is considered passive and the degree of discretion
a servicer may exercise. In accordance with SFAS No. 140
and FIN No. 46-R, the firm does not consolidate QSPEs.
■	 Equity-Method Investments. When the firm does not
have a controlling financial interest in an entity but exerts
significant influence over the entity’s operating and financial
policies (generally defined as owning a voting interest
of 20% to 50%) and has an investment in common stock
or in-substance common stock, the firm accounts for its
investment in accordance with the equity method of
accounting prescribed by Accounting Principles Board (APB)
Opinion No. 18, “The Equity Method of Accounting for
Investments in Common Stock.” For investments acquired
subsequent to the adoption of SFAS No. 159, “The Fair
Value Option for Financial Assets and Financial Liabilities,”
the firm generally has elected to apply the fair value option
in accounting for such investments. See “— Recent Accounting
Developments” for a discussion of the firm’s adoption of
SFAS No. 159.
■	 Other. If the firm does not consolidate an entity or apply
the equity method of accounting, the firm accounts for its
investment at fair value. The firm also has formed numerous
nonconsolidated investment funds with third-party investors
that are typically organized as limited partnerships. The firm
acts as general partner for these funds and generally does not
hold a majority of the economic interests in these funds. The
firm has generally provided the third-party investors with
rights to terminate the funds or to remove the firm as the
general partner. These fund investments are included in
“Financial instruments owned, at fair value” in the consolidated
statements of financial condition.
Unless otherwise stated herein, all references to November 2007,
November 2006 and November 2005 refer to the firm’s
fiscal years ended, or the dates, as the context requires,
November 30, 2007, November 24, 2006 and November 25, 2005,
respectively. Certain reclassifications have been made to previously
reported amounts to conform to the current presentation.
Use of Estimates
These consolidated financial statements have been prepared in
accordance with generally accepted accounting principles that
require management to make certain estimates and assumptions.
The most important of these estimates and assumptions relate
to fair value measurements, the accounting for goodwill and
identifiable intangible assets and the provision for potential
losses that may arise from litigation and regulatory proceedings
92 Goldman Sachs 2007 Annual Report
Notes to Consolidated Financial Statements
For positions that are not traded in active markets or are
subject to transfer restrictions, valuations are adjusted to reflect
illiquidity and/or non-transferability, and such adjustments
are generally based on available market evidence. In the
absence of such evidence, management’s best estimate is used.
■	 Derivative Contracts.  Derivative contracts can be
exchange-traded or over-the-counter (OTC). Exchange-traded
derivatives typically fall within level 1 or level 2 of the fair
value hierarchy depending on whether they are deemed to be
actively traded or not. The firm generally values exchange-
traded derivatives within portfolios using models which
calibrate to market clearing levels and eliminate timing
differences between the closing price of the exchange-traded
derivatives and their underlying cash instruments. In such
cases, exchange-traded derivatives are classified within level 2
of the fair value hierarchy.
OTC derivatives are valued using market transactions and
other market evidence whenever possible, including market-
based inputs to models, model calibration to market clearing
transactions, broker or dealer quotations or alternative pricing
sources with reasonable levels of price transparency. Where
models are used, the selection of a particular model to value
an OTC derivative depends upon the contractual terms of,
and specific risks inherent in, the instrument as well as the
availability of pricing information in the market. The firm
generally uses similar models to value similar instruments.
Valuation models require a variety of inputs, including
contractual terms, market prices, yield curves, credit curves,
measures of volatility, prepayment rates and correlations of
such inputs. For OTC derivatives that trade in liquid markets,
such as generic forwards, swaps and options, model inputs
can generally be verified and model selection does not involve
significant management judgment. Such instruments are
typically classified within level 2 of the fair value hierarchy.
Certain OTC derivatives trade in less liquid markets with
limited pricing information, and the determination of fair
value for these derivatives is inherently more difficult. Such
instruments are classified within level 3 of the fair value
hierarchy. Where the firm does not have corroborating market
evidence to support significant model inputs and cannot
verify the model to market transactions, transaction price is
initially used as the best estimate of fair value. Accordingly,
when a pricing model is used to value such an instrument, the
model is adjusted so that the model value at inception equals
the transaction price. The valuations of these less liquid OTC
derivatives are typically based on level 1 and/or level 2 inputs
that can be observed in the market, as well as unobservable
level 3 inputs. Subsequent to initial recognition, the firm
updates the level 1 and level 2 inputs to reflect observable
market changes, with resulting gains and losses reflected
within level 3. Level 3 inputs are only changed when
corroborated by evidence such as similar market transactions,
A financial instrument’s level within the fair value hierarchy
is based on the lowest level of any input that is significant
to the fair value measurement. See “— Recent Accounting
Developments” for a discussion of the impact of adopting
SFAS No. 157.
In determining fair value, the firm separates its “Financial
instruments owned, at fair value” and its “Financial instruments
sold, but not yet purchased, at fair value” into two categories:
cash instruments and derivative contracts.
■	 Cash Instruments. The firm’s cash instruments are generally
classified within level 1 or level 2 of the fair value hierarchy
because they are valued using quoted market prices, broker
or dealer quotations, or alternative pricing sources with
reasonable levels of price transparency. The types of
instruments valued based on quoted market prices in active
markets include most U.S. government and agency securities,
many other sovereign government obligations, active listed
equities and most money market securities. Such instruments
are generally classified within level 1 of the fair value hierarchy.
The firm does not adjust the quoted price for such instruments,
even in situations where the firm holds a large position and a
sale could reasonably impact the quoted price.
The types of instruments valued based on quoted prices in
markets that are not active, broker or dealer quotations, or
alternative pricing sources with reasonable levels of price
transparency include most investment-grade and high-yield
corporate bonds, most mortgage products, certain corporate
bank and bridge loans, less liquid listed equities, state,
municipal and provincial obligations, most physical
commodities and certain loan commitments. Such instruments
are generally classified within level 2 of the fair value hierarchy.
Certain cash instruments are classified within level 3 of the fair
value hierarchy because they trade infrequently and therefore
have little or no price transparency. Such instruments include
private equity and real estate fund investments, certain
corporate bank and bridge loans, less liquid mortgage whole
loans, distressed debt instruments and certain loan commitments.
The transaction price is initially used as the best estimate of
fair value. Accordingly, when a pricing model is used to value
such an instrument, the model is adjusted so that the model
value at inception equals the transaction price. This valuation
is adjusted only when changes to inputs and assumptions are
corroborated by evidence such as transactions in similar
instruments, completed or pending third-party transactions in
the underlying investment or comparable entities, subsequent
rounds of financing, recapitalizations and other transactions
across the capital structure, offerings in the equity or debt
capital markets, and changes in financial ratios or cash flows.
93Goldman Sachs 2007 Annual Report
Notes to Consolidated Financial Statements
Securities borrowed and loaned within Trading and Principal
Investments, which are related to the firm’s matched book
and certain firm financing activities, are recorded at fair value
as allowed by SFAS No. 159. Prior to the adoption of SFAS
No. 159, these transactions were recorded based on the
amount of cash collateral advanced or received plus accrued
interest. These securities borrowed and loaned transactions
are generally valued based on inputs with reasonable levels
of price transparency and are classified within level 2 of the
fair value hierarchy.
■	 Other Secured Financings.  In addition to repurchase
agreements and securities loaned, the firm funds assets
through the use of other secured financing arrangements and
pledges financial instruments and other assets as collateral in
these transactions. SFAS No. 159 has been adopted for those
financings for which the use of fair value would eliminate
non-economic volatility in earnings from using different
measurement attributes (i.e., assets recorded at fair value with
related nonrecourse financings recorded based on the amount
of cash received plus accrued interest), primarily transfers
accounted for as financings rather than sales under SFAS
No. 140 and debt raised through the firm’s William Street
program. These other secured financing transactions are
generally valued based on inputs with reasonable levels of
price transparency and are classified within level 2 of the fair
value hierarchy. Other secured financings that are not
recorded at fair value are recorded based on the amount of
cash received plus accrued interest. See Note 3 for further
information regarding other secured financings.
Hybrid Financial Instruments. Hybrid financial instruments
are instruments that contain bifurcatable embedded derivatives
under SFAS No. 133, “Accounting for Derivative Instruments
and Hedging Activities,” and do not require settlement
by physical delivery of non-financial assets (e.g., physical
commodities). If the firm elects to bifurcate the embedded
derivative, it is accounted for at fair value and the host
contract is accounted for at amortized cost, adjusted for the
effective portion of any fair value hedge accounting relationships.
If the firm does not elect to bifurcate, the entire hybrid financial
instrument is accounted for at fair value under SFAS No. 155,
“Accounting for Certain Hybrid Financial Instruments — an
amendment of FASB Statements No. 133 and 140.” The
primary reasons for electing the fair value option for hybrid
financial instruments are mitigating volatility in earnings from
using different measurement attributes, simplification and cost-
benefit considerations. See Notes 3 and 4 for additional
information about hybrid financial instruments.
Transfers of Financial Assets. In general, transfers of
financial assets are accounted for as sales under SFAS No. 140
when the firm has relinquished control over the transferred
assets. For transfers accounted for as sales, any related gains
or losses are recognized in net revenues. Transfers that are not
third-party pricing services and/or broker or dealer quotations,
or other empirical market data. In circumstances where the
firm cannot verify the model value to market transactions, it
is possible that a different valuation model could produce a
materially different estimate of fair value.
When appropriate, valuations are adjusted for various factors
such as liquidity, bid/offer spreads and credit considerations.
Such adjustments are generally based on available market
evidence. In the absence of such evidence, management’s best
estimate is used.
Collateralized Agreements and Financings. Collateralized
agreements consist of resale agreements and securities borrowed.
Collateralized financings consist of repurchase agreements,
securities loaned and other secured financings. Interest on
collateralized agreements and collateralized financings is
recognized in “Interest income” or “Interest expense,” respectively,
over the life of the transaction.
■	 Resale and Repurchase Agreements. Financial instruments
purchased under agreements to resell and financial
instruments sold under agreements to repurchase, principally
U.S. government, federal agency and investment-grade
sovereign obligations, represent collateralized financing
transactions. The firm receives financial instruments
purchased under agreements to resell, makes delivery of
financial instruments sold under agreements to repurchase,
monitors the market value of these financial instruments on
a daily basis and delivers or obtains additional collateral as
appropriate. Resale and repurchase agreements are carried in
the consolidated statements of financial condition at fair
value as allowed by SFAS No. 159. Prior to the adoption of
SFAS No. 159, these transactions were recorded at contractual
amounts plus accrued interest. Resale and repurchase
agreements are generally valued based on inputs with
reasonable levels of price transparency and are classified
within level 2 of the fair value hierarchy. Resale and repurchase
agreements are presented on a net-by-counterparty basis
when the requirements of FIN No. 41, “Offsetting of Amounts
Related to Certain Repurchase and Reverse Repurchase
Agreements,” or FIN No. 39, “Offsetting of Amounts Related
to Certain Contracts,” are satisfied.
■	 Securities Borrowed and Loaned. Securities borrowed
and loaned are generally collateralized by cash, securities or
letters of credit. The firm receives securities borrowed, makes
delivery of securities loaned, monitors the market value
of securities borrowed and loaned, and delivers or obtains
additional collateral as appropriate. Securities borrowed and
loaned within Securities Services, relating to both customer
activities and, to a lesser extent, certain firm financing
activities, are recorded based on the amount of cash collateral
advanced or received plus accrued interest. As these
arrangements are generally transacted on-demand, they
exhibit little, if any, sensitivity to changes in interest rates.
94 Goldman Sachs 2007 Annual Report
Notes to Consolidated Financial Statements
Asset Management. Management fees are recognized over the
period that the related service is provided based upon average
net asset values. In certain circumstances, the firm is also
entitled to receive incentive fees based on a percentage of a
fund’s return or when the return on assets under management
exceeds specified benchmark returns or other performance targets.
Incentive fees are generally based on investment performance
over a 12-month period and are subject to adjustment prior to
the end of the measurement period. Accordingly, incentive fees
are recognized in the consolidated statements of earnings when
the measurement period ends. Asset management fees and
incentive fees are included in “Asset management and securities
services” in the consolidated statements of earnings.
Share-Based Compensation
In the first quarter of 2006, the firm adopted SFAS No. 123-R,
“Share-Based Payment,” which is a revision to SFAS No. 123,
“Accounting for Stock-Based Compensation.” SFAS No. 123-R
focuses primarily on accounting for transactions in which an
entity obtains employee services in exchange for share-based
payments. Under SFAS No. 123-R, the cost of employee
services received in exchange for a share-based award is generally
measured based on the grant-date fair value of the award.
Under SFAS No. 123-R, share-based awards that do not
require future service (i.e., vested awards, including awards
granted to retirement-eligible employees) are expensed
immediately. Share-based employee awards that require future
service are amortized over the relevant service period. The firm
adopted SFAS No. 123-R under the modified prospective
adoption method. Under that method of adoption, the provisions
of SFAS No. 123-R are generally applied only to share-based
awards granted subsequent to adoption. Share-based awards
held by employees that were retirement-eligible on the date of
adoption of SFAS No. 123-R must continue to be amortized
over the stated service period of the award (and accelerated if
the employee actually retires). SFAS No. 123-R requires
expected forfeitures to be included in determining share-based
employee compensation expense.
The firm pays cash dividend equivalents on outstanding
restricted stock units. Dividend equivalents paid on restricted
stock units accounted for under SFAS No. 123 and SFAS
No. 123-R are charged to retained earnings. SFAS No. 123-R
requires dividend equivalents paid on restricted stock units
expected to be forfeited to be included in compensation
expense. Prior to the adoption of SFAS No. 123-R, dividend
equivalents paid on restricted stock units that were later
forfeited by employees were reclassified to compensation
expense from retained earnings. The tax benefit related to
dividend equivalents paid on restricted stock units is accounted
for as a reduction of income tax expense (see “— Recent
Accounting Developments” for a discussion of Emerging Issues
Task Force (EITF) Issue No. 06-11, “Accounting for Income
Tax Benefits of Dividends on Share-Based Payment Awards”).
accounted for as sales are accounted for as collateralized
financings, with the related interest expense recognized in net
revenues over the life of the transaction.
Power Generation. Power generation revenues associated
with the firm’s consolidated power generation facilities are
included in “Trading and principal investments” in the
consolidated statements of earnings when power is delivered.
These revenues were $421 million, $553 million and $496 million
for the years ended November 2007, November 2006 and
November 2005, respectively. Direct employee costs associated
with the firm’s consolidated power generation facilities of
$97 million, $78 million and $70 million for the years ended
November 2007, November 2006 and November 2005,
respectively, are included in “Compensation and benefits.” The
other direct costs associated with these power generation
facilities and related contractual assets are included in “Cost
of power generation.”
Commissions.  Commission revenues from executing and
clearing client transactions on stock, options and futures markets
worldwide are recognized in “Trading and principal investments”
in the consolidated statements of earnings on a trade-date basis.
Insurance Activities. Revenues from variable annuity
and life insurance contracts, and from providing reinsurance
of such contracts, generally consist of fees assessed on contract
holder account balances for mortality charges, policy
administration and surrender charges. These fees are recognized
within “Trading and principal investments” in the consolidated
statements of earnings in the period that services are provided.
Interest credited to variable annuity and life insurance account
balances and changes in reserves are recognized in “Other
expenses” in the consolidated statements of earnings.
Premiums earned for providing property catastrophe reinsurance
are recognized within “Trading and principal investments” in
the consolidated statements of earnings over the coverage
period, net of premiums ceded for the cost of reinsurance.
Expenses for liabilities related to property catastrophe reinsurance
claims, including estimates of claims that have been incurred
but not reported, are recognized within “Other expenses” in
the consolidated statements of earnings.
Merchant Banking Overrides. The firm is entitled to receive
merchant banking overrides (i.e., an increased share of a fund’s
income and gains) when the return on the funds’ investments
exceeds certain threshold returns. Overrides are based on
investment performance over the life of each merchant banking
fund, and future investment underperformance may require
amounts of override previously distributed to the firm to be
returned to the funds. Accordingly, overrides are recognized in
the consolidated statements of earnings only when all material
contingencies have been resolved. Overrides are included
in “Trading and principal investments” in the consolidated
statements of earnings.
95Goldman Sachs 2007 Annual Report
Notes to Consolidated Financial Statements
No. 144. An impairment loss, calculated as the difference
between the estimated fair value and the carrying value of an
asset or asset group, is recognized if the sum of the expected
undiscounted cash flows relating to the asset or asset group is
less than the corresponding carrying value.
The firm’s operating leases include space held in excess of
current requirements. Rent expense relating to space held
for growth is included in “Occupancy” in the consolidated
statements of earnings. In accordance with SFAS No. 146,
“Accounting for Costs Associated with Exit or Disposal
Activities,” the firm records a liability, based on the fair value
of the remaining lease rentals reduced by any potential or
existing sublease rentals, for leases where the firm has ceased
using the space and management has concluded that the firm
will not derive any future economic benefits. Costs to terminate
a lease before the end of its term are recognized and measured
at fair value upon termination.
Foreign Currency Translation
Assets and liabilities denominated in non-U.S. currencies are
translated at rates of exchange prevailing on the date of the
consolidated statement of financial condition, and revenues
and expenses are translated at average rates of exchange
for the year. Gains or losses on translation of the financial
statements of a non-U.S. operation, when the functional
currency is other than the U.S. dollar, are included, net
of hedges and taxes, in the consolidated statements of
comprehensive income. The firm seeks to reduce its net
investment exposure to fluctuations in foreign exchange rates
through the use of foreign currency forward contracts and
foreign currency-denominated debt. For foreign currency
forward contracts, hedge effectiveness is assessed based on
changes in forward exchange rates; accordingly, forward points
are reflected as a component of the currency translation
adjustment in the consolidated statements of comprehensive
income. For foreign currency-denominated debt, hedge
effectiveness is assessed based on changes in spot rates. Foreign
currency remeasurement gains or losses on transactions in
nonfunctional currencies are included in the consolidated
statements of earnings.
Income Taxes
Deferred tax assets and liabilities are recognized for temporary
differences between the financial reporting and tax bases of
the firm’s assets and liabilities. Valuation allowances are
established to reduce deferred tax assets to the amount that
more likely than not will be realized. The firm’s tax assets and
liabilities are presented as a component of “Other assets” and
“Other liabilities and accrued expenses,” respectively, in the
consolidated statements of financial condition. Tax provisions
are computed in accordance with SFAS No. 109, “Accounting
for Income Taxes.” Contingent liabilities related to income
taxes are recorded when the criteria for loss recognition under
In certain cases, primarily related to the death of an employee
or conflicted employment (as outlined in the applicable award
agreements), the firm may cash settle share-based compensation
awards. For awards accounted for as equity instruments,
“Additional paid-in capital” is adjusted to the extent of the
difference between the current value of the award and the
grant-date value of the award.
Goodwill
Goodwill is the cost of acquired companies in excess of the fair
value of identifiable net assets at acquisition date. In accordance
with SFAS No. 142, “Goodwill and Other Intangible Assets,”
goodwill is tested at least annually for impairment. An
impairment loss is triggered if the estimated fair value of
an operating segment, which is a component one level below
the firm’s three business segments, is less than its estimated net
book value. Such loss is calculated as the difference between
the estimated fair value of goodwill and its carrying value.
Identifiable Intangible Assets
Identifiable intangible assets, which consist primarily of
customer lists, specialist rights and the value of business
acquired (VOBA) and deferred acquisition costs (DAC) in the
firm’s insurance subsidiaries, are amortized over their estimated
useful lives in accordance with SFAS No. 142. Identifiable
intangible assets are tested for potential impairment whenever
events or changes in circumstances suggest that an asset’s or
asset group’s carrying value may not be fully recoverable in
accordance with SFAS No. 144, “Accounting for the
Impairment or Disposal of Long-Lived Assets.” An impairment
loss, calculated as the difference between the estimated fair value
and the carrying value of an asset or asset group, is recognized if
the sum of the estimated undiscounted cash flows relating to the
asset or asset group is less than the corresponding carrying value.
Property, Leasehold Improvements
and Equipment
Property, leasehold improvements and equipment, net of
accumulated depreciation and amortization, are included in
“Other assets” in the consolidated statements of financial
condition.
Substantially all property and equipment are depreciated on a
straight-line basis over the useful life of the asset. Leasehold
improvements are amortized on a straight-line basis over
the useful life of the improvement or the term of the lease,
whichever is shorter. Certain costs of software developed or
obtained for internal use are capitalized and amortized on a
straight-line basis over the useful life of the software.
Property, leasehold improvements and equipment are tested
for potential impairment whenever events or changes in
circumstances suggest that an asset’s or asset group’s carrying
value may not be fully recoverable in accordance with SFAS
96 Goldman Sachs 2007 Annual Report
Notes to Consolidated Financial Statements
No. 157 requires that a fair value measurement reflect the
assumptions market participants would use in pricing an asset
or liability based on the best information available. Assumptions
include the risks inherent in a particular valuation technique
(such as a pricing model) and/or the risks inherent in the inputs
to the model.
In addition, SFAS No. 157 prohibits the recognition of “block
discounts” for large holdings of unrestricted financial instruments
where quoted prices are readily and regularly available for an
identical asset or liability in an active market.
The provisions of SFAS No. 157 are to be applied prospectively,
except changes in fair value measurements that result from the
initial application of SFAS No. 157 to existing derivative financial
instruments measured under EITF Issue No. 02-3, existing
hybrid financial instruments measured at fair value and block
discounts, all of which are to be recorded as an adjustment to
beginning retained earnings in the year of adoption.
The firm adopted SFAS No. 157 as of the beginning of 2007.
The transition adjustment to beginning retained earnings was
a gain of $51 million, net of tax. For the first quarter of 2007,
the effect of the nullification of EITF Issue No. 02-3 and the
removal of liquidity discounts for actively traded positions was
not material. In addition, under SFAS No. 157, gains on principal
investments are recorded in the absence of substantial third-
party transactions if market evidence is sufficient. In the first
quarter of 2007, the firm recorded approximately $500 million
of such gains as a result of adopting SFAS No. 157.
SFAS No. 158. In September 2006, the FASB issued SFAS
No. 158, “Employers’ Accounting for Defined Benefit Pension
and Other Postretirement Plans, an amendment of FASB
Statements No. 87, 88, 106 and 132-R.” SFAS No. 158 requires
an entity to recognize in its statement of financial condition the
funded status of its defined benefit pension and postretirement
plans, measured as the difference between the fair value of the
plan assets and the benefit obligation. SFAS No. 158 also
requires an entity to recognize changes in the funded status of
a defined benefit pension and postretirement plan within
accumulated other comprehensive income, net of tax, to the
extent such changes are not recognized in earnings as components
of periodic net benefit cost. SFAS No. 158 is effective as of the
end of the fiscal year ending after December 15, 2006. The firm
adopted SFAS No. 158 as of the end of 2007. The adjustment
to accumulated other comprehensive loss for the initial
application of SFAS No. 158 was $194 million, net of tax.
SFAS No. 159.  In February 2007, the FASB issued SFAS
No. 159, “The Fair Value Option for Financial Assets and
Financial Liabilities,” which gives entities the option to measure
eligible financial assets, financial liabilities and firm commitments
at fair value (i.e., the fair value option), on an instrument-by-
instrument basis, that are otherwise not accounted for at fair
value under other accounting standards. The election to use the
SFAS No. 5, “Accounting for Contingencies,” as amended,
have been met (see “— Recent Accounting Developments”
below for a discussion of the impact of FIN No. 48,
“Accounting for Uncertainty in Income Taxes — an Interpretation
of FASB Statement No. 109,” on SFAS No. 109).
Earnings Per Common Share (EPS)
Basic EPS is calculated by dividing net earnings applicable to
common shareholders by the weighted average number of
common shares outstanding. Common shares outstanding
includes common stock and restricted stock units for which no
future service is required as a condition to the delivery of the
underlying common stock. Diluted EPS includes the determinants
of basic EPS and, in addition, reflects the dilutive effect of the
common stock deliverable pursuant to stock options and to
restricted stock units for which future service is required as a
condition to the delivery of the underlying common stock.
Cash and Cash Equivalents
The firm defines cash equivalents as highly liquid overnight
deposits held in the ordinary course of business.
Recent Accounting Developments
FIN No. 48.  In June 2006, the FASB issued FIN No. 48,
“Accounting for Uncertainty in Income Taxes — an Interpretation
of FASB Statement No. 109.” FIN No. 48 requires that the
firm determine whether a tax position is more likely than not
to be sustained upon examination, including resolution of any
related appeals or litigation processes, based on the technical
merits of the position. Once it is determined that a position
meets this recognition threshold, the position is measured to
determine the amount of benefit to be recognized in the financial
statements. The firm will adopt the provisions of FIN No. 48
in the first quarter of 2008. Adoption of FIN No. 48 will not
have a material effect on the firm’s financial condition, results
of operations or cash flows.
SFAS No. 157. In September 2006, the FASB issued SFAS
No. 157, “Fair Value Measurements.” SFAS No. 157 clarifies
that fair value is an exit price, representing the amount that
would be received to sell an asset or paid to transfer a liability
in an orderly transaction between market participants. Under
SFAS No. 157, fair value measurements are not adjusted for
transaction costs.
SFAS No. 157 nullifies the guidance included in EITF Issue
No. 02-3, “Issues Involved in Accounting for Derivative
Contracts Held for Trading Purposes and Contracts Involved
in Energy Trading and Risk Management Activities,” that
prohibited the recognition of a day one gain or loss on derivative
contracts (and hybrid financial instruments measured at fair
value under SFAS No. 155) where the firm was unable to verify
all of the significant model inputs to observable market data
and/or verify the model to market transactions. However, SFAS
97Goldman Sachs 2007 Annual Report
Notes to Consolidated Financial Statements
The primary reasons for electing the fair value option are
mitigating volatility in earnings from using different measurement
attributes, simplification and cost-benefit considerations.
SOP No. 07-1 and FSP FIN No. 46-R-7.  In June 2007, the
American Institute of Certified Public Accountants (AICPA)
issued Statement of Position (SOP) No. 07-1, “Clarification of
the Scope of the Audit and Accounting Guide ‘Audits of
Investment Companies’ and Accounting by Parent Companies
and Equity Method Investors for Investments in Investment
Companies.’’ SOP No. 07-1 clarifies when an entity may apply
the provisions of the Audit and Accounting Guide for
Investment Companies (the Guide). In May 2007, the FASB
issued FSP FIN No. 46-R-7, “Application of FIN 46-R to
Investment Companies,” which amends FIN No. 46-R to make
permanent the temporary deferral of the application of FIN
No. 46-R to entities within the scope of the revised Guide
under SOP No. 07-1. FSP FIN No. 46-R-7 is effective upon
adoption of SOP No. 07-1. In November 2007, the FASB
issued Proposed FSP SOP No. 07-1-a, “The Effective Date
of AICPA Statement of Position 07-1,” which proposes to
indefinitely defer the effective date for SOP No. 07-01 and,
consequently, FSP FIN No. 46-R-7.
EITF Issue No. 06-11. In June 2007, the EITF reached consensus
on Issue No. 06-11, “Accounting for Income Tax Benefits of
Dividends on Share-Based Payment Awards.” EITF Issue
No. 06-11 requires that the tax benefit related to dividend
equivalents paid on restricted stock units, which are expected
to vest, be recorded as an increase to additional paid-in capital.
The firm currently accounts for this tax benefit as a reduction
to income tax expense. EITF Issue No. 06-11 is to be applied
prospectively for tax benefits on dividends declared in fiscal
years beginning after December 15, 2007, and the firm expects
to adopt the provisions of EITF Issue No. 06-11 beginning in
the first quarter of 2009. The firm is currently evaluating the
impact of adopting EITF Issue No. 06-11 on its financial
condition, results of operations and cash flows.
fair value option is available at specified election dates, such as
when an entity first recognizes a financial asset or financial
liability or upon entering into a firm commitment. Subsequent
changes in fair value must be recorded in earnings. Additionally,
SFAS No. 159 allows for a one-time election for existing positions
upon adoption, with the transition adjustment recorded to
beginning retained earnings.
The firm adopted SFAS No. 159 as of the beginning of 2007
and elected to apply the fair value option to the following
financial assets and liabilities existing at the time of adoption:
■	 certain unsecured short-term borrowings, consisting of all
promissory notes and commercial paper;
■	 certain other secured financings, primarily transfers accounted
for as financings rather than sales under SFAS No. 140 and
debt raised through the firm’s William Street program;
■	certain unsecured long-term borrowings, including prepaid
physical commodity transactions;
■	 resale and repurchase agreements;
■	 securities borrowed and loaned within Trading and Principal
Investments, consisting of the firm’s matched book and
certain firm financing activities;
■	 securities held by Goldman Sachs Bank USA (GS Bank
USA), which were previously accounted for as available-
for-sale; and
■	 receivables from customers and counterparties arising from
transfers accounted for as secured loans rather than purchases
under SFAS No. 140.
The transition adjustment to beginning retained earnings
related to the adoption of SFAS No. 159 was a loss of
$45 million, net of tax, substantially all of which related to
applying the fair value option to prepaid physical commodity
transactions.
Subsequent to the adoption of SFAS No. 159, the firm has
elected to apply the fair value option (i) to new positions within
the above categories, (ii) to corporate loans, corporate loan
commitments and certificates of deposit issued by GS Bank
USA and (iii) generally to investments where the firm would
otherwise apply the equity method of accounting. In certain
cases, the firm may continue to apply the equity method of
accounting to those investments which are strategic in nature
or closely related to the firm’s principal business activities,
where the firm has a significant degree of involvement in the
cash flows or operations of the investee, and/or where cost-
benefit considerations are less significant.
98 Goldman Sachs 2007 Annual Report
Notes to Consolidated Financial Statements
Total financial assets at fair value classified within level 3 were
$69.15 billion or 6% of “Total assets” on the consolidated
statement of financial condition as of November 2007. This
includes $14.44 billion of financial assets at fair value classified
within level 3 for which the firm does not bear economic
exposure. Excluding assets for which the firm does not bear
economic exposure, level 3 assets were 5% of “Total assets”
as of November 2007.
Fair Value Hierarchy
The following tables set forth by level within the fair value
hierarchy “Financial instruments owned, at fair value,” “Financial
instruments sold, but not yet purchased, at fair value” and
financial assets and liabilities accounted for at fair value under
SFAS No. 155 and SFAS No. 159 as of November 2007 (see
Note 2 for further information on the fair value hierarchy). As
required by SFAS No. 157, assets and liabilities are classified
in their entirety based on the lowest level of input that is
significant to the fair value measurement.
Note 3
Financial Instruments
Fair Value of Financial Instruments
The following table sets forth the firm’s financial instruments owned, at fair value, including those pledged as collateral, and
financial instruments sold, but not yet purchased, at fair value. At any point in time, the firm may use cash instruments as well
as derivatives to manage a long or short risk position.
	 As of November
	 2007	 	 2006
(in millions)			 Assets	 Liabilities	 Assets	 Liabilities
Commercial paper, certificates of deposit, time deposits and
  other money market instruments			 $   8,985 (1)
	 $      —	 $  14,723 (1)	
$      —
U.S. government, federal agency and sovereign obligations		 70,774	 58,637	 68,071	 51,200
Mortgage and other asset-backed loans and securities		 54,073 (2)
	 —	 41,017	 253
Bank loans			 49,154	3,563	 28,196	 1,154
Corporate debt securities and other debt obligations		 39,219	 8,280	 29,806	 7,050
Equities and convertible debentures			 122,205	 45,130	 83,282	 30,441
Physical commodities			 2,571	35	 1,923	 211
Derivative contracts			 105,614 (3)
	 99,378 (5)
	 67,543 (3)
	 65,496 (5)
Total			 $452,595 (4)
	 $215,023	 $334,561 (4)
	 $155,805
(1)	Includes $6.17 billion and $6.93 billion as of November 2007 and November 2006, respectively, of money market instruments held by William Street Funding Corporation
to support the William Street credit extension program (see Note 6 for further information regarding the William Street program).
(2)	Includes $7.64 billion of mortgage whole loans that were transferred to securitization vehicles where such transfers were accounted for as secured financings rather
than sales under SFAS No. 140. The firm distributed to investors the securities that were issued by the securitization vehicles and therefore does not bear economic
exposure to the underlying mortgage whole loans.
(3)	Net of cash received pursuant to credit support agreements of $59.05 billion and $24.06 billion as of November 2007 and November 2006, respectively.
(4)	Includes $1.17 billion of securities held within the firm’s insurance subsidiaries which are accounted for as available-for-sale under SFAS No. 115, “Accounting for Certain
Investments in Debt and Equity Securities” as of November 2007. Includes $9.95 billion of securities held within GS Bank USA and the firm’s insurance subsidiaries
which were accounted for as available-for-sale as of November 2006.
(5)	Net of cash paid pursuant to credit support agreements of $27.76 billion and $16.00 billion as of November 2007 and November 2006, respectively.
99Goldman Sachs 2007 Annual Report
Notes to Consolidated Financial Statements
	 Assets at Fair Value as of November 2007
					 Netting and	
(in millions)		 Level 1	 Level 2	 Level 3	 Collateral	Total
   Commercial paper, certificates of
    deposit, time deposits and other
    money market instruments		 $   6,237	 $  2,748	 $     —	 $      —	 $   8,985
   U.S. government, federal agency and
    sovereign obligations		 37,966	32,808	—	—	70,774
   Mortgage and other asset-backed loans
    and securities		 —	38,073	16,000	—	 54,073
   Bank loans		 —	35,820	13,334	—	 49,154
   Corporate debt securities and other
    debt obligations		 915	32,193	 6,111	—	39,219
   Equities and convertible debentures		 68,727	35,472	18,006 (6)
	—	122,205
   Physical commodities		 —	2,571	—	—	2,571
  Cash instruments		 113,845	179,685	 53,451	—	346,981
  Derivative contracts		 286	153,065	15,700	 (63,437) (7)
	105,614
Financial instruments owned, at fair value		 114,131	332,750	 69,151	 (63,437)	 452,595
Securities segregated for regulatory
  and other purposes 		 24,078 (4)
	 69,940 (5)
	—	—	 94,018
Receivables from customers and counterparties (1)
	 —	1,950	—	—	1,950
Securities borrowed (2)
		 —	 83,277	—	—	 83,277
Financial instruments purchased under
  agreements to resell, at fair value		 —	 85,717	—	—	 85,717
Total assets at fair value		 $138,209	 $573,634	 $ 69,151	 $(63,437)	 $717,557
Level 3 assets for which the firm
  does not bear economic exposure (3)
				 (14,437)
Level 3 assets for which the firm
  bears economic exposure				 $ 54,714
(1)	Consists of transfers accounted for as secured loans rather than purchases under SFAS No. 140 and prepaid variable share forwards.
(2)	Reflects securities borrowed within Trading and Principal Investments. Excludes securities borrowed within Securities Services, which are accounted for based on the
amount of cash collateral advanced plus accrued interest.
(3)	Consists of level 3 assets which are financed by nonrecourse debt, attributable to minority investors or attributable to employee interests in certain consolidated
funds.
(4)	Consists of U.S. Treasury securities and money market instruments as well as insurance separate account assets measured at fair value under AICPA SOP 03-1,
“Accounting and Reporting by Insurance Enterprises for Certain Nontraditional Long-Duration Contracts and for Separate Accounts.”
(5)	Principally consists of securities borrowed and resale agreements. The underlying securities have been segregated to satisfy certain regulatory requirements.
(6)	Consists of private equity and real estate fund investments.
(7)	Represents cash collateral and the impact of netting across the levels of the fair value hierarchy. Netting among positions classified within the same level is included in
that level.
100 Goldman Sachs 2007 Annual Report
Notes to Consolidated Financial Statements
	 Liabilities at Fair Value as of November 2007
					 Netting and	
(in millions)		 Level 1	 Level 2	 Level 3	 Collateral	Total
   U.S. government, federal agency and
    sovereign obligations		 $  57,714	 $    923	 $     —	 $     —	 $  58,637
   Bank loans		 —	3,525	38	—	3,563
   Corporate debt securities and
    other debt obligations		 —	7,764	 516	—	 8,280
   Equities and convertible debentures		 44,076	1,054	—	—	 45,130
   Physical commodities		 —	35	—	—	35
  Cash instruments		 101,790	13,301	 554	—	115,645
  Derivative contracts		 212	117,794	13,644	 (32,272) (6)
	 99,378
Financial instruments sold, but not yet
  purchased, at fair value		 102,002	131,095	14,198	 (32,272)	215,023
Unsecured short-term borrowings (1)
		 —	 44,060	 4,271	—	 48,331
Bank deposits (2)	
	 —	 463	—	—	 463
Securities loaned (3)
		 —	 5,449	—	—	 5,449
Financial instruments sold under agreements
  to repurchase, at fair value		 —	159,178	—	—	159,178
Other secured financings (4)
		 —	33,581	—	—	33,581
Unsecured long-term borrowings (5)
		 —	15,161	767	—	15,928
Total liabilities at fair value		 $102,002	 $388,987	 $19,236	 $(32,272)	 $477,953
(1)	Consists of promissory notes, commercial paper and hybrid financial instruments.
(2)	Consists of certificates of deposit issued by GS Bank USA.
(3)	Reflects securities loaned within Trading and Principal Investments. Excludes securities loaned within Securities Services, which are accounted for based on the amount
of cash collateral received plus accrued interest.
(4)	Primarily includes transfers accounted for as financings rather than sales under SFAS No. 140 and debt raised through the firm’s William Street program.
(5)	Primarily includes hybrid financial instruments and prepaid physical commodity transactions.
(6)	Represents cash collateral and the impact of netting across the levels of the fair value hierarchy. Netting among positions classified within the same level is included in
that level.
Cash Instruments
The net unrealized loss on level 3 cash instruments was
$2.59 billion for the year ended November 2007 (which
included $2.29 billion of unrealized losses on assets and
$294 million of unrealized losses on liabilities), primarily
consisting of unrealized losses on subprime residential mortgage
loans and securities as well as non-investment-grade loan
commitments, partially offset by unrealized gains on principal
investments. Level 3 cash instruments are frequently hedged
with instruments classified in level 1 and level 2, and accordingly,
gains or losses that have been reported in level 3 are frequently
offset by gains or losses attributable to instruments classified
in level 1 or level 2 or by gains or losses on derivative contracts
classified in level 3 of the fair value hierarchy.
Level 3 Gains and Losses
The table below sets forth a summary of changes in the fair
value of the firm’s level 3 financial assets and liabilities for the
year ended November 2007. The table reflects gains and losses
for the full year for all financial assets and liabilities categorized
as level 3 as of November 2007. The table does not include
gains or losses that were reported in level 3 in prior periods
for financial assets and liabilities that were transferred out of
level 3 prior to November 2007. As reflected in the table below,
the net unrealized gain on level 3 financial assets and liabilities
was $1.31 billion for the year ended November 2007. This net
unrealized gain should be considered in the context of the
factors discussed below.
101Goldman Sachs 2007 Annual Report
Notes to Consolidated Financial Statements
■	 Gains or losses that have been reported in level 3 resulting
from changes in level 1 or level 2 inputs are frequently offset
by gains or losses attributable to instruments classified in
level 1 or level 2 or by cash instruments reported in level 3 of
the fair value hierarchy.
The unrealized gains referenced above principally resulted
from changes in level 2 inputs, as opposed to changes in
level 3 inputs.
own credit spread on liabilities carried at fair value by discounting
future cash flows at a rate which incorporates the firm’s
observable credit spreads. As of November 2007, the difference
between the fair value and the aggregate contractual principal
amount of both long-term receivables and long-term debt
instruments (principal and non-principal protected) for which
the fair value option was elected was not material.
Derivative Contracts
The net unrealized gain on level 3 derivative contracts was
$4.54 billion for the year ended November 2007. Level 3 gains
and losses on derivative contracts should be considered in the
context of the following factors:
■	 A derivative contract with level 1 and/or level 2 inputs is
classified as a level 3 financial instrument in its entirety if it
has at least one significant level 3 input.
■	 If there is one significant level 3 input, the entire gain or loss
from adjusting only observable inputs (i.e., level 1 and
level 2) is still classified as level 3.
As of November 2007, the changes in the fair value of receivables
(including securities borrowed and resale agreements) for
which the fair value option was elected that were attributable
to changes in instrument-specific credit spreads were not material.
During 2007, the firm recognized gains of $216 million
attributable to the observable impact of the market’s widening
of the firm’s own credit spread on liabilities for which the fair
value option was elected. The firm calculates the impact of its
	 Level 3 Financial Assets and Liabilities
	 Year Ended November 2007
	 Cash	 Cash	 Derivative	 Unsecured	 Unsecured	
	 Instruments	 Instruments	 Contracts	 Short-Term	 Long-Term	Total
(in millions)	 – Assets	 – Liabilities	 – Net	 Borrowings	 Borrowings	 Gains
Balance, beginning of year	 $29,905	 $(223)	 $   580	 $(3,253)	 $(135)	 N/A
Realized gains/(losses) 	 2,232 (1)
	 (9) (2)
	1,713 (2)
	167 (2)
	 (7) (2)
	 $4,096
Unrealized gains/(losses)
  relating to instruments still
  held at the reporting date	 (2,292) (1)
	 (294) (2)
	 4,543 (2) (3)
	 (666) (2)
	22 (2)
	 $1,313
Purchases, issuances and
  settlements	 22,561	 (30)	 (1,365)	 (1,559)	 (567)	 N/A 
Transfers in and/or out of level 3	 1,045	2	 (3,415)	1,040	 (80)	 N/A
Balance, end of period 	 $53,451	 $(554)	 $ 2,056	 $(4,271)	 $(767)	 N/A
(1)	The aggregate amounts include approximately $(1.77) billion and $1.71 billion reported in “Trading and principal investments” and “Interest income,” respectively, in the
consolidated statements of earnings.
(2)	Substantially all is reported in “Trading and principal investments” in the consolidated statements of earnings.
(3)	Principally resulted from changes in level 2 inputs.
102 Goldman Sachs 2007 Annual Report
Notes to Consolidated Financial Statements
As of November 2007 and November 2006, the firm held
$45.75 billion (4% of total assets) and $46.20 billion (6% of
total assets), respectively, of U.S. government and federal agency
obligations (including securities guaranteed by the Federal
National Mortgage Association and the Federal Home Loan
Mortgage Corporation) included in “Financial instruments
owned, at fair value” and “Cash and securities segregated for
regulatory and other purposes” in the consolidated statements of
financial condition. As of November 2007 and November 2006,
the firm held $31.65 billion (3% of total assets) and $23.64 billion
(3% of total assets), respectively, of other sovereign obligations,
principally consisting of securities issued by the governments of
Japan and the United Kingdom. In addition, as of November 2007
and November 2006, $144.92 billion and $104.76 billion of
the firm’s financial instruments purchased under agreements to
resell and securities borrowed, respectively, were collateralized
by U.S. government and federal agency obligations. As of
November 2007 and 2006, $41.26 billion and $38.22 billion
of the firm’s financial instruments purchased under agreements
to resell and securities borrowed, respectively, were collateralized
by other sovereign obligations. As of November 2007 and
November 2006, the firm did not have credit exposure to any
other counterparty that exceeded 2% of the firm’s total assets.
Derivative Activities
Derivative contracts are instruments, such as futures, forwards,
swaps or option contracts, that derive their value from
underlying assets, indices, reference rates or a combination of
these factors. Derivative instruments may be privately negotiated
contracts, which are often referred to as OTC derivatives,
or they may be listed and traded on an exchange. Derivatives
may involve future commitments to purchase or sell financial
instruments or commodities, or to exchange currency or interest
payment streams. The amounts exchanged are based on the
specific terms of the contract with reference to specified rates,
securities, commodities, currencies or indices.
Certain cash instruments, such as mortgage-backed securities,
interest-only and principal-only obligations, and indexed debt
instruments, are not considered derivatives even though
their values or contractually required cash flows are derived
from the price of some other security or index. However,
certain commodity-related contracts are included in the firm’s
derivatives disclosure, as these contracts may be settled in cash
or the assets to be delivered under the contract are readily
convertible into cash.
The firm enters into derivative transactions to facilitate client
transactions, to take proprietary positions and as a means of
risk management. Risk exposures are managed through
diversification, by controlling position sizes and by entering
into offsetting positions. For example, the firm may manage
the risk related to a portfolio of common stock by entering into
an offsetting position in a related equity-index futures contract.
The following table sets forth the gains and (losses) included
in earnings for the year ended November 2007 related to financial
assets and liabilities for which the firm has elected to apply the
fair value option under SFAS No. 155 and SFAS No. 159. The
table does not reflect the impact to the firm’s earnings of adopting
SFAS No. 159 because a significant amount of these gains and
losses would have also been recognized under previously issued
generally accepted accounting principles. In addition, instruments
for which the firm has elected the fair value option are
economically hedged with instruments accounted for at fair
value under other generally accepted accounting principles that
are not reflected in the table below.
(in millions)	 Year Ended November 2007
Unsecured long-term borrowings		 $(1,979)
Other secured financings (1)
		 1,896
Unsecured short-term borrowings		 (1,064)
Financial instruments owned, at fair value (2)
		 (43)
Other (3)
		 18
Total (4)
		 $(1,172)
(1)	Includes gains of $2.08 billion related to financings recorded as a result of certain
mortgage securitizations that are accounted for as secured financings rather than
sales under SFAS No. 140. Changes in the fair value of the secured financings are
equally offset by changes in the fair value of the related mortgage whole loans,
which are included within the firm’s “Financial instruments owned, at fair value”
in the consolidated statement of financial condition.
(2)	Consists of investments where the firm would otherwise have applied the equity
method of accounting as well as securities held in GS Bank USA (previously
accounted for as available-for-sale).
(3)	Consists of resale and repurchase agreements and securities borrowed and
loaned within Trading and Principal Investments and certificates of deposit issued
by GS Bank USA.
(4)	Reported within “Trading and principal investments” within the consolidated
statements of earnings. The amounts exclude contractual interest, which is
included in “Interest Income” and “Interest Expense,” for all instruments other
than hybrid financial instruments.
Credit Concentrations
Credit concentrations may arise from trading, investing,
underwriting and securities borrowing activities and may be
impacted by changes in economic, industry or political factors.
The firm seeks to mitigate credit risk by actively monitoring
exposures and obtaining collateral as deemed appropriate.
While the firm’s activities expose it to many different industries
and counterparties, the firm routinely executes a high volume
of transactions with counterparties in the financial services
industry, including brokers and dealers, commercial banks,
investment funds and other institutional clients, resulting in
significant credit concentration with respect to this industry. In
the ordinary course of business, the firm may also be subject
to a concentration of credit risk to a particular counterparty,
borrower or issuer.
103Goldman Sachs 2007 Annual Report
Notes to Consolidated Financial Statements
shifts of the relevant yield curve. Parallel shifts change the
interest rate of all maturities by identical amounts. Slope shifts
change the curvature of the yield curve. For both the prospective
assessment, in response to each of the simulated yield curve
shifts, and the retrospective assessment, a hedging relationship
is deemed to be effective if the fair value of the hedging instrument
and the hedged item change inversely within a range of 80%
to 125%.
For fair value hedges, gains or losses on derivative transactions
are recognized in “Interest expense” in the consolidated
statements of earnings. The change in fair value of the hedged
item attributable to the risk being hedged is reported as an
adjustment to its carrying value and is subsequently amortized
into interest expense over its remaining life. Gains or losses
related to hedge ineffectiveness for all hedges are generally
included in “Interest expense.” These gains or losses and the
component of gains or losses on derivative transactions
excluded from the assessment of hedge effectiveness (e.g., the
effect of the passage of time on fair value hedges of the firm’s
borrowings) were not material to the firm’s results of operations
for the years ended November 2007, November 2006 and
November 2005. Gains and losses on derivatives used for trading
purposes are included in “Trading and principal investments”
in the consolidated statements of earnings.
The firm also has embedded derivatives that have been bifurcated
from related borrowings under SFAS No. 133. Such derivatives,
which are classified in unsecured short-term and unsecured
long-term borrowings, had a carrying value of $463 million
and $1.13 billion (excluding the debt host contract) as of
November 2007 and November 2006, respectively. See Notes 4
and 5 for further information regarding the firm’s unsecured
borrowings.
The firm applies hedge accounting under SFAS No. 133 to
certain derivative contracts. The firm uses these derivatives to
manage certain interest rate and currency exposures, including
the firm’s net investment in non-U.S. operations. The firm
designates certain interest rate swap contracts as fair value
hedges. These interest rate swap contracts hedge changes in the
relevant benchmark interest rate (e.g., London Interbank
Offered Rate (LIBOR)), effectively converting a substantial
portion of the firm’s unsecured long-term and certain unsecured
short-term borrowings into floating rate obligations. See Note 2
for information regarding the firm’s accounting policy for foreign
currency forward contracts used to hedge its net investment in
non-U.S. operations.
The firm applies a long-haul method to substantially all of
its hedge accounting relationships to perform an ongoing
assessment of the effectiveness of these relationships in achieving
offsetting changes in fair value or offsetting cash flows attributable
to the risk being hedged. The firm utilizes a dollar-offset method,
which compares the change in the fair value of the hedging
instrument to the change in the fair value of the hedged item,
excluding the effect of the passage of time, to prospectively and
retrospectively assess hedge effectiveness. The firm’s prospective
dollar-offset assessment utilizes scenario analyses to test hedge
effectiveness via simulations of numerous parallel and slope
The fair value of derivatives accounted for as qualifying hedges
under SFAS No. 133 consisted of $5.12 billion and $2.66 billion
in assets as of November 2007 and November 2006, respectively,
and $354 million and $551 million in liabilities as of November 2007
and November 2006, respectively.
The fair value of the firm’s derivative contracts is reflected net of cash paid or received pursuant to credit support agreements
and is reported on a net-by-counterparty basis in the firm’s consolidated statements of financial condition when management
believes a legal right of setoff exists under an enforceable netting agreement. The fair value of derivative financial instruments,
computed in accordance with the firm’s netting policy, is set forth below:
	 As of November
	 2007	 	 2006
(in millions)			 Assets	 Liabilities	 Assets	 Liabilities
Forward settlement contracts			   $ 17,447	 $20,799	 $11,751	 $14,335
Swap agreements			 54,428	39,271	 28,012	 22,471
Option contracts			 33,739	39,308	 27,780	 28,690
Total			 $105,614	 $99,378	 $67,543	 $65,496
104 Goldman Sachs 2007 Annual Report
Notes to Consolidated Financial Statements
During the year ended November 2007, the firm securitized
$81.40 billion of financial assets ($24.95 billion of residential
mortgages, $19.50 billion of commercial mortgages and
$36.95 billion of other financial assets, primarily in connection
with collateralized debt and loan obligations (CDOs and CLOs)).
During the year ended November 2006, the firm securitized
$103.92 billion of financial assets ($67.73 billion of residential
mortgages, $12.78 billion of commercial mortgages and
$23.41 billion of other financial assets, primarily in connection
with CDOs and CLOs). Cash flows received on retained interests
were approximately $705 million and $801 million for the
years ended November 2007 and November 2006, respectively.
As of November 2007 and November 2006, the firm held
$4.57 billion and $7.08 billion of retained interests, respectively,
from these securitization activities, including $2.72 billion and
$5.18 billion, respectively, held in QSPEs.
assumptions to the change in fair value is not usually linear. In
addition, the impact of a change in a particular assumption is
calculated independently of changes in any other assumption.
In practice, simultaneous changes in assumptions might magnify
or counteract the sensitivities disclosed above.
Securitization Activities
The firm securitizes commercial and residential mortgages,
home equity and auto loans, government and corporate bonds
and other types of financial assets. The firm acts as underwriter
of the beneficial interests that are sold to investors. The firm
derecognizes financial assets transferred in securitizations
provided it has relinquished control over such assets.
Transferred assets are accounted for at fair value prior to
securitization. Net revenues related to these underwriting
activities are recognized in connection with the sales of the
underlying beneficial interests to investors.
The firm may retain interests in securitized financial assets,
primarily in the form of senior or subordinated securities,
including residual interests. Retained interests are accounted
for at fair value and are included in “Total financial instruments
owned, at fair value” in the consolidated statements of
financial condition.
The preceding table does not give effect to the offsetting benefit
of other financial instruments that are held to mitigate risks
inherent in these retained interests. Changes in fair value based
on an adverse variation in assumptions generally cannot
be extrapolated because the relationship of the change in
The following table sets forth the weighted average key economic assumptions used in measuring the fair value of the firm’s
retained interests and the sensitivity of this fair value to immediate adverse changes of 10% and 20% in those assumptions:
	 As of November 2007	 	 As of November 2006
	 Type of Retained Interests	 	 Type of Retained Interests	
	 Mortgage-	 CDOs and	 Corporate	 Mortgage-	 CDOs and	 Corporate
($ in millions)	 Backed	 CLOs (3)
	 Debt	 Backed	 CLOs (3)
	 Debt (4)
Fair value of retained interests	 $3,378	 $1,188	 $—	 $4,013	 $1,973	 $1,097
Weighted average life (years)	 6.6	2.7	 —	 6.0	 7.0	 2.2
Constant prepayment rate	 15.1%	11.9%	 N/A	 21.2%	 24.5%	 N/A
Impact of 10% adverse change	 $     (50)	 $   (43)	 $—	 $  (121)	 $    (2)	 $    —
Impact of 20% adverse change	 (91)	 (98)	 —	 (221)	 (6)	 —
Anticipated credit losses (1)
	 4.3%	 N/A	 N/A	 2.0%	 N/A	 N/A
Impact of 10% adverse change (2)
	 $     (45)	 $    —	 $—	 $   (81)	 $    —	 $    —
Impact of 20% adverse change (2)
	 (72)	—	 —	 (155)	 —	 —
Discount rate	 8.4%	23.1%	 N/A	 9.4%	 6.9%	 3.9%
Impact of 10% adverse change	 $     (89)	 $   (46)	 $—	 $  (136)	 $   (38)	 $     (9)
Impact of 20% adverse change	 (170)	 (92)	 —	 (266)	 (74)	 (17)
(1)	Anticipated credit losses are computed only on positions for which expected credit loss is a key assumption in the determination of fair value or positions for which
expected credit loss is not reflected within the discount rate.
(2)	The impacts of adverse change take into account credit mitigants incorporated in the retained interests, including over-collateralization and subordination provisions.
(3)	Includes $905 million and $1.26 billion as of November 2007 and November 2006, respectively, of retained interests related to transfers of securitized assets that were
accounted for as secured financings rather than sales under SFAS No. 140.
(4)	Includes retained interests in bonds and other types of financial assets that are not subject to prepayment risk.
105Goldman Sachs 2007 Annual Report
Notes to Consolidated Financial Statements
VIEs generally purchase assets by issuing debt and equity
instruments. In certain instances, the firm provides guarantees
to VIEs or holders of variable interests in VIEs. In such cases,
the maximum exposure to loss included in the tables set forth
below is the notional amount of such guarantees. Such amounts
do not represent anticipated losses in connection with these
guarantees.
The firm’s variable interests in VIEs include senior and
subordinated debt; loan commitments; limited and general
partnership interests; preferred and common stock; interest
rate, foreign currency, equity, commodity and credit derivatives;
guarantees; and residual interests in mortgage-backed and
asset-backed securitization vehicles, CDOs and CLOs. The
firm’s exposure to the obligations of VIEs is generally limited
to its interests in these entities.
The following tables set forth total assets in nonconsolidated
VIEs in which the firm holds significant variable interests and
the firm’s maximum exposure to loss associated with these
variable interests. The firm has aggregated nonconsolidated
VIEs based on principal business activity, as reflected in the
first column. The nature of the firm’s variable interests can take
different forms, as described in the columns under maximum
exposure to loss.
In addition to the retained interests described above, the firm
also held interests in residential mortgage QSPEs purchased in
connection with secondary market-making activities. These
purchased interests approximated $6 billion and $8 billion as
of November 2007 and November 2006, respectively.
As of November 2007 and November 2006, the firm held
mortgage servicing rights with a fair value of $93 million and
$62 million, respectively, substantially all of which were retained
in connection with residential mortgage securitizations. These
servicing assets represent the firm’s right to receive a future
stream of cash flows associated with the firm’s obligation to
service residential mortgages. The fair value of mortgage
servicing rights will fluctuate in response to changes in certain
economic variables, such as interest rates, loan prepayment
assumptions and default rates. The firm determines the fair
value of mortgage servicing rights by using valuation models
that incorporate these variables in quantifying anticipated cash
flows related to servicing activities.
Variable Interest Entities (VIEs)
The firm, in the ordinary course of business, retains interests
in VIEs in connection with its securitization activities. The firm
also purchases and sells variable interests in VIEs, which primarily
issue mortgage-backed and other asset-backed securities, CDOs
and CLOs, in connection with its market-making activities and
makes investments in and loans to VIEs that hold performing
and nonperforming debt, equity, real estate, power-related
and other assets. In addition, the firm utilizes VIEs to provide
investors with principal-protected notes, credit-linked notes
and asset-repackaged notes designed to meet their objectives.
106 Goldman Sachs 2007 Annual Report
Notes to Consolidated Financial Statements
These tables do not give effect to the benefit of any offsetting financial instruments that are held to mitigate risks related to the
firm’s interests in nonconsolidated VIEs.
	 As of November 2007
	 Maximum Exposure to Loss in Nonconsolidated VIEs (1)

		 Purchased
		 and Retained	 Commitments		 Loans and	
(in millions)	 VIE Assets	 Interests	 and Guarantees	 Derivatives	 Investments	Total
Mortgage CDOs (2)
	 $18,914	 $1,011	 $    —	 $10,089	 $    —	 $11,100
Corporate CDOs and CLOs (3)
	 10,750	 411	—	2,218	—	2,629
Real estate, credit-related
  and other investing (4)
	 17,272	—	107	12	3,141	3,260
Municipal bond securitizations	 1,413	—	1,413	—	—	1,413
Other mortgage-backed	 3,881	719	—	—	—	719
Other asset-backed	 3,771	—	—	1,579	—	1,579
Power-related	 438	2	37	—	16	 55
Principal-protected notes (5)
	 5,698	—	—	 5,186	—	 5,186
Total	 $62,137	 $2,143	 $1,557	 $19,084	 $3,157	 $25,941
	 As of November 2006
	 Maximum Exposure to Loss in Nonconsolidated VIEs (1)

		 Purchased
		 and Retained	 Commitments		 Loans and	
(in millions)	 VIE Assets	 Interests	 and Guarantees	 Derivatives	 Investments	 Total
Mortgage CDOs (2)
	 $26,225	 $2,172	 $    —	 $  7,119	 $    —	 $  9,291
Corporate CDOs and CLOs (3)
	 11,385	 234	 —	 2,663	 —	 2,897
Real estate, credit-related
  and other investing (4)
	 16,300	 —	 113	 8	 2,088	 2,209
Municipal bond securitizations	 1,182	 —	 1,182	 —	 —	 1,182
Other mortgage-backed	 8,143	 477	 —	 —	 —	 477
Other asset-backed	 96	 —	 —	 66	 —	 66
Power-related	 3,422	 10	 73	 —	 597	 680
Principal-protected notes (5)
	 4,363	 —	 —	 3,437	 —	 3,437
Total	 $71,116	 $2,893	 $1,368	 $13,293	 $2,685	 $20,239
(1)	Such amounts do not represent the anticipated losses in connection with these transactions.
(2)	Derivatives related to mortgage CDOs primarily consist of written protection on investment-grade, short-term collateral held by VIEs that have issued CDOs.
(3)	Derivatives related to corporate CDOs and CLOs primarily consist of total return swaps on CDOs and CLOs. The firm has generally transferred the risks related to the
underlying securities through derivatives with non-VIEs.
(4)	The firm obtains interests in these VIEs in connection with making proprietary investments in real estate, distressed loans and other types of debt, mezzanine instruments
and equities.
(5)	Derivatives related to principal-protected notes consist of out-of-the-money written put options that provide principal protection to clients invested in various fund
products, with risk to the firm mitigated through portfolio rebalancing.
107Goldman Sachs 2007 Annual Report
Notes to Consolidated Financial Statements
November 2006, respectively. Financial instruments owned
and pledged in connection with repurchase agreements, securities
lending agreements and other secured financings to counterparties
that did not have the right to sell or repledge are included in
“Financial instruments owned, at fair value” in the consolidated
statements of financial condition and were $156.92 billion and
$134.31 billion as of November 2007 and November 2006,
respectively. Other assets (primarily real estate and cash) owned
and pledged in connection with other secured financings to
counterparties that did not have the right to sell or repledge
were $5.86 billion and $5.34 billion as of November 2007 and
November 2006, respectively.
In addition to repurchase agreements and securities lending
agreements, the firm obtains secured funding through the use
of other arrangements. Other secured financings include
arrangements that are nonrecourse, that is, only the subsidiary
that executed the arrangement or a subsidiary guaranteeing the
arrangement is obligated to repay the financing. Other secured
financings consist of liabilities related to the firm’s William
Street program, consolidated variable interest entities,
collateralized central bank financings, transfers of financial
assets that are accounted for as financings rather than sales
under SFAS No. 140 (primarily pledged bank loans and mortgage
whole loans) and other structured financing arrangements.
Collateralized Transactions
The firm receives financial instruments as collateral, primarily
in connection with resale agreements, securities borrowed,
derivative transactions and customer margin loans. Such financial
instruments may include obligations of the U.S. government,
federal agencies, sovereigns and corporations, as well as equities
and convertibles.
In many cases, the firm is permitted to deliver or repledge these
financial instruments in connection with entering into repurchase
agreements, securities lending agreements and other secured
financings, collateralizing derivative transactions and meeting
firm or customer settlement requirements. As of November 2007
and November 2006, the fair value of financial instruments
received as collateral by the firm that it was permitted to deliver
or repledge was $891.05 billion and $746.08 billion, respectively,
of which the firm delivered or repledged $785.62 billion and
$639.87 billion, respectively.
The firm also pledges assets that it owns to counterparties who
may or may not have the right to deliver or repledge them.
Financial instruments owned and pledged to counterparties
that have the right to deliver or repledge are reported as “Financial
instruments owned and pledged as collateral, at fair value” in
the consolidated statements of financial condition and were
$46.14 billion and $36.00 billion as of November 2007 and
The following table sets forth the firm’s total assets and maximum exposure to loss associated with its significant variable interests
in consolidated VIEs where the firm does not hold a majority voting interest. The firm has aggregated consolidated VIEs based
on principal business activity, as reflected in the first column.
The table does not give effect to the benefit of any offsetting financial instruments that are held to mitigate risks related to the
firm’s interests in consolidated VIEs.
	 As of November
	 2007	 	 2006
		 		 Maximum 		 Maximum
				 Exposure		 Exposure
(in millions)			 VIE Assets (1)
	 to Loss (2)
	 VIE Assets (1)
	 to Loss (2)
Real estate, credit-related and other investing			 $2,118	 $  525	 $3,077	 $1,368
Municipal bond securitizations			 1,959	1,959	 2,715	 2,715
CDOs, mortgage-backed and other asset-backed		 604	109	 1,537	 20
Foreign exchange and commodities			 300	329	 433	 340
Principal-protected notes			 1,119	1,118	 894	 774
Total			 $6,100	 $4,040	 $8,656	 $5,217
(1)	Consolidated VIE assets include assets financed on a nonrecourse basis.
(2)	Such amounts do not represent the anticipated losses in connection with these transactions.
108 Goldman Sachs 2007 Annual Report
Notes to Consolidated Financial Statements
Other secured financings are set forth in the table below:
	 As of November
(in millions)					 2007	 2006
Other secured financings (short-term) (1) (2)
					 $32,410	 $24,290
Other secured financings (long-term):
  2008					 —	 5,535
  2009					 2,903	 877
  2010					 2,301	 1,894
  2011					 2,427	 5,105
  2012					 4,973	 1,928
  2013 – thereafter					 20,696	 10,795
  Total other secured financings (long-term) (3) (4)
				 33,300	 26,134
Total other secured financings (5)
					 $65,710	 $50,424
(1)	As of November 2007, consists of U.S. dollar-denominated financings of $18.47 billion with a weighted average interest rate of 5.32% and non-U.S. dollar-denominated
financings of $13.94 billion with a weighted average interest rate of 0.91%, after giving effect to hedging activities. As of November 2006, consists of U.S. dollar-
denominated financings of $14.28 billion with a weighted average interest rate of 5.22% and non-U.S. dollar-denominated financings of $10.01 billion with a weighted
average interest rate of 2.00%, after giving effect to hedging activities. The weighted average interest rates as of November 2007 and November 2006 excluded
financial instruments accounted for at fair value under SFAS No. 155 or SFAS No. 159.
(2)	Includes other secured financings maturing within one year of the financial statement date and other secured financings that are redeemable within one year of the
financial statement date at the option of the holder.
(3)	As of November 2007, consists of U.S. dollar-denominated financings of $22.13 billion with a weighted average interest rate of 5.73% and non-U.S. dollar-denominated
financings of $11.17 billion with a weighted average interest rate of 4.28%, after giving effect to hedging activities. As of November 2006, consists of U.S. dollar-
denominated financings of $16.97 billion with a weighted average interest rate of 5.61% and non-U.S. dollar-denominated financings of $9.16 billion with a weighted
average interest rate of 3.81%, after giving effect to hedging activities.
(4)	Secured long-term financings that are repayable prior to maturity at the option of the firm are reflected at their contractual maturity dates. Secured long-term financings
that are redeemable prior to maturity at the option of the holder are reflected at the dates such options become exercisable.
(5)	As of November 2007, $61.34 billion of these financings were collateralized by financial instruments and $4.37 billion by other assets (primarily real estate and cash).
As of November 2006, $47.22 billion of these financings were collateralized by financial instruments and $3.20 billion by other assets. Other secured financings include
$25.37 billion and $19.79 billion of nonrecourse obligations as of November 2007 and November 2006, respectively.
109Goldman Sachs 2007 Annual Report
Notes to Consolidated Financial Statements
Note 4
Unsecured Short-Term Borrowings
The firm obtains unsecured short-term borrowings primarily
through the issuance of promissory notes, commercial paper
and hybrid financial instruments. As of November 2007 and
November 2006, these borrowings were $71.56 billion and
$47.90 billion, respectively. Such amounts include the portion
of unsecured long-term borrowings maturing within one year
of the financial statement date and unsecured long-term
borrowings that are redeemable within one year of the
Unsecured short-term borrowings are set forth below:
	 As of November
(in millions)					 2007	 2006
Promissory notes					 $13,251	 $13,811
Commercial paper					 4,343	 1,489
Current portion of unsecured long-term borrowings				 22,740	 14,115
Hybrid financial instruments 					 22,318	 14,060
Other short-term borrowings					 8,905	 4,429
Total (1)
					 $71,557	 $47,904
(1)	The weighted average interest rates for these borrowings, after giving effect to hedging activities, were 5.05% and 5.16% as of November 2007 and November 2006,
respectively. The weighted average interest rates as of November 2007 and November 2006 excluded financial instruments accounted for at fair value under SFAS
No. 155 or SFAS No. 159.
financial statement date at the option of the holder. The firm
accounts for promissory notes, commercial paper and certain
hybrid financial instruments at fair value under SFAS No. 155
or SFAS No. 159. Short-term borrowings that are not recorded
at fair value are recorded based on the amount of cash received
plus accrued interest, and such amounts approximate fair value
due to the short-term nature of the obligations.
110 Goldman Sachs 2007 Annual Report
Notes to Consolidated Financial Statements
Note 5
Unsecured Long-Term Borrowings
The firm’s unsecured long-term borrowings extend through 2043 and consist principally of senior borrowings. As of November 2007
and November 2006, these borrowings were $164.17 billion and $122.84 billion, respectively.
Unsecured long-term borrowings are set forth below:
	 As of November
(in millions)					 2007	 2006
Fixed rate obligations (1)
  U.S. dollar					 $  55,281	 $  41,719
  Non-U.S. dollar					 29,139	 22,854
Floating rate obligations (2)
  U.S. dollar					 47,308	 38,342
  Non-U.S. dollar					 32,446	 19,927
Total 					 $164,174	 $122,842
(1)	As of November 2007 and November 2006, interest rates on U.S. dollar fixed rate obligations ranged from 3.88% to 10.04% and from 3.88% to 12.00%, respectively.
As of November 2007 and November 2006, interest rates on non-U.S. dollar fixed rate obligations ranged from 0.67% to 8.88% and from 0.31% to 8.88%, respectively.
(2)	Floating interest rates generally are based on LIBOR or the federal funds target rate. Equity-linked and indexed instruments are included in floating rate obligations.
Unsecured long-term borrowings by maturity date are set forth below:
	 As of November
	 2007 (1) (2)
	 	 2006(1) (2)
	 U.S.	 Non-U.S. 		 U.S.	 Non-U.S.
(in millions)	 Dollar	 Dollar	Total	 Dollar	 Dollar	 Total
2008	 $      —	 $     —	 $      —	 $14,848	 $  3,038	 $  17,886
2009	 20,204	2,978	23,182	 12,398	 2,978	 15,376
2010	 7,989	 5,714	13,703	 5,034	 4,945	 9,979
2011	 5,848	 4,839	10,687	 5,675	 4,389	 10,064
2012	 14,913	3,695	18,608	 4,500	 2,098	 6,598
2013-thereafter	 53,635	 44,359	 97,994	 37,606	 25,333	 62,939
Total	 $102,589	 $61,585	 $164,174	 $80,061	 $42,781	 $122,842
(1)	Unsecured long-term borrowings maturing within one year of the financial statement date and certain unsecured long-term borrowings that are redeemable within one
year of the financial statement date at the option of the holder are included as unsecured short-term borrowings in the consolidated statements of financial condition.
(2)	Unsecured long-term borrowings that are repayable prior to maturity at the option of the firm are reflected at their contractual maturity dates. Unsecured long-term
borrowings that are redeemable prior to maturity at the option of the holder are reflected at the dates such options become exercisable.
The firm enters into derivative contracts, such as interest rate
futures contracts, interest rate swap agreements, currency swap
agreements, commodity contracts and equity-linked and
indexed contracts, to effectively convert a substantial portion
of its unsecured long-term borrowings into U.S. dollar-based
floating rate obligations. Accordingly, the carrying value of
unsecured long-term borrowings approximated fair value as of
November 2007 and November 2006.
111Goldman Sachs 2007 Annual Report
Notes to Consolidated Financial Statements
pay dividends on or make certain repurchases of its common
stock. The Trust is not permitted to pay any distributions on
the common beneficial interests held by the firm unless all
dividends payable on the preferred beneficial interests have
been paid in full. These debentures are junior in right of payment
to all of the firm’s senior indebtedness and all of the firm’s
subordinated borrowings, other than the junior subordinated
debt issued in connection with the Normal Automatic Preferred
Enhanced Capital Securities (see discussion below).
Junior Subordinated Debt Issued to Trusts in Connection
with Fixed-to-Floating and Floating Rate Normal
Automatic Preferred Enhanced Capital Securities. In the
second quarter of 2007, the firm issued a total of $2.25 billion
of remarketable junior subordinated notes to Goldman Sachs
Capital II and Goldman Sachs Capital III (the Trusts), Delaware
statutory trusts that, in turn, issued $2.25 billion of guaranteed
perpetual Automatic Preferred Enhanced Capital Securities
(APEX) to third parties and a de minimis amount of common
securities to the firm. The firm also entered into contracts with
the Trusts to sell $2.25 billion of perpetual non-cumulative
preferred stock to be issued by the firm (the stock purchase
contracts). The Trusts are wholly owned finance subsidiaries
of the firm for regulatory and legal purposes but are not
consolidated for accounting purposes.
The firm pays interest semiannually on $1.75 billion of junior
subordinated notes issued to Goldman Sachs Capital II at a fixed
annual rate of 5.59% and the notes mature on June 1, 2043.
The firm pays interest quarterly on $500 million of junior
subordinated notes issued to Goldman Sachs Capital III at a
rate per annum equal to three-month LIBOR plus .57% and
the notes mature on September 1, 2043. In addition, the firm
makes contract payments at a rate of .20% per annum on the
stock purchase contracts held by the Trusts. The firm has the
right to defer payments on the junior subordinated notes and
the stock purchase contracts, subject to limitations, and therefore
Subordinated Borrowings
Unsecured long-term borrowings include subordinated borrowings
with outstanding principal amounts of $16.32 billion and
$7.51 billion as of November 2007 and November 2006,
respectively, as set forth below.
Subordinated Notes. As of November 2007, the firm had
$11.23 billion of subordinated notes outstanding with maturities
ranging from fiscal 2009 to 2037. The effective weighted
average interest rate on these subordinated notes was 5.75%,
after giving effect to derivative contracts used to convert fixed rate
obligations into floating rate obligations. As of November 2006,
the firm had $4.67 billion of subordinated notes outstanding with
maturities ranging from 2007 to 2036 and with an effective
weighted average interest rate of 6.24%. These notes are junior
in right of payment to all of the firm’s senior indebtedness.
Junior Subordinated Debt Issued to a Trust in Connection
with Trust Preferred Securities. The firm issued $2.84 billion
of junior subordinated debentures in its first quarter of 2004
to Goldman Sachs Capital I (the Trust), a Delaware statutory
trust that, in turn, issued $2.75 billion of guaranteed preferred
beneficial interests to third parties and $85 million of common
beneficial interests to the firm and invested the proceeds from
the sale in junior subordinated debentures issued by the firm.
The Trust is a wholly owned finance subsidiary of the firm
for regulatory and legal purposes but is not consolidated for
accounting purposes.
The firm pays interest semiannually on these debentures at
an annual rate of 6.345% and the debentures mature on
February 15, 2034. The coupon rate and the payment dates
applicable to the beneficial interests are the same as the interest
rate and payment dates applicable to the debentures. The firm
has the right, from time to time, to defer payment of interest
on the debentures, and, therefore, cause payment on the Trust’s
preferred beneficial interests to be deferred, in each case up to
ten consecutive semiannual periods. During any such extension
period, the firm will not be permitted to, among other things,
The effective weighted average interest rates for unsecured long-term borrowings are set forth below:
	 As of November
	 2007	 	 2006
($ in millions)			 Amount	 Rate	 Amount	 Rate
Fixed rate obligations			 $  3,787	 5.28%	 $   1,997	 6.13%
Floating rate obligations (1) (2)
			 160,387	 5.68	 120,845	 5.75
Total			 $164,174	 5.67	 $122,842	 5.75
(1)	Includes fixed rate obligations that have been converted into floating rate obligations through derivative contracts.
(2)	The weighted average interest rates as of November 2007 and November 2006 excluded financial instruments accounted for at fair value under SFAS No. 155 or
SFAS No. 159.
112 Goldman Sachs 2007 Annual Report
Notes to Consolidated Financial Statements
Note 6
Commitments, Contingencies
and Guarantees
Commitments
Forward Starting Collateralized Agreements and
Financings. The firm had forward starting resale agreements
and securities borrowing agreements of $28.14 billion and
$18.29 billion as of November 2007 and November 2006,
respectively. The firm had forward starting repurchase
agreements and securities lending agreements of $15.39 billion
and $17.15 billion as of November 2007 and November 2006,
respectively.
Commitments to Extend Credit. In connection with its
lending activities, the firm had outstanding commitments to
extend credit of $82.75 billion and $100.48 billion as of
November 2007 and November 2006, respectively. The firm’s
commitments to extend credit are agreements to lend to counter-
parties that have fixed termination dates and are contingent on
the satisfaction of all conditions to borrowing set forth in the
contract. Since these commitments may expire unused or be
reduced or cancelled at the counterparty’s request, the total
commitment amount does not necessarily reflect the actual future
cash flow requirements. The firm accounts for these commitments
at fair value. To the extent that the firm recognizes losses on
these commitments, such losses are recorded within the firm’s
Trading and Principal Investments segment net of any related
underwriting fees.
short-term in nature, as borrowers often seek to replace them
with other funding sources. Included within the non-investment-
grade amount as of November 2007 was $26.09 billion of
exposure to leveraged lending capital market transactions,
$3.50 billion related to commercial real estate transactions
and $12.34 billion arising from other unfunded credit
facilities. Included within the non-investment-grade amount
as of November 2006 was $39.68 billion of exposure to
leveraged lending capital market transactions, $12.11 billion
related to commercial real estate transactions and $5.23 billion
arising from other unfunded credit facilities.
The following table summarizes the firm’s commitments to extend credit as of November 2007 and November 2006:
	 Year Ended November
(in millions)					 2007	 2006
Commercial lending commitments
  Investment-grade					 $11,719	 $   7,604
  Non-investment-grade					 41,930	 57,017
William Street program					 24,488	 18,831
Warehouse financing					 4,610	 17,026
Total commitments to extend credit					 $82,747	 $100,478
cause payment on the APEX to be deferred. During any such
extension period, the firm will not be permitted to, among
other things, pay dividends on or make certain repurchases of
its common or preferred stock. The junior subordinated notes are
junior in right of payment to all of the firm’s senior indebtedness
and all of the firm’s other subordinated borrowings.
In connection with the APEX issuance, the firm covenanted in
favor of certain of its debtholders, who are initially the holders
of the firm’s 6.345% Junior Subordinated Debentures due
February 15, 2034, that, subject to certain exceptions, the firm
would not redeem or purchase (i) the firm’s junior subordinated
debt issued to the APEX trusts prior to the applicable stock
purchase date or (ii) APEX or shares of the firm’s Series E or
Series F Preferred Stock prior to the date that is ten years after
the applicable stock purchase date, unless the applicable
redemption or purchase price does not exceed a maximum
amount determined by reference to the aggregate amount of
net cash proceeds that the firm has received from the sale of
qualifying equity securities during the 180 day period preceding
the redemption or purchase.
The firm has accounted for the stock purchase contracts as
equity instruments under EITF Issue No. 00-19, “Accounting
for Derivative Financial Instruments Indexed to, and Potentially
Settled in, a Company’s Own Stock,” and, accordingly, recorded
the cost of the stock purchase contracts as a reduction to
additional paid-in capital. See Note 7 for information on the
preferred stock that the firm will issue in connection with the
stock purchase contracts.
■	 Commercial lending commitments.  The firm extends
commercial lending commitments primarily in connection
with contingent acquisition financing and other types of
corporate lending as well as commercial real estate financing.
The total commitment amount does not necessarily reflect
the actual future cash flow requirements, as the firm often
syndicates all or substantial portions of these commitments,
the commitments may expire unused, or the commitments
may be cancelled or reduced at the request of the counter-
party. In addition, commitments that are extended for
contingent acquisition financing are often intended to be
113Goldman Sachs 2007 Annual Report
Notes to Consolidated Financial Statements
Letters of Credit. The firm provides letters of credit issued
by various banks to counterparties in lieu of securities or cash
to satisfy various collateral and margin deposit requirements.
Letters of credit outstanding were $8.75 billion and $5.73 billion
as of November 2007 and November 2006, respectively.
Investment Commitments. In connection with its merchant
banking and other investing activities, the firm invests in private
equity, real estate and other assets directly and through funds
that it raises and manages. In connection with these activities,
the firm had commitments to invest up to $17.76 billion and
$8.24 billion as of November 2007 and November 2006,
respectively, including $12.32 billion and $4.41 billion, respectively,
of commitments to invest in funds managed by the firm.
Construction-Related Commitments. As of November 2007
and November 2006, the firm had construction-related
commitments of $769 million and $1.63 billion, respectively,
including outstanding commitments of $642 million and
$500 million as of November 2007 and November 2006,
respectively, related to the firm’s new world headquarters in
New York City, which is expected to cost between $2.3 billion
and $2.5 billion. The firm is partially financing this construction
project with tax-exempt Liberty Bonds. The firm borrowed
approximately $1.40 billion and approximately $250 million
in 2005 and 2007, respectively, through the issuance of
Liberty Bonds.
Underwriting Commitments.  As of November 2007 and
November 2006, the firm had commitments to purchase
$88 million and $2.62 billion, respectively, of securities in
connection with its underwriting activities.
Other. The firm had other purchase commitments of $420 million
and $393 million as of November 2007 and November 2006,
respectively.
In addition, the firm entered into an agreement in 2007 to
acquire Litton Loan Servicing LP (Litton), the mortgage servicing
unit of Credit-Based Asset Servicing and Securitization LLC
(C-BASS). The transaction closed in December 2007 at a purchase
price of $428 million, plus the repayment of $916 million of
outstanding Litton debt obligations.
■	 William Street program.  Substantially all of the
commitments provided under the William Street credit
extension program are to investment-grade corporate
borrowers. Commitments under the program are extended
by William Street Commitment Corporation (Commitment
Corp.), a consolidated wholly owned subsidiary of Group Inc.
whose assets and liabilities are legally separated from
other assets and liabilities of the firm, William Street Credit
Corporation, GS Bank USA, Goldman Sachs Credit
Partners L.P. or other consolidated wholly owned subsidiaries
of Group Inc. The commitments extended by Commitment
Corp. are supported, in part, by funding raised by William
Street Funding Corporation (Funding Corp.), another
consolidated wholly owned subsidiary of Group Inc. whose
assets and liabilities are also legally separated from other
assets and liabilities of the firm. The assets of Commitment
Corp. and of Funding Corp. will not be available to their
respective shareholders until the claims of their respective
creditors have been paid. In addition, no affiliate of either
Commitment Corp. or Funding Corp., except in limited cases
as expressly agreed in writing, is responsible for any
obligation of either entity. With respect to most of the William
Street commitments, Sumitomo Mitsui Financial Group, Inc.
(SMFG) provides the firm with credit loss protection that is
generally limited to 95% of the first loss the firm realizes on
approved loan commitments, up to a maximum of $1.00 billion.
In addition, subject to the satisfaction of certain conditions,
upon the firm’s request, SMFG will provide protection for
70% of the second loss on such commitments, up to a
maximum of $1.13 billion. The firm also uses other financial
instruments to mitigate credit risks related to certain William
Street commitments not covered by SMFG.
■ 	Warehouse financing. The firm provides financing for the
warehousing of financial assets to be securitized. These
financings are expected to be repaid from the proceeds of
the related securitizations for which the firm may or may not
act as underwriter. These arrangements are secured by the
warehoused assets, primarily consisting of corporate bank
loans and commercial mortgages as of November 2007
and residential mortgages and mortgage-backed securities,
corporate bank loans and commercial mortgages as of
November 2006. In connection with its warehouse financing
activities, the firm had loans of $44 million collateralized by
subprime mortgages as of November 2007.
114 Goldman Sachs 2007 Annual Report
Notes to Consolidated Financial Statements
In connection with its insurance business, the firm is contingently
liable to provide guaranteed minimum death and income benefits
to certain contract holders and has established a reserve related
to $10.84 billion and $8.04 billion of contract holder account
balances as of November 2007 and November 2006, respectively,
for such benefits. The weighted average attained age of these
contract holders was 67 years and 70 years as of November 2007
and November 2006, respectively. The net amount at risk,
representing guaranteed minimum death and income benefits
in excess of contract holder account balances, was $1.04 billion
and $1.27 billion as of November 2007 and November 2006,
respectively. See Note 10 for more information on the firm’s
insurance liabilities.
Guarantees
The firm enters into various derivative contracts that meet the
definition of a guarantee under FIN No. 45, “Guarantor’s
Accounting and Disclosure Requirements for Guarantees,
Including Indirect Guarantees of Indebtedness of Others.” Such
derivative contracts include credit default and total return
swaps, written equity and commodity put options, written
currency contracts and interest rate caps, floors and swaptions.
FIN No. 45 does not require disclosures about derivative
contracts if such contracts may be cash settled and the firm has
no basis to conclude it is probable that the counterparties held,
at inception, the underlying instruments related to the derivative
contracts. The firm has concluded that these conditions have
been met for certain large, internationally active commercial
and investment bank end users and certain other users.
Accordingly, the firm has not included such contracts in the
tables below.
The firm, in its capacity as an agency lender, indemnifies most
of its securities lending customers against losses incurred in the
event that borrowers do not return securities and the collateral
held is insufficient to cover the market value of the securities
borrowed.
In the ordinary course of business, the firm provides other
financial guarantees of the obligations of third parties
(e.g., performance bonds, standby letters of credit and other
guarantees to enable clients to complete transactions and
merchant banking fund-related guarantees). These guarantees
represent obligations to make payments to beneficiaries if the
guaranteed party fails to fulfill its obligation under a contractual
arrangement with that beneficiary.
Leases. The firm has contractual obligations under long-term
noncancelable lease agreements, principally for office space,
expiring on various dates through 2069. Certain agreements
are subject to periodic escalation provisions for increases in
real estate taxes and other charges. Future minimum rental
payments, net of minimum sublease rentals are set forth below:
(in millions)
Minimum rental payments
  2008		 $   450
  2009		 478
  2010		 372
  2011		 313
  2012		 255
  2013 – thereafter		 2,022
Total		 $3,890
Rent charged to operating expense is set forth below:
(in millions)
Net rent expense
  2005		 $359
  2006		 404
  2007		 412
Contingencies
The firm is involved in a number of judicial, regulatory and
arbitration proceedings concerning matters arising in connection
with the conduct of its businesses. Management believes, based
on currently available information, that the results of such
proceedings, in the aggregate, will not have a material adverse
effect on the firm’s financial condition, but may be material to
the firm’s operating results for any particular period, depending,
in part, upon the operating results for such period. Given the
inherent difficulty of predicting the outcome of the firm’s litigation
and regulatory matters, particularly in cases or proceedings in
which substantial or indeterminate damages or fines are sought,
the firm cannot estimate losses or ranges of losses for cases or
proceedings where there is only a reasonable possibility that a
loss may be incurred.
115Goldman Sachs 2007 Annual Report
Notes to Consolidated Financial Statements
In the ordinary course of business, the firm indemnifies and
guarantees certain service providers, such as clearing and custody
agents, trustees and administrators, against specified potential
losses in connection with their acting as an agent of, or providing
services to, the firm or its affiliates. The firm also indemnifies
some clients against potential losses incurred in the event specified
third-party service providers, including sub-custodians and
third-party brokers, improperly execute transactions. In addition,
the firm is a member of payment, clearing and settlement networks
as well as securities exchanges around the world that may require
the firm to meet the obligations of such networks and exchanges
in the event of member defaults. In connection with its prime
brokerage and clearing businesses, the firm agrees to clear and
settle on behalf of its clients the transactions entered into by
them with other brokerage firms. The firm’s obligations in
respect of such transactions are secured by the assets in the
client’s account as well as any proceeds received from the
transactions cleared and settled by the firm on behalf of the
client. In connection with joint venture investments, the firm
The firm has established trusts, including Goldman Sachs
Capital I, II and III, and other entities for the limited purpose of
issuing securities to third parties, lending the proceeds to the firm
and entering into contractual arrangements with the firm and
third parties related to this purpose. (See Note 5 for information
regarding the transactions involving Goldman Sachs Capital I,
II and III.) The firm effectively provides for the full and
unconditional guarantee of the securities issued by these entities,
which are not consolidated for accounting purposes. Timely
payment by the firm of amounts due to these entities under the
borrowing, preferred stock and related contractual arrangements
will be sufficient to cover payments due on the securities issued
by these entities. Management believes that it is unlikely that any
circumstances will occur, such as nonperformance on the part
of paying agents or other service providers, that would make
it necessary for the firm to make payments related to these entities
other than those required under the terms of the borrowing,
preferred stock and related contractual arrangements and in
connection with certain expenses incurred by these entities.
The following tables set forth certain information about the firm’s derivative contracts that meet the definition of a guarantee
and certain other guarantees as of November 2007 and November 2006:
	 As of November 2007
	 Maximum Payout/Notional Amount by Period of Expiration (1)
(in millions)		 2008	2009 – 2010	2011– 2012	2013 – Thereafter	Total
Derivatives (2)
		 $580,769	 $492,563	 $457,511	 $514,498	 $2,045,341
Securities lending indemnifications (3)
		 26,673	—	—	—	26,673
Performance bonds (4)
		 2,046	—	—	—	2,046
Other financial guarantees (5)
		 381	121	258	 46	 806
	 As of November 2006
	 Maximum Payout/Notional Amount by Period of Expiration (1)
(in millions)		 2007	 2008 – 2009	 2010 – 2011	 2012– Thereafter	 Total
Derivatives (2)
		 $379,256	 $428,258	 $460,088	 $399,449	 $1,667,051
Securities lending indemnifications (3)
		 19,023	 —	 —	 —	 19,023
Performance bonds		 —	 —	 —	 —	 —
Other financial guarantees (5)
		 592	 99	 76	 86	 853
(1)	Such amounts do not represent the anticipated losses in connection with these contracts.
(2)	The aggregate carrying value of these derivatives as of November 2007 was a liability of $33.10 billion. The aggregate carrying value of these derivatives as of November 2006
was an asset of $1.12 billion, consisting of contracts with an asset value of $11.06 billion and contracts with a liability value of $9.94 billion. The carrying value excludes
the effect of a legal right of setoff that may exist under an enforceable netting agreement. These derivative contracts are risk managed together with derivative contracts
that are not considered guarantees under FIN No. 45, and therefore, these amounts do not reflect the firm’s overall risk related to its derivative activities.
(3)	Collateral held by the lenders in connection with securities lending indemnifications was $27.49 billion and $19.70 billion as of November 2007 and November 2006,
respectively.
(4)	Excludes collateral of $2.05 billion related to these obligations.
(5)	The carrying value of these guarantees was a liability of $43 million and $15 million as of November 2007 and November 2006, respectively.
116 Goldman Sachs 2007 Annual Report
Notes to Consolidated Financial Statements
Note 7
Shareholders’ Equity
Dividends declared per common share were $1.40 in 2007,
$1.30 in 2006, and $1.00 in 2005. On December 17, 2007, the
Board of Directors of Group Inc. (the Board) declared a dividend
of $0.35 per common share to be paid on February 28, 2008,
to common shareholders of record on January 29, 2008.
During 2007 and 2006, the firm repurchased 41.2 million
and 50.2 million shares of its common stock at a total cost of
$8.96 billion and $7.82 billion, respectively. The average price
paid per share for repurchased shares was $217.29 and $155.64
for the years ended November 2007 and November 2006,
respectively. In addition, to satisfy minimum statutory employee
tax withholding requirements related to the delivery of
common stock underlying restricted stock units, the firm
cancelled 4.7 million and 3.0 million of restricted stock units
with a total value of $929 million and $375 million in 2007
and 2006, respectively.
The firm’s share repurchase program is intended to help maintain
the appropriate level of common equity and to substantially
offset increases in share count over time resulting from
employee share-based compensation. The repurchase program
is effected primarily through regular open-market purchases,
the amounts and timing of which are determined primarily
by the firm’s current and projected capital positions (i.e.,
comparisons of the firm’s desired level of capital to its actual
level of capital) but which may also be influenced by general
market conditions and the prevailing price and trading volumes
of the firm’s common stock.
may issue loan guarantees under which it may be liable in
the event of fraud, misappropriation, environmental liabilities
and certain other matters involving the borrower. The firm is
unable to develop an estimate of the maximum payout under
these guarantees and indemnifications. However, management
believes that it is unlikely the firm will have to make any material
payments under these arrangements, and no liabilities related
to these guarantees and indemnifications have been recognized
in the consolidated statements of financial condition as of
November 2007 and November 2006.
The firm provides representations and warranties to counter-
parties in connection with a variety of commercial transactions
and occasionally indemnifies them against potential losses
caused by the breach of those representations and warranties.
The firm may also provide indemnifications protecting against
changes in or adverse application of certain U.S. tax laws in
connection with ordinary-course transactions such as securities
issuances, borrowings or derivatives. In addition, the firm may
provide indemnifications to some counterparties to protect
them in the event additional taxes are owed or payments are
withheld, due either to a change in or an adverse application
of certain non-U.S. tax laws. These indemnifications generally
are standard contractual terms and are entered into in the
ordinary course of business. Generally, there are no stated or
notional amounts included in these indemnifications, and the
contingencies triggering the obligation to indemnify are not
expected to occur. The firm is unable to develop an estimate of the
maximum payout under these guarantees and indemnifications.
However, management believes that it is unlikely the firm will have
to make any material payments under these arrangements, and
no liabilities related to these arrangements have been recognized
in the consolidated statements of financial condition as of
November 2007 and November 2006.
As of November 2007, the firm had 124,000 shares of perpetual non-cumulative preferred stock issued and outstanding in four
series as set forth in the following table:
	 Shares	 Shares			 Earliest	 Redemption Value	
Series	 Issued	 Authorized	 Dividend Rate	 Redemption Date	 (in millions)
A	30,000	 50,000	3 month LIBOR + 0.75%, with floor of 3.75% per annum	 April 25, 2010	 $  750
B	32,000	 50,000 	 6.20% per annum	 October 31, 2010	 800
C	 8,000	25,000 	3 month LIBOR + 0.75%, with floor of 4% per annum	 October 31, 2010	200
D	 54,000	 60,000	3 month LIBOR + 0.67%, with floor of 4% per annum	 May 24, 2011	1,350
	124,000	185,000	
		
	 $3,100
117Goldman Sachs 2007 Annual Report
Notes to Consolidated Financial Statements
declared, will be payable semiannually at a fixed annual rate of
5.79% if the stock is issued prior to June 1, 2012 and quarterly
thereafter, at a rate per annum equal to the greater of (i) three-
month LIBOR plus .77% and (ii) 4%. Dividends on Series F
preferred stock, if declared, will be payable quarterly at a rate
per annum equal to three-month LIBOR plus .77% if the stock
is issued prior to September 1, 2012 and quarterly thereafter,
at a rate per annum equal to the greater of (i) three-month
LIBOR plus .77% and (ii) 4%. The preferred stock may be
redeemed at the option of the firm on the stock purchase dates
or any day thereafter, subject to the approval of the Securities
and Exchange Commission (SEC) and certain covenant
restrictions governing the firm’s ability to redeem or purchase
the preferred stock without issuing common stock or other
instruments with equity-like characteristics.
Dividends declared per preferred share were $1,563.51,
$1,550.00, $1,563.51 and $1,543.06 for Series A, Series B,
Series C and Series D preferred stock, respectively, in 2007.
Dividends declared per preferred share were $1,434.79,
$1,593.06, $1,465.19 and $709.10 for Series A, Series B,
Series C and Series D preferred stock, respectively, in 2006.
In addition, on December 17, 2007, the Board declared
dividends per preferred share of $351.84, $387.50, $351.84
and $346.84 for Series A, Series B, Series C and Series D
preferred stock, respectively, to be paid on February 11, 2008
to preferred shareholders of record on January 27, 2008.
Each share of preferred stock issued and outstanding has a par
value of $0.01, has a liquidation preference of $25,000, is
represented by 1,000 depositary shares and is redeemable at
the firm’s option at a redemption price equal to $25,000 plus
declared and unpaid dividends. Dividends on each series of
preferred stock, if declared, are payable quarterly in arrears.
The firm’s ability to declare or pay dividends on, or purchase,
redeem or otherwise acquire, its common stock is subject
to certain restrictions in the event that the firm fails to pay or
set aside full dividends on the preferred stock for the latest
completed dividend period. All series of preferred stock are
pari passu and have a preference over the firm’s common stock
upon liquidation.
In the second quarter of 2007, the Board authorized 17,500.1
shares of perpetual Non-Cumulative Preferred Stock, Series E
and 5,000.1 shares of perpetual Non-Cumulative Preferred
Stock, Series F in connection with the APEX issuance (see Note 5
for further information on the APEX issuance). Under the stock
purchase contracts, the firm will issue on the relevant stock
purchase dates (on or before June 1, 2013 and September 1, 2013
for Series E and Series F preferred stock, respectively) one share
of Series E and Series F preferred stock to Goldman Sachs
Capital II and III, respectively, for each $100,000 principal
amount of subordinated notes held by these trusts. When
issued, each share of Series E and Series F preferred stock will
have a par value of $0.01 and a liquidation preference of
$100,000 per share. Dividends on Series E preferred stock, if
The following table sets forth the firm’s accumulated other comprehensive income/(loss) by type:
	 As of November
(in millions)					 2007	 2006
Adjustment from adoption of SFAS No. 158, net of tax				 $(194)	 $  —
Currency translation adjustment, net of tax					 68	 29
Minimum pension liability adjustment, net of tax				 —	 (38)
Net gains on cash flow hedges, net of tax					 —	 2
Net unrealized gains on available-for-sale securities, net of tax				 8 (1)
	 28
Total accumulated other comprehensive income, net of tax				 $(118)	 $ 21
(1)	Consists of net unrealized gains of $9 million on available-for-sale securities held by investees accounted for under the equity method and net unrealized losses of
$1 million on available-for-sale securities held by the firm’s insurance subsidiaries.
118 Goldman Sachs 2007 Annual Report
Notes to Consolidated Financial Statements
Note 8
Earnings Per Common Share
The computations of basic and diluted earnings per common share are set forth below:
	 Year Ended November
(in millions, except per share amounts)				 2007	 2006	 2005
Numerator for basic and diluted EPS — net earnings
  applicable to common shareholders				 $11,407	 $9,398	 $5,609
Denominator for basic EPS — weighted average
  number of common shares				 433.0	 449.0	 478.1
Effect of dilutive securities
  Restricted stock units				 13.6	 13.6	 9.9
  Stock options				 14.6	 14.8	 12.2
Dilutive potential common shares				 28.2	 28.4	 22.1
Denominator for diluted EPS — weighted average number of
  common shares and dilutive potential common shares (1)
			 461.2	 477.4	 500.2
Basic EPS				 $ 26.34	 $20.93	 $11.73
Diluted EPS				 24.73	 19.69	 11.21
(1)	The diluted EPS computations do not include the anti-dilutive effect of the following options:
	 Year Ended November
(in millions)				 2007	 2006	 2005
Number of anti-dilutive options, end of period				 —	 —	 1
Note 9
Goodwill and Identifiable Intangible Assets
Goodwill
The following table sets forth the carrying value of the firm’s goodwill by operating segment, which is included in “Other assets”
in the consolidated statements of financial condition:
	 As of November
(in millions)					 2007	 2006
Investment Banking
  Financial Advisory					 $    —	 $    —
  Underwriting					 125	 125
Trading and Principal Investments
  FICC					 123	 136
  Equities (1)
					 2,381	 2,381
  Principal Investments					 11	 4
Asset Management and Securities Services
  Asset Management (2)
					 564	 421
  Securities Services					 117	 117
Total					 $3,321	 $3,184
(1)	Primarily related to SLK LLC (SLK).
(2)	Primarily related to The Ayco Company, L.P. (Ayco). The increase in goodwill from November 2006 relates to the firm’s acquisition of Macquarie — IMM
Investment Management.
119Goldman Sachs 2007 Annual Report
Notes to Consolidated Financial Statements
The estimated future amortization for existing identifiable
intangible assets through 2012 is set forth below:
(in millions)
2008		 $186
2009		 164
2010		 149
2011		 140
2012		 131
Substantially all of the firm’s identifiable intangible assets are
considered to have finite lives and are amortized over their
estimated useful lives. The weighted average remaining life of
the firm’s identifiable intangibles is approximately 12 years.
Amortization expense associated with identifiable intangible
assets was $251 million, $246 million and $165 million for the years
ended November 2007, November 2006 and November 2005,
respectively. Amortization expense associated with the firm’s
consolidated power generation facilities is reported within “Cost
of power generation” in the consolidated statements of earnings.
Identifiable Intangible Assets
The following table sets forth the gross carrying amount, accumulated amortization and net carrying amount of the firm’s
identifiable intangible assets:
	 As of November
(in millions)					 2007	 2006
Customer lists (1)
	 Gross carrying amount	 $1,086	 $1,034
	 Accumulated amortization	 (354)	 (297)
	 Net carrying amount	 $  732	 $  737
New York Stock Exchange (NYSE) specialist rights	 Gross carrying amount	 $  714	 $  714
	 Accumulated amortization	 (212)	 (172)
	 Net carrying amount	 $  502	 $  542
Insurance-related assets (2)
	 Gross carrying amount	 $  461	 $  396
	 Accumulated amortization	 (89)	 (34)
	 Net carrying amount	 $  372	 $  362
Exchange-traded fund (ETF) specialist rights	 Gross carrying amount	 $  138	 $  138
	 Accumulated amortization	 (38)	 (33)
	 Net carrying amount	 $  100	 $  105
Power contracts (3)
	 Gross carrying amount	 $   33	 $  750
	 Accumulated amortization	 (13)	 (83)
	 Net carrying amount	 $   20	 $  667
Other (4)
	 Gross carrying amount	 $  327	 $  335
	 Accumulated amortization	 (282)	 (246)
	 Net carrying amount	 $    45	 $   89
Total	 Gross carrying amount	 $2,759	 $3,367
	 Accumulated amortization	 (988)	 (865)
	 Net carrying amount	 $1,771	 $2,502
(1)	Primarily includes the firm’s clearance and execution and NASDAQ customer lists related to SLK and financial counseling customer lists related to Ayco.
(2)	Consists of VOBA and DAC. VOBA represents the present value of estimated future gross profits of the variable annuity and life insurance business. DAC results from
commissions paid by the firm to the primary insurer (ceding company) on life and annuity reinsurance agreements as compensation to place the business with the firm and
to cover the ceding company’s acquisition expenses. VOBA and DAC are amortized over the estimated life of the underlying contracts based on estimated gross profits, and
amortization is adjusted based on actual experience. The weighted average remaining amortization period for VOBA and DAC is seven years as of November 2007.
(3)	The reduction in power contracts from November 2006 is due to the sale of the majority of the firm’s ownership interests in 14 power generation facilities during 2007.
(4)	Primarily includes marketing and technology-related assets.
120 Goldman Sachs 2007 Annual Report
Notes to Consolidated Financial Statements
Other Liabilities
The following table sets forth the firm’s other liabilities and
accrued expenses by type:
	 As of November
(in millions)	 2007	 2006
Compensation and benefits	 $11,816	 $  9,165
Insurance-related liabilities (1)
	 10,344	 11,471
Minority interest (2)
	 7,265	 2,069
Income tax-related liabilities	 2,546	 2,639
Employee interests in
  consolidated funds	 2,187	 2,690
Accrued expenses and
  other payables 	 4,749	 3,832
Total	 $38,907	 $31,866
(1)	Insurance-related liabilities are set forth in the table below:
	 As of November
(in millions)	 2007	 2006
Separate account liabilities	 $ 7,039	 $  7,957
Liabilities for future benefits
  and unpaid claims	 2,142	 2,123
Contract holder account balances	 937	 1,134
Reserves for guaranteed minimum
  death and income benefits	 226	 257
Total insurance-related liabilities	 $10,344	 $11,471
	 Separate account liabilities are offset by separate account assets, representing
segregated contract holder funds under variable annuity and life insurance contracts.
Separate account assets are included in “Cash and securities segregated for
regulatory and other purposes” in the consolidated statements of financial condition.
	 Liabilities for future benefits and unpaid claims include liabilities arising from
reinsurance provided by the firm to other insurers. The firm had a receivable for
$1.30 billion and $1.33 billion as of November 2007 and November 2006, respectively,
related to such reinsurance contracts, which is reported in “Receivables from
customers and counterparties” in the consolidated statements of financial condition.
In addition, the firm has ceded risks to reinsurers related to certain of its liabilities
for future benefits and unpaid claims and had a receivable of $785 million and
$786 million as of November 2007 and November 2006, respectively, related to
such reinsurance contracts, which is reported in “Receivables from customers
and counterparties” in the consolidated statements of financial condition.
Contracts to cede risks to reinsurers do not relieve the firm from its obligations
to contract holders.
	 Reserves for guaranteed minimum death and income benefits represent a liability
for the expected value of guaranteed benefits in excess of projected annuity
account balances. These reserves are computed in accordance with AICPA SOP 03-1
and are based on total payments expected to be made less total fees expected
to be assessed over the life of the contract.
(2)	Includes $5.95 billion and $619 million related to consolidated investment funds
as of November 2007 and November 2006, respectively.
Note 10
Other Assets and Other Liabilities
Other Assets
Other assets are generally less liquid, nonfinancial assets. The
following table sets forth the firm’s other assets by type:
	 As of November
(in millions)	 2007	 2006
Property, leasehold improvements
  and equipment (1)
	 $  8,975	 $  6,990
Goodwill and identifiable
  intangible assets (2)
	 5,092	 5,686
Income tax-related assets	 4,177	 3,427
Equity-method investments (3)
	 2,014	 2,764
Miscellaneous receivables
  and other 	 3,809	 3,009
Total	 $24,067	 $21,876
(1)	Net of accumulated depreciation and amortization of $5.88 billion and $5.06 billion
as of November 2007 and November 2006, respectively.
(2)	See Note 9 for further information regarding the firm’s goodwill and identifiable
intangible assets.
(3)	Excludes investments of $2.25 billion accounted for at fair value under SFAS
No. 159 as of November 2007, which are included in “Financial instruments
owned, at fair value” in the consolidated statements of financial condition.
121Goldman Sachs 2007 Annual Report
Notes to Consolidated Financial Statements
On November 30, 2007, the firm adopted SFAS No. 158 which
requires an entity to recognize in its statement of financial
condition the funded status of its defined benefit pension and
postretirement plans, measured as the difference between the fair
value of the plan assets and the benefit obligation. Upon adoption,
SFAS No. 158 requires an entity to recognize previously
unrecognized actuarial gains and losses, prior service costs, and
transition obligations and assets within “Accumulated other
comprehensive income/(loss)” in the consolidated statements of
changes in shareholders’ equity. Additional minimum pension
liabilities are derecognized upon adoption of the new standard.
As a result of adopting SFAS No. 158, the firm recorded
increases of $59 million and $253 million to “Other assets”
and “Other liabilities and accrued expenses,” respectively, and
a $194 million loss, net of taxes, within “Accumulated other
comprehensive income/(loss).”
The accumulated other comprehensive loss at November 30, 2007
includes actuarial losses, prior service costs, and transition
assets of $269 million, $37 million, and $(9) million, pre-tax,
respectively, of which $8 million, $13 million and $(2) million,
pre-tax, respectively, will be amortized from accumulated other
comprehensive loss into net periodic benefit cost in 2008.
Note 11
Employee Benefit Plans
The firm sponsors various pension plans and certain other
postretirement benefit plans, primarily healthcare and life
insurance. The firm also provides certain benefits to former or
inactive employees prior to retirement.
Defined Benefit Pension Plans
and Postretirement Plans
Employees of certain non-U.S. subsidiaries participate in various
defined benefit pension plans. These plans generally provide
benefits based on years of credited service and a percentage
of the employee’s eligible compensation. The firm maintains a
defined benefit pension plan for substantially all U.K. employees.
The firm expects to close the U.K. pension plan to new participants
during the first half of 2008, but will continue to accrue benefits
for existing participants.
The firm also maintains a defined benefit pension plan for
substantially all U.S. employees hired prior to November 1, 2003.
As of November 2004, this plan has been closed to new
participants and no further benefits will be accrued to existing
participants. In addition, the firm has unfunded postretirement
benefit plans that provide medical and life insurance for eligible
retirees and their dependents covered under these programs.
122 Goldman Sachs 2007 Annual Report
Notes to Consolidated Financial Statements
The following table provides a summary of the changes in the plans’ benefit obligations and the fair value of assets for November 2007
and November 2006 and a statement of the funded status of the plans as of November 2007 and November 2006:
	 As of or for the Year Ended November
	 2007	 	 2006
	 U.S.	 Non-U.S. 	 Post-	 U.S. 	 Non-U.S. 	 Post-
(in millions)	 Pension	 Pension	 retirement	 Pension	 Pension	 retirement
Benefit obligation
  Balance, beginning of year	 $395	 $ 673	 $ 372	 $393	 $ 486	 $ 277
  Service cost	 —	78	21	 —	 58	 19
  Interest cost	 22	34	23	 21	 25	 19
  Plan amendments	 —	 (1)	 —	 —	 1	 48
  Actuarial loss	 (11)	 (79)	36	 (13)	 38	 17
  Benefits paid	 (7)	 (1)	 (7)	 (6)	 (4)	 (8)
  Effect of foreign exchange rates	 —	 44	 —	 —	 69	 —
Balance, end of year	 $399	 $ 748	 $ 445	 $395	 $ 673	 $ 372
Fair value of plan assets
  Balance, beginning of year	 $423	 $ 506	 $    —	 $354	 $ 392	 $    —
  Actual return on plan assets	 34	36	 —	 55	 58	 —
  Firm contributions	 —	38	 7	 20	 4	 8
  Employee contributions	 —	1	 —	 —	 1	 —
  Benefits paid	 (7)	 (1)	 (7)	 (6)	 (3)	 (8)
  Effect of foreign exchange rates	 —	34	 —	 —	 54	 —
Balance, end of year	 $450	 $ 614	 $    —	 $423	 $ 506	 $    —
Prepaid/(accrued) benefit cost
  Funded status	 $  51	 $(134)	 $(445)	 $  28	 $(167)	 $(372)
  Unrecognized loss	 —	—	 —	 77	 159	 101
  Unrecognized transition
   (asset)/obligation	 —	—	 —	 (17)	 5	 1
  Unrecognized prior service cost	 —	—	 —	 —	 5	 46
  Adjustment to recognize
   additional minimum liability	 —	—	 —	 (10)	 (46)	 —
Prepaid/(accrued) benefit cost	 $  51	 $(134)	 $(445)	 $  78	 $  (44)	 $(224)
Amounts recognized in the Statements
  of Financial Condition consist of:
  Other assets	 $  51	 $    —	 $    —	 $  99	 $    —	 $    —
  Other liabilities and
   accrued expenses	 —	 (134)	 (445)	 (21)	 (44)	 (224)
Net amounts recognized	 $  51	 $(134)	 $(445)	 $  78	 $  (44)	 $(224)
123Goldman Sachs 2007 Annual Report
Notes to Consolidated Financial Statements
The accumulated benefit obligation for all defined benefit pension plans was $1.05 billion and $944 million as of November 2007
and November 2006, respectively.
For plans in which the accumulated benefit obligation exceeded plan assets, the aggregate projected benefit obligation
and accumulated benefit obligation was $722 million and $636 million, respectively, as of November 2007, and $771 million
and $647 million, respectively, as of November 2006. The fair value of plan assets for each of these plans was $590 million and
$583 million as of November 2007 and November 2006, respectively.
The components of pension expense/(income) and postretirement expense are set forth below:
	 Year Ended November
(in millions)				 2007	 2006	 2005
U.S. pension
  Service cost				 $  —	 $  —	 $  —
  Interest cost				 22	 21	 19
  Expected return on plan assets				 (32)	 (26)	 (27)
  Net amortization				 1	 7	 6
Total				 $  (9)	 $  2	 $  (2)
Non-U.S. pension
  Service cost				 $ 78	 $ 58	 $ 44
  Interest cost				 34	 25	 20
  Expected return on plan assets				 (36)	 (29)	 (23)
  Net amortization				 10	 11	 12
  Other (1)	
			 —	 —	 (17)
Total				 $ 86	 $ 65	 $ 36
Postretirement
  Service cost				 $ 21	 $ 19	 $ 23
  Interest cost				 23	 19	 13
  Net amortization				 19	 18	 4
Total				 $ 63	 $ 56	 $ 40
(1)	Represents a benefit as a result of the termination of a Japanese pension plan.
124 Goldman Sachs 2007 Annual Report
Notes to Consolidated Financial Statements
The weighted average assumptions used to develop the actuarial present value of the projected benefit obligation and net periodic
pension cost are set forth below. These assumptions represent a weighted average of the assumptions used for the U.S. and non-U.S.
plans and are based on the economic environment of each applicable country.
	 Year Ended November
				 2007	 2006	 2005
Defined benefit pension plans
  U.S. pension — projected benefit obligation
   Discount rate				 6.00%	 5.50%	 5.25%
   Rate of increase in future compensation levels			 N/A	 N/A	 N/A
  U.S. pension — net periodic benefit cost
   Discount rate				 5.50	 5.25	 5.50
   Rate of increase in future compensation levels			 N/A	 N/A	 N/A
   Expected long-term rate of return on plan assets			 7.50	 7.50	 7.50
  Non-U.S. pension — projected benefit obligation
   Discount rate				 5.91	 4.85	 4.81
   Rate of increase in future compensation levels			 5.38	 4.98	 4.75
  Non-U.S. pension — net periodic benefit cost	
   Discount rate				 4.85	 4.81	 4.63
   Rate of increase in future compensation levels			 4.98	 4.75	 4.49
   Expected long-term rate of return on plan assets			 6.84	 6.93	 6.35
Postretirement plans — benefit obligation
  Discount rate				 6.00	 5.50	 5.25
  Rate of increase in future compensation levels			 5.00	 5.00	 5.00
Postretirement plans — net periodic benefit cost
  Discount rate				 5.50	 5.25	 5.50
  Rate of increase in future compensation levels			 5.00	 5.00	 5.00
For measurement purposes, an annual growth rate in the per
capita cost of covered healthcare benefits of 10.02% was
assumed for the year ending November 2008. The rate was
assumed to decrease ratably to 5.00% for the year ending
November 2015 and remain at that level thereafter.
Generally, the firm determined the discount rates for its defined
benefit plans by referencing indices for long-term, high-quality
bonds and ensuring that the discount rate does not exceed the
yield reported for those indices after adjustment for the duration
of the plans’ liabilities.
The firm’s approach in determining the long-term rate of return
for plan assets is based upon historical financial market
relationships that have existed over time with the presumption
that this trend will generally remain constant in the future.
125Goldman Sachs 2007 Annual Report
Notes to Consolidated Financial Statements
The assumed cost of healthcare has an effect on the amounts reported for the firm’s postretirement plans. A 1% change in the
assumed healthcare cost trend rate would have the following effects:
	 1% Increase	 	 1% Decrease
(in millions)			 2007	 2006	 2007	 2006
Service plus interest costs			 $12	 $  9	 $  (9)	 $  (7)
Obligation			 94	 79	 (72)	 (62)
The following table sets forth the composition of plan assets for the U.S. and non-U.S. defined benefit pension plans by asset category:
	 As of November
	 2007	 	 2006
			 U.S. 	 Non-U.S.	 U.S.	 Non-U.S.
			 Pension	 Pension	 Pension	 Pension
Equity securities			 63%	 45%	 64%	 61%
Debt securities			 23	8	 22	 8
Other			 14	 47	 14	 31
Total			 100%	100%	 100%	 100%
The following table sets forth benefits projected to be paid
from the firm’s U.S. and non-U.S. defined benefit pension and
postretirement plans (net of Medicare subsidy receipts) and
reflects expected future service costs, where appropriate:
				
	 U.S.	 Non-U.S.	 Post-
(in millions)	 Pension	 Pension	 retirement
2008	 $  8	 $  7	 $   9
2009	 9	 7	 12
2010	 9	 8	 14
2011	 10	 8	 15
2012	 11	 8	 16
2013 – 2017	 74	 41	 103
Defined Contribution Plans
The firm contributes to employer-sponsored U.S. and non-
U.S. defined contribution plans. The firm’s contribution to
these plans was $258 million, $230 million and $305 million
for the years ended November 2007, November 2006 and
November 2005, respectively.
The investment approach of the firm’s U.S. and major non-U.S.
defined benefit pension plans involves employing a sufficient
level of flexibility to capture investment opportunities as they
occur, while maintaining reasonable parameters to ensure that
prudence and care are exercised in the execution of the investment
programs. The plans employ a total return on investment
approach, whereby a mix, which is broadly similar to the actual
asset allocation as of November 2007, of equity securities, debt
securities and other assets, is targeted to maximize the long-
term return on assets for a given level of risk. Investment risk
is measured and monitored on an ongoing basis by the firm’s
Retirement Committee through periodic portfolio reviews,
meetings with investment managers and annual liability
measurements.
The firm expects to contribute a minimum of $133 million to its
pension plans and $9 million to its postretirement plans in 2008.
126 Goldman Sachs 2007 Annual Report
Notes to Consolidated Financial Statements
Other Compensation Arrangements
The firm has deferred compensation plans for eligible employees.
In general, under the plans, participants are able to defer
payment of a portion of their cash year-end compensation.
During the deferral period, participants are able to nominally
invest their deferrals in certain alternatives available under the
plans. Generally, under current tax law, participants are not
subject to income tax on amounts deferred or on any notional
investment earnings until the returns are distributed, and
the firm is not entitled to a corresponding tax deduction
until the amounts are distributed. The firm has recognized
compensation expense for the amounts deferred under these
plans. As of November 2007 and November 2006, $281 million
and $245 million, respectively, related to these plans was
included in “Other liabilities and accrued expenses” in the
consolidated statements of financial condition.
The firm has a discount stock program through which eligible
senior executives may acquire restricted stock units at an effective
25% discount. The 25% discount is effected by an additional
grant of restricted stock units equal to one-third of the number
of restricted stock units purchased by qualifying participants.
The purchased restricted stock units are 100% vested when
granted, but the shares underlying them are not able to be sold
or transferred (other than to satisfy tax obligations) before the
third anniversary of the grant date. The shares underlying the
restricted stock units that are granted in order to effect the
25% discount will generally vest in equal installments on the
second and third anniversaries following the grant date and
will not be transferable before the third anniversary of the
grant date. Compensation expense related to these restricted
stock units is recognized over the vesting period. The total
value of restricted stock units granted in 2007 and 2006
in order to effect the 25% discount was $66 million and
$72 million, respectively.
Note 12
Employee Incentive Plans
Stock Incentive Plan
The firm sponsors a stock incentive plan, The Goldman Sachs
Amended and Restated Stock Incentive Plan (the Amended
SIP), which provides for grants of incentive stock options,
nonqualified stock options, stock appreciation rights, dividend
equivalent rights, restricted stock, restricted stock units, awards
with performance conditions and other share-based awards. In
the second quarter of 2003, the Amended SIP was approved by
the firm’s shareholders, effective for grants after April 1, 2003.
The total number of shares of common stock that may be
issued under the Amended SIP through 2008 may not exceed
250 million shares and, in each year thereafter, may not exceed
5% of the issued and outstanding shares of common stock,
determined as of the last day of the immediately preceding
year, increased by the number of shares available for awards
in previous years but not covered by awards granted in such
years. As of November 2007 and November 2006, 160.6 million
and 180.0 million shares, respectively, were available for grant
under the Amended SIP.
127Goldman Sachs 2007 Annual Report
Notes to Consolidated Financial Statements
Restricted Stock Units
The firm issued restricted stock units to employees under
the Amended SIP, primarily in connection with year-end
compensation and acquisitions. Restricted stock units are valued
based on the closing price of the underlying shares at the date of
grant. Year-end restricted stock units generally vest as outlined
in the applicable restricted stock unit agreements and deliver
shortly after the third anniversary of the grant date. All employee
restricted stock unit agreements provide that vesting is accelerated
in certain circumstances, such as upon retirement, death and
extended absence. Of the total restricted stock units outstanding
as of November 2007 and November 2006, (i) 22.0 million
			 Weighted Average Grant-Date
	 Restricted Stock		 Fair Value of Restricted
	 Units Outstanding	 	 Stock Units Outstanding
			 Future	 No Future	 Future	 No Future	
			 Service	 Service	 Service	 Service
			 Required	 Required	 Required	 Required
Outstanding, November 2006 (1)
			 26,380,372	 38,918,141	 $138.83	 $138.22
  Granted (2) (3) (4)
			 7,968,028	13,870,644	224.40	223.97
  Forfeited			 (816,924)	 (282,019)	145.30	135.46
  Delivered (5)			
—	 (12,447,338)	—	103.49
  Vested (4)			
(11,506,129)	11,506,129	116.95	116.95
Outstanding, November 2007			 22,025,347	 51,565,557	 $180.98	 $164.94
(1)	Includes restricted stock units granted to employees during the year ended November 2007 as part of compensation for 2006.
(2)	Includes restricted stock units granted to employees subsequent to November 2007 as part of compensation for 2007.
(3)	The weighted average grant-date fair value of restricted stock units granted during the years ended November 2007, November 2006 and November 2005 was $224.13,
$196.99 and $129.03, respectively.
(4)	The aggregate fair value of awards vested during the years ended November 2007, November 2006 and November 2005 was $5.63 billion, $4.40 billion and $2.05 billion,
respectively.
(5)	Includes restricted stock units that were cash settled.
units and 26.4 million units, respectively, required future service
as a condition to the delivery of the underlying shares of common
stock and (ii) 51.6 million units and 38.9 million units,
respectively, did not require future service. In all cases, delivery
of the underlying shares of common stock is conditioned on
the grantees satisfying certain vesting and other requirements
outlined in the award agreements. When delivering the underlying
shares to employees, the firm generally issues new shares of
common stock. The activity related to these restricted stock
units is set forth below:
128 Goldman Sachs 2007 Annual Report
Notes to Consolidated Financial Statements
agreements provide that vesting is accelerated in certain
circumstances, such as upon retirement, death and extended
absence. In general, all stock options expire on the tenth
anniversary of the grant date, although they may be subject to
earlier termination or cancellation under certain circumstances
in accordance with the terms of the Amended SIP and the
applicable stock option agreement. The dilutive effect of the
firm’s outstanding stock options is included in “Average common
shares outstanding — Diluted” on the consolidated statements
of earnings.
Stock Options
Stock options granted to employees generally vest as outlined
in the applicable stock option agreement and first become
exercisable on or after the third anniversary of the grant date.
Year-end stock options for 2007 and 2006 become exercisable
in January 2011 and January 2010, respectively, and expire on
November 24, 2017 and November 25, 2016, respectively.
Shares received on exercise prior to January 2013 for year-end
2007 options and January 2011 for year-end 2006 options can not
be sold, transferred or otherwise disposed of until January 2013
and January 2011, respectively. All employee stock option
The activity related to these stock options is set forth below:
					 	 Weighted
				 Weighted	 Aggregate	 Average
			 Options	 Average	 Intrinsic Value	 Remaining
			 Outstanding	 Exercise Price	 (in millions)	 Life (years)
Outstanding, November 2006 (1)		
	 45,647,096	 $  93.12
  Granted (2)		
	 3,549,856	204.16
  Exercised			 (9,918,538)	79.54
  Forfeited			 (48,785)	75.08
Outstanding, November 2007			 39,229,629	 $106.63	 $4,708	 5.05
Exercisable, November 2007			 29,613,029	 $  83.05	 $4,252	3.75
(1)	Includes stock options granted to employees during the year ended November 2007 as part of compensation for 2006.
(2)	Includes stock options granted to employees subsequent to November 2007 as part of compensation for 2007.
The total intrinsic value of options exercised during the years ended November 2007, November 2006 and November 2005 was
$1.32 billion, $1.52 billion and $766 million, respectively.
The options outstanding as of November 2007 are set forth below:
			 		 Weighted	 Weighted Average
				 Options	 Average	 Remaining
Exercise Price				 Outstanding	 Exercise Price	 Life (years)
$  45.00 – $  59.99				 2,943,014	 $  52.98	1.50
   60.00 –    74.99				 —	—	—
   75.00 –    89.99				 13,537,137	 81.03	3.94
   90.00 –   104.99				 13,132,878	 91.86	 4.07
  105.00 –   119.99				 —	—	—
  120.00 –   134.99				 3,128,972	131.64	 8.00
  135.00 –   194.99				 —	—	—
  195.00 –   209.99				 6,487,628	202.20	 9.55
Outstanding, November 2007				 39,229,629 (1)
(1)	Includes stock options granted to employees subsequent to November 2007 as part of compensation for 2007.
129Goldman Sachs 2007 Annual Report
Notes to Consolidated Financial Statements
The weighted average fair value of options granted for 2007, 2006 and 2005 was $51.04, $49.96 and $32.91 per option,
respectively. Fair value was estimated as of the grant date based on a Black-Scholes option-pricing model principally using the
following weighted average assumptions:
	 Year Ended November
				 2007	 2006	 2005
Risk-free interest rate				 4.0%	 4.6%	 4.5%
Expected volatility				 35.0	 27.5	 30.0
Dividend yield				 0.7	 0.7	 0.9
Expected life				 7.5 years	 7.5 years	 7.5 years
The common stock underlying the options granted in 2007, 2006 and 2005 is subject to transfer restrictions for a period of
2 years, 1 year and 1 year, respectively, from the date the options become exercisable. The value of the common stock underlying
the options granted in 2007, 2006 and 2005 reflects a liquidity discount of 24.0%, 17.5% and 17.5%, respectively, as a result
of these transfer restrictions. The liquidity discount was based on the firm’s pre-determined written liquidity discount policies.
The 7.5 years expected life of the options reflects the estimated impact of these sales restrictions on the life of the awards.
The following table sets forth share-based compensation and the related tax benefit:
	 Year Ended November
(in millions)				 2007	 2006	 2005
Share-based compensation				 $4,549	 $3,669	 $1,758
Excess tax benefit related to options exercised				 469	 542	 268
Excess tax benefit related to share-based compensation (1)			
908	 653	 272
(1)	Represents the tax benefit, recognized in additional paid-in capital, on stock options exercised and the delivery of common stock underlying restricted stock units.
As of November 2007, there was $2.75 billion of total unrecognized compensation cost related to nonvested share-based
compensation arrangements. This cost is expected to be recognized over a weighted average period of 2.15 years.
$596 million and $362 million, respectively. Additionally, the
firm may invest alongside the third-party investors in certain funds.
The aggregate carrying value of the firm’s interests in these funds
was $12.90 billion and $3.94 billion as of November 2007 and
November 2006, respectively. In the ordinary course of business,
the firm may also engage in other activities with these funds,
including, among others, securities lending, trade execution,
trading, custody and acquisition and bridge financing. See Note 6
for the firm’s commitments related to these funds.
Note 13
Transactions with Affiliated Funds
The firm has formed numerous nonconsolidated investment
funds with third-party investors. The firm generally acts as the
investment manager for these funds and, as such, is entitled to
receive management fees and, in certain cases, advisory fees,
incentive fees or overrides from these funds. These fees
amounted to $3.62 billion, $3.37 billion and $2.08 billion for
the years ended November 2007, November 2006 and
November 2005, respectively. As of November 2007 and
November 2006, the fees receivable from these funds were
130 Goldman Sachs 2007 Annual Report
Notes to Consolidated Financial Statements
During 2007, the valuation allowance was increased by
$31 million, primarily due to an increase in deferred tax assets
relating to net operating losses considered more likely than not to
expire unused. Net operating loss carryforwards were $2.12 billion
and $1.78 billion as of November 2007 and November 2006,
respectively.
Note 14
Income Taxes
The components of the net tax expense reflected in the consolidated statements of earnings are set forth below:
	 Year Ended November
(in millions)				 2007	 2006	 2005
Current taxes
  U.S. federal				 $2,934	 $ 3,736	 $1,504
  State and local				 388	 627	 213
  Non-U.S.				 2,554	 2,165	 1,380
Total current tax expense				 5,876	 6,528	 3,097
Deferred taxes
  U.S. federal				 118	 (635)	 3
  State and local				 100	 (262)	 (4)
  Non-U.S.				 (89)	 (608)	 (449)
Total deferred tax (benefit)/expense				 129	 (1,505)	 (450)
Net tax expense				 $6,005	 $ 5,023	 $2,647
Deferred income taxes reflect the net tax effects of temporary differences between the financial reporting and tax bases of assets
and liabilities. These temporary differences result in taxable or deductible amounts in future years and are measured using the
tax rates and laws that will be in effect when such differences are expected to reverse.
Significant components of the firm’s deferred tax assets and liabilities are set forth below:
	 As of November
(in millions)					 2007	 2006
Deferred tax assets
  Compensation and benefits					 $3,869	 $2,763
  Other, net					 997	 1,104
					 4,866	 3,867
  Valuation allowance (1)
					 (112)	 (81)
Total deferred tax assets					 $4,754	 $3,786
Deferred tax liabilities
  Depreciation and amortization					 $1,208	 $1,040
  Unrealized gains					 1,279	 367
Total deferred tax liabilities					 $2,487	 $1,407
(1)	Relates primarily to the ability to utilize losses in various tax jurisdictions.
The firm permanently reinvests eligible earnings of certain
foreign subsidiaries and, accordingly, does not accrue any U.S.
income taxes that would arise if such earnings were repatriated.
As of November 2007, this policy resulted in an unrecognized net
deferred tax liability of $350 million attributable to reinvested
earnings of $4.97 billion.
131Goldman Sachs 2007 Annual Report
Notes to Consolidated Financial Statements
The firm is subject to examination by the U.S. Internal Revenue
Service (IRS) and other taxing authorities in jurisdictions where
the firm has significant business operations, such as the United
Kingdom, Japan, Korea and various states, such as New York.
During fiscal 2007, the IRS substantially concluded its
examination of fiscal years 2003 and 2004 and the firm does
not expect that potential additional assessments from this
examination will be material to its results of operations. The
firm expects the IRS examination of the firm’s 2005 and 2006
fiscal years will begin during 2008. Tax reserves have been
established, which the firm believes are adequate in relation to
the potential for additional assessments. The resolution of tax
matters is not expected to have a material effect on the firm’s
financial condition but may be material to the firm’s operating
results for a particular period, depending, in part, upon the
operating results for that period and the firm’s effective tax rate
for that period.
The firm had federal net operating loss carryforwards, primarily
resulting from acquisitions, of $139 million and $203 million as
of November 2007 and November 2006, respectively. The firm
recorded a related net deferred income tax asset of $44 million
and $69 million as of November 2007 and November 2006,
respectively. These carryforwards are subject to annual limitations
on utilization and will begin to expire in 2011.
The firm had state and local net operating loss carryforwards,
primarily resulting from acquisitions, of $1.62 billion and
$1.52 billion as of November 2007 and November 2006,
respectively. The firm recorded a related net deferred income
tax asset of $21 million and $31 million as of November 2007
and November 2006, respectively. These carryforwards are
subject to annual limitations on utilization and will begin to
expire in 2012.
The firm had foreign net operating loss carryforwards of
$306 million and $50 million as of November 2007 and
November 2006, respectively. The firm recorded a related net
deferred income tax asset of $84 million and $13 million as
of November 2007 and November 2006, respectively. These
carryforwards are subject to limitation on utilization and can
be carried forward indefinitely.
A reconciliation of the U.S. federal statutory income tax rate to the firm’s effective income tax rate is set forth below:
	 Year Ended November
				 2007	 2006	 2005
U.S. federal statutory income tax rate				 35.0%	 35.0%	 35.0%
Increase related to state and local taxes, net of U.S. income tax effects		 1.8	 1.6	 1.6
Tax credits				 (0.5)	 (0.6)	 (1.6)
Foreign operations				 (1.6)	 (1.3)	 (1.2)
Tax-exempt income, including dividends				 (0.4)	 (0.4)	 (0.6)
Other				 (0.2)	 0.2 (1)
	 (1.2)
Effective income tax rate				 34.1%	 34.5%	 32.0%
(1)	Primarily includes the effect of audit settlements.
Tax benefits of approximately $908 million in November 2007, $653 million in November 2006 and $272 million in November 2005,
related to the delivery of common stock underlying restricted stock units and the exercise of options, were credited directly to
“Additional paid-in capital” in the consolidated statements of financial condition and changes in shareholders’ equity.
132 Goldman Sachs 2007 Annual Report
Notes to Consolidated Financial Statements
The firm has U.S. insurance subsidiaries that are subject to
state insurance regulation and oversight in the states in which
they are domiciled and in the other states in which they are
licensed. In addition, certain of the firm’s insurance subsidiaries
are regulated by the Bermuda Registrar of Companies. The firm’s
insurance subsidiaries were in compliance with all regulatory
capital requirements as of November 2007 and November 2006.
The firm’s principal non-U.S. regulated subsidiaries include
Goldman Sachs International (GSI) and Goldman Sachs Japan
Co., Ltd. (GSJCL). GSI, the firm’s regulated U.K. broker-dealer,
is subject to the capital requirements of the U.K.’s Financial
Services Authority. GSJCL, the firm’s regulated Japanese broker-
dealer, is subject to the capital requirements of Japan’s Financial
Services Agency. As of November 2007 and November 2006,
GSI and GSJCL were in compliance with their local capital
adequacy requirements. Certain other non-U.S. subsidiaries
of the firm are also subject to capital adequacy requirements
promulgated by authorities of the countries in which they
operate. As of November 2007 and November 2006, these
subsidiaries were in compliance with their local capital adequacy
requirements.
The regulatory requirements referred to above restrict
Group Inc.’s ability to withdraw capital from its regulated
subsidiaries. As of November 2007, approximately $18.10 billion
of net assets of regulated subsidiaries were restricted as to the
payment of dividends to Group Inc.
Note 15
Regulation
The firm is regulated by the U.S. Securities and Exchange
Commission as a Consolidated Supervised Entity (CSE). As such,
it is subject to group-wide supervision and examination by the
SEC and to minimum capital standards on a consolidated
basis. As of November 2007 and November 2006, the firm was
in compliance with the CSE capital standards.
The firm’s principal U.S. regulated subsidiaries include Goldman,
Sachs  Co. (GSCo.) and Goldman Sachs Execution 
Clearing, L.P. (GSEC). GSCo. and GSEC are registered U.S.
broker-dealers and futures commission merchants subject to
Rule 15c3-1 of the SEC and Rule 1.17 of the Commodity
Futures Trading Commission, which specify uniform minimum
net capital requirements, as defined, for their registrants, and
also require that a significant part of the registrants’ assets be
kept in relatively liquid form. GSCo. and GSEC have elected
to compute their minimum capital requirements in accordance
with the “Alternative Net Capital Requirement” as permitted
by Rule 15c3-1. As of November 2007 and November 2006,
GSCo. and GSEC had net capital in excess of their minimum
capital requirements. In addition to its alternative minimum net
capital requirements, GSCo. is also required to hold tentative
net capital in excess of $1 billion and net capital in excess of
$500 million in accordance with the market and credit risk
standards of Appendix E of Rule 15c3-1. GSCo. is also required
to notify the SEC in the event that its tentative net capital is less
than $5 billion. As of November 2007 and November 2006,
GSCo. had tentative net capital and net capital in excess of
both the minimum and the notification requirements.
GS Bank USA, a wholly owned industrial bank, is regulated by
the Federal Deposit Insurance Corporation and the State
of Utah Department of Financial Institutions and is subject
to minimum capital requirements. As of November 2007,
GS Bank USA was in compliance with all regulatory capital
requirements. Substantially all of the firm’s bank deposits as of
November 2007 consisted of U.S. dollar-denominated savings
accounts at GS Bank USA. Savings accounts at GS Bank USA
have no stated maturity and can be withdrawn upon short notice.
The weighted average interest rates for savings deposits were
4.71% and 5.17% as of November 2007 and November 2006,
respectively. The carrying value of savings deposits approximated
fair value as of November 2007 and November 2006.
133Goldman Sachs 2007 Annual Report
Notes to Consolidated Financial Statements
The firm allocates revenues and expenses among the three
business segments. Due to the integrated nature of these
segments, estimates and judgments have been made in allocating
certain revenue and expense items. Transactions between
segments are based on specific criteria or approximate third-
party rates. Total operating expenses include corporate items
that have not been allocated to individual business segments. The
allocation process is based on the manner in which management
views the business of the firm.
The segment information presented in the table below is prepared
according to the following methodologies:
■	 Revenues and expenses directly associated with each segment
are included in determining pre-tax earnings.
■	 Net revenues in the firm’s segments include allocations of
interest income and interest expense to specific securities,
commodities and other positions in relation to the cash
generated by, or funding requirements of, such underlying
positions. Net interest is included within segment net revenues
as it is consistent with the way in which management assesses
segment performance.
■	 Overhead expenses not directly allocable to specific segments
are allocated ratably based on direct segment expenses.
Note 16
Business Segments
In reporting to management, the firm’s operating results are
categorized into the following three business segments:
Investment Banking, Trading and Principal Investments, and
Asset Management and Securities Services.
Basis of Presentation
In reporting segments, certain of the firm’s business lines have
been aggregated where they have similar economic characteristics
and are similar in each of the following areas: (i) the nature of
the services they provide, (ii) their methods of distribution, (iii) the
types of clients they serve and (iv) the regulatory environments
in which they operate.
The cost drivers of the firm taken as a whole — compensation,
headcount and levels of business activity — are broadly similar
in each of the firm’s business segments. Compensation and
benefits expenses within the firm’s segments reflect, among
other factors, the overall performance of the firm as well as the
performance of individual business units. Consequently,
pre-tax margins in one segment of the firm’s business may be
significantly affected by the performance of the firm’s other
business segments.
134 Goldman Sachs 2007 Annual Report
Notes to Consolidated Financial Statements
Segment Operating Results
Management believes that the following information provides a reasonable representation of each segment’s contribution to
consolidated pre-tax earnings and total assets:
	 As of or for the Year Ended November
(in millions)				 2007	 2006	 2005
Investment Banking	 Net revenues	 $    7,555	 $   5,629	 $   3,671
	 Operating expenses	 4,985	 4,062	 3,258
	 Pre-tax earnings	 $    2,570	 $   1,567	 $    413
	 Segment assets	 $    5,526	 $   4,967	 $   4,869
Trading and Principal Investments	 Net revenues	 $   31,226	 $  25,562	 $  16,818
	 Operating expenses	 17,998	 14,962	 10,600
	 Pre-tax earnings	 $   13,228	 $  10,600	 $   6,218
	 Segment assets	 $  744,647	 $566,499	 $505,536
Asset Management and Securities Services	 Net revenues	 $    7,206	 $   6,474	 $   4,749
	 Operating expenses 	 5,363	 4,036	 3,070
	 Pre-tax earnings	 $    1,843	 $   2,438	 $   1,679
	 Segment assets	 $  369,623	 $266,735	 $196,399
Total	 Net revenues (1)
	 $   45,987	 $  37,665	 $  25,238
	 Operating expenses (2)
	 28,383	 23,105	 16,965
	 Pre-tax earnings (3)
	 $   17,604	 $  14,560	 $   8,273
	 Total assets	 $1,119,796	 $838,201	 $706,804
(1)	Net revenues include net interest as set forth in the table below:
	 Year Ended November
(in millions)				 2007	 2006	 2005
Investment Banking				 $    —	 $   16	 $   72
Trading and Principal Investments				 1,512	 1,535	 1,366
Asset Management and Securities Services				 2,475	 1,947	 1,659
Total net interest				 $3,987	 $3,498	 $3,097
(2)	Operating expenses include net provisions for a number of litigation and regulatory proceedings of $37 million, $45 million and $37 million for the years ended November 2007,
November 2006 and November 2005, respectively, that have not been allocated to the firm’s segments.
(3)	Pre-tax earnings include total depreciation and amortization as set forth in the table below:
	 Year Ended November
(in millions)				 2007	 2006	 2005
Investment Banking				 $  137	 $119	 $143
Trading and Principal Investments				 845	 725	 565
Asset Management and Securities Services				 185	 151	 146
Total depreciation and amortization				 $1,167	 $995	 $854
135Goldman Sachs 2007 Annual Report
Notes to Consolidated Financial Statements
Geographic results are generally allocated as follows:
■	 Investment Banking: location of the client and investment
banking team.
■	 Fixed Income, Currency and Commodities, and Equities:
location of the trading desk.
■	 Principal Investments: location of the investment.
■	 Asset Management: location of the sales team.
■	 Securities Services: location of the primary market for the
underlying security.
Geographic Information
Due to the highly integrated nature of international financial
markets, the firm manages its businesses based on the
profitability of the enterprise as a whole. Since a significant
portion of the firm’s activities require cross-border coordination
in order to facilitate the needs of the firm’s clients, the methodology
for allocating the firm’s profitability to geographic regions is
dependent on the judgment of management.
The following table sets forth the total net revenues and pre-tax earnings of the firm and its consolidated subsidiaries by
geographic region allocated on the methodology described above, as well as the percentage of total net revenues and total pre-tax
earnings for each geographic region:
	 Year Ended November
($ in millions) 	 2007		 2006		 2005
Net revenues
  Americas (1)
	 $23,412	 51%	 $20,361	 54%	 $14,639	 58%
  EMEA (2)	
13,538	29	 9,354	 25	 6,063	 24
  Asia	 9,037	20	 7,950	 21	 4,536	 18
Total net revenues	 $45,987	100%	 $37,665	 100%	 $25,238	 100%
Pre-tax earnings
  Americas (1)
	 $ 7,673	 43%	 $  7,515	 52%	 $  4,977	 60%
  EMEA (2)	
5,458	31	 3,075	 21	 1,457	 17
  Asia	 4,510	26	 4,015	 27	 1,876	 23
  Corporate (3)	
(37)	 —	 (45)	 —	 (37)	 —
Total pre-tax earnings	 $17,604	100%	 $14,560	 100%	 $  8,273	 100%
(1)	Substantially all relates to U.S. results.
(2)	EMEA (Europe, Middle East and Africa).
(3)	Consists of net provisions for a number of litigation and regulatory proceedings.
136 Goldman Sachs 2007 Annual Report
Supplemental Financial Information
Quarterly Results (unaudited)
The following represents the firm’s unaudited quarterly results for 2007 and 2006. These quarterly results were prepared in
accordance with generally accepted accounting principles and reflect all adjustments that are, in the opinion of management,
necessary for a fair statement of the results. These adjustments are of a normal recurring nature.
	 2007 Quarter
(in millions, except per share data)			 First	 Second	Third	 Fourth
Total revenues			 $22,280	 $20,351	 $23,803	 $21,534
Interest expense			 9,550	10,169	11,469	10,793
Revenues, net of interest expense			 12,730	10,182	12,334	10,741
Operating expenses (1)
			 7,871	 6,751	 8,075	 5,686
Pre-tax earnings			 4,859	3,431	 4,259	 5,055
Provision for taxes			 1,662	1,098	1,405	1,840
Net earnings			 3,197	2,333	2,854	3,215
Preferred stock dividends			 49	 46	 48	 49
Net earnings applicable to common shareholders		 $ 3,148	 $ 2,287	 $ 2,806	 $ 3,166
Earnings per common share
  Basic			 $  7.08	 $   5.25	 $   6.54	 $  7.49
  Diluted			 6.67	 4.93	 6.13	7.01
Dividends declared and paid per common share		 0.35	 0.35	 0.35	 0.35
	 2006 Quarter
(in millions, except per share data)			 First	 Second	 Third	 Fourth
Total revenues			 $17,246	 $18,002	 $15,979	 $18,126
Interest expense			 6,813	 7,761	 8,395	 8,719
Revenues, net of interest expense			 10,433	 10,241	 7,584	 9,407
Operating expenses (1)
			 6,744	 6,717	 5,222	 4,422
Pre-tax earnings			 3,689	 3,524	 2,362	 4,985
Provision for taxes			 1,210	 1,212	 768	 1,833
Net earnings			 2,479	 2,312	 1,594	 3,152
Preferred stock dividends			 26	 26	 39	 48
Net earnings applicable to common shareholders		 $  2,453	 $  2,286	 $  1,555	 $  3,104
Earnings per common share
  Basic			 $   5.36	 $   5.08	 $   3.46	 $   7.06
  Diluted			 5.08	 4.78	 3.26	 6.59
Dividends declared and paid per common share		 0.25	 0.35	 0.35	 0.35
(1)	The timing and magnitude of changes in the firm’s bonus accruals can have a significant effect on results in a given quarter.
137Goldman Sachs 2007 Annual Report
Supplemental Financial Information
Common Stock Price Range
The following table sets forth, for the quarters indicated, the high and low sales prices per share of the firm’s common stock.
	 Sales Price
	 2007	 	 2006	 	 2005
	 High	 Low	 High	 Low	 High	 Low
First quarter	 $222.75	 $191.50	 $146.35	 $124.23	 $113.93	 $101.79
Second quarter	 232.41	189.85	 169.31	 139.18	 114.25	 95.16
Third quarter	 233.97	157.38	 157.00	 136.79	 114.87	 94.75
Fourth quarter	 250.70	175.00	 203.35	 145.66	 134.99	 108.86
As of January 18, 2008, there were 7,784 holders of record of the firm’s common stock.
On January 18, 2008, the last reported sales price for the firm’s common stock on the New York Stock Exchange was
$187.21 per share.
Common Stock Price Performance
The following graph compares the performance of an investment in the firm’s common stock from November 29, 2002 through
November 30, 2007, with the SP 500 Index and the SP 500 Financial Index. The graph assumes $100 was invested on
November 29, 2002 in each of the firm’s common stock, the SP 500 Index and the SP 500 Financial Index, and the dividends
were reinvested on the date of payment without payment of any commissions. The performance shown in the graph represents
past performance and should not be considered an indication of future performance.
$50
Nov–02 Nov–03 Nov–04 Nov–05 Nov–06 Nov–07
$100
$150
$200
$250
$300
$350
The Goldman Sachs Group, Inc. SP 500 Index SP 500 Financial Index
The table below shows the cumulative total returns in dollars of the firm’s common stock, the SP 500 Index and the SP 500
Financial Index for Goldman Sachs’ last five fiscal year ends, assuming $100 was invested on November 29, 2002 in each of the
firm’s common stock, the SP 500 Index and the SP 500 Financial Index, and the dividends were reinvested on the date of
payment without payment of any commissions. The performance shown in the table represents past performance and should
not be considered an indication of future performance.
	 11/29/02	 11/28/03	 11/26/04	 11/25/05	 11/24/06	 11/30/07
The Goldman Sachs Group, Inc.	 $100.00	 $122.90	 $135.47	 $174.88	 $265.03	 $300.00
SP 500 Index	 100.00	 113.02	 126.31	 135.45	 149.62	 158.19
SP 500 Financial Index	 100.00	 115.42	 126.37	 138.36	 153.77	 132.30
138 Goldman Sachs 2007 Annual Report
Supplemental Financial Information
Selected Financial Data
	 As of or for the Year Ended November
		 2007	 2006	 2005	 2004	 2003
Income statement data (in millions)
Total revenues		 $   87,968	 $  69,353	 $  43,391	 $  29,839	 $  23,623
Interest expense		 41,981	 31,688	 18,153	 8,888	 7,600
Revenues, net of interest expense		 45,987	 37,665	 25,238	 20,951	 16,023
Compensation and benefits		 20,190	 16,457	 11,758	 9,681	 7,515
Other operating expenses		 8,193	 6,648	 5,207	 4,594	 4,063
Pre-tax earnings		 $   17,604	 $  14,560	 $   8,273	 $   6,676	 $   4,445
Balance sheet data (in millions)
Total assets		 $1,119,796	 $838,201	 $706,804	 $531,379	 $403,799
Other secured financings (long-term)		 33,300	 26,134	 15,669	 12,087	 6,043
Unsecured long-term borrowings		 164,174	 122,842	 84,338	 68,609	 51,439
Total liabilities		 1,076,996	 802,415	 678,802	 506,300	 382,167
Total shareholders’ equity		 42,800	 35,786	 28,002	 25,079	 21,632
Common share data (in millions, except per share amounts)
Earnings per common share
  Basic		 $    26.34	 $   20.93	 $   11.73	 $    9.30	 $    6.15
  Diluted		 24.73	 19.69	 11.21	 8.92	 5.87
Dividends declared and paid per common share	 1.40	 1.30	 1.00	 1.00	 0.74
Book value per common share (1)
		 90.43	 72.62	 57.02	 50.77	 43.60
Average common shares outstanding
  Basic		 433.0	 449.0	 478.1	 489.5	 488.4
  Diluted		 461.2	 477.4	 500.2	 510.5	 511.9
Selected data (unaudited)
Employees
  United States		 17,383	 15,477	 14,466	 13,846	 13,189
  Non-U.S.		 13,139	 10,990	 9,157	 7,890	 7,170
Total employees		 30,522	 26,467	 23,623	 21,736	 20,359
Assets under management (in billions) (2)
Asset class
  Alternative investments (3)
		 $      151	 $    145	 $    110	 $     95	 $     68
  Equity		 255	 215	 167	 133	 104
  Fixed income		 256	 198	 154	 134	 112
Total non-money market assets		 662	 558	 431	 362	 284
Money markets		 206	 118	 101	 90	 89
Total assets under management		 $      868	 $    676	 $    532	 $    452	 $    373
(1)	Book value per common share is based on common shares outstanding, including restricted stock units granted to employees with no future service requirements,
of 439.0 million, 450.1 million, 460.4 million, 494.0 million and 496.1 million as of November 2007, November 2006, November 2005, November 2004 and
November 2003, respectively.
(2)	Substantially all assets under management are valued as of calendar month-end.
(3)	Primarily includes hedge funds, private equity, real estate, currencies, commodities and asset allocation strategies.
139Goldman Sachs 2007 Annual Report
Board Members, Officers and Directors
Board of Directors
Lloyd C. Blankfein
Chairman and
Chief Executive Officer
Jon Winkelried
President and Co-Chief
Operating Officer
Gary D. Cohn
President and Co-Chief
Operating Officer
John H. Bryan
Retired Chairman and
Chief Executive Officer of
Sara Lee Corporation
Claes Dahlbäck
Senior Advisor to
Investor AB and Foundation
Asset Management
Stephen Friedman
Chairman of Stone Point Capital
William W. George
Professor at Harvard Business
School and Former Chairman
and Chief Executive Officer of
Medtronic, Inc.
Rajat K. Gupta
Senior Partner Emeritus
of McKinsey  Company
James A. Johnson
Vice Chairman of Perseus, L.L.C.
Lois D. Juliber
Former Vice Chairman and
Chief Operating Officer of
Colgate-Palmolive Company
Edward M. Liddy
Chairman of
The Allstate Corporation
Ruth J. Simmons
President of Brown University
John F.W. Rogers
Secretary to the Board
Managing Directors
Lloyd C. Blankfein
Howard A. Silverstein
Kevin W. Kennedy*
Thomas E. Tuft
John P. Curtin, Jr.
Frank L. Coulson, Jr.
Richard A. Friedman
Joseph H. Gleberman
Timothy J. O’Neill
John J. Powers
Jon Winkelried
Gregory K. Palm
Masanori Mochida
Gene T. Sykes
David A. Viniar
John S. Weinberg
Sharmin Mossavar-Rahmani
Armen A. Avanessians
Gary D. Cohn
Christopher A. Cole
Henry Cornell
J. Michael Evans
Peter S. Kraus
Robert Litterman
Michael S. Sherwood
Esta E. Stecher
Byron D. Trott
Tracy R. Wolstencroft*
Terence J. O’Neill
E. Gerald Corrigan
Milton R. Berlinski
Jean-Luc Biamonti
Thomas C. Brasco
Peter D. Brundage
Andrew A. Chisholm
Abby Joseph Cohen*
Frank T. Connor
Randolph L. Cowen*
Philip M. Darivoff
Glenn P. Earle
Charles P. Eve
Edward C. Forst
Christopher G. French
C. Douglas Fuge
Richard J. Gnodde
Jeffrey B. Goldenberg
David B. Heller
Timothy J. Ingrassia
Robert C. Jones
Bruce M. Larson
Gwen R. Libstag
Victor M. Lopez-Balboa
Sanjeev K. Mehra
Richard T. Ong
Management Committee
Lloyd C. Blankfein
Chairman and Chief
Executive Officer
Jon Winkelried
President and Co-Chief
Operating Officer
Gary D. Cohn
President and Co-Chief
Operating Officer
John S. Weinberg
Vice Chairman
Christopher A. Cole
J. Michael Evans
Edward C. Forst
Richard A. Friedman
Richard J. Gnodde
Kevin W. Kennedy
Peter S. Kraus
Masanori Mochida
John F.W. Rogers
Michael S. Sherwood
David M. Solomon
David A. Viniar
Gregory K. Palm
Esta E. Stecher
General Counsels
Alan M. Cohen
Head of Global Compliance
Sanjay H. Patel
Stuart M. Rothenberg*
Richard M. Ruzika*
Muneer A. Satter
Howard B. Schiller
John P. Shaughnessy
Theodore T. Sotir
Marc A. Spilker
Mark R. Tercek
Susan A. Willetts*
W. Thomas York, Jr.*
Philippe J. Altuzarra
Jonathan A. Beinner
Andrew S. Berman
James J. Birch
David R. Boles
Charles W.A. Bott
Steven M. Bunson
George H. Butcher III
Laura C. Conigliaro
John W. Curtis
Matthew S. Darnall
Alexander C. Dibelius
Karlo J. Duvnjak
Isabelle Ealet
Elizabeth C. Fascitelli
Laurie R. Ferber
Oliver L. Frankel
H. John Gilbertson, Jr.
Douglas C. Grip
Celeste A. Guth
Gregory T. Hoogkamp
William L. Jacob III
Andrew J. Kaiser
Robert C. King, Jr.
Mitchell J. Lieberman
Josephine Linden
Francisco Lopez-Balboa
Antigone Loudiadis
John A. Mahoney
Charles G.R. Manby
David J. Mastrocola
Theresa E. McCabe
Stephen J. McGuinness
J. William McMahon
Audrey A. McNiff
Wayne L. Moore
Donald J. Mulvihill
Stephen R. Pierce
John J. Rafter
Charlotte P. Ransom
John F.W. Rogers
J. Michael Sanders
Victor R. Simone, Jr.
*Partnership Committee Member
140 Goldman Sachs 2007 Annual Report
Board Members, Officers and Directors
Michael M. Smith
Jonathan S. Sobel
Michael A. Troy
Kaysie P. Uniacke
Haruko Watanuki
Todd A. Williams
Paolo Zannoni
Yoel Zaoui*
Joan H. Zief
Kendrick R. Wilson III
Peter C. Aberg
Frances R. Bermanzohn
Robert A. Berry
Craig W. Broderick
Richard M. Campbell-Breeden
Anthony H. Carpet
Michael J. Carr
Kent A. Clark
Timothy J. Cole
Edith W. Cooper*
John S. Daly
Juan A. Del Rivero
Simon P. Dingemans
Jana Hale Doty
Gordon E. Dyal
Michael P. Esposito
Steven M. Feldman
Stephen C. Fitzgerald*
Matthew T. Fremont-Smith
Andrew M. Gordon
David J. Greenwald*
Roger C. Harper
Maykin Ho
Timothy E. Hodgson
Christopher G. Hogg
Robert D. Hormats
James A. Hudis
Colin E. King
David J. Kostin
Koji Kotaka
Paulo C. Leme
Hughes B. Lepic
Robert J. Markwick
Kathy M. Matsui
Richard F.X. McArdle
Geraldine F. McManus
James E. Milligan
Yukihiro Moroe
Jeffrey M. Moslow
Michael J. Poulter
Dioscoro-Roy I. Ramos
Joseph Ravitch
Pamela P. Root
Jacob D. Rosengarten
Ronald S. Levin
Kathleen M. Maloney
Robert S. Mancini
Richard P. McNeil
Michael R. Miele
Suok J. Noh
Geoffrey M. Parker
David B. Philip
Ellen R. Porges
Richard H. Powers
Kevin A. Quinn
Ivan Ross
Katsunori Sago*
Pablo J. Salame*
Jeffrey W. Schroeder
Harvey M. Schwartz*
Karen D. Seitz
Ravi M. Singh
Trevor A. Smith
Daniel L. Sparks
Shahriar Tadjbakhsh
Donald J. Truesdale
John S. Willian
Kenneth W. Willman
Andrew F. Wilson
Paul M. Young
Thomas J. Kenny
Jack Levy
Mark F. Dehnert
Michael H. Siegel
Matthew C. Westerman*
Jason H. Ekaireb
Antonio Borges
Seaborn S. Eastland
William C. Montgomery
Stephen P. Hickey
Yusuf A. Aliredha
John A. Ashdown
William A. Badia
Christopher M. Barter
John D. Bertuzzi
Elizabeth E. Beshel
Alan J. Brazil
Melissa R. Brown
Amy L. Chasen
W. Reed Chisholm II
Jane P. Chwick
Peter H. Comisar
Brahm S. Cramer
Nicholas P. Crapp
Michael D. Daffey
Jean A. De Pourtales
Joseph P. DiSabato
Suzanne O. Donohoe*
Paul M. Russo
Gary B. Schermerhorn
Steven M. Scopellite
Ravi Sinha
Edward M. Siskind
Sarah E. Smith*
Steven H. Strongin*
Patrick Sullivan
Daisuke Toki
John J. Vaske
Hsueh Ming Wang
David M. Weil
Tetsufumi Yamakawa
R. Douglas Henderson
Eileen Rominger
Michael S. Wishart
David M. Solomon
Karen R. Cook
Gregory A. Agran
Raanan A. Agus
Dean C. Backer*
Stuart N. Bernstein
Alison L. Bott
Mary D. Byron
Mark M. Carhart
Thomas G. Connolly
Michael G. De Lathauwer
James Del Favero
Martin R. Devenish
Michele I. Docharty
Thomas M. Dowling
Brian J. Duffy
Edward K. Eisler
Jeffrey F. Fastov
James A. Fitzpatrick
Lorenzo Grabau
Peter W. Grieve
Keith L. Hayes
Bruce A. Heyman
Joanne M. Hill
Daniel E. Holland III
Teresa E. Holliday
Michael R. Housden
Paul J. Huchro
Edith A. Hunt
Toni-Dara Infante
Raymond J. Iwanowski
Andrew J. Jonas
David K. Kaugher
Lawrence S. Keusch
Timothy M. Kingston
John J. Lauto
Matthew Lavicka
David N. Lawrence
James H. Donovan
Donald J. Duet
Michael L. Dweck
Gregory H. Ekizian
Earl S. Enzer
Christopher H. Eoyang
Norman Feit
Robert K. Frumkes
Richard A. Genna
Robert R. Gheewalla
Gary T. Giglio
Pedro Gonzalez Grau
Michael J. Graziano
Peter Gross
Douglas C. Heidt
Peter C. Herbert
Kenneth W. Hitchner
Peter Hollmann
Philip Holzer
Zu Liu Frederick Hu*
Walter A. Jackson
Andrew R. Jessop
Peter T. Johnston
Roy R. Joseph
James C. Katzman
Carsten Kengeter
Gioia M. Kennett
Shigeki Kiritani
Gregory D. Lee
Todd W. Leland
Johan H. Leven
George C. Liberopoulos
Anthony W. Ling
Bonnie S. Litt
Joseph Longo
Peter B. MacDonald
Mark G. Machin
John V. Mallory
Blake W. Mather
John J. McCabe
James A. McNamara
Robert A. McTamaney
Leslie S. Nelson
Fergal J. O’Driscoll
L. Peter O’Hagan
Taneki Ono
Nigel M. O’Sullivan
James R. Paradise
Arthur J. Peponis
B. Andrew Rabin
Philip A. Raper
Michael J. Richman
Michael S. Rotter
Thomas M. Schwartz
*Partnership Committee Member
141Goldman Sachs 2007 Annual Report
Board Members, Officers and Directors
Lisa M. Shalett
David G. Shell
Ralph J. Silva
David T. Simons
Johannes R. Sulzberger
Richard J. Sussman
Caroline H. Taylor
Peter K. Tomozawa
Eiji Ueda
Lucas van Praag
Ashok Varadhan
Casper W. Von Koskull
Gregg S. Weinstein
Scott R. Weinstein
Martin M. Werner
C. Howard Wietschner
Kurt D. Winkelmann
Wassim G. Younan
Brian Duggan
Nicholas G. Giordano
Donald W. Himpele
James H. Rogan
Gary J. Sveva
Christopher P. Sullivan
Ruud G. Hendriks
Harry Silver
William J. Young
Donald R. Mullen*
Alison J. Mass
James A. Jacobson, Jr.
Ben I. Adler
Ignacio Alvarez-Rendueles
Lori B. Appelbaum
Philip S. Armstrong
William J. Bannon
Scott B. Barringer
Steven M. Barry
Jordan M. Bender
Paul D. Bernard
George M. Brady
Joseph M. Busuttil
Jin Yong Cai
Valentino D. Carlotti
Eduardo Centola
James B. Clark
Linda S. Daines
Stephen Davies
Oral W. Dawe
Diego De Giorgi
Daniel L. Dees
Kenneth M. Eberts, III
Luca D. Ferrari
David A. Fishman
Alexander W. Fletcher
Abraham Shua
Jeffrey S. Sloan
John E. Smollen
Raymond B. Strong, III
Nicolas F. Tiffou
David H. Voon
John E. Waldron
Robert P. Wall
Michael W. Warren
David D. Wildermuth
Kevin L. Willens
Jon A. Woodruff
William M. Wicker
Edward R. Wilkinson
Timothy H. Moe
Akio Asuke
Matthew H. Cyzer
Phillip S. Hylander
Larry M. Kellerman
Gene Reilly
Hilary E. Ackermann
Jeffrey D. Adams
Elizabeth D. Anderson
Charles Baillie
Bernardo Bailo
Stacy Bash-Polley
Driss Ben-Brahim
Susan M. Benz
Johannes M. Boomaars
J. Theodore Borter
Timothy J. Bridges
David D. Buckley
Nicholas F. Burgin
Gerald J. Cardinale
Lik Shuen David Chan
Thomas V. Cholnoky
Colin Coleman
Kenneth W. Coquillette
Michael J. Crinieri
Craig W. Crossman
Jeffrey R. Currie
Stephen D. Daniel
Giorgio De Santis
Bradley S. DeFoor
Alvaro del Castano
Robert K. Ehudin
Kathy G. Elsesser
Peter C. Enns
Katherine B. Enquist
James P. Esposito
Douglas L. Feagin
Gail S. Fierstein
Pierre-Henri Flamand
Timothy T. Furey
Orit P. Freedman
Enrico S. Gaglioti
James R. Garvey
Gregg A. Gonsalves
Larry J. Goodwin
Stefan Green
David J. Grounsell
Mary L. Harmon
Valerie J. Harrison
Rumiko Hasegawa
Edward A. Hazel
Melina E. Higgins
Margaret J. Holen
Sean C. Hoover
Robert F. Incorvaia
Kenneth L. Josselyn
Toshinobu Kasai
Eric S. Lane
Gregg R. Lemkau
Ryan D. Limaye
Jill E. Lohrfink
Christopher J. Magarro
Allan S. Marson
Robert A. Mass
George N. Mattson
Ian R. McCormick
Gerald C. McNamara, Jr.
Stuart G. McPherson
Lance P. Meaney
Bernard A. Mensah
Julian R. Metherell
Masatoki J. Mitsumata
J. Ronald Morgan, III
James P. Morris
Rie Murayama
Mark J. Naylor
Jeffrey P. Nedelman
Gavin G. O’Connor
Todd G. Owens
Fumiko Ozawa
Helen Paleno
Archie W. Parnell
Todd J. Phillips
Anthony J. Principato
Alan M. Rapfogel
Sara E. Recktenwald
Jeffrey A. Resnick
Thomas S. Riggs, III
Normann G. Roesch
David C. Ryan
David M. Ryan
James E. Sawtell
Susan J. Scher
Stephen M. Scherr
Gonzalo R. Garcia
Justin G. Gmelich
Eldridge F. Gray
Michael J. Grimaldi
Benoit Herault
Axel Hoerger
Simon N. Holden
Shin Horie
Adrian M. Jones
Alan S. Kava
J. Christopher A. Kojima
Kazuaki Kojima
Takahiro Komatsu
Simon M. Lamb
Rudolf N. Lang
Brian J. Lee
George C. Lee
Tim Leissner
Allan S. Levine
Brian T. Levine
Lisette M. Lieberman
Terence Tayseop Lim
Paula B. Madoff
Puneet Malhi
Simon I. Mansfield
Naomi Matsuoka
Matthew B. McLennan
Bruce H. Mendelsohn
Michael J. Millette
Milton R. Millman
Philip J. Moffitt
Simon P. Morris
Thomas C. Morrow
Marc O. Nachmann
Erik F. Nielsen
James B. Otness
Steven M. Pinkos
Andrew F. Pyne
William M. Quinn
Jean Raby
Richard J. Revell
Kirk L. Rimer
David J. Rosenblum
Marc A. Rothenberg
Matthew L. Schroeder
Peter A. Seibold
Daniel M. Shefter
David A. Shiffman
Guy C. Slimmon
Claudia Spiess
Joseph F. Squeri
Christoph W. Stanger
Chase O. Stevenson
Richard J. Stingi
*Partnership Committee Member
142 Goldman Sachs 2007 Annual Report
Board Members, Officers and Directors
Roland W. Tegeder
Robin A. Vince
Andrea A. Vittorelli
Theodore T. Wang
Elisha Wiesel
Neil J. Wright
Denise A. Wyllie
Yi Kevin Zhang
Marina L. Roesler
Howard Q. Spooner
Sanaz Zaimi
Sheila H. Patel
William M. Roberts
William Lee Hemphill
Thomas V. Conigliaro
Olusegun O. Aganga
Mark E. Agne
Thomas K. Amster
Anton J. Arriola
Gareth W. Bater
Marjorie Boliscar
Oliver R. Bolitho
Sally A. Boyle
Lester R. Brafman
Cynthia A. Brower
Randall S. Burkert
Philippe L. Camu
John W. Cembrook
Robert J. Ceremsak
James R. Cielinski
William J. Conley, Jr.
Colin J. Corgan
Thomas W. Cornacchia
Frederick C. Darling
David H. Dase
François-Xavier de Mallmann
L. Brooks Entwistle
Gregory A. Finck
Mark B. Florian
Timothy B. Flynn
Elisabeth Fontenelli
Elizabeth J. Ford
Colleen A. Foster
Linda M. Fox
Kieu L. Frisby
Timur F. Galen
Rachel C. Golder
Kevin J. Guidotti
Vishal Gupta
Elizabeth M. Hammack
Kuniyoshi Hayashi
Kenneth L. Hirsch
Robert Howard
Mark Howard-Johnson
Shinichi Yokote
Peter J. Zangari
Alan M. Cohen
Michiel P. Lap
Jane Hargreaves
Peter E. Scialla
Helena Koo
Dhruv Narain
Takushi Abe
Reinhard B. Koester
Peter F. Spies
Stefan R. Bollinger
Linnea K. Conrad
Gregory B. Carey
Paul R. Aaron
Koichiro Abe
Andrew W. Alford
Fareed T. Ali
William D. Anderson, Jr.
Yoshio Ando
Rachel Ascher
Dolores S. Bamford
Benjamin C. Barber
Slim C. Bentami
Leslie A. Biddle
Susan G. Bowers
Christoph M. Brand
Michael J. Brandmeyer
Andrew I. Braun
Anne F. Brennan
Patrick T. Briody
Adam J. Brooks
Jason M. Brown
Nancy D. Browne
Elizabeth M. Burban
Anthony Cammarata, Jr.
David C. Carlebach
Donald J. Casturo
James R. Charnley
Martin Cher
Elena Ciallie
Matthew J. Clark
Scott Coleman
Ann S. Costello
Elizabeth Cottam
Jeffrey F. Daly
Debora J. Daskivich
Michael C. Dawley
Ahmad B. Deek
Karl M. Devine
Jamal Dhanani
Aidan P. Dunn
Laurent M. Dupeyron
William J. Elliott
Zubin P. Irani
Kevin M. Jordan
James P. Kenney
Steven E. Kent
Yasuro K. Koizumi
Robert A. Koort
Tak Sing Kenneth Kwok
Brian J. Lahey
Jonathan A. Langer
Hugh J. Lawson
Cham Chung Ken Lee
Ronald Lee
Deborah R. Leone
Thomas R. Lynch
Peter J. Lyon
Aadarsh K. Malde
Alexander M. Marshall
Thomas H. Mattox
James P. McCarthy
Dermot W. McDonogh
Olivier F. Meyohas
Scott E. Molin
Arjun N. Murti
Craig J. Nossel
Peter C. Oppenheimer
Lisa L. Parisi
John M. Perlowski
Carol V. Pledger
Gilberto Pozzi
Krishna S. Rao
Louisa G. Ritter
Lisa A. Rotenberg
Pamela S. Ryan
Josephine Scesney
Clare R. Scherrer
Vivian C. Schneck-Last
John A. Sebastian
Peter A. Seccia
Peter D. Selman
Heather K. Shemilt
Kunihiko Shiohara
Gavin Simms
Alec P. Stais
Laurence Stein
Patrick M. Street
Morgan C. Sze
Thomas D. Teles
Frederick Towfigh
Greg A. Tusar
Philip J. Venables
Alejandro Vollbrechthausen
Eileen M. White
Deborah B. Wilkens
Samuel J. Wisnia
Mark Evans
William J. Fallon
Matthew J. Fassler
Nigel K. Faulkner
Jose M. Fernandez
Wolfgang Fink
Silverio Foresi
Dino Fusco
James R. Garman
Kevin S. Gasvoda
Paul E. Germain
Sarah J. Gray
Jason R. Haas
Edward G. Hadden
Thomas E. Halverson
Eric I. Hamou
Jan Hatzius
Jens D. Hofmann
Laura A. Holleman
Dane E. Holmes
Leo Z. Huang
Robyn A. Huffman
Alastair J. Hunt
Leonid Ioffe
David L. Jasper
Pernille D. Jensen
Arihiro Kanda
Shafiq A. Karmali
Steffen J. Kastner
Stuart A. Katz
Poir-Mok Kee
Christopher M. Keogh
Bjorn P. Killmer
Peter Kimpel
Scott G. Kolar
Annette L. Krassner
Gregory Kuppenheimer
Linda A. LaGorga
Harvey Chi Chung Lee
Joseph B. Lee
Eugene H. Leouzon
Wayne M. Leslie
Kemp J. Lewis
John S. Lindfors
Iain Lindsay
Michael C. Liou
Hugo P. MacNeill
Arline Mann
Andrew A. McEachern
Christopher D. McFadden
Kevin T. McGuire
Thomas J. McLaughlin
Avinash Mehrotra
Jonathan M. Meltzer
143Goldman Sachs 2007 Annual Report
Board Members, Officers and Directors
Christopher Milner
Elizabeth A. Mily
Christina P. Minnis
Cheri S. Mowrey Davison
Yumiko Murakami
Kenichi Nagasu
Tetsuo Naraha
Massimiliano Nardulli
Kiele E. Neas
Ted K. Neely II
Michael L. November
Toru Okabe
Timothy J. O’Reilly
Konstantinos N. Pantazopoulos
Bryant C. Park
Alfredo J. Pastro
Robert D. Patch
Bruce B. Petersen
Cameron P. Poetzscher
Kenneth A. Pontarelli
Vijay C. Popat
Lora J. Price
Lorin P. Radtke
Deepak K. Rao
Buckley T. Ratchford
Luigi G. Rizzo
J. Timothy Romer
Howard M. Rowe
Robert W. Savage
John R. Sawtell
Alexander Schrantz
Paul D. Scialla
Lewis M. Segal
Harvey S. Shapiro
Mark D. Shattan
Adam Sherman
Keith A. Shultis
Suhail A. Sikhtian
Norborne G. Smith III
Ying Ying Glenda So
David Z. Solomon
Robert C. Spofford
Joseph J. Struzziery III
Randolph A. Stuzin
Damian E. Sutcliffe
Robert J. Sweeney
Yozo Tachibana
Adam L. Taetle
Pawan Tewari
J. David Tracy
Terrence P. Travis
Damian J. Valentino
Paul Walker
Alan S. Waxman
Andrew C. Bound
Patricia L. Bowden
John E. Bowman III
Oonagh T. Bradley
Samuel S. Britton
Russell A. Broome
Torrey J. Browder
Derek T. Brown
Samantha R. Brown
Steve M. Bunkin
Mark J. Buono
Charles E. Burrows
Shawn P. Byron
Jason G. Cahilly
Marguarite A. Carmody
Stuart A. Cash
Christopher L. Castello
Nien Tze Elizabeth Chen
Chul Chung
Denis P. Coleman III
Kevin P. Connors
Richard N. Cormack
James V. Covello
Christian P. de Haaij
Mark E. DeNatale
Olaf Diaz-Pintado
Albert F. Dombrowski
Katinka I. Domotorffy
Keith Douglas
Daniel A. Dreyfus
Kirsten A. Dzialga
Henrik G. Ehrnrooth
David P. Eisman
Carl Faker
Stephan J. Feldgoise
Patrick J. Fels
Benjamin W. Ferguson
Samuel W. Finkelstein
Peter E. Finn
Yuji Fujimori
Sean J. Gallagher
Ivan C. Gallegos Rivas
James P. Ganley
Francesco U. Garzarelli
Basil P. Geoghegan
Michelle Gill
Alicia K. Glen
James Gomez
Francisco X. Gonzalez
Jason A. Gottlieb
Maria M. Grant
Christoph Gugelmann
John D. Haase
Mark K. Hancock
Nicholas H. Weber
Dominic A. Wilson
Gavin E. Wilson
Steve Windsor
Martin Wiwen-Nilsson
Yoshihiko Yano
Pei Pei Yu
Mark R. Beveridge
Xing Zhang
Hector E. Negroni
R. Martin Chavez
William T. Howard, Jr.
Mark Perwien
Atosa Moini
Edward Madara III
Stephen J. O’Flaherty
Court E. Golumbic
Alasdair J. Warren
Douglas Borden
Yoshiyuki Hoshino
Howard Fisher
Ian Gilday
Dorothee Blessing
Amar Kuchinad
Marshall Smith
Robert K. Jacobsen
Charles F. Adams
John Chrysikopoulos
Richard A. Kimball, Jr.
Kent D. Daniel
Min Hee Kim
Salvatore Di Stasi
Nancy Gloor
Guy M. du Parc Braham
James C. Wardlaw
Vincent Duhamel
Thomas J. Stein
Farid Pasha
Asif M. Adatia
Nick S. Advani
Sang Gyun Ahn
Analisa M. Allen
Mark A. Allen
Ichiro Amano
Andrea Anselmetti
Lori H. Arndt
Akihiko Asami
Jeffrey D. Barnett
Stephanie K. Bell-Rose
Tracey E. Benford
Gaurav Bhandari
Marc O. Boheim
Vivek Bohra
Ralane F. Bonn
Martin Hintze
Todd Hohman
James P. Houghton
Bradley Hunt
Christopher E. Hussey
Etsuko Kanayama
Hiroyuki Kaneda
Maria Karahalis
Dimitrios Kavvathas
C. Annette Kelton
Scott E. Kilgallen
John J. Kim
James A. King
Hideki Kinuhata
Michael E. Koester
John N. Kolz
Christopher P. Lalli
Lori A. Lancaster
Roy I. Lapidus
Geoffrey C. Lee
Laurent Lellouche
Jesse H. Lentchner
John R. Levene
Bradford S. Levy
Terence M. Lim
Hao Cheng Liu
Lindsay P. LoBue
Joseph W. Macaione
Ian W. MacLeod
David M. Marcinek
Marvin Markus
Roger C. Matthews, Jr.
Thomas F. Matthias
F. Scott McDermott
John J. McGuire, Jr.
Sean T. McHugh
Carolina Minio-Paluello
James G. Mitchell
David R. Mittelbusher
Bryan P. Mix
Timothy A. Morgan
Junko Mori
Takashi Murata
Massoud Mussavian
Amol S. Naik
Basant Nanda
Michael T. Nartey
Chiang-Ling Ng
Junya Nishiwaki
Masatomo Odagawa
Tosa Ogbomo
Mitsunari Okamoto
Husnu H. Okvuran
San W. Orr III
144 Goldman Sachs 2007 Annual Report
Board Members, Officers and Directors
Peter J. Ort
Jennifer A. Padovani
Fred B. Parish, Jr.
Martin A. Pennay
Nicholas W. Phillips
Louis Piliego
Michelle H. Pinggera
M. Louise Pitt
James F. Radecki
Richard N. Ramsden
Shlomi Raz
Carl J. Reed
Andrew D. Richard
Scott A. Romanoff
Michael J. Rost
David T. Rusoff
Ankur A. Sahu
Guy E. Saidenberg
Julian C. Salisbury
Brian J. Saluzzo
David A. Schwimmer
David D. Seeberan
Nobuhiko Seki
Rebecca M. Shaghalian
Magid N. Shenouda
Hiroyuki Shimizu
Julian F. Simon
Michael L. Simpson
Barry Sklar
Jeremy S. Sloan
Jeffrey E. Sockwell
Mark R. Sorrell
John D. Storey
Jonathan W. Summers
Ram K. Sundaram
Tatsuya Suzuki
Michael J. Swenson
Joseph D. Swift
Henry Seiichi Takata
Jasper Tans
Eric N. Tavel
Cory W. Thackeray
Klaus B. Toft
Jeffrey M. Tomasi
David G. Torrible
Naoki Toyoizumi
John H. Tribolati
Suzette M. Unger
Leo J. Van Der Linden
Lai Kun Judy Vas Chau
Simone Verri
Paul E. Vigilante
Toby C. Watson
Andrew J. Weisz
Gail Kreitman
Enrique Del Rio
Iain N. Drayton
Fadi Abuali
Kevin L. Adams
Elif A. Aktug
Christian S. Alexander
David Z. Alter
Vincent L. Amatulli
Rajesh Amin
Koral Anderson
Stephen Arnold
Kulbir S. Arora
Omar M. Asali
Ramaz A. Ashurov
Paul E. Bachman
Andrew J. Bagley
Mustafa Bagriacik
Susan E. Balogh
Jennifer A. Barbetta
Ali K. Bastani
Gerard M. Beatty
Henry Becker, Jr.
Roger S. Begelman
Oliver B. Benkert
Avanish R. Bhavsar
Joshua S. Birnbaum
Christopher E. Blume
Shane M. Bolton
Peter V. Bonanno
William C. Bousquette, Jr.
Patrick T. Boyle
Stephen Branton-Speak
Simon A. Bregazzi
Emmanuel Bresson
Benjamin R. Broadbent
Janet A. Broeckel
William E. Burgess
Trevor R. Busche
Richard J. Butland
Jon Butler
Joseph A. Camarda
Roy E. Campbell II
John H. Chartres
Martin E. Chavez
Henry L. Chen
Hong Lum Julian Cheong
Alex S. Chi
Steven N. Cho
Han Ching Choong
Gary W. Chropuvka
Teresa Clarke Ellis
Jesse H. Cole
Brian M. Coleman
Teresa M. Wilkinson
Oliver C. Will
Joel M. Wine
Andrew E. Wolff
Jennifer O. Youde
Thomas G. Young
Han Song Zhu
Lauren J. Zucker
Hidehiro Imatsu
Wei Zhu
Edin Buturovic
Pekka I. Soininen
Steven A. Mayer
Kenneth N. Murphy
Mitsuo Kojima
Michael T. Smith
Thomas G. Fruge
Kenichiro Yoshida
Clifford D. Schlesinger
Krishnamurthy Sudarshan
Paul A. Bartlett
Maziar Minovi
Steven Ricciardi
Heather Arnold
Tuan Lam
Saad Ashraf
James W. Kilman
Todd E. Eagle
Jess T. Fardella
Simone Russo
Robin Rousseau
Kristin F. Gannon
Charles W. Lockyer
Adam S. Clayton
Christian A. Katz
Stefan Dorfmeister
James H. Sprayregen
Jonathan M. Penkin
Mark R. Etherington
Laurent Bouaziz
Craig W. Packer
David A. George
Michael Rimland
Keith Ackerman
Jeff Abt
Kevin A. Lockhart
Carlos Pertejo
Reza Ali
Dojin Kim
Massimo Della Ragione
Lachlan Edwards
Vesna Nevistic
Rene Mottas
Chang-Po Yang
Cyril Cottu
Timothy Craighead
Joshua C. Critchley
Vijay B. Culas
Giovanni Cutaia
Kyle R. Czepiel
Manda J. D’Agata
Sven Dahlmeyer
John F. Daly
Rajeev R. Das
Michael J. Daum
Alexander Davidovich
Nicola A. Davies
Philip J. Davies
Tracy DeBlieck
Craig M. Delizia
Stacey Ann DeMatteis
Michael Dinias
Christina Drews
Vance M. Duigan
Steven T. Elia
Harry Eliades
Suzanne Escousse
Steven A. Ferjentsik
Carlos Fernandez-Aller
Gregory C. Ferrero
Sarah J. Friar
David A. Friedland
John J. Gauthier
Elizabeth Gilbert
Masaki Gobayashi
John H. Godfrey
Irwin Goldberg
Billy Goldstein
Juan D. Gomez-Villalba
Maria V. Gordon
Roberta M. Goss
Paul Graves
Philip W. Grovit
Jonathan J. Hall
Dylan S. Halterlein
Greger C. Hamilton
Magnus C. Hardeberg
Norman A. Hardie
Kandace K. Heck
Ali G. Hedayat
Joanna Hislop
Ryan H. Holsheimer
Harold P. Hope III
Gregory P. Hopper
Ericka T. Horan
Joanne Howard
Alison J. Howe
Stephanie Hui
145Goldman Sachs 2007 Annual Report
Board Members, Officers and Directors
Paul Humphreys
Irfan S. Hussain
Kota Igarashi
Tsuyoshi Inoue
Katsuhiro Ishikawa
Makoto Ito
Kathleen Jack
Matthew A. Jaume
Tanweer Kabir
Christian Kames
Raymond W. Kamrath
Afwa D. Kandawire
Nicola S. Kane
Henry Wen-Herng King
Andrew J. Kleeger
Herman R. Klein Wassink
Edward C. Knight
Akiko Koda
Ravi G. Krishnan
Jorg H. Kukies
Shiv Kumar
Svetlana Kurilova
Edwin Wing-Tang Kwok
David W. Lang
Nyron Z. Latif
Wai-Yen Vivian Lau
Matthew D. Leavitt
David A. Lehman
James E. Levine
Leland Lim
Alexander G. Loosley
David B. Ludwig
John H. Ma
Aedan M. MacGreevy
Raghav Maliah
Matthew F. Mallgrave
Edith Mandel
Karim H. Manji
Scott D. Marchakitus
Fabio N. Mariani
Ramnek S. Matharu
Shogo Matsuzawa
Thomas C. Mazarakis
Patrick S. McClymont
Graeme E. McEvoy
John E. McGarry
Shane McKenna
Penny A. McSpadden
Celine-Marie G. Mechain
Justin E. Metz
Takashi Mikkaichi
Simon H. Moseley
William E. Muecke
Jeff Mullen
Timothy H. Thornton
Oliver Thym
Ingrid C. Tierens
Nadia Titarchuk
Joseph K. Todd
Mark R. Tolette
Hiroyuki Tomokiyo
Jill L. Toporek
David Townshend
Patrick M. Tribolet
Richard J. Tufft
Michael S. Turok
Klaus Umek
Toshihiko Umetani
John P. Underwood
Thomas S. Vandever
Richard C. Vanecek
Sebastian Varga von Kibed
Massimiliano Veneziani
Kurt J. Von Holzhausen
Nicholas H. von Moltke
Daniel Wainstein
Timothy D. Walding
Fred Waldman
Kevin A. Walker
Daniel S. Weiner
Owen O. West
Alan S. Wilmit
David T. Wilson
Edward C. Wilson
Donna A. Winston
Carinne S. Withey
Christopher D. Woolley
Brendan Wootten
David Tien-Wei Wu
John M. Yae
Haitao Zhai
Richard K. Lyons
Salvatore T. Lentini
Ruibin Meng
Gregg J. Felton
David N. Frechette
Will E. Matthews
Brendan M. McGovern
Shigemitsu Sugisaki
Takashi Yoshimura
James M. Li
Justin J. Pascoe
Drake Pike
Joseph D. Stecher
James W. Wight
Alexander Dubitsky
Xuan Karen Fang
David K. Cheung
Yoshie Naumann
Edward T. Naylor
Scott R. Norby
Graham H. Officer
Hideyuki Fred Omokawa
Maire M. O’Neill
Lisa Opoku
Gerald B. Ouderkirk III
Martin C. Pankau
Charles L. Park
Jae Hyuk Park
Francesco Pascuzzi
Barend M. Pennings
Zara Pratley
Curtis S. Probst
Lisa Rabbe
Jeffrey Rabinowitz
Lawrence J. Restieri, Jr.
Lloyd S. Reynolds
Samuel D. Robinson
Philippa A. Rogers
Michael E. Ronen
Adam C. Rosenberg
Wendy E. Sacks
Ricardo Salaman
Thierry Sancier
David J. Santina
Kara Saxon
Ian M. Schmidek
Paul E. Schurman
Steven M. Schwartz
Stephen B. Scobie
Devesh P. Shah
Judith L. Shandling
Adrianne W. Shapira
Graham P. Shaw
Hazem A. Shawki
Steven R. Sher
Justin W. Slatky
Radford Small
Ian G. Smith
Ramsey D. Smith
Robert A. Sorrell
Raghu Srinivasan
Kevin M. Sterling
Robert M. Suss
J. Richard Suth
Yusuke Takahashi
Daiki Takayama
Tin Hsien Tan
Renaud Tartanson
Megan M. Taylor
Richard J. Taylor
Maria Teresa Tejada
Douglas R. Manchester
Matthew C. Schwab
Stephen Graham
Khaled Eldabag
Leonard Brooks III
Keith Tuffley
Nobuaki Miyatake
Julie A. Harris
Takeshi Yamamoto
William L. Blais
Alla Gil
Michael S. Swell
Sarakorn Gerjarusak
Tamim H. Al-Kawari
John C. Shaffer
Timothy F. Vincent
Ana C. Cabral
Ronald S. Kent
Damien Liebaut
William F. Spoor
Erich Bluhm
David G. McDonald
Ezra Nahum
Dina H. Powell
Anthony Gutman
Steve Sang Yong Park
Peter C. Russell
Celeste J. Tambaro
Michael M. Furth
James P. Kelly
Andrew Wilkinson
Eric M. Kirsch
Gregory P. Lee
Alexis Maged
Peter Scaturro
Wai Cheong Shum
Randall L.J. Yasny
Jason B. Mollin
Robert M. Pulford
Osamu Nakajima
Linda Koster
Paul A. Craven
Filippo Cartiglia
Miriam T. Esteve
Maximillian C. Justicz
Adriano C. Piccinin
John G. Bruno
Patrick Tassin de Nonneville
Gabriel Perahia
Diego E. Ferro
David M. Inggs
Kenneth J. Newcombe
James M. Karp
Shirish B. Godbole
146 Goldman Sachs 2007 Annual Report
Board Members, Officers and Directors
Chetan Bhandari
Edward B. Droesch
Timothy J. Talkington
Daniel J. Bingham
Sergei S. Stankovski
Jonathan R. Symonds
Kyu Sang Cho
Ji Hyung Lee
Robert Son
Andre H. du Plessis
Gerald Messier
Steven Tulip
David R. Cukierman
Konstantinos Skouras
Clark B. Winter
Andrea Vella
Serge Marquie
Clarke D. Adams
Matthew A. Grayson
Karl J. Robijns
Jeff R. Stolz
Timothy Callahan
Markus L. Aakko
Yotaro Agari
Julian C. Allen
Joanne L. Alma
Nicholas Alston
Quentin Andre
Alexandra J. Anido
Sergei Arsenyev
Aaron M. Arth
George Assaly
Arun J. Assumall
Victoria J. Attwood Scott
Jean-Baptiste Aussourd
Ian T. Bailey
Vivek J. Bantwal
Michael H. Bartsch
Philip G. Beatty
Caroline R. Benton
Philip R. Berlinski
Neeti Bhalla
Brian W. Bolster
Timothy J. Bowler
Sharon A. Bradley
Lawrence S. Brandman
C. Kane Brenan
Kristin L. Breuss
Michael J. Buchanan
Donna Burns
Stephen P. Byrne, Jr.
Roberto Caccia
Francesco Cafagna
Michael A. Cagnassola
Jean-Christophe Germani
Donald G. Gervais, Jr.
Tamilla F. Ghodsi
Brad D. Gillman
Federico J. Gilly
Marc C. Gilly
John L. Glover III
David J. Goldburg
Melissa Goldman
Edward J. Goldthorpe
Mark R. Gordon
Richard C. Govers
Bennett Grau
Bradley J. Gross
Franz A. Hall
Patrick P. Hargreaves
Arni G. Hauksson
Vicky M. Hayes
Michael L. Hensch
Steven P. Herrup
Ning Hong
Douglas Horlick
Pierre Hudry
Jonathan O. Hughes
Yuji Ito
Brian J. Jacoby
Andrius Jankunas
Dominique M. Jooris
Rajiv K. Kamilla
Brian A. Kane
Hun Sok Kang
Amna Karim
Vijay M. Karnani
Noriko Kawamura
Dirk-Jan J. Keijer
William P. Keirstead
Shuya Kekke
Prashant R. Khemka
Vivien Khoo
Tammy A. Kiely
Jisuk Kim
Lee Guan Kelvin Koh
Masafumi Koike
Tsui-Li Kok
Qing Ying Kong
Vanessa L. Koo
Satoshi Kubo
Lewis S. Kunkel
Shane M. Lanoway
Jan K. Laubjerg
Eddie Siu Wah Law
Edward J. Lawrence
Kim M. Lazaroo
Scott L. Lebovitz
Alfredo A. Capote
Christian H. Carl
Jimmy R. Carlberg
Glen T. Casey
Chia-Lin Chang
Christian Channell
Westley D. Chapman
Eva Chau
Yves Checoury
David Chou
Thalia Chryssikou
Charles J. Citro
Michael J. Civitella
Luke E. Clayton
Ira H. Cohen
Remi Colinmaire
Kathleen A. Connolly
John G. Creaton
Cecile Crochu
Gavin S. Da Cunha
Lauren Dang
Anne Marie B. Darling
Paul S. Davies
Andrew K. Davilman
Bruno P. De Kegel
Matthew P. DeFusco
Daniel Deng
Thomas Deng
Jeffrey L. Dodge
Jonathan G. Donne
William P. Douglas
Andrew J. Duke
Mary L. Dupay
Alessandro Dusi
Mark S. Edwards
Babak Eftekhari
Jonathan M. Egol
Akishige Eguchi
Halil Emecen
Andre Eriksson
Kazunobu Ezawa
Thomas D. Ferguson
David P. Ferris
Jonathan H. Fine
David A. Fox
Karen A. Frank
Jay A. Friedman
Timothy Gallagher
Ramani Ganesh
Maria Paola Garbarino
Huntley Garriott
Belinda S. Gaynor
Maksim Gelfer
Gabe E. Gelman
Geoffery Y.A. Lee
Edward T. Lees
David A. Levy
Xiang Li
Jie Lian
Hong Liang
Dirk L. Lievens
Dimitri Linde
Philip G.W. Lindop
Michael W. Linse
David B. Lischer
Stephen I. Lucas
Patrick O. Luthi
Rory A. MacFarquhar
Whitney C. Magruder
Suneil Mahindru
Christoffer L. Malmer
Monica M. Mandelli
Richard M. Manley
Nicole Martin
Joseph S. Mauro
Matthew D. McAskin
Matthew B. McClure
Christina M. McFarland
Carolyn E. McGuire
Grainne McNamara
Joseph J. McNeila
Sandeep Mehta
Francesco Mele
Jack Mendelson
Xavier C. Menguy
Lance M. Meyerowich
Rodney B. Miller
Jason Moo
Karim Moussalem
Grant R. Moyer
Gersoni A. Munhoz
Michael Nachmani
Kazuya Nagasawa
Kazuma Naito
Rishi Nangalia
Allison F. Nathan
Dario Negri
Emmanuel P. Niogret
Chris Oberoi
Dimitri Offengenden
Jun Ohama
Gregory G. Olafson
Beverly L. O’Toole
Daniel A. Ottensoser
Edward S. Pallesen
Yanis Papagiannis
Dave S. Park
Anthony W. Pasquariello
147Goldman Sachs 2007 Annual Report
Board Members, Officers and Directors
Jignesh Patel
Sandeep H. Patel
Nirubhan Pathmanabhan
Mark A. Patterson
Richard A. Peacock
Vincent Shen Peng
Antonio R. Pereira
Peter J. Perrone
James R. Peters
Marco Piccioni
James F. Powell
Luis Puchol-Plaza
Sumit Rajpal
Padideh N. Raphael
Peggy D. Rawitt
Kathleen M. Redgate
Donald C. Reed
Mark G. Retik
James H. Reynolds
Sean D. Rice
Robert E. Ritchie
Scott M. Rofey
Jeroen Rombouts
Brice M. Rosenzweig
Denis R. Roux
Chiel Ruiter
John M. Ruth
Douglas L. Sacks
Vikram P. Sahu
Yann Samuelides
Laura D. Sanchez
Sunil Sanghai
Luke A. Sarsfield III
Andrei M. Saunders
Richard A. Schafrann
Oliver Schiller
Martin A. Schneider
Gabriel T. Schwartz
Michael T. Seigne
Konstantin A. Shakhnovich
Richard Shannon
Wenbo Shao
Daniel A. Sharfman
Song Shen
Jonathan M. Sheridan
James Roger Francis Shipton
Faryar Shirzad
Connie J. Shoemaker
Anna K. Skoglund
Andrew J. Smith
Courtney B. Smith
Ronny Soemitro
Bing Song
Jonathan E.H. Sorrell
Rafael I. de Fex
John M. Draghi
Mary Pang
Joseph M. Demarest
Bertram N. Spence
Ken Sugimoto
James Kin Kong Sun
Steve Sun
Aurora J. Swithenbank
Hidekazu Tani
Carl H. Taniguchi
Sulian M. Tay
Mark J. Taylor
Ryan J. Thall
Robert B. Thompson
Terence Ting
Jacquelyn G. Titus
Mark C. Toomey
Kenneth A. Topping
Pamela C. Torres
Ronald Trichon, Jr.
Kenro Tsutsumi
Stellar K. Tucker
Peter van der Goes, Jr.
Damien R. Vanderwilt
Ram S. Venkateswaran
Vincenzo Volpe
Gerard N. Von Dohlen, Jr.
Christoph von Reiche
Elizabeth S. Wahab
Sherif J. Wahba
John M. Wang
Zhixue Josh Wang
Michael L. Warren
Haruko Watanabe
Russell J. Watson
Simon R. Watson
Douglas C. Weaver
Vivien Webb Wong
Peter A. Weidman
Karl D. Wianecki
Rory L. Wilfork
Gavin A. Wills
Steven D. Winegar
Kenneth Hong Kit Wong
Stephen T.C. Wong
Xin Xia
Shunichi Yamada
Kentaro Yamagishi
Raymond L. Yin
Ka Yan Wilfred Yiu
Hisaaki Yokoo
Hsin Yue Yong
Sergei Zhiltsov
George F. Travers
Frank Richter
Jack B. Navarro
Vinit Sahni
148 Goldman Sachs 2007 Annual Report
Directors, Advisors and Offices
Advisory Directors
George M. Ross
Eric S. Dobkin
Jonathan L. Cohen
William C. Landreth
Alan A. Shuch
Robert E. Higgins
Carlos A. Cordeiro
Lawrence H. Linden
Pieter Maarten Feenstra
Timothy G. Freshwater
Frederic E. Steck
Mark Tracey
Paul S. Efron
Patrick J. Ward
Matthew G. L’Heureux
Anthony Lauto
Hsueh Sung
Robert J. Pace
Peter D. Sutherland KCMG
Chairman of Goldman Sachs
International
Board of
International Advisors
Ambassador Eduardo Aninat
Dr. Thomas Bär
Dr. Diethart Breipohl
Efthymios Christodoulou
Keki Dadiseth
Charles de Croisset
Guillermo de la Dehesa
Vladimír Dlouhý
Walter W. Driver Jr.
Oscar Fanjul
Jaime García-Parra
Lord Griffiths of Fforestfach
Professor Victor Halberstadt
Professor Otmar Issing
Dr. Gianni Letta
Klaus Luft
Jacques Mayoux
Mario Monti
Karel van Miert
Dr. Ludolf v. Wartenberg
Charles Curran, A.C.
Ian Macfarlane, A.C.
International Advisors to
Goldman Sachs JBWere
Senior Directors
John C. Whitehead
H. Frederick Krimendahl II
George E. Doty
Donald R. Gant
James P. Gorter
Robert B. Menschel
Robert E. Mnuchin
Sidney J. Weinberg, Jr.
Thomas B. Walker, Jr.
Richard L. Menschel
Eugene Mercy, Jr.
Stephen B. Kay
Robert N. Downey
Roy J. Zuckerberg
Robert M. Conway
David M. Silfen
Eugene V. Fife
Peter G. Sachs
Willard J. Overlock, Jr.
Mark O. Winkelman
John R. Farmer
Robert J. Katz
Robin Neustein
Robert S. Kaplan
Robert Hurst
Peter M. Sacerdote
Suzanne M. Nora Johnson
Eric S. Schwartz
Offices
Atlanta
Auckland*
Bangalore
Bangkok
Beijing
Boston
Buenos Aires
Calgary
Chicago
Dallas
Doha
Dubai
Dublin
Frankfurt
Geneva
George Town
Hong Kong
Houston
Jersey City
Johannesburg
London
Los Angeles
Madrid
Melbourne*
Mexico City
Miami
Milan
Moscow
Mumbai
New York
Paris
Philadelphia
Princeton
Salt Lake City
San Francisco
São Paulo
Seattle
Seoul
Shanghai
Singapore
Stockholm
Sydney*
Taipei
Tampa
Tel Aviv
Tokyo
Toronto
Washington, D.C.
Zurich
*Goldman Sachs JBWere
149Goldman Sachs 2007 Annual Report
Shareholder Information
SEC Certifications
The certifications by the Chief Executive Officer and the Chief
Financial Officer of The Goldman Sachs Group, Inc., required
under Section 302 of the Sarbanes-Oxley Act of 2002, have been
filed as exhibits to the firm’s 2007 Annual Report on Form 10-K.
NYSE Certification
In April 2007, the Chief Executive Officer of The Goldman Sachs
Group, Inc. made an unqualified certification to the NYSE
with respect to the firm’s compliance with the NYSE corporate
governance listing standards.
Transfer Agent and Registrar for Common Stock
Questions from registered shareholders of The Goldman Sachs
Group, Inc. regarding lost or stolen stock certificates, dividends,
changes of address and other issues related to registered share
ownership should be addressed to:
Mellon Investor Services LLC
480 Washington Boulevard
Jersey City, New Jersey 07310
U.S. and Canada: 1-800-419-2595
International: 1-201-680-6541
www.melloninvestor.com
Independent Registered Public Accounting Firm
PricewaterhouseCoopers LLP
PricewaterhouseCoopers Center
300 Madison Avenue
New York, New York 10017
Executive Offices
The Goldman Sachs Group, Inc.
85 Broad Street
New York, New York 10004
1-212-902-1000
www.gs.com
Common Stock
The common stock of The Goldman Sachs Group, Inc.
is listed on the New York Stock Exchange and trades under
the ticker symbol “GS.”
Shareholder Inquiries
Information about the firm, including all quarterly earnings
releases and financial filings with the U.S. Securities and Exchange
Commission, can be accessed via our Web site at www.gs.com.
Shareholder inquiries can also be directed to Investor
Relations via email at gs-investor-relations@gs.com or by calling
1-212-902-0300.
2007 Annual Report on Form 10-K
Copies of the firm’s 2007 Annual Report on Form 10-K as filed
with the U.S. Securities and Exchange Commission can be accessed
via our Web site at www.gs.com/shareholders/.
Copies can also be obtained by contacting Investor
Relations via email at gs-investor-relations@gs.com or by calling
1-212-902-0300.
The cover, narrative and financial papers utilized in the printing of this Annual
Report are certified by the Forest Stewardship Council, which promotes
environmentally appropriate, socially beneficial and economically viable
management of the world’s forest. These papers contain a mix of pulp that
is derived from FSC certified well-managed forests; post-consumer recycled
paper fibers and other controlled sources. Cenveo Anderson Lithograph’s FSC
“Chain of Custody” certification is SCS-COC-00533.
Goldman Sachs employed a printer for the production of this Annual Report that
produces all its own electricity and is a certified “totally enclosed” facility that
releases virtually no volatile organic compound emissions to the atmosphere.
© 2008 The Goldman Sachs Group, Inc. All rights reserved.
Except where specifically defined, the terms “Goldman Sachs,” “firm,” “we,”
“us” and “our” in this document may refer to The Goldman Sachs Group, Inc. and/
or its subsidiaries and affiliates worldwide, or to one or more of them, depending
on the context in each instance. Except where otherwise noted, all marks indicated
by ®, TM, or SM are trademarks or service marks of Goldman, Sachs  Co. or
its affiliates.
Photo of Alex Rodriguez © New York Yankees
Photo of Bovespa © Antonio Carreiro
4350-07-102
18%
Cert no. SCS-COC-00533
150 Goldman Sachs 2007 Annual Report
Every day,
we see unique opportunities for growth — 
for our clients and for Goldman Sachs. With
expanding markets and growing capital flows, in
countries around the world, amidst constantly
shifting conditions, we see new potential and new
challenges.
As long-term growth and global finance continue
to transform economies even in challenging
circumstances, capital markets will play an
increasingly vital role as people, capital and ideas
come together in new ways. Goldman Sachs
helps allocate capital and manage risk, and thus
helps foster entrepreneurship, drive efficiency
and encourage economic reform.
As this year’s report illustrates, our clients’
aspirations and the risks they take drive change.
Clients fund strategic initiatives, build new
businesses and strengthen existing ones.
They look for new ways to improve investment
performance and take advantage of the
opportunities that arise every day.
1
Our clients’ interests always come first. Our experience shows
that if we serve our clients well, our own success will follow.
2
Our assets are our people, capital and reputation. If any of these
is ever diminished, the last is the most difficult to restore. We are
dedicated to complying fully with the letter and spirit of the laws,
rules and ethical principles that govern us. Our continued success
depends upon unswerving adherence to this standard.
3
Our goal is to provide superior returns to our shareholders.
Profitability is critical to achieving superior returns, building our
capital, and attracting and keeping our best people. Significant
employee stock ownership aligns the interests of our employees
and our shareholders.
4
We take great pride in the professional quality of our work.
We have an uncompromising determination to achieve excellence
in everything we undertake. Though we may be involved in a
wide variety and heavy volume of activity, we would, if it came
to a choice, rather be best than biggest.
5
We stress creativity and imagination in everything we do.
While recognizing that the old way may still be the best way, we
constantly strive to find a better solution to a client’s problems.
We pride ourselves on having pioneered many of the practices
and techniques that have become standard in the industry.
6
We make an unusual effort to identify and recruit the very best
person for every job. Although our activities are measured in
billions of dollars, we select our people one by one. In a service
business, we know that without the best people, we cannot be
the best firm.
7
We offer our people the opportunity to move ahead more rapidly
than is possible at most other places. Advancement depends on
merit and we have yet to find the limits to the responsibility our
best people are able to assume. For us to be successful, our men
and women must reflect the diversity of the communities and
cultures in which we operate. That means we must attract, retain
and motivate people from many backgrounds and perspectives.
Being diverse is not optional; it is what we must be.
8
We stress teamwork in everything we do. While individual
creativity is always encouraged, we have found that team effort
often produces the best results. We have no room for those
who put their personal interests ahead of the interests of the firm
and its clients.
9
The dedication of our people to the firm and the intense
effort they give their jobs are greater than one finds in most
other organizations. We think that this is an important part
of our success.
10
We consider our size an asset that we try hard to preserve. We
want to be big enough to undertake the largest project that
any of our clients could contemplate, yet small enough to maintain
the loyalty, the intimacy and the esprit de corps that we all
treasure and that contribute greatly to our success.
11
We constantly strive to anticipate the rapidly changing needs
of our clients and to develop new services to meet those needs.
We know that the world of finance will not stand still and that
complacency can lead to extinction.
12
We regularly receive confidential information as part of our
normal client relationships. To breach a confidence or to use
confidential information improperly or carelessly would be
unthinkable.
13
Our business is highly competitive, and we aggressively seek to
expand our client relationships. However, we must always be fair
competitors and must never denigrate other firms.
14
Integrity and honesty are at the heart of our business. We expect
our people to maintain high ethical standards in everything
they do, both in their work for the firm and in their personal lives.
The Goldman Sachs Business Principles
goldman sachs
2007 annual report
We See Opportunity
www.gs.com
WESEEOPPORTUNITYgoldmansachs2007annualreport

goldman sachs 2007 Annual Report

  • 1.
    goldman sachs 2007 annualreport We See Opportunity www.gs.com WESEEOPPORTUNITYgoldmansachs2007annualreport
  • 2.
    Every day, we seeunique opportunities for growth —  for our clients and for Goldman Sachs. With expanding markets and growing capital flows, in countries around the world, amidst constantly shifting conditions, we see new potential and new challenges. As long-term growth and global finance continue to transform economies even in challenging circumstances, capital markets will play an increasingly vital role as people, capital and ideas come together in new ways. Goldman Sachs helps allocate capital and manage risk, and thus helps foster entrepreneurship, drive efficiency and encourage economic reform. As this year’s report illustrates, our clients’ aspirations and the risks they take drive change. Clients fund strategic initiatives, build new businesses and strengthen existing ones. They look for new ways to improve investment performance and take advantage of the opportunities that arise every day. 1 Our clients’ interests always come first. Our experience shows that if we serve our clients well, our own success will follow. 2 Our assets are our people, capital and reputation. If any of these is ever diminished, the last is the most difficult to restore. We are dedicated to complying fully with the letter and spirit of the laws, rules and ethical principles that govern us. Our continued success depends upon unswerving adherence to this standard. 3 Our goal is to provide superior returns to our shareholders. Profitability is critical to achieving superior returns, building our capital, and attracting and keeping our best people. Significant employee stock ownership aligns the interests of our employees and our shareholders. 4 We take great pride in the professional quality of our work. We have an uncompromising determination to achieve excellence in everything we undertake. Though we may be involved in a wide variety and heavy volume of activity, we would, if it came to a choice, rather be best than biggest. 5 We stress creativity and imagination in everything we do. While recognizing that the old way may still be the best way, we constantly strive to find a better solution to a client’s problems. We pride ourselves on having pioneered many of the practices and techniques that have become standard in the industry. 6 We make an unusual effort to identify and recruit the very best person for every job. Although our activities are measured in billions of dollars, we select our people one by one. In a service business, we know that without the best people, we cannot be the best firm. 7 We offer our people the opportunity to move ahead more rapidly than is possible at most other places. Advancement depends on merit and we have yet to find the limits to the responsibility our best people are able to assume. For us to be successful, our men and women must reflect the diversity of the communities and cultures in which we operate. That means we must attract, retain and motivate people from many backgrounds and perspectives. Being diverse is not optional; it is what we must be. 8 We stress teamwork in everything we do. While individual creativity is always encouraged, we have found that team effort often produces the best results. We have no room for those who put their personal interests ahead of the interests of the firm and its clients. 9 The dedication of our people to the firm and the intense effort they give their jobs are greater than one finds in most other organizations. We think that this is an important part of our success. 10 We consider our size an asset that we try hard to preserve. We want to be big enough to undertake the largest project that any of our clients could contemplate, yet small enough to maintain the loyalty, the intimacy and the esprit de corps that we all treasure and that contribute greatly to our success. 11 We constantly strive to anticipate the rapidly changing needs of our clients and to develop new services to meet those needs. We know that the world of finance will not stand still and that complacency can lead to extinction. 12 We regularly receive confidential information as part of our normal client relationships. To breach a confidence or to use confidential information improperly or carelessly would be unthinkable. 13 Our business is highly competitive, and we aggressively seek to expand our client relationships. However, we must always be fair competitors and must never denigrate other firms. 14 Integrity and honesty are at the heart of our business. We expect our people to maintain high ethical standards in everything they do, both in their work for the firm and in their personal lives. The Goldman Sachs Business Principles
  • 3.
    objectives are oftenmultifaceted and difficult to execute. Solutions to their complex problems can create significant value for corporations, investors and the societies they serve. Goldman Sachs advises, finances and invests in client initiatives in both well-established and emerging economies. We operate at the center of the global markets, offering clients products and services that help them manage and take advantage of the unique opportunities they face. Our people and the culture they represent are the foundation of our ability to create value for clients. Teamwork, integrity and a daily commitment to excellence are the hallmarks of our culture. In 2007, clients both new and long-standing, in markets both emerging and well-established, have valued Goldman Sachs’ deep understanding of the ever- changing global markets as a source of advice and outstanding execution. Our clients’ 1Goldman Sachs 2007 Annual Report
  • 4.
    Lloyd Blankfein, Chairmanand Chief Executive Officer
  • 5.
    In last year’sletter, we discussed Goldman Sachs’ performance within the context of favorable market and economic conditions. We also said that our job is to plan for markets and conditions that won’t always be as benign. While the first half of 2007 was largely characterized by a positive operating environment, the latter half of the year saw significant turbulence across global markets. Despite these more difficult conditions, Goldman Sachs produced very strong performance for the year because of the talent and dedication of our people, a culture of teamwork and a deep and broad client franchise. In 2007, net revenues increased 22 percent to $46.0 billion and net earnings rose 22 percent to $11.6 billion. Diluted earnings per common share were $24.73, an increase of 26 percent from $19.69 for the previous year. Our return on average common shareholders’ equity was 32.7 percent. The firm also returned $9 billion of capital to shareholders by repurchasing 41 million shares of our common stock. Book value per common share increased 25 percent during 2007, and has grown from $20.94 at the Fellow Shareholders: 3Goldman Sachs 2007 Annual Report Gary D. Cohn, President and Co-Chief Operating Officer Jon Winkelried, President and Co-Chief Operating Officer 3Goldman Sachs 2007 Annual Report
  • 6.
    end of ourfirst year as a public company in 1999 to $90.43, a compounded annual growth rate of 20 percent over this period. As we have stated before, our business does not lend itself to predictable earnings. However, over the long term, we are committed to the goal of providing our shareholders with returns on equity at or near the top of our industry while continuing to grow book value and earnings per share. In this year’s letter, we will discuss some of the changes that financial markets are undergoing and how the firm’s institutional strengths help us to respond to these changes. In particular, we want to highlight what we believe to be the differentiating element of Goldman Sachs — our culture — and how it infuses our approach to risk management and client service. While the value of “culture” may not lend itself to empirical analysis, we know that it is the bedrock of our financial performance. The Credit Cycle During the last several years, the global economy has benefited from a number of developments. The global integration of markets and economies, the rise of emerging markets, the growth of private pools of capital and the ability of central banks to combat inflation coalesced to help make capital historically cheap. A world awash in liquidity led to an influx of investments across different asset classes and markets. We saw significant increases in real estate prices, for instance, and a growing role for financial sponsors in global MA. Significant value was being created, but many were asking if a credit bubble was taking shape. Not surprisingly, the broad availability of credit had implications on the pricing of risk. As capital flows increased around the world, the search for excess yield drove credit spreads down to unprecedented levels. The tightness in credit spreads, extraordinarily low default rates and the run-up in housing prices in the U.S. and much of Europe simply were not sustainable. In hindsight, it seems easy to identify precisely what happened. In the day-to-day management of our business, identifying a bubble and calling its exact end is much more difficult. As the number one global adviser in MA, we are also a significant financier of many of the largest corporate transactions. As a co-investor with our clients, we are active in private equity and real estate investing. In our mortgage business, we price assets and structure securities for institutions and other large investors. Our strong market share comes, in part, from the fact that we are active in these and other markets, and because we are willing to assume risk on behalf of our clients. But, at the same time, when conditions deteriorate, losses are unavoidable. And in the course of the year, we were not immune to them. The Strength of our Client Franchise Some commentators have speculated that our overall performance was due to a few so-called smart bets to mitigate losses. The fact is that we have a diverse set of businesses and no single business or trading opportunity dictated our performance. What drove performance was the quality of our client franchise. To us, franchise describes the extent to which clients come to us for advice, execution and, sometimes, partnership. And through these relationships, business opportunities are made available to the firm. In Investment Banking, we have a broad franchise that serves corporations, financial sponsors, institutions and governments. In the last year, we advised on each of the five largest sponsor transactions. When conditions became more difficult over the summer, clients sought us out as an advisor in challenging situations they faced — for example, Countrywide, Home Depot Supply and, in connection with Northern Rock, the U.K. Treasury, the Bank of England and the Financial Services Authority. During the same period, we priced an $896 million equity offering for Apollo Management on our innovative GSTrUE platform, which we developed earlier in the year. GSTrUE pioneered the offering and trading of privately placed securities, bringing 4 Goldman Sachs 2007 Annual Report
  • 7.
    the liquidity ofan exchange with the flexibility of a private placement. We are proud that GSTrUE will be integrated into The PORTAL  Alliance — an industry-wide platform for the trading of unregistered securities. Investment Banking remains the front end of our growing franchise. This is particularly true within the context of our principal investing activity. The majority of our principal investing opportunities are sourced through our client franchise as clients seek us out as a co-investor and other principals seek us out as partners. And while retaining our leadership position in global MA, we also launched merchant banking funds with aggregate commitments of $50 billion during the year. In our Securities businesses, we are, first and foremost, a market maker. We price assets, manage risk and execute transactions on behalf of our clients. This was particularly visible during the many tumultuous trading days during the summer. On some occasions, our U.S. shares trading platforms processed over two billion shares a day, more than double our average volume. We also experienced record customer activity in our credit, rates and currency businesses, not only during the summer, but for much of the year. In our Asset Management business, we manage $868 billion in total assets under management. In the last year alone, we attracted inflows of $161 billion. Our ability to offer clients access to a broad range of investment strategies, from active equity to private equity fund of funds, to plain vanilla fixed income and money market products has been a key differentiating factor. There are, however, important areas for us to continue to address. Like many others in the quantitative fund space, we have had issues with the performance of certain of our quantitative funds. We know that we disappointed our clients in those funds, and, we are focused on learning from this past year’s events. In addition, direct quantitative hedge funds represent only five percent of our assets under management, and we realize the importance of expanding our product portfolio in actively managed strategies. Our Stake in the Global Economy Each of our businesses benefits from a number of different factors or trends — from the development of products and instruments to specific market dynamics. All of our businesses, however, will continue to be positively driven by the global integration of economies and markets. In 2007, our pre-tax earnings outside the U.S. exceeded 50 percent for the first time. In a seminal research piece that coined the term “BRICs,” we identified early on the breakout potential of the high-growth countries of Brazil, Russia, India and China. Historically, however, we have not built much physical infrastructure in the emerging markets. That changed in the last two years as we opened offices in Mumbai, Moscow, São Paulo, Dubai, Doha and Tel Aviv. We are also making strategic investments in these markets. We are currently negotiating a strategic alliance in Saudi Arabia with NCB Capital, the securities arm of National Commercial Bank, the largest bank in the Middle East. We have invested over $1 billion in India and plan to invest more. And we have recently acquired an asset management platform in South Korea with $7 billion in assets under management to further develop our distribution capabilities in the region. The next step for us is to build out our securities capabilities in these growth markets. In Brazil, we are now licensed to do onshore fixed income activities. In Russia, we have built a platform to trade both cash equity and fixed income products and select over-the-counter derivative products. In India, we have cash, futures and options capabilities. In China, we can trade cash products through Gao Hua Securities Company Limited, our joint venture partner. And in South Korea, we received our banking license, which allows us to offer a broader range of products to our clients. We continue to see more opportunities in these and other developing markets. Globally, Private Wealth Management (PWM) also represents a significant opportunity for the firm, and we are determined to grow our footprint. 5Goldman Sachs 2007 Annual Report
  • 8.
    While important asa revenue source in its own right, our PWM business connects us with a growing class of entrepreneurs around the world, who not only benefit from our private banking skills, but also rely upon our investment banking and securities expertise. We have made key management hires in PWM and are developing onshore capabilities in China and Brazil. We are expanding our Swiss banking capabilities to grow our offshore franchise in important markets. We also have GS Bank USA, an industrial loan corporation in the U.S., and a fully operational bank in Ireland to augment our global private banking platform. Our strategy of being an advisor, financier and investor is proving especially effective as we expand globally. Although we are relatively new to some of these markets, we have been able to win important mandates because of the attraction of our model, the strength of our reputation and our commitment to the local region. For example, we opened offices in Dubai and Mumbai in 2007 and were #2 in announced MA in both the Middle East and India. This is all part of a broader strategy of identifying high-growth areas around the world and building our franchise in tandem with these economies. Our Culture Our ability to perform rests on a shared passion for teamwork, integrity and excellence. Teamwork is not an abstract goal, but a reality. It allows us to complement an individual’s skills and expertise with those of his or her colleagues to provide exceptional client service across different parts of the firm. Our people are also results-driven and measure their effectiveness by the successes of our clients. Culture is a difficult concept to define, but we believe it is what truly differentiates Goldman Sachs. Goldman Sachs’ partnership ethos still runs throughout the firm. This mentality creates a sense of ownership of the firm’s capital, risk and profitability at all levels. We have over 30,000 employees, but we try every day to make the firm feel smaller. Whether we communicate with people divisionally, regionally or at the senior leadership level, we reinforce the same values. Each person at Goldman Sachs is a steward of our legacy and the culture it represents. One example of this is The Chairman’s Forum. For the past year, the three of us conducted over 30 half- day sessions in the U.S., Europe and Asia with every Managing Director (MD) to talk about his or her role in advancing our client franchise. We spent more time on this initiative than any other. Given the fact that our MDs set the tone throughout the firm, there were few more important ways to invest our time. The firm also imbues a sense of partnership through our compensation process. We take a comprehensive view on performance versus one limited to individual results. While individual performance matters, everyone’s pay is dependent on how Goldman Sachs performs overall. People are incentivized to act in a way that supports the firm as a whole and not to be parochial about their specific division or business unit. Ultimately, our success depends on the quality of the people we attract and retain. We spend enormous amounts of time on these issues. It begins with recruiting. At Goldman Sachs, everyone from our junior to our most senior people commits time and focus to our recruiting efforts. Our Management Committee members have participated in nearly 80 recruiting events over the last year. The priority we place on recruiting is one reason why more than 80 percent of the offers we extended globally to under- graduates and graduates in 2007 were accepted. Once they come into the firm, our people expect ongoing training and development. Within GS University, there are over 2,400 online and classroom courses. Ninety percent of our people participated — completing 950,000 hours of training during the year. Our people also expect to have a broad range of experiences over the course of their careers. Many of us, including most of our senior leadership, have worked in multiple divisions and in multiple regions. 6 Goldman Sachs 2007 Annual Report
  • 9.
    Even after peopleleave Goldman Sachs, they still tend to identify with our firm and we foster that connection. In the last two years, we have held 15 events for alumni in the U.S., Europe and this year, Asia. Over 50 percent of our retired partners have attended at least one event and nearly 12,000 former GS professionals have registered on our alumni web site. In October 2006, we held an alumni event in London and over 1,000 people attended. We have a rich history and tradition, and we invest in it. Our alumni help us recruit, participate in volunteer activities and come back to speak to our people. In many cases, they are also clients of the firm. Not only does all of this help validate our culture, it provides a real, tangible value that transcends any single generation. Good people hire good people. Through this process, the feeling of ownership is passed on. Our culture is self-sustaining and self-perpetuating. Risk Management Not surprisingly, the culture of our firm anchors our approach to risk management. That approach is characterized by accountability, escalation and communication. A large part of this discipline is represented in the marking process, which assigns value to a position based on its currently traded market price. We believe that rigorous mark- to-market accounting for financial instruments is fundamental to prudent management because it facilitates a clear view of risk. It allows us to manage market risk limits, monitor exposure to credit risk and manage our liquidity requirements. Effective risk management is demanding and often difficult, but it lies at the heart of the management of a financial institution, and, we believe it is a core competence that helps define Goldman Sachs. We also put great value in our firmwide committees such as the Risk Committee, which monitors financial risk; the Commitments Committee, which looks at our underwriting and distribution activities; the Capital Committee, which focuses on credit extension; and the Business Practices Committee, which reviews operational and reputational risk. These committees create a system of checks and balances that encourage communication between people in both control and business positions and, when necessary, the speedy escalation of a potential issue. Over one-half of the members of our firmwide committees have worked in two or more divisions. And the average tenure at the firm of committee members is 17 years. More broadly, we place great importance on communication between revenue and control areas. This translates into a constant flow of risk reports, and the end result is a better understanding of the risks we are taking. Closely related to communication and escalation is accountability. People have to feel responsible for the decisions they make, and for the decisions their subordinates make. If we suffer a credit loss, the relevant business is not absolved of the consequences simply because the risk was approved by the Credit department. Taken together, all flow into one another: communication encourages escalation and escalation reinforces accountability. Because we are in the business of assuming risk on behalf of our clients, we know we will have losses from time to time. That’s why it is important to give people the confidence and support to stay committed to those businesses during difficult times. Our appetite for risk taking is central to our ability to accomplish our clients’ objectives and to be profitable. But our appetite is calibrated by balancing potential risk and reward as market conditions shift and evolve and meaningful opportunities ebb and flow. Clearly, market conditions can change abruptly. We must never forget that risk is just that — risk, with all its consequences. Goldman Sachs Gives Another important part of our culture is philanthropy and service. We are proud that so many of our people support hundreds of non-profit organizations around the world, serving on the boards of educational institutions, charities and environmental organizations. Earlier this year, building on Goldman Sachs’ long tradition of philanthropy, we announced one of our most significant philanthropic initiatives to date. 7Goldman Sachs 2007 Annual Report
  • 10.
    In launching GoldmanSachs Gives, a donor-advised fund, the firm’s partners agreed to commit a part of their overall compensation to charitable organizations. Individual accounts have been established within Goldman Sachs Gives for participating partners, who will recommend charitable organizations as recipients, thereby diversifying the overall philanthropy of our firm and our people. In addition, the firm made a separate contribution to Goldman Sachs Gives. Through the collective generosity of our people, we expect that Goldman Sachs Gives will grow to more than $1 billion over the next few years and will become a significant source of dedicated charitable funds. This important initiative will provide a meaningful way for our people to increase their current support of non-profit organizations around the world. Looking Ahead Some may characterize culture and the attributes we described above as soft issues. To us, our culture sustains our client franchise and reputation. In that sense, it is a tangible driver of our performance. The relative strength of our franchise can sometimes be masked by generally favorable markets. The second half of the year’s more difficult conditions, we believe, highlighted the depth and breadth of our client franchise. Conditions across various markets remain challenging. Our industry is a cyclical one with little predictability in the short term. As a firm that operates in the center of the global economy, we grow at a multiple of GDP growth and are directly affected by the macroeconomic environment. It is important to remember that, given our stake in the global economy, the recent pace of earnings growth simply is not sustainable. However, over the longer term, we remain optimistic that secular growth trends, notably the rise of the BRICs and the evolution of markets and instruments, will play to the strengths of our businesses and allow us to grow our franchise. Behind the hard numbers of financial performance is an internal set of shared values at Goldman Sachs. These values fuel a culture of teamwork and the rigor of our risk management. We will make our fair share of mistakes and we will experience losses. Guaranteed. However, we manage our business over the long term and we believe that the cultural attributes of Goldman Sachs will continue to enable us to generate strong returns for our shareholders. Lloyd C. Blankfein Chairman and Chief Executive Officer Jon Winkelried President and Co-Chief Operating Officer Gary D. Cohn President and Co-Chief Operating Officer 8 Goldman Sachs 2007 Annual Report
  • 11.
    Financial Highlights Asof or for the Year Ended November ($ and share amounts in millions, except per share amounts) 2007 2006 2005 Operating Results Net revenues Investment banking $    7,555 $   5,629 $   3,671 Trading and principal investments 31,226 25,562 16,818 Asset management and securities services 7,206 6,474 4,749 Total net revenues 45,987 37,665 25,238 Pre-tax earnings 17,604 14,560 8,273 Net earnings 11,599 9,537 5,626 Net earnings applicable to common shareholders 11,407 9,398 5,609 Common Share Data Diluted earnings per common share $    24.73 $   19.69 $   11.21 Average diluted common shares outstanding 461.2 477.4 500.2 Dividends declared and paid per common share $     1.40 $    1.30 $    1.00 Book value per common share (1) 90.43 72.62 57.02 Tangible book value per common share (2) (3) 78.88 61.47 46.76 Ending stock price 226.64 201.60 134.12 Financial Condition and Other Operating Data Total assets $1,119,796 $838,201 $706,804 Other secured financings (long-term) 33,300 26,134 15,669 Unsecured long-term borrowings 164,174 122,842 84,338 Total shareholders’ equity 42,800 35,786 28,002 Leverage ratio (4) 26.2x 23.4x 25.2x Adjusted leverage ratio (5) 17.5x 16.1x 17.9x Debt to equity ratio (6) 3.8x 3.4x 3.0x Return on average common shareholders’ equity (7) 32.7% 32.8% 21.8% Return on average tangible common shareholders’ equity (8) 38.2% 39.8% 26.7% Selected Data Total employees 30,522 26,467 23,623 Assets under management (in billions) $      868 $    676 $    532 (1) Book value per common share is based on common shares outstanding, including restricted stock units granted to employees with no future service requirements, of 439.0 million, 450.1 million and 460.4 million as of November 2007, November 2006 and November 2005, respectively. (2) Tangible book value per common share is computed by dividing tangible common shareholders’ equity by the number of common shares outstanding, including restricted stock units granted to employees with no future service requirements. (3) Tangible common shareholders’ equity equals total shareholders’ equity less preferred stock, goodwill and identifiable intangible assets, excluding power contracts. See “Financial Information — Management’s Discussion and Analysis — Equity Capital — Capital Ratios and Metrics” for further information regarding our calculation of tangible common shareholders’ equity. (4) Leverage ratio equals total assets divided by total shareholders’ equity. (5) Adjusted leverage ratio equals adjusted assets divided by tangible equity capital. See “Financial Information — Management’s Discussion and Analysis — Equity Capital — Capital Ratios and Metrics” for further information regarding adjusted assets, tangible equity capital and our calculation of the adjusted leverage ratio. (6) Debt to equity ratio equals unsecured long-term borrowings divided by total shareholders’ equity. (7) Return on average common shareholders’ equity is computed by dividing net earnings applicable to common shareholders by average monthly common shareholders’ equity. (8) Return on average tangible common shareholders’ equity is computed by dividing net earnings applicable to common shareholders by average monthly tangible common shareholders’ equity. See “Financial Information — Management’s Discussion and Analysis — Results of Operations — Financial Overview” for further information regarding our calculation of return on average tangible common shareholders’ equity.
  • 12.
    10 Goldman Sachs2007 Annual Report
  • 13.
    We see opportunity Inextending our reach bovespa Holding S.A. In 2007, Goldman Sachs made a series of significant commitments to building our presence in Brazil. We established a bank and supported the management team with important new hires and transfers. We have built upon our long history as one of the country’s premier MA advisors to become a diversified provider of products and services, including Fixed Income, Currency and Commodities, Asset Management, Research, Principal Investing, Corporate Finance and Equities. In 2007, we participated as the lead bookrunner in the country’s largest recorded IPO for Bovespa Holding, which controls the São Paulo Stock Exchange. The IPO was the culmination of over a year of working as an exclusive advisor to Bovespa Holding during its demutualization and preparation to become a publicly traded entity. In preparation for the IPO, Goldman Sachs worked with the Bovespa Holding management board to develop a profile that would appeal to a broad base of international investors. Key to the success of the offering was helping them demonstrate how their evolving culture supported the financial disclosure, compliance and independent board oversight practices expected by the global investment community. Our commitment throughout the process, from the demutualization to the pricing of the IPO, is an important factor in our efforts to grow our franchise in new markets through strong client relationships and innovative services. 11Goldman Sachs 2007 Annual Report
  • 14.
    12 Goldman Sachs2007 Annual Report
  • 15.
    We see opportunity Inleading innovation GSTrUE Successful companies may find themselves needing capital to meet strategic objectives, such as funding further growth, but not wanting to list on an exchange as a publicly traded company. Potential investors are always looking for strong opportunities, but also value the liquidity and pricing transparency that a trading market can provide. In 2007, Goldman Sachs took several steps to help create a platform where issuers and qualified institutional investors can trade restricted Rule 144A equity securities. In May 2007, we launched Goldman Sachs Tradable Unregistered Equity (GSTrUE). The inaugural issue was an over $1 billion offering for Los Angeles-based Oaktree Capital Management, and was followed by an $896 million offering for Apollo Management. The GSTrUE platform is notable, among other things, for its innovative method of tracking settled trades to ensure the total number of shareholders meets regulatory guidelines. The platform provides the traditional benefits of being public — access to capital, liquidity, pricing transparency and support for a longer‑term business model. The creation of this kind of platform can also enhance the dialogue between issuers and a group of qualified investors. In October, Goldman Sachs helped broaden this market for 144A equity listings by working with NASDAQ and 11 other securities firms to create The PORTAL Alliance. The PORTAL Alliance will be accessible to all eligible participants and will further benefit both investors and issuers. 13Goldman Sachs 2007 Annual Report
  • 16.
    We see opportunity Inbuilding global businesses GE PLASTICS In late 2006, General Electric Company (GE) engaged Goldman Sachs to help identify strategic solutions for its plastics business. GE Plastics was one of the largest industrial divisions within GE, and had been a critical part of the company for decades. However, when the increased volatility of raw material costs began impacting earnings, GE sought a partner with the strategic profile to maintain and grow an already sizeable business. Goldman Sachs worked closely with GE to define its objectives, the strengths of its plastics business and the reason for its unique value to a number of potential partners. Goldman Sachs helped GE to conclude that the optimal transaction would most likely be a sale of GE Plastics, and helped coordinate an accelerated process involving a diverse group of potential buyers from multiple geographic regions. As the largest public company in Saudi Arabia with significant growth plans in its core operations, Saudi Basic Industries Corporation (SABIC) emerged as the best potential owner of GE Plastics. Combining SABIC’s low-cost polycarbonate manufacturing capabilities and access to low-cost raw materials with GE Plastics’ globally recognized brands, unparalleled access to the industry’s most important customers and market-leading product- development skills helped create a new global market leader in high-performance plastics, renamed SABIC Innovative Plastics. Goldman Sachs understood the value of GE Plastics and was able to find the right buyer to grow the business. With our help, GE quickly completed the deal at an attractive valuation while navigating complex market conditions and a challenging financial market. The sale of GE Plastics to SABIC for $11.6 billion represented the largest divestiture in the chemicals sector and one of the largest divestitures in GE’s history. 14 Goldman Sachs 2007 Annual Report
  • 17.
    15Goldman Sachs 2007Annual Report
  • 18.
    16 Goldman Sachs2007 Annual Report
  • 19.
    We see opportunity Innew relationships icici Bank Limited ICICI Bank Limited has established itself as one of the financial leaders of the fast growing Indian economy. To fund its growth, ICICI selected Goldman Sachs to lead manage its $4.9 billion equity offering —  the largest equity offering in history by an Indian issuer. This complex transaction entailed simultaneous domestic and international tranches. In addition to its responsibilities as joint bookrunner, Goldman Sachs served as lead bank for regulatory processes and international marketing. The marketing exercise included a four-day global road show with over 80 meetings with a broad range of sophisticated investors including domestic and international mutual funds, pension funds, hedge funds and private equity investors. ICICI’s confidence in Goldman Sachs, and the success of this large and complex transaction, were particularly gratifying as it came only six months after we received our merchant banking license in India. This confidence was further reiterated when ICICI also selected Goldman Sachs to lead manage its $2 billion offering of senior notes. This transaction was a testament to Goldman Sachs’ commitment to building strong relationships in India by delivering a full range of products and services to our clients. 17Goldman Sachs 2007 Annual Report
  • 20.
    18 Goldman Sachs2007 Annual Report
  • 21.
    We see opportunity Inevery step Taiwan Semiconductor Manufacturing Company Limited The Goldman Sachs approach in Asia mirrors its practice in the U.S. and Europe — a focus on developing long-term client relationships that promote both the client’s growth and ours. In this dynamic market, Goldman Sachs has pursued the model of building relationships with high-quality companies at the beginning of their life cycle where our experience and expertise can make an immediate impact. Our relationship with Taiwan Semiconductor Manufacturing Company Limited (TSMC) is a perfect example. Since leading their first international equity offering over 10 years ago, Goldman Sachs has played a role in virtually every significant market transaction TSMC has undertaken, totaling over $12 billion. At the beginning of 2007, Goldman Sachs worked with TSMC and Royal Philips Electronics (Philips), a significant TSMC stockholder, to devise a plan to facilitate an orderly disposal of TSMC shares by Philips. In a multiphased plan announced in March 2007, Goldman Sachs first executed a $1.75 billion block trade with domestic Taiwanese institutions, then successfully marketed a follow-on offering of secondary shares totaling $2.56 billion, and finally advised on the buyback of $1.5 billion of TSMC shares. 19Goldman Sachs 2007 Annual Report
  • 22.
    20 Goldman Sachs2007 Annual Report
  • 23.
    We see opportunity Incomplex restructurings and lasting solutions Eurotunnel Group Eurotunnel developed and operates two rail tunnels below the English Channel, connecting the United Kingdom and France. Since opening in the spring of 1994, Eurotunnel has transported 212 million passengers and 195 million tonnes of merchandise. However, as a result of overly optimistic revenue projections and construction cost overruns, Eurotunnel carried an unsustainable debt burden. After a series of temporary restructurings, the Eurotunnel Group was seeking a permanent solution. Combining expertise from our Infrastructure Investment Group, Investment Banking and distressed debt trading teams, Goldman Sachs approached Eurotunnel to discuss potential solutions. In an extremely complex transaction, Goldman Sachs worked collaboratively with Eurotunnel and existing creditors to provide a number of cash and partial cash alternatives to accelerate the restructuring process. This included involvement by numerous creditors, multiple financial advisors, the French and U.K. governments, and specialty monoline insurance companies. In the end, Goldman Sachs and bank partners funded £2.84 billion in new capital, replacing the existing £6.2 billion in debt. In addition to the cash, creditors received convertible debt bonds totaling £1.3 billion. Post-closing, total Eurotunnel assets increased significantly in value and the company is conservatively capitalized for the first time since construction. 21Goldman Sachs 2007 Annual Report
  • 24.
    22 Goldman Sachs2007 Annual Report
  • 25.
    We see opportunity Inenvironmentally responsible transactions TXU CORPORATION In 2007, Goldman Sachs joined an investor group including Kohlberg Kravis Roberts Co. (KKR) and the Texas Pacific Group (TPG) to acquire the TXU Corporation, the largest power generator in Texas. The transaction represents the largest leveraged buyout in U.S. history with a total value of $44 billion. Our cross-functional team of professionals from Investment Banking, the Financing Group, Credit Products, Commodities and our Center for Environmental Markets helped execute the transaction and related financing in the midst of turbulent markets and a high-profile public debate. Goldman Sachs served as financial advisor, led the largest corporate high-yield financing in history and created an innovative commodity risk management program to support the acquisition. The transaction was notable for the rigor of the environmental debate that preceded it and ultimately shaped the outcome. A strong and sustained public outreach campaign was key to building legislative and public support for the transaction. Thanks to the leadership of KKR, TPG, Environmental Defense, the National Resources Defense Council, Goldman Sachs and others, the parties reached an agreement to substantially limit future carbon emissions. Specifically, the number of planned coal plants has been reduced from 11 to three. In addition, under new ownership, TXU doubled its energy efficiency investment, strengthened its environmental policies and is making significant investments in alternative energy. 23Goldman Sachs 2007 Annual Report
  • 26.
    24 Goldman Sachs2007 Annual Report
  • 27.
    We see opportunity Indeveloping creative solutions Marmon Holdings, Inc. The Pritzker Family of Chicago has been a long-standing client of Goldman Sachs. Most recently, they asked us to help analyze strategic options for Marmon Holdings, Inc., one of their significant investments. An international grouping of more than 125 manufacturing and service businesses, Marmon has achieved impressive growth and profitability, and is well positioned to continue that success. Indeed, part of the family’s objective was to continue to participate in the company’s growth. Rather than recommend a public auction, Goldman Sachs advised the Pritzkers that there was one strategic buyer whose objectives in the transaction would be a perfect complement to the Pritzkers’ —  Berkshire Hathaway. Based on our experience working with Berkshire Hathaway, we had a good sense of what its concerns would be, and were able to develop a proposal that appealed to both buyer and seller. Following the distribution of substantial cash and other assets to the selling shareholders, Berkshire Hathaway will acquire 60% of Marmon for $4.5 billion. The remaining 40% will be acquired in stages over the next five to six years, priced on the basis of future earnings. In the words of Tom Pritzker, Marmon’s Chairman, “Pre-existing relationships infused the transaction with credibility and an understanding of the common ground that allows a deal to be made . Goldman Sachs was more than involved — they were committed.” 25Goldman Sachs 2007 Annual Report
  • 28.
    We see opportunity Innegotiating a common ground Alex Rodriguez Goldman Sachs’ relationship with the New York Yankees dates to 2001. The following year, together we launched what would become the #1 most watched regional sports network in the country, the YES Network. The deal marked one of the largest private equity investments at the time, and the beginning of an ongoing relationship with the Yankees. As a result of this relationship, Alex Rodriguez approached Goldman Sachs in November of 2007 to explore options for resuming a dialogue with the Yankees after opting out of his contract. Goldman Sachs worked to help both parties find their common ground after negotiations had stalled. After facilitating the conversation, Goldman Sachs brought its negotiations expertise to bear in helping to define the terms of the deal — a $275 million contract over the course of 10 years, keeping Rodriguez with the Yankees for the duration of his career. The deal reflects the firm’s leading Business Principle of putting clients’ interests first. Goldman Sachs is committed to its relationship with the Yankees and is the lead financial advisor for their new stadium due to open in April of 2009. 26 Goldman Sachs 2007 Annual Report
  • 29.
    27Goldman Sachs 2007Annual Report
  • 30.
    Clients turn tothe people of Goldman Sachs for advice on a range of strategic, financial and business issues. Integrity, expertise and an ability to deliver the entire intellectual capital of our global firm are attributes that make people successful within the Goldman Sachs culture while making them trusted advisors to our clients. We maintain decades-long advisory relationships with some of the most important corporations and governments around the world. Our Investment Banking teams provide insight across products, industries and regions. Clients may turn to us to structure effective hedging strategies, orchestrate a cross-border merger or handle the sale of a subsidiary. Regardless of assignment, clients can expect the same level of expert advice and commitment to their needs that have made us the leading merger advisor globally every year since 1997. Our global Investment Strategy Group (ISG) is an excellent example of our approach to advising investing clients. Serving many of the world’s largest and most sophisticated investors, ISG professionals offer global expertise in areas such as strategic asset allocation, tactical asset allocation and active risk budgeting. Clients have turned to us with issues related to investment policy, economic and financial forecasting and alpha-focused investment portfolios. Advice is at the core of our interaction with every client, every day around the world. We See Opportunity in The Face of Advising top New York Left to Right Charles P. Himmelberg Global Investment Research Ramiro E. Menchaca Fixed Income, Currency and Commodities Stephanie Cohen Investment Banking Miyuki Matsumoto Investment Management center left London Left to Right Amir Levy Investment Management Ashwin T. Jacob Equities Luca Ferrari Investment Banking Sarah C. Lawlor Fixed Income, Currency and Commodities center right Tokyo Left to Right Midori Ezoe Investment Banking Channa Jayaweera Investment Management Krishnan Sankaran Technology Akio Shima Operations Hiroko Imaeda Equities bottom Hong Kong Left to Right Angel Young Investment Management Kenneth K. Hui Investment Management Stephanie Leung Global Investment Research Ricky Ho Technology Janet Kong Investment Management 28 Goldman Sachs 2007 Annual Report
  • 32.
    We work closelywith clients to create financing solutions that meet their objectives. The options for meeting clients’ financing needs have expanded dramatically in recent years as markets evolve and as we create new products and services. Professionals from every part of the firm are actively engaged in helping our institutional and individual clients meet their increasingly global financing needs. Our Financing Group teams work closely with corporate clients, pension funds, financial sponsors and governments to structure and execute complex financing and risk management solutions. Drawing upon expertise from across the firm, solutions may include equity, debt, derivatives, structured finance and leveraged finance. Regardless of the financing instrument, the Financing Group leverages Goldman Sachs’ brand and strength in the global markets to achieve outstanding results for our clients. Our Investment Management Division has responded to client demand by creating private banking services through Goldman Sachs Bank USA and Goldman Sachs Bank (Europe) plc. As a result, our advisory teams are able to help our Private Wealth Management clients better manage their finances with a wide variety of loan products to finance investments and other client activities, as well as deposit products and payment services. We See Opportunity in The Face of Financing 30 Goldman Sachs 2007 Annual Report
  • 33.
    With the growthof the hedge fund community, our financing business has expanded over the past 10 years to better serve this client base. An industry leader, our prime brokerage team helps hedge fund clients at every stage of development. As part of this service, our financing professionals work closely with their clients to deliver tailored lending solutions. Across the firm, and in markets around the world, client demand for financing solutions from Goldman Sachs is increasing. Whether it be for specialty lending products, financing solutions for the energy industry or credit solutions for individual investors, our financing specialists around the world are actively engaged in helping clients achieve their goals. left New York Left to Right Vivek Bantwal Investment Banking Kenneth Springer Operations Christina Minnis Investment Banking center London Left to Right Matt Seager Operations Elizabeth Gilbert Investment Banking Lachlan Edwards Investment Banking top right Tokyo Left to Right Junko Hamamoto Investment Banking Masahiro Ehara Operations Jessica Wright Operations Jun Ohama Investment Banking bottom right Hong Kong Left to Right Julianne Lee Operations Udhay Furtado Investment Banking Jie Lian Investment Banking 31Goldman Sachs 2007 Annual Report
  • 34.
    Our clients regardGoldman Sachs people as disciplined and experienced global investors. Clients work with us because of the breadth of our product offering, the quality of our advice and our commitment to helping clients grow their wealth. Our Principal Investing business is integral to our firmwide strategy and has created significant long- term value for our investing clients and shareholders. The benefit of our co-investing capabilities continues to grow, reflecting the expansion of our client base to include more international and middle-market companies. Often, these companies are seeking more than our advice — they desire our commitment through direct co-investment. In the Investment Management Division, we have tapped some of the best talent from inside and outside the firm to offer institutional and individual investors access to a growing range of investment products. A team of highly skilled investment professionals from our proprietary investing business in the Securities businesses recently moved into Asset Management to provide clients access to a new, broader range of alternative investment opportunities. We have hired into the firm exceptional external managers, such as the team that has launched the Liberty Harbor group, to create new investment programs for our clients. And in our Private Equity Group, we offer clients access to a strong selection of global external diversified funds of funds, structured portfolios and liquidity solutions. With a strong position in the global markets and access to the most significant issuers and investors, our investment teams have established a strong track record of success for our clients. Our culture of teamwork and the global perspective of our people make us confident that clients will continue to value our investing expertise. top Hong Kong Left to Right Priscilla Mok Operations Benson Lu Fixed Income, Currency and Commodities Jenny Sun Equities center left London Left to Right Gabriel Möllerberg Investment Management Heather Mulahasani Merchant Banking Cedric Choffat Equities center right Tokyo Left to Right Eiji Shibata Merchant Banking Yoko Nakahama Technology Shinya Matsuguma Fixed Income, Currency and Commodities bottom New York Left to Right Farai Mtetwa Technology A. Ewa Kozicz Equities Gerry Cardinale Merchant Banking Jennifer A. Barbetta Investment Management We See Opportunity in The Face of Investing 32 Goldman Sachs 2007 Annual Report
  • 36.
    The face ofour culture reflects 158 nationalities and 106 languages. Although they have diverse experiences and skills, the people of Goldman Sachs share a set of values that creates our unique culture of excellence. Our culture is what sets us apart from other firms. It is what earns us our reputation, helps define our brand and makes Goldman Sachs a rewarding place to work. It is a culture that expects the best from all of us in professional expertise, personal integrity and innovative spirit. Our people have a passion for results, an inspiration to lead and a desire to work with the best and the brightest in business, government and the non-profit sector. Ours is a culture that rewards individuals who do not merely accept change but welcome it as a chance to expand the scope of their talent and imagination. Our 14 Business Principles codify our culture. At the heart of this framework for how we conduct ourselves and our business is the confidence our clients place in us each and every day. While the concept of client service may seem elementary, we believe it is an area that requires continual renewal as our clients’ needs evolve and become increasingly multi-faceted. This was the focus of our 2007 Chairman’s Forum. The Chairman’s Forum is a topical forum for the firm’s Managing Directors. In 2007, Chairman and CEO Lloyd Blankfein personally led over 1,700 of the firm’s Managing Directors through more than 30 small group sessions that focused on the firm’s strategy and the central role of our client franchise. We See Opportunity in The Face of Our Culture 34 Goldman Sachs 2007 Annual Report
  • 37.
    Programs like TheChairman’s Forum underscore the personal stake each of us has in maintaining our culture, and the emphasis we place on leadership through teamwork. We realize that honoring the culture that has sustained us for 139 years is not enough. We must renew that culture in a rapidly changing world. And most importantly, we must live it day by day. left Lloyd Blankfein leading a Chairman’s Forum session top center Left to Right Gavin O’Connor Finance Edith Cooper Equities Stacy Bash-Polley Fixed Income, Currency and Commodities bottom center Left to Right R. Martin Chavez Fixed Income, Currency and Commodities Kaysie Uniacke Investment Management Jeff Schroeder Finance top right Left to Right Liz Beshel Finance Steve Strongin Global Investment Research Lisa Shalett Global Compliance Tracy Wolstencroft Investment Banking center right Left to Right Steve Scopellite Technology Robin Vince Operations Clare Scherrer Investment Banking bottom right Left to Right Eiji Ueda Fixed Income, Currency and Commodities Miho Kusaka Technology Yoshiaki Hashimoto Investment Banking 35Goldman Sachs 2007 Annual Report
  • 38.
    $ 7,206 $ 6,474 $ 4,749 Asset Management and SecuritiesServices Net Revenues (in millions) 05 06 07 Goldman Sachs is a leading global investment banking, securities and investment management firm that provides a wide range of services worldwide to a substantial and diversified client base that includes corporations, financial institutions, governments and high-net-worth individuals. Our activities are divided into three segments: Investment Banking We provide a broad range of investment banking services to a diverse group of corporations, financial institutions, investment funds, governments and individuals. Trading and Principal Investments We facilitate client transactions with a diverse group of corporations, financial institutions, investment funds, governments and individuals and take proprietary positions through market making in, trading of and investing in fixed income and equity products, currencies, commodities and derivatives on these products. In addition, we engage in market-making and specialist activities on equities and options exchanges and clear client transactions on major stock, options and futures exchanges worldwide. In connection with our merchant banking and other investing activities, we make principal investments directly and through funds that we raise and manage. Asset Management and Securities Services We provide investment advisory and financial planning services and offer investment products (primarily through separately managed accounts and commingled vehicles, such as mutual funds and private investment funds) across all major asset classes to a diverse group of institutions and individuals worldwide and provide prime brokerage services, financing services and securities lending services to institutional clients, including hedge funds, mutual funds, pension funds and foundations, and to high-net-worth individuals worldwide. 05 06 07 $ 7,555 $ 5,629 $ 3,671 Investment Banking Net Revenues (in millions) $ 31,226 $ 25,562 $ 16,818 Trading and Principal Investments Net Revenues (in millions) 05 06 07 36 Goldman Sachs 2007 Annual Report
  • 39.
    Financial Information — Table ofContents Management’s Discussion and Analysis Introduction . . . . . . . . . . . . . . . . . . . . . . . . . . . . . . . . . . . . . . . . . . . . . . . . . . . 38 Executive Overview . . . . . . . . . . . . . . . . . . . . . . . . . . . . . . . . . . . . . . . . . . . 38 Business Environment . . . . . . . . . . . . . . . . . . . . . . . . . . . . . . . . . . . . . . . . . 39 Certain Risk Factors That May Affect Our Business . . . . . . . . 41 Critical Accounting Policies . . . . . . . . . . . . . . . . . . . . . . . . . . . . . . . . . . . 43   Fair Value . . . . . . . . . . . . . . . . . . . . . . . . . . . . . . . . . . . . . . . . . . . . . . . . . . . 43   Goodwill and Identifiable Intangible Assets . . . . . . . . . . . . . . . 48 Use of Estimates . . . . . . . . . . . . . . . . . . . . . . . . . . . . . . . . . . . . . . . . . . . . . . . 50 Results of Operations . . . . . . . . . . . . . . . . . . . . . . . . . . . . . . . . . . . . . . . . . 51   Financial Overview . . . . . . . . . . . . . . . . . . . . . . . . . . . . . . . . . . . . . . . . . 51   Segment Operating Results . . . . . . . . . . . . . . . . . . . . . . . . . . . . . . . . . 55   Geographic Data . . . . . . . . . . . . . . . . . . . . . . . . . . . . . . . . . . . . . . . . . . . 61 Off-Balance-Sheet Arrangements . . . . . . . . . . . . . . . . . . . . . . . . . . . . . 61 Equity Capital . . . . . . . . . . . . . . . . . . . . . . . . . . . . . . . . . . . . . . . . . . . . . . . . . 62 Contractual Obligations and Commitments . . . . . . . . . . . . . . . . . 66 Risk Management . . . . . . . . . . . . . . . . . . . . . . . . . . . . . . . . . . . . . . . . . . . . . 68   Risk Management Structure . . . . . . . . . . . . . . . . . . . . . . . . . . . . . . . . 68   Market Risk . . . . . . . . . . . . . . . . . . . . . . . . . . . . . . . . . . . . . . . . . . . . . . . . 69   Credit Risk . . . . . . . . . . . . . . . . . . . . . . . . . . . . . . . . . . . . . . . . . . . . . . . . . . 73   Derivatives . . . . . . . . . . . . . . . . . . . . . . . . . . . . . . . . . . . . . . . . . . . . . . . . . . 73   Liquidity and Funding Risk . . . . . . . . . . . . . . . . . . . . . . . . . . . . . . . . 76   Operational Risk . . . . . . . . . . . . . . . . . . . . . . . . . . . . . . . . . . . . . . . . . . . 81 Recent Accounting Developments . . . . . . . . . . . . . . . . . . . . . . . . . . . . 82 Management’s Report on Internal Control   over Financial Reporting . . . . . . . . . . . . . . . . . . . . . . . . . . . . . . . . 84 Report of Independent Registered   Public Accounting Firm . . . . . . . . . . . . . . . . . . . . . . . . . . . . . . . . . . 85 Consolidated Financial Statements Consolidated Statements of Earnings . . . . . . . . . . . . . . . . . . . . . . . . . 86 Consolidated Statements of Financial Condition . . . . . . . . . . . . . 87 Consolidated Statements of Changes   in Shareholders’ Equity . . . . . . . . . . . . . . . . . . . . . . . . . . . . . . . . . . . . . 88 Consolidated Statements of Cash Flows . . . . . . . . . . . . . . . . . . . . . . 89 Consolidated Statements of Comprehensive Income . . . . . . . . . 90 Notes to Consolidated Financial Statements Note 1 — Description of Business . . . . . . . . . . . . . . . . . . . . . . . . . . . . . 91 Note 2 — Significant Accounting Policies . . . . . . . . . . . . . . . . . . . . . 91 Note 3 — Financial Instruments . . . . . . . . . . . . . . . . . . . . . . . . . . . . . . . 99 Note 4 — Unsecured Short-Term Borrowings . . . . . . . . . . . . . . . . 110 Note 5 — Unsecured Long-Term Borrowings . . . . . . . . . . . . . . . . 111 Note 6 — Commitments, Contingencies and Guarantees . . . . 113 Note 7 — Shareholders’ Equity . . . . . . . . . . . . . . . . . . . . . . . . . . . . . . . 117 Note 8 — Earnings Per Common Share . . . . . . . . . . . . . . . . . . . . . . 119 Note 9 — Goodwill and Identifiable Intangible Assets . . . . . . . 119 Note 10 — Other Assets and Other Liabilities . . . . . . . . . . . . . . . 121 Note 11 — Employee Benefit Plans . . . . . . . . . . . . . . . . . . . . . . . . . . . 122 Note 12 — Employee Incentive Plans . . . . . . . . . . . . . . . . . . . . . . . . 127 Note 13 — Transactions with Affiliated Funds . . . . . . . . . . . . . . . 130 Note 14 — Income Taxes . . . . . . . . . . . . . . . . . . . . . . . . . . . . . . . . . . . . . 131 Note 15 — Regulation . . . . . . . . . . . . . . . . . . . . . . . . . . . . . . . . . . . . . . . . 133 Note 16 — Business Segments . . . . . . . . . . . . . . . . . . . . . . . . . . . . . . . . 134 Supplemental Financial Information Quarterly Results . . . . . . . . . . . . . . . . . . . . . . . . . . . . . . . . . . . . . . . . . . . . 137 Common Stock Price Range . . . . . . . . . . . . . . . . . . . . . . . . . . . . . . . . . 138 Common Stock Price Performance . . . . . . . . . . . . . . . . . . . . . . . . . . 138 Selected Financial Data . . . . . . . . . . . . . . . . . . . . . . . . . . . . . . . . . . . . . . 139 37Goldman Sachs 2007 Annual Report
  • 40.
    Management’s Discussion andAnalysis Introduction Goldman Sachs is a leading global investment banking, securities and investment management firm that provides a wide range of services worldwide to a substantial and diversified client base that includes corporations, financial institutions, governments and high-net-worth individuals. Our activities are divided into three segments: ■ Investment Banking. We provide a broad range of investment banking services to a diverse group of corporations, financial institutions, investment funds, governments and individuals. ■ Trading and Principal Investments. We facilitate client transactions with a diverse group of corporations, financial institutions, investment funds, governments and individuals and take proprietary positions through market making in, trading of and investing in fixed income and equity products, currencies, commodities and derivatives on these products. In addition, we engage in market-making and specialist activities on equities and options exchanges and clear client transactions on major stock, options and futures exchanges worldwide. In connection with our merchant banking and other investing activities, we make principal investments directly and through funds that we raise and manage. ■ Asset Management and Securities Services. We provide investment advisory and financial planning services and offer investment products (primarily through separately managed accounts and commingled vehicles, such as mutual funds and private investment funds) across all major asset classes to a diverse group of institutions and individuals worldwide and provide prime brokerage services, financing services and securities lending services to institutional clients, including hedge funds, mutual funds, pension funds and foundations, and to high-net-worth individuals worldwide. Unless specifically stated otherwise, all references to 2007, 2006 and 2005 refer to our fiscal years ended, or the dates, as the context requires, November 30, 2007, November 24, 2006 and November 25, 2005, respectively. When we use the terms “Goldman Sachs,” “we,” “us” and “our,” we mean The Goldman Sachs Group, Inc. (Group Inc.), a Delaware corporation, and its consolidated subsidiaries. References herein to the Annual Report on Form 10-K are to our Annual Report on Form 10-K for the fiscal year ended November 30, 2007. In this discussion, we have included statements that may constitute “forward-looking statements” within the meaning of the safe harbor provisions of the Private Securities Litigation Reform Act of 1995. Forward-looking statements are not historical facts but instead represent only our beliefs regarding future events, many of which, by their nature, are inherently uncertain and outside our control. These statements include statements other than historical information or statements of current condition and may relate to our future plans and objectives and results, among other things, and may also include statements about the objectives and effectiveness of our risk management and liquidity policies, statements about trends in or growth opportunities for our businesses and statements about our investment banking transaction backlog. By identifying these statements for you in this manner, we are alerting you to the possibility that our actual results and financial condition may differ, possibly materially, from the anticipated results and financial condition indicated in these forward-looking statements. Important factors that could cause our actual results and financial condition to differ from those indicated in these forward-looking statements include, among others, those discussed below under “— Certain Risk Factors That May Affect Our Business” as well as “Risk Factors” in Part I, Item 1A of the Annual Report on Form 10-K and “Cautionary Statement Pursuant to the Private Securities Litigation Reform Act of 1995” in Part I, Item 1 of the Annual Report on Form 10-K. Executive Overview Our diluted earnings per common share were $24.73 for 2007 compared with $19.69 for 2006. During 2007, we achieved record results in the Americas, Europe and Asia, and derived over one-half of our pre-tax earnings outside of the Americas. Return on average tangible common shareholders’ equity (1) was 38.2% and return on average common shareholders’ equity was 32.7% for 2007. Book value per common share increased 25% to $90.43 at year end. During 2007, we repurchased 41.2 million shares of our common stock for a total cost of $8.96 billion. In 2007, we generated record diluted earnings per common share, which exceeded the prior year record results by 26%. Each of our three segments produced record net revenues. The increase in Trading and Principal Investments reflected higher net revenues in Equities, Fixed Income, Currency and Commodities (FICC) and Principal Investments. Net revenues in Equities increased 33% compared with 2006, reflecting significantly higher net revenues in both our customer franchise businesses and principal strategies. During 2007, Equities operated in an environment characterized by strong customer- driven activity, generally higher equity prices and higher levels of volatility, particularly during the second half of the year. The increase in FICC reflected significantly higher net revenues in currencies and interest rate products. In addition, net revenues in mortgages were higher despite a significant deterioration in the (1) Return on average tangible common shareholders’ equity (ROTE) is computed by dividing net earnings applicable to common shareholders by average monthly tangible common shareholders’ equity. See “— Results of Operations — Financial Overview” below for further information regarding our calculation of ROTE. 38 Goldman Sachs 2007 Annual Report
  • 41.
    Management’s Discussion andAnalysis mortgage market throughout the year, while net revenues in credit products were strong, but slightly lower compared with 2006. Credit products included substantial gains from equity investments, including a gain of approximately $900 million related to the disposition of Horizon Wind Energy L.L.C., as well as a loss of approximately $1 billion, net of hedges, related to non-investment-grade credit origination activities. During 2007, FICC operated in an environment generally characterized by strong customer-driven activity and favorable market opportunities. However, during the year, the mortgage market experienced significant deterioration and, in the second half of the year, the broader credit markets were characterized by wider spreads and reduced levels of liquidity. We continued to capitalize on trading and investing opportunities for our clients and ourselves and, accordingly, our market risk increased, particularly in interest rate and equity products. In addition, our total assets surpassed $1 trillion during the year, as we grew our balance sheet in order to support these opportunities, as well as to support increased activity in Securities Services. The increase in Principal Investments reflected strong results in both corporate and real estate investing. The increase in Investment Banking reflected a 64% increase in Financial Advisory net revenues and a strong performance in our Underwriting business. The increase in Financial Advisory primarily reflected growth in industry-wide completed mergers and acquisitions. The increase in Underwriting reflected higher net revenues in debt underwriting, as leveraged finance activity was strong during the first half of our fiscal year, while net revenues in equity underwriting were strong but essentially unchanged from 2006. Our investment banking transaction backlog at the end of 2007 was higher than it was at the end of 2006. (1) Net revenues in Asset Management and Securities Services also increased. The increase in Securities Services primarily reflected significant growth in global customer balances. The increase in Asset Management reflected significantly higher asset management fees, partially offset by significantly lower incentive fees. During the year, assets under management increased $192 billion, or 28%, to a record $868 billion, including net inflows of $161 billion. In 2008, we will remain focused on our clients, geographic expansion and the importance of effective risk management. We continue to see opportunities for growth in the businesses and geographic areas in which we operate and, in particular, we believe continued expansion of the economies of Brazil, Russia, India and China, as well as those of the Middle East, will offer opportunities for us to increase our presence in those markets. Though we generated particularly strong results in 2007, our business, by its nature, does not produce predictable earnings. Our results in any given period can be materially affected by conditions in global financial markets and economic conditions generally. For a further discussion of the factors that may affect our future operating results, see “— Certain Risk Factors That May Affect Our Business” below as well as “Risk Factors” in Part I, Item 1A of the Annual Report on Form 10-K. Business Environment As an investment banking, securities and investment management firm, our businesses are materially affected by conditions in the financial markets and economic conditions generally, both in the United States and elsewhere around the world. A favorable business environment is generally characterized by, among other factors, high global gross domestic product growth, stable geopolitical conditions, transparent, liquid and efficient capital markets, low inflation, high business and investor confidence and strong business earnings. These factors provide a positive climate for our investment banking activities, for many of our trading and investing businesses and for wealth creation, which contributes to growth in our asset management business. During the first half of 2007, global economic growth was generally solid, inflation remained contained, global equity markets rose and corporate activity levels were strong. However, during the second half of 2007, significant weakness and volatility in global credit markets, particularly in the U.S. and Europe, spread to broader financial markets and began to affect global economic growth. For a further discussion of how market conditions can affect our businesses, see “— Certain Risk Factors That May Affect Our Business” below as well as “Risk Factors” in Part I, Item 1A of the Annual Report on Form 10-K. A further discussion of the business environment in 2007 is set forth below. (1) Our investment banking transaction backlog represents an estimate of our future net revenues from investment banking transactions where we believe that future revenue realization is more likely than not. 39Goldman Sachs 2007 Annual Report
  • 42.
    Management’s Discussion andAnalysis Europe. Real gross domestic product growth in the Eurozone economies slowed to an estimated 2.7% in calendar year 2007, down from 2.9% in 2006. Industrial production and fixed investment slowed as the year progressed, while growth in consumer expenditure was weak throughout the year. Surveys of business and consumer confidence declined. However, the labor market strengthened, as evidenced by a decline in the unemployment rate. Measures of core inflation increased during the year. The European Central Bank (ECB) continued to raise interest rates, increasing its main refinancing operations rate by a total of 75 basis points to 4.00% by the end of June. The ECB left the rate unchanged for the rest of our fiscal year, but engaged in measures to improve liquidity conditions in the last four months of the year. In the United Kingdom, real gross domestic product rose by an estimated 3.1% for calendar year 2007, up from 2.9% in 2006, but showed signs of slowing late in the year due to credit market concerns and a slowdown in the U.K. housing market. Measures of inflation remained elevated during the year. The Bank of England increased interest rates, raising its official bank rate by a total of 75 basis points to 5.75%. Long-term bond yields in both the Eurozone and the U.K. ended the year higher. The Euro and British pound appreciated by 11% and 7%, respectively, against the U.S. dollar during our fiscal year. Major European equity markets ended our fiscal year higher. Asia. In Japan, real gross domestic product growth slowed to an estimated 1.9% in calendar year 2007 from 2.4% in 2006. Measures of investment activity in the housing sector and growth in consumption declined during the year. Export growth remained solid but showed signs of deterioration towards year end as the environment outside of Japan worsened. The rate of inflation remained near zero percent during the year. The Bank of Japan raised its target overnight call rate by 25 basis points for the second consecutive year, bringing it to 0.50%, while the yield on 10-year Japanese government bonds declined slightly during our fiscal year. The yen appreciated by 4% against the U.S. dollar. The Nikkei 225 Index rose during the first eight months of our fiscal year but declined significantly in August, and ended our fiscal year essentially unchanged. In China, real gross domestic product growth accelerated to an estimated 11.4% in calendar year 2007 from 11.1% in 2006, with continued strength in exports, as demonstrated by China’s large and growing current account surplus and foreign exchange reserves. Industrial production accelerated during the year, while domestic demand softened but remained solid. The rate of inflation increased, particularly during the second half of the year. The People’s Bank of China raised its one-year benchmark lending rate by a total of 117 basis points to 7.29% and took additional measures to reduce liquidity in the financial system. The government continued to allow the steady appreciation of its currency, which ended our fiscal year nearly 6% higher against the U.S. dollar. Elsewhere in Asia, real gross domestic Global. Growth in the global economy slowed over the course of 2007. Although the pace of economic growth was solid through the beginning of our third fiscal quarter, global growth in the latter part of our fiscal year was impacted by volatility in the credit markets, particularly in the U.S. and Europe, and accelerated weakness in the U.S. housing market. Fixed income and equity markets experienced high volatility, particularly during the second half of the year. The U.S. mortgage market experienced significant deterioration throughout the year, particularly in subprime loans and securities. The broader global credit markets were characterized by significant weakness in the second half of the year, which was evident in the significant dislocation in money market rates in the U.S. and Europe. The U.S. Federal Reserve lowered its federal funds target rate towards the end of our fiscal year, while central banks in the Eurozone, United Kingdom, Japan and China all raised rates during the year. Oil prices rose significantly during our fiscal year and, in the currency markets, the U.S. dollar weakened against most major currencies, particularly against the Euro and the British pound. Corporate activity was generally strong during our fiscal year, reflecting significant growth in mergers and acquisitions and equity underwritings, as well as strength in leveraged finance during the first half of our fiscal year. United States. Real gross domestic product growth in the U.S. economy slowed to an estimated 2.2% in calendar year 2007, down from 2.9% in 2006. While economic growth was generally solid during the first nine months of our fiscal year, activity appeared to decelerate sharply during the fourth quarter. Much of the slowdown was attributable to the housing market, as sales of new and existing homes and residential real estate investment declined, as well as to the weakness in credit markets. Growth in industrial production slowed from 2006 levels, reflecting reduced growth in domestic demand, partially offset by stronger growth in net exports. Although business confidence remained fairly strong, consumer confidence declined over the course of the year. Growth in consumer expenditure was strong in the first quarter but declined thereafter, as concerns about the housing market intensified and oil prices rose. The unemployment rate rose during the second half of our fiscal year and ended the year higher. The rate of inflation increased sharply over our fiscal year, as energy prices rose significantly. Measures of core inflation, while slowing from 2006 levels, accelerated towards the end of the year. The U.S. Federal Reserve reduced its federal funds target rate by a total of 75 basis points to 4.50% during our fourth quarter, the first reductions since 2003. Beginning in August, the U.S. Federal Reserve also took other measures to improve liquidity in credit markets. Although the 10-year U.S. Treasury note yield rose during the first half of our fiscal year, it subsequently declined as credit concerns took hold, and ended the year 58 basis points lower at 3.97%. The Dow Jones Industrial Average, the SP 500 Index and the NASDAQ Composite Index ended our fiscal year higher by 9%, 6% and 8%, respectively. 40 Goldman Sachs 2007 Annual Report
  • 43.
    Management’s Discussion andAnalysis confidence in capital markets; natural disasters or pandemics; or a combination of these or other factors, have adversely affected, and may in the future adversely affect, our business and profitability in many ways, including the following: ■ Increasing or high interest rates and/or widening credit spreads, especially if such changes are rapid, may create a less favorable environment for certain of our businesses, and may affect the fair value of financial instruments that we issue or hold. For example, beginning in the second half of 2007, difficulties in the mortgage and broader credit markets resulted in a relatively sudden and substantial decrease in the availability of credit and credit spreads widened significantly, affecting volatility and liquidity in the debt and equity markets. ■ We have been committing increasing amounts of capital in many of our businesses and generally maintain large trading, specialist and investing positions. Market fluctuations and volatility may adversely affect the value of those positions or may reduce our willingness to enter into new transactions. Conversely, certain of our trading businesses depend on market volatility to provide trading and arbitrage opportunities, and decreases in volatility may reduce these opportunities and adversely affect the results of these businesses. ■ Increases in interest rates or credit spreads, as well as limitations on the availability of credit, can affect our ability to borrow on a secured or unsecured basis, which may adversely affect our liquidity and results of operations. We seek to finance our less liquid assets on a secured basis and disruptions in the credit markets are likely to make it harder and more expensive to fund these assets. In difficult credit markets, we may be forced to fund our operations at a higher cost or we may be unable to raise as much funding as we need to support our business activities. This could cause us to curtail our business activities and could increase our cost of funding, both of which could reduce our profitability. ■ Industry-wide declines in the size and number of underwritings and mergers and acquisitions may have an adverse effect on our revenues and, because we may be unable to reduce expenses correspondingly, our profit margins. Our clients engaging in mergers and acquisitions often rely on access to the secured and unsecured credit markets to finance their transactions. The lack of available credit or increased cost of credit may adversely affect the size, volume and timing of our clients’ merger and acquisition transactions — particularly large transactions — and adversely affect our financial advisory and underwriting businesses. product growth in India slowed to an estimated 8.7% in calendar year 2007 from 9.4% in 2006, as its currency strengthened and the central bank tightened monetary policy. The rate of wholesale inflation fell, but the rate of consumer price inflation remained elevated. Other currencies in the region also generally appreciated against the U.S. dollar. Equity markets rose sharply across the region, with the Shanghai Composite Index up 138%, and markets in Hong Kong, India and South Korea ending the year significantly higher. Other Markets. Real gross domestic product in Brazil rose by an estimated 5.4% in calendar year 2007, supported by strong capital inflows, strong demand and rising prices in commodities, and expansionary fiscal and monetary policies. The central bank reduced interest rates even as the rate of inflation rose. In Russia, real gross domestic product rose by an estimated 7.3% in calendar year 2007, supported by strong household consumption and increased capital investment, particularly in the first half of the year. The rate of inflation rose sharply in the latter part of the year. Brazilian and Russian equity prices ended our fiscal year significantly higher. Certain Risk Factors That May Affect Our Business We face a variety of risks that are substantial and inherent in our businesses, including market, liquidity, credit, operational, legal and regulatory risks. For a discussion of how management seeks to manage some of these risks, see “— Risk Management” below. A summary of the more important factors that could affect our business follows below. For a further discussion of these and other important factors that could affect our business, see “Risk Factors” in Part I, Item 1A of the Annual Report on Form 10-K. Market Conditions and Market Risk. Our businesses are materially affected by conditions in the global financial markets and economic conditions generally, and these conditions may change suddenly and dramatically. A favorable business environment is generally characterized by, among other factors, high global gross domestic product growth, stable geopolitical conditions, transparent, liquid and efficient capital markets, low inflation, high business and investor confidence, and strong business earnings. Unfavorable or uncertain economic and market conditions, which can be caused by: outbreaks of hostilities or other geopolitical instability; declines in economic growth, business activity or investor or business confidence; limitations on the availability or increases in the cost of credit and capital; increases in inflation, interest rates, exchange rate volatility, default rates or the price of basic commodities; corporate, political or other scandals that reduce investor 41Goldman Sachs 2007 Annual Report
  • 44.
    Management’s Discussion andAnalysis Liquidity Risk. Liquidity is essential to our businesses. Our liquidity could be impaired by an inability to access secured and/or unsecured debt markets, an inability to access funds from our subsidiaries, an inability to sell assets or redeem our investments, or unforeseen outflows of cash or collateral. This situation may arise due to circumstances that we may be unable to control, such as a general market disruption or an operational problem that affects third parties or us, or even by the perception among market participants that we are experiencing greater liquidity risk. The financial instruments that we hold and the contracts to which we are a party are increasingly complex, as we employ structured products to benefit our clients and ourselves, and these complex structured products often do not have readily available markets to access in times of liquidity stress. Growth of our proprietary investing activities may lead to situations where the holdings from these activities represent a significant portion of specific markets, which could restrict liquidity for our positions. Further, our ability to sell assets may be impaired if other market participants are seeking to sell similar assets at the same time, as is likely to occur in a liquidity or other market crisis. In addition, financial institutions with which we interact may exercise set-off rights or the right to require additional collateral, including in difficult market conditions, which could further impair our access to liquidity. Our credit ratings are important to our liquidity. A reduction in our credit ratings could adversely affect our liquidity and competitive position, increase our borrowing costs, limit our access to the capital markets or trigger our obligations under certain bilateral provisions in some of our trading and collateralized financing contracts. Under these provisions, counterparties could be permitted to terminate contracts with Goldman Sachs or require us to post additional collateral. Termination of our trading and collateralized financing contracts could cause us to sustain losses and impair our liquidity by requiring us to find other sources of financing or to make significant cash payments or securities movements. For a discussion of the potential impact on Goldman Sachs of a reduction in our credit ratings, see “— Liquidity and Funding Risk — Credit Ratings” below. ■ Reductions in the level of the equity markets or increases in interest rates tend to reduce the value of our clients’ portfolios, which in turn may reduce the fees we earn for managing assets. Increases in interest rates or attractive conditions in other investments could cause our clients to transfer their assets out of our funds or other products. Even in the absence of uncertain or unfavorable economic or market conditions, investment performance by our asset management business below the performance of benchmarks or competitors could result in a decline in assets under management and in the incentive and management fees we receive and might make it more difficult to attract new investors. ■ Concentration of risk increases the potential for significant losses in our market-making, proprietary trading and investing, block trading, merchant banking, underwriting and lending businesses. This risk may increase to the extent we expand our proprietary trading and investing businesses or commit capital to facilitate customer-driven business. ■ An increase in market volatility increases our measured risk, which might cause us to reduce our proprietary positions or to reduce certain of our business activities. In such circumstances, we may not be able to reduce our positions or our exposure in a timely, cost-effective way or in a manner sufficient to offset the increase in measured risk. ■ The volume of transactions that we execute for our clients and as a specialist or market maker may decline, which would reduce the revenues we receive from commissions and spreads. In our specialist businesses, we are obligated by stock exchange rules to maintain an orderly market, including by purchasing shares in a declining market. This may result in trading losses and an increased need for liquidity. Weakness in global equity markets and the trading of securities in multiple markets and on multiple exchanges could adversely impact our trading businesses and impair the value of our goodwill and identifiable intangible assets. 42 Goldman Sachs 2007 Annual Report
  • 45.
    Management’s Discussion andAnalysis we provide to clients, often must adhere to client-specific guidelines, as well as legal and regulatory standards. Despite the contingency plans and facilities we have in place, our ability to conduct business may be adversely impacted by a disruption in the infrastructure that supports our businesses and the communities in which we are located. This may include a disruption involving electrical, communications, transportation or other services used by us or third parties with which we conduct business. Legal and Regulatory Risk. We are subject to extensive and evolving regulation in jurisdictions around the world. Several of our subsidiaries are subject to regulatory capital requirements and, as a Consolidated Supervised Entity (CSE), we are subject to minimum capital standards on a consolidated basis. Substantial legal liability or a significant regulatory action against us could have material adverse financial effects or cause significant reputational harm to us, which in turn could seriously harm our business prospects. Firms in the financial services industry have been operating in a difficult regulatory environment. We face significant legal risks in our businesses, and the volume of claims and amount of damages and penalties claimed in litigation and regulatory proceedings against financial institutions remain high. For a discussion of how we account for our legal and regulatory exposures, see “— Use of Estimates” below. Critical Accounting Policies Fair Value The use of fair value to measure financial instruments, with related unrealized gains or losses generally recognized in “Trading and principal investments” in our consolidated statements of earnings, is fundamental to our financial statements and our risk management processes and is our most critical accounting policy. The fair value of a financial instrument is the amount that would be received to sell an asset or paid to transfer a liability in an orderly transaction between market participants at the measurement date (the exit price). Instruments that we own (long positions) are marked to bid prices, and instruments that we have sold, but not yet purchased (short positions) are marked to offer prices. We adopted Statement of Financial Accounting Standards (SFAS) No. 157, “Fair Value Measurements,” as of the beginning of 2007. See Notes 2 and 3 to the consolidated financial statements for further information on SFAS No. 157. Credit Risk. The amount and duration of our credit exposures have been increasing over the past several years, as has the breadth and size of the entities to which we have credit exposures. We are exposed to the risk that third parties that owe us money, securities or other assets will not perform their obligations. These parties may default on their obligations to us due to bankruptcy, lack of liquidity, operational failure or other reasons. We are also subject to the risk that our rights against third parties may not be enforceable in all circumstances. In addition, deterioration in the credit quality of third parties whose securities or obligations we hold could result in losses and/or adversely affect our ability to rehypothecate or otherwise use those securities or obligations for liquidity purposes. A significant downgrade in the credit ratings of our counterparties could also have a negative impact on our results. While in many cases we are permitted to require additional collateral for counterparties that experience financial difficulty, disputes may arise as to the amount of collateral we are entitled to receive and the value of pledged assets. In addition, as part of our clearing business, we finance our client positions, and we could be held responsible for the defaults or misconduct of our clients. Although we regularly review credit exposures to specific clients and counterparties and to specific industries, countries and regions that we believe may present credit concerns, default risk may arise from events or circumstances that are difficult to detect or foresee, particularly as new business initiatives lead us to transact with a broader array of clients and expose us to new asset classes and new markets. In addition, concerns about, or a default by, one institution could lead to significant liquidity problems, losses or defaults by other institutions, which in turn could adversely affect us. We have experienced, due to competitive factors, pressure to extend and price credit at levels that may not always fully compensate us for the risks we take. In particular, corporate clients sometimes seek to require credit commitments from us in connection with investment banking and other assignments. Operational Risk. Shortcomings or failures in our internal processes, people or systems, or external events could lead to impairment of our liquidity, financial loss, disruption of our businesses, liability to clients, regulatory intervention or reputational damage. Our businesses are highly dependent on our ability to process and monitor, on a daily basis, a large number of transactions, many of which are highly complex, across numerous and diverse markets in many currencies. These transactions, as well as information technology services 43Goldman Sachs 2007 Annual Report
  • 46.
    Management’s Discussion andAnalysis In determining fair value, we separate our “Financial instruments, owned at fair value” and “Financial instruments sold, but not yet purchased, at fair value” into two categories: cash instruments and derivative contracts, as set forth in the following table: Financial Instruments by Category As of November 2007 2006 Financial Financial Financial Instruments Sold, Financial Instruments Sold, Instruments but not Yet Instruments but not Yet Owned, Purchased, Owned, Purchased, (in millions) at Fair Value at Fair Value at Fair Value at Fair Value Cash trading instruments $324,181 $112,018 $253,056 $  87,244   ICBC 6,807 (2) — 5,194 (2) —   SMFG (1) 4,060 3,627 (5) 4,505 3,065 (5)   Other principal investments 11,933 (3) — 4,263 (3) — Principal investments 22,800 3,627 13,962 3,065 Cash instruments 346,981 115,645 267,018 90,309   Exchange-traded 13,541 12,280 14,407 13,851   Over-the-counter 92,073 87,098 53,136 51,645 Derivative contracts 105,614 (4) 99,378 (6) 67,543 (4) 65,496 (6) Total $452,595 $215,023 $334,561 $155,805 (1) The fair value of our Japanese yen-denominated investment in the convertible preferred stock of Sumitomo Mitsui Financial Group, Inc. (SMFG) includes the effect of foreign exchange revaluation, for which we maintain an economic currency hedge. (2) Includes interests of $4.30 billion and $3.28 billion as of November 2007 and November 2006, respectively, held by investment funds managed by Goldman Sachs. The fair value of our investment in the ordinary shares of Industrial and Commercial Bank of China Limited (ICBC), which trade on The Stock Exchange of Hong Kong, includes the effect of foreign exchange revaluation for which we maintain an economic currency hedge. (3) The following table sets forth the principal investments (in addition to our investments in ICBC and SMFG) included within the Principal Investments component of our Trading and Principal Investments segment: As of November 2007 2006 (in millions) Corporate Real Estate Total Corporate Real Estate Total Private $7,297 $2,361 $  9,658 $2,741 $555 $3,296 Public 2,208 67 2,275 934 33 967 Total $9,505 $2,428 $11,933 $3,675 $588 $4,263 (4) Net of cash received pursuant to credit support agreements of $59.05 billion and $24.06 billion as of November 2007 and November 2006, respectively. (5) Represents an economic hedge on the shares of common stock underlying our investment in the convertible preferred stock of SMFG. (6) Net of cash paid pursuant to credit support agreements of $27.76 billion and $16.00 billion as of November 2007 and November 2006, respectively. 44 Goldman Sachs 2007 Annual Report
  • 47.
    Management’s Discussion andAnalysis ■ Public Principal Investments. Our public principal investments held within the Principal Investments component of our Trading and Principal Investments segment tend to be large, concentrated holdings resulting from initial public offerings or other corporate transactions, and are valued based on quoted market prices. For positions that are not traded in active markets or are subject to transfer restrictions, valuations are adjusted to reflect illiquidity and/or non- transferability, and such adjustments are generally based on available market evidence. In the absence of such evidence, management’s best estimate is used. Our most significant public principal investment is our investment in the ordinary shares of ICBC. Our investment in ICBC is valued using the quoted market prices adjusted for transfer restrictions. The ordinary shares acquired from ICBC are subject to transfer restrictions that, among other things, prohibit any sale, disposition or other transfer until April 28, 2009. From April 28, 2009 to October 20, 2009, we may transfer up to 50% of the aggregate ordinary shares of ICBC that we owned as of October 20, 2006. We may transfer the remaining shares after October 20, 2009. A portion of our interest is held by investment funds managed by Goldman Sachs. We also have an investment in the convertible preferred stock of SMFG. This investment is valued using a model that is principally based on SMFG’s common stock price. As of November 2007, the conversion price of our SMFG convertible preferred stock into shares of SMFG common stock was ¥318,800. This price is subject to downward adjustment if the price of SMFG common stock at the time of conversion is less than the conversion price (subject to a floor of ¥105,100). As a result of downside protection on the conversion stock price, the relationship between changes in the fair value of our investment and changes in SMFG’s common stock price would be nonlinear for a significant decline in the SMFG common stock price. As of November 2007, we had hedged approximately 90% of the common stock underlying our investment in SMFG and there were no restrictions on our ability to hedge the remainder. Cash Instruments. Cash instruments include cash trading instruments, public principal investments and private principal investments. ■ Cash Trading Instruments. Our cash trading instruments are generally valued using quoted market prices in active markets, broker or dealer quotations, or alternative pricing sources with reasonable levels of price transparency. The types of instruments valued based on quoted market prices in active markets include most U.S. government and agency securities, many other sovereign government obligations, active listed equities and most money market securities. The types of instruments valued based on quoted prices in markets that are not active, broker or dealer quotations, or alternative pricing sources with reasonable levels of price transparency include most investment-grade and high-yield corporate bonds, most mortgage products, certain corporate bank and bridge loans, less liquid listed equities, state, municipal and provincial obligations, most physical commodities and certain loan commitments. Certain cash trading instruments trade infrequently and therefore have little or no price transparency. Such instruments include private equity and real estate fund investments, certain corporate bank and bridge loans, less liquid mortgage whole loans, distressed debt instruments and certain loan commitments. The transaction price is initially used as the best estimate of fair value. Accordingly, when a pricing model is used to value such an instrument, the model is adjusted so that the model value at inception equals the transaction price. This valuation is adjusted only when changes to inputs and assumptions are corroborated by evidence such as transactions in similar instruments, completed or pending third-party transactions in the underlying investment or comparable entities, subsequent rounds of financing, recapitalizations and other transactions across the capital structure, offerings in the equity or debt capital markets, and changes in financial ratios or cash flows. For positions that are not traded in active markets or are subject to transfer restrictions, valuations are adjusted to reflect illiquidity and/or non-transferability, and such adjustments are generally based on available market evidence. In the absence of such evidence, management’s best estimate is used. 45Goldman Sachs 2007 Annual Report
  • 48.
    Management’s Discussion andAnalysis Certain OTC derivatives trade in less liquid markets with limited pricing information, and the determination of fair value for these derivatives is inherently more difficult. Where we do not have corroborating market evidence to support significant model inputs and cannot verify the model to market transactions, transaction price is initially used as the best estimate of fair value. Accordingly, when a pricing model is used to value such an instrument, the model is adjusted so that the model value at inception equals the transaction price. Subsequent to initial recognition, we only update valuation inputs when corroborated by evidence such as similar market transactions, third-party pricing services and/or broker or dealer quotations, or other empirical market data. In circumstances where we cannot verify the model value to market transactions, it is possible that a different valuation model could produce a materially different estimate of fair value. See “— Credit Risk — Derivatives” below for further information on our OTC derivatives. When appropriate, valuations are adjusted for various factors such as liquidity, bid/offer spreads and credit considerations. Such adjustments are generally based on available market evidence. In the absence of such evidence, management’s best estimate is used. Fair Value Hierarchy— Level 3 Assets. SFAS No. 157 establishes a fair value hierarchy that prioritizes the inputs to valuation techniques used to measure fair value. The objective of a fair value measurement is to determine the price that would be received to sell an asset or paid to transfer a liability in an orderly transaction between market participants at the measurement date (an exit price). The hierarchy gives the highest priority to unadjusted quoted prices in active markets for identical assets or liabilities (level 1 measurements) and the lowest priority to unobservable inputs (level 3 measurements). Assets and liabilities are classified in their entirety based on the lowest level of input that is significant to the fair value measurement. See Notes 2 and 3 to the consolidated financial statements for further information regarding SFAS No. 157. ■ Private Principal Investments. Our private principal investments held within the Principal Investments component of our Trading and Principal Investments segment include investments in private equity, debt and real estate, primarily held through investment funds. By their nature, these investments have little or no price transparency. We value such instruments initially at transaction price and adjust valuations when evidence is available to support such adjustments. Such evidence includes transactions in similar instruments, completed or pending third-party transactions in the underlying investment or comparable entities, subsequent rounds of financing, recapitalizations and other transactions across the capital structure, offerings in the equity or debt capital markets, and changes in financial ratios or cash flows. Derivative Contracts. Derivative contracts can be exchange- traded or over-the-counter (OTC). We generally value exchange- traded derivatives within portfolios using models which calibrate to market clearing levels and eliminate timing differences between the closing price of the exchange-traded derivatives and their underlying cash instruments. OTC derivatives are valued using market transactions and other market evidence whenever possible, including market- based inputs to models, model calibration to market clearing transactions, broker or dealer quotations or alternative pricing sources with reasonable levels of price transparency. Where models are used, the selection of a particular model to value an OTC derivative depends upon the contractual terms of, and specific risks inherent in, the instrument as well as the availability of pricing information in the market. We generally use similar models to value similar instruments. Valuation models require a variety of inputs, including contractual terms, market prices, yield curves, credit curves, measures of volatility, prepayment rates and correlations of such inputs. For OTC derivatives that trade in liquid markets, such as generic forwards, swaps and options, model inputs can generally be verified and model selection does not involve significant management judgment. 46 Goldman Sachs 2007 Annual Report
  • 49.
    Management’s Discussion andAnalysis The following table sets forth the fair values of assets classified as level 3 within the fair value hierarchy, along with a brief description of the valuation technique for each type of asset: Level 3 Assets at Fair Value (in millions) As of Description November 2007 Valuation Technique Private equity and real estate fund investments (1) $ 18,006 Initially valued at transaction price. Subsequently valued based on third-party investments, pending transactions or changes in financial ratios (e.g., earnings multiples) and discounted cash flows. Bank loans (2) 13,334 Initially valued at transaction price. Subsequently valued using market data for similar instruments (e.g., recent transactions or broker quotes), comparisons to benchmark derivative indices or movements in Corporate debt securities and other debt obligations (3) 6,111 underlying credit spreads. Mortgage and other asset-backed loans and securities   Loans and securities backed by commercial real estate (4) 7,410 Initially valued at transaction price. Subsequently valued transactions for similar instruments and discounted cash flow techniques (calibrated to trading activity, where applicable).   Loans and securities backed by residential real estate (5) 2,484 Initially valued at transaction price. Subsequently valued by comparison to transactions in instruments with similar collateral and risk profiles, discounted cash flow techniques, option adjusted spread analyses, and hypothetical securitization analyses.   Loan portfolios (6) 6,106 Initially valued at transaction price. Subsequently valued using transactions for similar instruments and discounted cash flow techniques. Cash instruments 53,451 Derivative contracts 15,700 Valuation models are calibrated to initial trade price. Subsequent valuations are based on observable inputs to the valuation model (e.g., interest rates, credit spreads, volatilities, etc.). Model inputs are changed only when corroborated by market data. Total level 3 assets at fair value 69,151 Level 3 assets for which we do not   bear economic exposure (7) (14,437) Level 3 assets for which we bear economic exposure $ 54,714 (1) Includes $7.06 billion of assets for which we do not bear economic exposure. Also includes $2.02 billion of real estate fund investments. (2) Includes mezzanine financing, leveraged loans arising from capital market transactions and other corporate bank debt. (3) Includes $2.49 billion of collateralized debt obligations (CDOs) backed by corporate obligations. (4) Loans and securities backed by commercial real estate were $19.02 billion, of which $7.41 billion were classified as level 3. (5) Includes subprime mortgage exposure of $507 million, including $316 million of CDOs backed by subprime mortgages. (6) Consists of acquired portfolios of distressed loans. These loans are primarily backed by commercial and residential real estate collateral. (7) We do not bear economic exposure to these level 3 assets as they are financed by nonrecourse debt, attributable to minority investors or attributable to employee interests in certain consolidated funds. 47Goldman Sachs 2007 Annual Report
  • 50.
    Management’s Discussion andAnalysis We employ an oversight structure that includes appropriate segregation of duties. Senior management, independent of the trading and investing functions, is responsible for the oversight of control and valuation policies and for reporting the results of these policies to our Audit Committee. We seek to maintain the necessary resources to ensure that control functions are performed to the highest standards. We employ procedures for the approval of new transaction types and markets, price verification, review of daily profit and loss, and review of valuation models by personnel with appropriate technical knowledge of relevant products and markets. These procedures are performed by personnel independent of the trading and investing functions. For trading and principal investments where prices or valuations that require inputs are less observable, we employ, where possible, procedures that include comparisons with similar observable positions, analysis of actual to projected cash flows, comparisons with subsequent sales and discussions with senior business leaders. See “— Market Risk” below for a further discussion of how we manage the risks inherent in our trading and principal investing businesses. Goodwill and Identifiable Intangible Assets As a result of our acquisitions, principally SLK LLC (SLK) in 2000, The Ayco Company, L.P. (Ayco) in 2003 and our variable annuity and life insurance business in 2006, we have acquired goodwill and identifiable intangible assets. Goodwill is the cost of acquired companies in excess of the fair value of net assets, including identifiable intangible assets, at the acquisition date. Goodwill. We test the goodwill in each of our operating segments, which are components one level below our three business segments, for impairment at least annually in accordance with SFAS No. 142, “Goodwill and Other Intangible Assets,” by comparing the estimated fair value of each operating segment with its estimated net book value. We derive the fair value of each of our operating segments primarily based on price-earnings and price-book multiples. We derive the net book value of our operating segments by estimating the amount of shareholders’ equity required to support the activities of each operating segment. Our last annual impairment test was performed during our 2007 fourth quarter and no impairment was identified. Subprime mortgage exposure. We securitize, underwrite and make markets in subprime mortgages. As of November 2007, the fair value of our long position in subprime mortgage cash instruments was $2.11 billion (of which $507 million was classified as level 3 within the fair value hierarchy), including $316 million of collateralized debt obligations (CDOs) backed by subprime mortgages. At any point in time, we may use cash instruments as well as derivatives to manage our long or short risk position in the subprime mortgage market. Other Financial Assets and Financial Liabilities. In addition to “Financial instruments owned, at fair value” and “Financial instruments sold, but not yet purchased, at fair value,” we have elected to account for certain of our other financial assets and financial liabilities at fair value under SFAS No. 155, “Accounting for Certain Hybrid Financial Instruments — an amendment of FASB Statements No. 133 and 140,” or SFAS No. 159, “The Fair Value Option for Financial Assets and Financial Liabilities.” Such financial assets and financial liabilities include (i) certain unsecured short-term borrowings, consisting of all promissory notes and commercial paper and certain hybrid financial instruments; (ii) certain other secured financings, primarily transfers accounted for as financings rather than sales under SFAS No. 140 and debt raised through our William Street program; (iii) certain unsecured long-term borrowings, including prepaid physical commodity transactions; (iv) resale and repurchase agreements; (v) securities borrowed and loaned within Trading and Principal Investments, consisting of our matched book and certain firm financing activities; (vi) corporate loans, loan commitments and certificates of deposit issued by Goldman Sachs Bank USA (GS Bank USA) as well as securities held by GS Bank USA (previously accounted for as available- for-sale); (vii) receivables from customers and counterparties arising from transfers accounted for as secured loans rather than purchases under SFAS No. 140; and (viii) in general, investments acquired after the adoption of SFAS No. 159 where we have significant influence over the investee and would otherwise apply the equity method of accounting. See “— Recent Accounting Developments” below for a discussion of the impact of adopting SFAS No. 159. Controls Over Valuation of Financial Instruments. A control infrastructure, independent of the trading and investing functions, is fundamental to ensuring that our financial instruments are appropriately valued and that fair value measurements are reliable. This is particularly important where prices or valuations that require inputs are less observable. 48 Goldman Sachs 2007 Annual Report
  • 51.
    Management’s Discussion andAnalysis The following table sets forth the carrying value of our goodwill by operating segment: Goodwill by Operating Segment As of November (in millions) 2007 2006 Investment Banking   Financial Advisory $    — $    —   Underwriting 125 125 Trading and Principal Investments   FICC 123 136   Equities (1) 2,381 2,381   Principal Investments 11 4 Asset Management and Securities Services   Asset Management (2) 564 421   Securities Services 117 117 Total $3,321 $3,184 (1) Primarily related to SLK. (2) Primarily related to Ayco. The increase in goodwill from November 2006 relates to our acquisition of Macquarie — IMM Investment Management. Identifiable Intangible Assets. We amortize our identifiable intangible assets over their estimated useful lives in accordance with SFAS No. 142, and test for potential impairment whenever events or changes in circumstances suggest that an asset’s or asset group’s carrying value may not be fully recoverable in accordance with SFAS No. 144, “Accounting for the Impairment or Disposal of Long-Lived Assets.” An impairment loss, calculated as the difference between the estimated fair value and the carrying value of an asset or asset group, is recognized if the sum of the estimated undiscounted cash flows relating to the asset or asset group is less than the corresponding carrying value. The following table sets forth the carrying value and range of remaining useful lives of our identifiable intangible assets by major asset class: Identifiable Intangible Assets by Asset Class As of November 2007 2006 Range of Estimated Remaining Carrying Useful Lives Carrying ($ in millions) Value (in years) Value Customer lists (1) $  732 3 – 18 $  737 New York Stock Exchange (NYSE) specialist rights 502 14 542 Insurance-related assets (2) 372 7 362 Exchange-traded fund (ETF) specialist rights 100 20 105 Power contracts (3) 20 1 – 18 667 Other (4) 45 1 – 5 89 Total $1,771 $2,502 (1) Primarily includes our clearance and execution and NASDAQ customer lists related to SLK and financial counseling customer lists related to Ayco. (2) Consists of the value of business acquired (VOBA) and deferred acquisition costs (DAC). VOBA represents the present value of estimated future gross profits of the variable annuity and life insurance business. DAC results from commissions paid by Goldman Sachs to the primary insurer (ceding company) on life and annuity reinsurance agreements as compensation to place the business with us and to cover the ceding company’s acquisition expenses. VOBA and DAC are amortized over the estimated life of the underlying contracts based on estimated gross profits, and amortization is adjusted based on actual experience. The seven-year useful life represents the weighted average remaining amortization period of the underlying contracts (certain of which extend for approximately 30 years). (3) The reduction in power contracts from November 2006 is due to the sale of the majority of our ownership interests in 14 power generation facilities during 2007. (4) Primarily includes marketing and technology-related assets. 49Goldman Sachs 2007 Annual Report
  • 52.
    Management’s Discussion andAnalysis There can be no assurance that the assumptions, rule or structure changes described above will result in sufficient cash flows to avoid future impairment of our NYSE specialist rights. As of November 30, 2007, the carrying value of our NYSE specialist rights was $502 million. To the extent that there were to be an impairment in the future, it could result in a significant writedown in the carrying value of these specialist rights. Use of Estimates The use of generally accepted accounting principles requires management to make certain estimates and assumptions. In addition to the estimates we make in connection with fair value measurements and the accounting for goodwill and identifiable intangible assets, the use of estimates and assumptions is also important in determining provisions for potential losses that may arise from litigation and regulatory proceedings and tax audits. We estimate and provide for potential losses that may arise out of litigation and regulatory proceedings and tax audits to the extent that such losses are probable and can be estimated, in accordance with SFAS No. 5, “Accounting for Contingencies.” Significant judgment is required in making these estimates and our final liabilities may ultimately be materially different. Our total estimated liability in respect of litigation and regulatory proceedings is determined on a case-by-case basis and represents an estimate of probable losses after considering, among other factors, the progress of each case or proceeding, our experience and the experience of others in similar cases or proceedings, and the opinions and views of legal counsel. Given the inherent difficulty of predicting the outcome of our litigation and regulatory matters, particularly in cases or proceedings in which substantial or indeterminate damages or fines are sought, we cannot estimate losses or ranges of losses for cases or proceedings where there is only a reasonable possibility that a loss may be incurred. See “— Legal Proceedings” in Part I, Item 3 of the Annual Report on Form 10-K, for information on our judicial, regulatory and arbitration proceedings. A prolonged period of weakness in global equity markets and the trading of securities in multiple markets and on multiple exchanges could adversely impact our businesses and impair the value of our goodwill and/or identifiable intangible assets. In addition, certain events could indicate a potential impairment of our identifiable intangible assets, including (i) changes in market structure that could adversely affect our specialist businesses (see discussion below), (ii) an adverse action or assessment by a regulator, or (iii) adverse actual experience on the contracts in our variable annuity and life insurance business. During the fourth quarter of 2007, as a result of continuing weak operating results in our NYSE specialist business, we tested our NYSE specialist rights for impairment in accordance with SFAS No. 144, “Accounting for the Impairment or Disposal of Long-Lived Assets.” Under SFAS No. 144, an impairment loss is recognized if the carrying amount of our NYSE specialist rights exceeds the projected undiscounted cash flows of the business over the estimated remaining useful life of our NYSE specialist rights. Projected undiscounted cash flows exceeded the carrying amount of our NYSE specialist rights, and accordingly, we did not record an impairment loss. We expect that the NYSE will enact numerous rule changes in 2008 that will further align its model with investor requirements for speed and efficiency of execution and will establish specialists as Designated Market Makers (DMMs). As DMMs, specialists will retain their obligation to commit capital but for the first time, specialists will be able to trade on parity with other market participants. In addition, we understand that the NYSE plans to introduce a reserve order system that will allow for anonymous trade execution and is expected to increase liquidity and market share. The new rules are expected to bolster the NYSE’s competitive position by simplifying trading and advancing the NYSE’s goal of increasing execution speeds. In projecting the undiscounted cash flows of the business for the purpose of performing our impairment test, we made several important assumptions about the potential beneficial effects of the expected rule and market structure changes described above. Specifically, we assumed that: ■ overall equity trading volumes will continue to grow at a rate consistent with recent historical trends; ■ the NYSE will be able to recapture approximately one-half of the market share that it lost in 2007; and ■ we will increase the market share of our NYSE specialist business and, as a DMM, the profitability of each share traded. 50 Goldman Sachs 2007 Annual Report
  • 53.
    Management’s Discussion andAnalysis Results of Operations The composition of our net revenues has varied over time as financial markets and the scope of our operations have changed. The composition of net revenues can also vary over the shorter term due to fluctuations in U.S. and global economic and market conditions. See “— Certain Risk Factors That May Affect Our Business” above, and “Risk Factors” in Part I, Item 1A of the Annual Report on Form 10-K. Financial Overview The following table sets forth an overview of our financial results: Financial Overview Year Ended November ($ in millions, except per share amounts) 2007 2006 2005 Net revenues $45,987 $37,665 $25,238 Pre-tax earnings 17,604 14,560 8,273 Net earnings 11,599 9,537 5,626 Net earnings applicable to common shareholders 11,407 9,398 5,609 Diluted earnings per common share 24.73 19.69 11.21 Return on average common shareholders’ equity (1) 32.7% 32.8% 21.8% Return on average tangible common shareholders’ equity (2) 38.2% 39.8% 26.7% (1) Return on average common shareholders’ equity is computed by dividing net earnings applicable to common shareholders by average monthly common shareholders’ equity. (2) Tangible common shareholders’ equity equals total shareholders’ equity less preferred stock, goodwill and identifiable intangible assets, excluding power contracts. Identifiable intangible assets associated with power contracts are not deducted from total shareholders’ equity because, unlike other intangible assets, less than 50% of these assets are supported by common shareholders’ equity. Management believes that return on average tangible common shareholders’ equity (ROTE) is meaningful because it measures the performance of businesses consistently, whether they were acquired or developed internally. ROTE is computed by dividing net earnings applicable to common shareholders by average monthly tangible common shareholders’ equity. The following table sets forth a reconciliation of average total shareholders’ equity to average tangible common shareholders’ equity: Average for the Year Ended November (in millions) 2007 2006 2005 Total shareholders’ equity $37,959 $31,048 $26,264 Preferred stock (3,100) (2,400) (538) Common shareholders’ equity 34,859 28,648 25,726 Goodwill and identifiable intangible assets, excluding power contracts (4,971) (5,013) (4,737) Tangible common shareholders’ equity $29,888 $23,635 $20,989 51Goldman Sachs 2007 Annual Report
  • 54.
    Management’s Discussion andAnalysis 2006 versus 2005. Our net revenues were $37.67 billion in 2006, an increase of 49% compared with 2005, reflecting significantly higher net revenues in Trading and Principal Investments, Investment Banking, and Asset Management and Securities Services. The increase in Trading and Principal Investments reflected significantly higher net revenues in FICC, Equities and Principal Investments. The increase in FICC reflected particularly strong performances across all major businesses. During 2006, FICC operated in an environment characterized by strong customer-driven activity and favorable market opportunities. In addition, corporate credit spreads tightened, the yield curve flattened and volatility levels were generally low in interest rate and currency markets. The increase in Equities primarily reflected significantly higher net revenues in our customer franchise businesses. During 2006, Equities operated in a favorable environment characterized by strong customer-driven activity, generally higher equity prices and favorable market opportunities, although volatility levels were generally low. The increase in Principal Investments reflected a significant gain related to our investment in the ordinary shares of ICBC and higher gains and overrides from other principal investments, partially offset by a smaller, but still significant, gain related to our investment in the convertible preferred stock of SMFG. The increase in Investment Banking was due to significantly higher net revenues in Underwriting and Financial Advisory, as we benefited from strong client activity levels, reflecting favorable equity and financing markets, strong CEO confidence and growth in financial sponsor activity. The increase in Asset Management and Securities Services was primarily due to higher assets under management and significantly higher incentive fees, as well as significantly higher global customer balances in Securities Services. Assets under management increased $144 billion or 27% to a record $676 billion, including net asset inflows of $94 billion during 2006. Operating Expenses Our operating expenses are primarily influenced by compensation, headcount and levels of business activity. A substantial portion of our compensation expense represents discretionary bonuses which are significantly impacted by, among other factors, the level of net revenues, prevailing labor markets, business mix and the structure of our share-based compensation programs. For 2007, our ratio of compensation and benefits to net revenues was 43.9% compared with 43.7% for 2006. Net Revenues 2007 versus 2006. Our net revenues were $45.99 billion in 2007, an increase of 22% compared with 2006, reflecting significantly higher net revenues in Trading and Principal Investments and Investment Banking, and higher net revenues in Asset Management and Securities Services. The increase in Trading and Principal Investments reflected higher net revenues in Equities, FICC and Principal Investments. Net revenues in Equities increased 33% compared with 2006, reflecting significantly higher net revenues in both our customer franchise businesses and principal strategies. During 2007, Equities operated in an environment characterized by strong customer- driven activity, generally higher equity prices and higher levels of volatility, particularly during the second half of the year. The increase in FICC reflected significantly higher net revenues in currencies and interest rate products. In addition, net revenues in mortgages were higher despite a significant deterioration in the mortgage market throughout the year, while net revenues in credit products were strong, but slightly lower compared with 2006. Credit products included substantial gains from equity investments, including a gain of approximately $900 million related to the disposition of Horizon Wind Energy L.L.C., as well as a loss of approximately $1 billion, net of hedges, related to non-investment-grade credit origination activities. During 2007, FICC operated in an environment generally characterized by strong customer-driven activity and favorable market opportunities. However, during the year, the mortgage market experienced significant deterioration and, in the second half of the year, the broader credit markets were characterized by wider spreads and reduced levels of liquidity. The increase in Principal Investments reflected strong results in both corporate and real estate investing. The increase in Investment Banking reflected a 64% increase in Financial Advisory net revenues and a strong performance in our Underwriting business. The increase in Financial Advisory primarily reflected growth in industry-wide completed mergers and acquisitions. The increase in Underwriting reflected higher net revenues in debt underwriting, as leveraged finance activity was strong during the first half of our fiscal year, while net revenues in equity underwriting were strong but essentially unchanged from 2006. Net revenues in Asset Management and Securities Services also increased. The increase in Securities Services primarily reflected significant growth in global customer balances. The increase in Asset Management reflected significantly higher asset management fees, partially offset by significantly lower incentive fees. During the year, assets under management increased $192 billion, or 28%, to a record $868 billion, including net inflows of $161 billion. 52 Goldman Sachs 2007 Annual Report
  • 55.
    Management’s Discussion andAnalysis The following table sets forth our operating expenses and number of employees: Operating Expenses and Employees Year Ended November ($ in millions) 2007 2006 2005 Compensation and benefits (1) $20,190 $16,457 $11,758 Brokerage, clearing, exchange and distribution fees 2,758 1,985 1,416 Market development 601 492 378 Communications and technology 665 544 490 Depreciation and amortization 624 521 501 Amortization of identifiable intangible assets 195 173 124 Occupancy 975 850 728 Professional fees 714 545 475 Cost of power generation 335 406 386 Other expenses 1,326 1,132 709 Total non-compensation expenses 8,193 6,648 5,207 Total operating expenses $28,383 $23,105 $16,965 Employees at year end (2) 30,522 26,467 23,623 (1) Compensation and benefits includes $168 million, $259 million and $137 million for the years ended November 2007, November 2006 and November 2005, respectively, attributable to consolidated entities held for investment purposes. Consolidated entities held for investment purposes are entities that are held strictly for capital appreciation, have a defined exit strategy and are engaged in activities that are not closely related to our principal businesses. (2) Excludes 4,572, 3,868 and 7,382 employees as of November 2007, November 2006 and November 2005, respectively, of consolidated entities held for investment purposes (see footnote 1 above). The following table sets forth non-compensation expenses of consolidated entities held for investment purposes and our remaining non-compensation expenses by line item: Non-Compensation Expenses Year Ended November (in millions) 2007 2006 2005 Non-compensation expenses of consolidated investments (1) $  446 $  501 $  265 Non-compensation expenses excluding consolidated investments Brokerage, clearing, exchange and distribution fees 2,758 1,985 1,416 Market development 593 461 361 Communications and technology 661 537 487 Depreciation and amortization 509 444 467 Amortization of identifiable intangible assets 189 169 124 Occupancy 892 738 674 Professional fees 711 534 468 Cost of power generation 335 406 386 Other expenses 1,099 873 559 Subtotal 7,747 6,147 4,942 Total non-compensation expenses, as reported $8,193 $6,648 $5,207 (1) Consolidated entities held for investment purposes are entities that are held strictly for capital appreciation, have a defined exit strategy and are engaged in activities that are not closely related to our principal businesses. For example, these investments include consolidated entities that hold real estate assets, such as hotels, but exclude investments in entities that primarily hold financial assets. We believe that it is meaningful to review non-compensation expenses excluding expenses related to these consolidated entities in order to evaluate trends in non-compensation expenses related to our principal business activities. Revenues related to such entities are included in “Trading and principal investments” in the consolidated statements of earnings. 53Goldman Sachs 2007 Annual Report
  • 56.
    Management’s Discussion andAnalysis Non-compensation expenses of $6.65 billion for 2006 increased 28% compared with 2005. Excluding non- compensation expenses related to consolidated entities held for investment purposes, non-compensation expenses were 24% higher than 2005, primarily due to higher brokerage, clearing, exchange and distribution fees in Equities and FICC, and increased other expenses, primarily due to costs related to our insurance business, which was acquired in 2006. In addition, market development costs and professional fees were higher, reflecting increased levels of business activity, and occupancy expenses increased, primarily reflecting new office space and higher facility expenses. Provision for Taxes The effective income tax rate was 34.1% for 2007, down from 34.5% for 2006, primarily due to changes in the geographic mix of earnings. The effective income tax rate was 34.5% for 2006, up from 32.0% for 2005. The increase in the effective income tax rate for 2006 compared with 2005 was primarily related to a reduction in the impact of permanent benefits due to higher levels of earnings in 2006 and audit settlements in 2005. Our effective income tax rate can vary from period to period depending on, among other factors, the geographic and business mix of our earnings, the level of our pre-tax earnings, the level of our tax credits and the effect of tax audits. Certain of these and other factors, including our history of pre-tax earnings, are taken into account in assessing our ability to realize our net deferred tax assets. See Note 14 to the consolidated financial statements for further information regarding our provision for taxes. 2007 versus 2006. Operating expenses were $28.38 billion for 2007, 23% higher than 2006. Compensation and benefits expenses of $20.19 billion increased 23% compared with 2006, reflecting increased discretionary compensation and growth in employment levels. The ratio of compensation and benefits to net revenues for 2007 was 43.9% compared with 43.7% for 2006. Employment levels increased 15% compared with November 2006. Non-compensation expenses of $8.19 billion for 2007 increased 23% compared with 2006, primarily attributable to higher levels of business activity and continued geographic expansion. One-half of this increase was attributable to brokerage, clearing, exchange and distribution fees, principally reflecting higher transaction volumes in Equities. Other expenses, professional fees and communications and technology expenses also increased, primarily due to higher levels of business activity. Occupancy and depreciation and amortization expenses included exit costs of $128 million related to the firm’s office space. 2006 versus 2005. Operating expenses were $23.11 billion for 2006, 36% higher than 2005. Compensation and benefits expenses of $16.46 billion increased 40% compared with 2005, primarily reflecting increased discretionary compensation due to higher net revenues, and increased levels of employment. The ratio of compensation and benefits to net revenues for 2006 was 43.7% compared with 46.6% for 2005. This lower ratio primarily reflected our strong net revenues in 2006. Employment levels increased 12% compared with November 2005. In the first quarter of 2006, we adopted SFAS No. 123-R, which requires that share-based awards granted to retirement- eligible employees be expensed in the year of grant. In addition to expensing current year awards, prior year awards must continue to be amortized over the relevant service period. Therefore, our compensation and benefits in 2006 included both amortization of prior year share-based awards held by employees that were retirement-eligible on the date of adoption of SFAS No. 123-R and new awards granted to those employees. Compensation and benefits expenses in 2006 included $637 million in continued amortization of prior year awards held by employees that were retirement-eligible on the date of adoption of SFAS No. 123-R. This amount represents the majority of the expense to be recognized with respect to these awards. 54 Goldman Sachs 2007 Annual Report
  • 57.
    Management’s Discussion andAnalysis Investment Banking Our Investment Banking segment is divided into two components: ■ Financial Advisory. Financial Advisory includes advisory assignments with respect to mergers and acquisitions, divestitures, corporate defense activities, restructurings and spin-offs. ■ Underwriting. Underwriting includes public offerings and private placements of a wide range of securities and other financial instruments. Net revenues in our segments include allocations of interest income and interest expense to specific securities, commodities and other positions in relation to the cash generated by, or funding requirements of, such underlying positions. See Note 16 to the consolidated financial statements for further information regarding our business segments. The cost drivers of Goldman Sachs taken as a whole — compensation, headcount and levels of business activity — are broadly similar in each of our business segments. Compensation and benefits expenses within our segments reflect, among other factors, the overall performance of Goldman Sachs as well as the performance of individual business units. Consequently, pre-tax margins in one segment of our business may be significantly affected by the performance of our other business segments. A discussion of segment operating results follows. Segment Operating Results The following table sets forth the net revenues, operating expenses and pre-tax earnings of our segments: Segment Operating Results Year Ended November (in millions) 2007 2006 2005 Investment Banking Net revenues $ 7,555 $  5,629 $  3,671 Operating expenses 4,985 4,062 3,258 Pre-tax earnings $  2,570 $  1,567 $   413 Trading and Principal Investments Net revenues $31,226 $25,562 $16,818 Operating expenses 17,998 14,962 10,600 Pre-tax earnings $13,228 $10,600 $  6,218 Asset Management and Securities Services Net revenues $ 7,206 $  6,474 $  4,749 Operating expenses 5,363 4,036 3,070 Pre-tax earnings $  1,843 $  2,438 $  1,679 Total Net revenues $45,987 $37,665 $25,238 Operating expenses (1) 28,383 23,105 16,965 Pre-tax earnings $17,604 $14,560 $  8,273 (1) Operating expenses include net provisions for a number of litigation and regulatory proceedings of $37 million, $45 million and $37 million for the years ended November 2007, November 2006 and November 2005, respectively, that have not been allocated to our segments. 55Goldman Sachs 2007 Annual Report
  • 58.
    Management’s Discussion andAnalysis 2006 versus 2005. Net revenues in Investment Banking of $5.63 billion for 2006 increased 53% compared with 2005. Net revenues in Financial Advisory of $2.58 billion increased 35% compared with 2005, primarily reflecting strong growth in industry-wide completed mergers and acquisitions. Net revenues in our Underwriting business of $3.05 billion increased 73% compared with 2005. Net revenues were significantly higher in equity underwriting, reflecting increased client activity. Net revenues were also significantly higher in debt underwriting, primarily due to a significant increase in leveraged finance activity and, to a lesser extent, an increase in investment-grade activity. Our investment banking transaction backlog at the end of 2006 was at its highest level since 2000. (1) Operating expenses of $4.06 billion for 2006 increased 25% compared with 2005, substantially all of which was due to increased compensation and benefits expenses resulting from higher levels of discretionary compensation. Pre-tax earnings were $1.57 billion in 2006 compared with $413 million in 2005. The following table sets forth the operating results of our Investment Banking segment: Investment Banking Operating Results Year Ended November (in millions) 2007 2006 2005 Financial Advisory $4,222 $2,580 $1,905   Equity underwriting 1,382 1,365 704   Debt underwriting 1,951 1,684 1,062 Total Underwriting 3,333 3,049 1,766 Total net revenues 7,555 5,629 3,671 Operating expenses 4,985 4,062 3,258 Pre-tax earnings $2,570 $1,567 $  413 The following table sets forth our financial advisory and underwriting transaction volumes: Goldman Sachs Global Investment Banking Volumes (1) Year Ended November (in billions) 2007 2006 2005 Announced mergers and acquisitions $1,494 $1,104 $747 Completed mergers and acquisitions 1,424 864 584 Equity and equity-related offerings (2) 71 80 49 Debt offerings (3) 312 320 270 (1) Source: Thomson Financial. Announced and completed mergers and acquisitions volumes are based on full credit to each of the advisors in a transaction. Equity and equity-related offerings and debt offerings are based on full credit for single book managers and equal credit for joint book managers. Transaction volumes may not be indicative of net revenues in a given period. (2) Includes Rule 144A and public common stock offerings, convertible offerings and rights offerings. (3) Includes non-convertible preferred stock, mortgage-backed securities, asset-backed securities and taxable municipal debt. Includes publicly registered and Rule 144A issues. (1) Our investment banking transaction backlog represents an estimate of our future net revenues from investment banking transactions where we believe that future revenue realization is more likely than not. 2007 versus 2006. Net revenues in Investment Banking of $7.56 billion for 2007 increased 34% compared with 2006. Net revenues in Financial Advisory of $4.22 billion increased 64% compared with 2006, primarily reflecting growth in industry- wide completed mergers and acquisitions. Net revenues in our Underwriting business of $3.33 billion increased 9% compared with 2006, due to higher net revenues in debt underwriting, primarily reflecting strength in leveraged finance during the first half of 2007. Net revenues in equity underwriting were also strong, but essentially unchanged from 2006. Our investment banking transaction backlog at the end of 2007 was higher than at the end of 2006. (1) Operating expenses of $4.99 billion for 2007 increased 23% compared with 2006, primarily due to increased compensation and benefits expenses resulting from higher discretionary compensation and growth in employment levels. Pre-tax earnings of $2.57 billion in 2007 increased 64% compared with 2006. 56 Goldman Sachs 2007 Annual Report
  • 59.
    Management’s Discussion andAnalysis The following table sets forth the operating results of our Trading and Principal Investments segment: Trading and Principal Investments Operating Results Year Ended November (in millions) 2007 2006 2005 FICC $16,165 $14,262 $  8,940   Equities trading 6,725 4,965 2,675   Equities commissions 4,579 3,518 2,975 Total Equities 11,304 8,483 5,650   ICBC 495 937 —   SMFG (129) 527 1,475   Gross gains 3,728 1,534 767   Gross losses (814) (585) (198)    Net other corporate and real estate investments 2,914 949 569   Overrides 477 404 184 Total Principal Investments 3,757 2,817 2,228 Total net revenues 31,226 25,562 16,818 Operating expenses 17,998 14,962 10,600 Pre-tax earnings $13,228 $10,600 $  6,218 of SMFG. We generate net revenues from returns on these investments and from the increased share of the income and gains derived from our merchant banking funds when the return on a fund’s investments over the life of the fund exceeds certain threshold returns (typically referred to as an override). Substantially all of our inventory is marked-to-market daily and, therefore, its value and our net revenues are subject to fluctuations based on market movements. In addition, net revenues derived from our principal investments in privately held concerns and in real estate may fluctuate significantly depending on the revaluation of these investments in any given period. We also regularly enter into large transactions as part of our trading businesses. The number and size of such transactions may affect our results of operations in a given period. Net revenues from Principal Investments do not include management fees generated from our merchant banking funds. These management fees are included in the net revenues of the Asset Management and Securities Services segment. Trading and Principal Investments Our Trading and Principal Investments segment is divided into three components: ■ FICC. We make markets in and trade interest rate and credit products, mortgage-related securities and loan products and other asset-backed instruments, currencies and commodities, structure and enter into a wide variety of derivative transactions, and engage in proprietary trading and investing. ■ Equities. We make markets in and trade equities and equity- related products, structure and enter into equity derivative transactions and engage in proprietary trading. We generate commissions from executing and clearing client transactions on major stock, options and futures exchanges worldwide through our Equities customer franchise and clearing activities. We also engage in specialist and insurance activities. ■ Principal Investments. We make real estate and corporate principal investments, including our investments in the ordinary shares of ICBC and the convertible preferred stock 57Goldman Sachs 2007 Annual Report
  • 60.
    Management’s Discussion andAnalysis 2006 versus 2005. Net revenues in Trading and Principal Investments of $25.56 billion for 2006 increased 52% compared with 2005. Net revenues in FICC of $14.26 billion increased 60% compared with 2005, primarily due to significantly higher net revenues in credit products (which includes distressed investing) and commodities. In addition, net revenues were higher in interest rate products, currencies and mortgages. During 2006, the business operated in an environment characterized by strong customer-driven activity and favorable market opportunities. In addition, corporate credit spreads tightened, the yield curve flattened and volatility levels were generally low in interest rate and currency markets. Net revenues in Equities of $8.48 billion increased 50% compared with 2005, primarily reflecting significantly higher net revenues in derivatives, across all regions, as well as higher net revenues in shares. The increase also reflected the contribution from our insurance business, which was acquired in 2006. In addition, principal strategies performed well, although net revenues were lower than a particularly strong 2005. During 2006, Equities operated in a favorable environment characterized by strong customer-driven activity, generally higher equity prices and favorable market opportunities, although volatility levels were generally low. Principal Investments recorded net revenues of $2.82 billion for 2006, reflecting a $937 million gain related to our investment in the ordinary shares of ICBC, a $527 million gain related to our investment in the convertible preferred stock of SMFG and $1.35 billion in gains and overrides from other principal investments. Operating expenses of $14.96 billion for 2006 increased 41% compared with 2005, due to increased compensation and benefits expenses, primarily resulting from higher levels of discretionary compensation due to higher net revenues and increased levels of employment, as well as higher non-compensation expenses. Excluding non-compensation expenses related to consolidated entities held for investment purposes, the increase in non-compensation expenses was primarily due to higher brokerage, clearing, exchange and distribution fees, in Equities and FICC, and increased other expenses, primarily due to costs related to our insurance business, which was acquired in 2006, and higher levels of business activity. In addition, professional fees were higher, due to increased legal and consulting fees. Pre-tax earnings of $10.60 billion in 2006 increased 70% compared with 2005. 2007 versus 2006. Net revenues in Trading and Principal Investments of $31.23 billion for 2007 increased 22% compared with 2006. Net revenues in FICC of $16.17 billion for 2007 increased 13% compared with 2006, reflecting significantly higher net revenues in currencies and interest rate products. In addition, net revenues in mortgages were higher despite a significant deterioration in the mortgage market throughout 2007, while net revenues in credit products were strong, but slightly lower compared with 2006. Credit products included substantial gains from equity investments, including a gain of approximately $900 million related to the disposition of Horizon Wind Energy L.L.C., as well as a loss of approximately $1 billion, net of hedges, related to non-investment-grade credit origination activities. Net revenues in commodities were also strong but lower compared with 2006. During 2007, FICC operated in an environment generally characterized by strong customer- driven activity and favorable market opportunities. However, during 2007, the mortgage market experienced significant deterioration and, in the second half of the year, the broader credit markets were characterized by wider spreads and reduced levels of liquidity. Net revenues in Equities of $11.30 billion for 2007 increased 33% compared with 2006, reflecting significantly higher net revenues in both our customer franchise businesses and principal strategies. The customer franchise businesses benefited from significantly higher commission volumes. During 2007, Equities operated in an environment characterized by strong customer- driven activity, generally higher equity prices and higher levels of volatility, particularly during the second half of the year. Principal Investments recorded net revenues of $3.76 billion for 2007, reflecting gains and overrides from corporate and real estate principal investments. Results in Principal Investments included a $495 million gain related to our investment in the ordinary shares of ICBC and a $129 million loss related to our investment in the convertible preferred stock of SMFG. Operating expenses of $18.00 billion for 2007 increased 20% compared with 2006, primarily due to increased compensation and benefits expenses, resulting from higher discretionary compensation and growth in employment levels. Non- compensation expenses increased due to the impact of higher levels of business activity and continued geographic expansion. The majority of this increase was in brokerage, clearing, exchange and distribution fees, which primarily reflected higher transaction volumes in Equities. Other expenses and professional fees also increased, reflecting increased business activity. Pre-tax earnings of $13.23 billion in 2007 increased 25% compared with 2006. 58 Goldman Sachs 2007 Annual Report
  • 61.
    Management’s Discussion andAnalysis Assets under management typically generate fees as a percentage of asset value, which is affected by investment performance and by inflows or redemptions. The fees that we charge vary by asset class, as do our related expenses. In certain circumstances, we are also entitled to receive incentive fees based on a percentage of a fund’s return or when the return on assets under management exceeds specified benchmark returns or other performance targets. Incentive fees are recognized when the performance period ends and they are no longer subject to adjustment. We have numerous incentive fee arrangements, many of which have annual performance periods that end on December 31. For that reason, incentive fees have been seasonally weighted to our first quarter. Asset Management and Securities Services Our Asset Management and Securities Services segment is divided into two components: ■ Asset Management. Asset Management provides investment advisory and financial planning services and offers investment products (primarily through separately managed accounts and commingled vehicles, such as mutual funds and private investment funds) across all major asset classes to a diverse group of institutions and individuals worldwide and primarily generates revenues in the form of management and incentive fees. ■ Securities Services. Securities Services provides prime brokerage services, financing services and securities lending services to institutional clients, including hedge funds, mutual funds, pension funds and foundations, and to high-net-worth individuals worldwide, and generates revenues primarily in the form of interest rate spreads or fees. The following table sets forth the operating results of our Asset Management and Securities Services segment: Asset Management and Securities Services Operating Results Year Ended November (in millions) 2007 2006 2005   Management and other fees $4,303 $3,332 $2,629   Incentive fees 187 962 327 Total Asset Management 4,490 4,294 2,956 Securities Services 2,716 2,180 1,793 Total net revenues 7,206 6,474 4,749 Operating expenses 5,363 4,036 3,070 Pre-tax earnings $1,843 $2,438 $1,679 Assets under management include our mutual funds, alternative investment funds and separately managed accounts for institutional and individual investors. Substantially all assets under management are valued as of calendar month end. Assets under management do not include assets in brokerage accounts that generate commissions, mark-ups and spreads based on transactional activity, or our own investments in funds that we manage. The following table sets forth our assets under management by asset class: Assets Under Management by Asset Class As of November 30 (in billions) 2007 2006 2005 Alternative investments (1) $151 $145 $110 Equity 255 215 167 Fixed income 256 198 154 Total non-money market assets 662 558 431 Money markets 206 118 101 Total assets under management $868 $676 $532 (1) Primarily includes hedge funds, private equity, real estate, currencies, commodities and asset allocation strategies. 59Goldman Sachs 2007 Annual Report
  • 62.
    Management’s Discussion andAnalysis The following table sets forth a summary of the changes in our assets under management: Changes in Assets Under Management Year Ended November 30 (in billions) 2007 2006 2005 Balance, beginning of year $676 $532 $452 Net inflows/(outflows)   Alternative investments 9 32 11   Equity 26 16 25   Fixed income 38 29 16 Total non-money market net inflows/(outflows) 73 (1) 77 52   Money markets 88 17 (2) 11 Total net inflows/(outflows) 161 94 (3) 63 Net market appreciation/(depreciation) 31 50 17 Balance, end of year $868 $676 $532 (1) Includes $7 billion in net asset inflows in connection with our acquisition of Macquarie — IMM Investment Management. (2) Net of the transfer of $8 billion of money market assets under management to interest-bearing deposits at GS Bank USA, a wholly owned subsidiary of Goldman Sachs. These deposits are not included in assets under management. (3) Includes $3 billion of net asset inflows in connection with the acquisition of our variable annuity and life insurance business. 2006 versus 2005. Net revenues in Asset Management and Securities Services of $6.47 billion for 2006 increased 36% compared with 2005. Asset Management net revenues of $4.29 billion increased 45% compared with 2005, reflecting significantly higher management and other fees, principally due to strong growth in assets under management, and significantly higher incentive fees. During the year, assets under management increased $144 billion or 27% to $676 billion, reflecting non-money market net inflows of $77 billion, spread across all asset classes, money market net inflows of $17 billion (2) , and market appreciation of $50 billion, primarily in equity and fixed income assets. Securities Services net revenues of $2.18 billion increased 22% compared with 2005, as our prime brokerage business continued to generate strong results, primarily reflecting significantly higher global customer balances in securities lending and margin lending. Operating expenses of $4.04 billion for 2006 increased 31% compared with 2005, primarily due to increased compensation and benefits expenses, resulting from higher levels of discretionary compensation due to higher net revenues, and increased levels of employment. Non-compensation expenses also increased, primarily due to higher distribution fees. In addition, market development costs were higher, reflecting increased levels of business activity. Pre-tax earnings of $2.44 billion in 2006 increased 45% compared with 2005. (2) Includes the transfer of $8 billion of money market assets under management to interest-bearing deposits at GS Bank USA. These deposits are not included in assets under management. 2007 versus 2006. Net revenues in Asset Management and Securities Services of $7.21 billion for 2007 increased 11% compared with 2006. Asset Management net revenues of $4.49 billion for 2007 increased 5% compared with 2006, reflecting a 29% increase in management and other fees, partially offset by significantly lower incentive fees. Incentive fees were $187 million for 2007 compared with $962 million for 2006. During 2007, assets under management increased $192 billion, or 28%, to $868 billion, reflecting non-money market net inflows of $73 billion (1) , primarily in fixed income and equity assets, money market net inflows of $88 billion, and net market appreciation of $31 billion, reflecting appreciation in fixed income and equity assets, partially offset by depreciation in alternative investment assets. Securities Services net revenues of $2.72 billion for 2007 increased 25% compared with 2006, as our prime brokerage business continued to generate strong results, primarily reflecting significantly higher customer balances in securities lending and margin lending. Operating expenses of $5.36 billion for 2007 increased 33% compared with 2006, primarily due to increased compensation and benefits expenses resulting from higher discretionary compensation and growth in employment levels, and higher distribution fees (included in brokerage, clearing, exchange and distribution fees). Pre-tax earnings of $1.84 billion in 2007 decreased 24% compared with 2006. (1) Includes $7 billion in net asset inflows in connection with our acquisition of Macquarie — IMM Investment Management. 60 Goldman Sachs 2007 Annual Report
  • 63.
    Management’s Discussion andAnalysis residential mortgages, home equity and auto loans, government and corporate bonds, and other types of financial assets. Other reasons for entering into these arrangements include underwriting client securitization transactions; providing secondary market liquidity; making investments in performing and nonperforming debt, equity, real estate and other assets; providing investors with credit-linked and asset-repackaged notes; and receiving or providing letters of credit to satisfy margin requirements and to facilitate the clearance and settlement process. We engage in transactions with variable interest entities (VIEs) and qualifying special-purpose entities (QSPEs). Such vehicles are critical to the functioning of several significant investor markets, including the mortgage-backed and other asset- backed securities markets, since they offer investors access to specific cash flows and risks created through the securitization process. Our financial interests in, and derivative transactions with, such nonconsolidated entities are accounted for at fair value, in the same manner as our other financial instruments, except in cases where we apply the equity method of accounting. While we are routinely involved with VIEs and QSPEs in connection with our securitization activities, we did not have off-balance-sheet commitments to purchase or finance collateralized debt obligations held by structured investment vehicles as of November 2007. Geographic Data For a summary of the net revenues and pre-tax earnings of Goldman Sachs by geographic region, see Note 16 to the consolidated financial statements. Off-Balance-Sheet Arrangements We have various types of off-balance-sheet arrangements that we enter into in the ordinary course of business. Our involvement in these arrangements can take many different forms, including purchasing or retaining residual and other interests in mortgage- backed and other asset-backed securitization vehicles; holding senior and subordinated debt, interests in limited and general partnerships, and preferred and common stock in other nonconsolidated vehicles; entering into interest rate, foreign currency, equity, commodity and credit derivatives, including total return swaps; entering into operating leases; and providing guarantees, indemnifications, loan commitments, letters of credit and representations and warranties. We enter into these arrangements for a variety of business purposes, including the securitization of commercial and The following table sets forth where a discussion of these and other off-balance-sheet arrangements may be found in this Annual Report: Type of Off-Balance-Sheet Arrangement Disclosure in Annual Report Retained interests or contingent interests in assets See Note 3 to the consolidated financial statements. transferred by us to nonconsolidated entities Leases, letters of credit, and loans and other commitments See “— Contractual Obligations and Commitments” below and Note 6 to the consolidated financial statements. Guarantees See Note 6 to the consolidated financial statements. Other obligations, including contingent obligations, arising out See Note 3 to the consolidated financial statements. of variable interests we have in nonconsolidated entities Derivative contracts See “— Critical Accounting Policies” above and “— Risk Management” below and Notes 3 and 5 to the consolidated financial statements. In addition, see Note 2 to the consolidated financial statements for a discussion of our consolidation policies. 61Goldman Sachs 2007 Annual Report
  • 64.
    Management’s Discussion andAnalysis Subsidiary Capital Requirements Many of our principal subsidiaries are subject to separate regulation and capital requirements in the United States and/or elsewhere. Goldman, Sachs Co. and Goldman Sachs Execution Clearing, L.P. are registered U.S. broker-dealers and futures commissions merchants, and are subject to regulatory capital requirements, including those imposed by the SEC, the Commodity Futures Trading Commission, the Chicago Board of Trade, The Financial Industry Regulatory Authority (FINRA) and the National Futures Association. Goldman Sachs International, our regulated U.K. broker-dealer, is subject to minimum capital requirements imposed by the U.K.’s Financial Services Authority. Goldman Sachs Japan Co., Ltd., our regulated Japanese broker-dealer, is subject to minimum capital requirements imposed by Japan’s Financial Services Agency. Several other subsidiaries of Goldman Sachs are regulated by securities, investment advisory, banking, insurance, and other regulators and authorities around the world. As of November 2007 and November 2006, these subsidiaries were in compliance with their local capital requirements. As discussed above, many of our subsidiaries are subject to regulatory capital requirements in jurisdictions throughout the world. Subsidiaries not subject to separate regulation may hold capital to satisfy local tax guidelines, rating agency requirements (for entities with assigned credit ratings) or internal policies, including policies concerning the minimum amount of capital a subsidiary should hold based on its underlying level of risk. See “— Liquidity and Funding Risk — Conservative Liability Structure” below for a discussion of our potential inability to access funds from our subsidiaries. Equity investments in subsidiaries are generally funded with parent company equity capital. As of November 2007, Group Inc.’s equity investment in subsidiaries was $40.00 billion compared with its total shareholders’ equity of $42.80 billion. Our capital invested in non-U.S. subsidiaries is generally exposed to foreign exchange risk, substantially all of which is managed through a combination of derivative contracts and non-U.S. denominated debt. In addition, we generally manage the non- trading exposure to foreign exchange risk that arises from transactions denominated in currencies other than the transacting entity’s functional currency. See Note 15 to the consolidated financial statements for further information regarding our regulated subsidiaries. Equity Capital The level and composition of our equity capital are principally determined by our consolidated regulatory capital requirements but may also be influenced by rating agency guidelines, subsidiary capital requirements, the business environment, conditions in the financial markets and assessments of potential future losses due to extreme and adverse changes in our business and market environments. As of November 2007, our total shareholders’ equity was $42.80 billion (consisting of common shareholders’ equity of $39.70 billion and preferred stock of $3.10 billion) compared with total shareholders’ equity of $35.79 billion as of November 2006 (consisting of common shareholders’ equity of $32.69 billion and preferred stock of $3.10 billion). In addition to total shareholders’ equity, we consider the $5.00 billion of junior subordinated debt issued to trusts (see discussion below) to be part of our equity capital, as it qualifies as capital for regulatory and certain rating agency purposes. Consolidated Regulatory Capital Requirements Goldman Sachs is regulated by the Securities and Exchange Commission (SEC) as a CSE and, as such, is subject to group- wide supervision and examination by the SEC and to minimum capital adequacy standards on a consolidated basis. Minimum capital adequacy standards are principally driven by the amount of our market risk, credit risk and operational risk as calculated by methodologies approved by the SEC. Eligible sources of regulatory capital include common equity and certain types of preferred stock, debt and hybrid capital instruments, including our junior subordinated debt issued to trusts. The recognition of preferred stock, debt and hybrid capital instruments as regulatory capital is subject to limitations. Goldman Sachs was in compliance with the CSE capital adequacy standards as of November 2007 and November 2006. Rating Agency Guidelines The credit rating agencies assign credit ratings to the obligations of The Goldman Sachs Group, Inc., which directly issues or guarantees substantially all of Goldman Sachs’ senior unsecured obligations. The level and composition of our equity capital are among the many factors considered in determining our credit ratings. Each agency has its own definition of eligible capital and methodology for evaluating capital adequacy, and assessments are generally based on a combination of factors rather than a single calculation. See “— Liquidity and Funding Risk — Credit Ratings” below for further information regarding our credit ratings. 62 Goldman Sachs 2007 Annual Report
  • 65.
    Management’s Discussion andAnalysis Preferred Stock. As of November 2007, Goldman Sachs had 124,000 shares of perpetual non-cumulative preferred stock issued and outstanding in four series as set forth in the following table: Preferred Stock by Series Shares Shares Earliest Redemption Value Series Issued Authorized Dividend Rate Redemption Date (in millions) A 30,000 50,000 3 month LIBOR + 0.75%, with floor of 3.75% per annum April 25, 2010 $  750 B 32,000 50,000 6.20% per annum October 31, 2010 800 C 8,000 25,000 3 month LIBOR + 0.75%, with floor of 4% per annum October 31, 2010 200 D 54,000 60,000 3 month LIBOR + 0.67%, with floor of 4% per annum May 24, 2011 1,350 124,000 185,000 $3,100 by general market conditions and the prevailing price and trading volumes of our common stock. The following table sets forth the level of share repurchases for the years ended November 2007 and November 2006: As of November (in millions, except per share amounts) 2007 2006 Number of shares repurchased 41.22 50.23 Total cost $  8,956 $  7,817 Average cost per share $217.29 $155.64 The repurchase program was increased by 60.0 million shares on December 17, 2007. Taking into account this increased authorization, the total remaining authorization under the repurchase program was 65.4 million shares as of January 18, 2008. For additional information on our repurchase program, see “Market for Registrant’s Common Equity, Related Stockholder Matters and Issuer Purchases of Equity Securities” in Part ll, Item 5 of the Annual Report on Form 10-K. Our ability to declare or pay dividends on, or purchase, redeem or otherwise acquire, our common stock is subject to certain restrictions in the event that we fail to pay or set aside full dividends on our preferred stock for the latest completed dividend period. All series of preferred stock are pari passu and have a preference over our common stock upon liquidation. Equity Capital Management Our objective is to maintain a sufficient level and optimal composition of equity capital. We manage our capital through repurchases of our common stock and issuances of preferred stock, junior subordinated debt issued to trusts and other subordinated debt. We manage our capital requirements principally by setting limits on balance sheet assets and/or limits on risk, in each case at both the consolidated and business unit levels. We attribute capital usage to each of our business units based upon the CSE regulatory capital framework and manage the levels of usage based upon the balance sheet and risk limits established. Share Repurchase Program. We use our share repurchase program to help maintain the appropriate level of common equity and to substantially offset increases in share count over time resulting from employee share-based compensation. The repurchase program is effected primarily through regular open- market purchases, the amounts and timing of which are determined primarily by our current and projected capital positions (i.e., comparisons of our desired level of capital to our actual level of capital) but which may also be influenced Each share of preferred stock issued and outstanding has a par value of $0.01, has a liquidation preference of $25,000, is represented by 1,000 depositary shares and is redeemable at our option at a redemption price equal to $25,000 plus declared and unpaid dividends. Dividends on each series of preferred stock, if declared, are payable quarterly in arrears. 63Goldman Sachs 2007 Annual Report
  • 66.
    Management’s Discussion andAnalysis Junior Subordinated Debt Issued to a Trust in Connection with Trust Preferred Securities. We issued $2.84 billion of junior subordinated debentures in the first quarter of 2004 to Goldman Sachs Capital I, a Delaware statutory trust that, in turn, issued $2.75 billion of guaranteed preferred beneficial interests to third parties and $85 million of common beneficial interests to Goldman Sachs. The junior subordinated debentures are included in “Unsecured long-term borrowings” in the consolidated statements of financial condition. Because of certain characteristics of the junior subordinated debt (and the associated trust preferred securities), including its long-term nature, our ability to defer coupon interest for up to ten consecutive semiannual periods and the subordinated nature of the debt in our capital structure, it qualifies as regulatory capital for CSE purposes and is included as part of our equity capital. Subordinated Debt. In addition to junior subordinated debt issued to trusts, we had other outstanding subordinated debt of $11.23 billion as of November 2007. Although not part of our shareholders’ equity, subordinated debt may be used to meet a portion of our consolidated capital requirements as a CSE. Junior Subordinated Debt Issued to Trusts in Connection with Normal Automatic Preferred Enhanced Capital Securities. In the second quarter of 2007, we issued $1.75 billion of fixed rate junior subordinated debt to Goldman Sachs Capital II and $500 million of floating rate junior subordinated debt to Goldman Sachs Capital III, Delaware statutory trusts that, in turn, issued $2.25 billion of guaranteed perpetual Automatic Preferred Enhanced Capital Securities (APEX) to third parties and a de minimis amount of common securities to Goldman Sachs. The junior subordinated debt is included in “Unsecured long-term borrowings” in the consolidated statements of financial condition. In connection with the APEX issuance, we entered into stock purchase contracts with Goldman Sachs Capital II and III under which we will be obligated to sell and these entities will be obligated to purchase $2.25 billion of perpetual non-cumulative preferred stock that we will issue in the future. Goldman Sachs Capital II and III are required to remarket the junior subordinated debt in order to fund their purchase of the preferred stock, but in the event that a remarketing is unsuccessful, they will relinquish the subordinated debt to us in exchange for the preferred stock. Because of certain characteristics of the junior subordinated debt (and the associated APEX), including its long-term nature, the future issuance of perpetual non-cumulative preferred stock under the stock purchase contracts, our ability to defer payments due on the debt and the subordinated nature of the debt in our capital structure, it qualifies as regulatory capital for CSE purposes and is included as part of our equity capital. 64 Goldman Sachs 2007 Annual Report
  • 67.
    Management’s Discussion andAnalysis The following table sets forth the reconciliation of total shareholders’ equity to tangible equity capital: As of November (in millions) 2007 2006 Total shareholders’ equity $42,800 $35,786 Add: Junior subordinated debt   issued to trusts 5,000 2,750 Deduct: Goodwill and identifiable intangible   assets, excluding power contracts (5,072) (5,019) Tangible equity capital $42,728 $33,517 (3) Leverage ratio equals total assets divided by total shareholders’ equity. (4) Adjusted leverage ratio equals adjusted assets divided by tangible equity capital. We believe that the adjusted leverage ratio is a more meaningful measure of our capital adequacy than the leverage ratio because it excludes certain low-risk collateralized assets that are generally supported with little or no capital and reflects the tangible equity capital deployed in our businesses. (5) Debt to equity ratio equals unsecured long-term borrowings divided by total shareholders’ equity. (6) Tangible common shareholders’ equity equals total shareholders’ equity less preferred stock, goodwill and identifiable intangible assets, excluding power contracts. We do not deduct identifiable intangible assets associated with power contracts from total shareholders’ equity because, unlike other intangible assets, less than 50% of these assets are supported by common shareholders’ equity. The following table sets forth a reconciliation of total shareholders’ equity to tangible common shareholders’ equity: As of November (in millions) 2007 2006 Total shareholders’ equity $42,800 $35,786 Deduct: Preferred stock (3,100) (3,100) Common shareholders’ equity 39,700 32,686 Deduct: Goodwill and identifiable intangible   assets, excluding power contracts (5,072) (5,019) Tangible common shareholders’ equity $34,628 $27,667 (7) Book value per common share is based on common shares outstanding, including restricted stock units granted to employees with no future service requirements, of 439.0 million and 450.1 million as of November 2007 and November 2006, respectively. (8) Tangible book value per common share is computed by dividing tangible common shareholders’ equity by the number of common shares outstanding, including restricted stock units granted to employees with no future service requirements. Capital Ratios and Metrics The following table sets forth information on our assets, shareholders’ equity, leverage ratios and book value per common share: As of November ($ in millions, except per share amounts) 2007 2006 Total assets $1,119,796 $838,201 Adjusted assets (1) 747,300 541,033 Total shareholders’ equity 42,800 35,786 Tangible equity capital (2) 42,728 33,517 Leverage ratio (3) 26.2x 23.4x Adjusted leverage ratio (4) 17.5x 16.1x Debt to equity ratio (5) 3.8x 3.4x Common shareholders’ equity 39,700 32,686 Tangible common   shareholders’ equity (6) 34,628 27,667 Book value per common share (7) $     90.43 $   72.62 Tangible book value   per common share (8) 78.88 61.47 (1) Adjusted assets excludes (i) low-risk collateralized assets generally associated with our matched book and securities lending businesses (which we calculate by adding our securities borrowed and financial instruments purchased under agreements to resell, at fair value, and then subtracting our nonderivative short positions), (ii) cash and securities we segregate for regulatory and other purposes and (iii) goodwill and identifiable intangible assets, excluding power contracts. We do not deduct identifiable intangible assets associated with power contracts from total assets in order to be consistent with the calculation of tangible equity capital and the adjusted leverage ratio (see footnote 2 below). The following table sets forth a reconciliation of total assets to adjusted assets: As of November (in millions) 2007 2006 Total assets $1,119,796 $ 838,201 Deduct: Securities borrowed (277,413) (219,342) Financial instruments   purchased under agreements   to resell, at fair value (85,717) (82,126) Add: Financial instruments sold,   but not yet purchased,   at fair value 215,023 155,805 Less derivative liabilities (99,378) (65,496) Subtotal 115,645 90,309 Deduct: Cash and securities segregated   for regulatory and other purposes (119,939) (80,990) Goodwill and identifiable intangible   assets, excluding power contracts (5,072) (5,019) Adjusted assets $  747,300 $ 541,033 (2) Tangible equity capital equals total shareholders’ equity and junior subordinated debt issued to trusts less goodwill and identifiable intangible assets, excluding power contracts. We do not deduct identifiable intangible assets associated with power contracts from total shareholders’ equity because, unlike other intangible assets, less than 50% of these assets are supported by common shareholders’ equity. We consider junior subordinated debt issued to trusts to be a component of our tangible equity capital base due to certain characteristics of the debt, including its long-term nature, our ability to defer payments due on the debt and the subordinated nature of the debt in our capital structure. 65Goldman Sachs 2007 Annual Report
  • 68.
    Management’s Discussion andAnalysis Contractual Obligations and Commitments Goldman Sachs has contractual obligations to make future payments related to our unsecured long-term borrowings, secured long-term financings, long-term noncancelable lease agreements and purchase obligations and has commitments under a variety of commercial arrangements. The following table sets forth our contractual obligations by fiscal maturity date as of November 2007: Contractual Obligations (in millions) 2008 2009 – 2010 2011– 2012 2013 – Thereafter Total Unsecured long-term borrowings (1) (2) (3) $    — $36,885 $29,295 $97,994 $164,174 Secured long-term financings (1) (2) (4) — 5,204 7,400 20,696 33,300 Minimum rental payments 450 850 568 2,022 3,890 Purchase obligations (5) 2,176 309 21 27 2,533 (1) Obligations maturing within one year of our financial statement date or redeemable within one year of our financial statement date at the option of the holder are excluded from this table and are treated as short-term obligations. See Note 3 to the consolidated financial statements for further information regarding our secured financings. (2) Obligations that are repayable prior to maturity at the option of Goldman Sachs are reflected at their contractual maturity dates. Obligations that are redeemable prior to maturity at the option of the holder are reflected at the dates such options become exercisable. (3) Includes $15.93 billion accounted for at fair value under SFAS No. 155 or SFAS No. 159 as of November 2007, primarily consisting of hybrid financial instruments. (4) These obligations are reported within “Other secured financings” in the consolidated statements of financial condition and include $18.53 billion accounted for at fair value under SFAS No. 159 as of November 2007. (5) Primarily includes amounts related to the acquisition of Litton Loan Servicing LP (Litton) and construction-related obligations. As of November 2007 and November 2006, we had construction- related obligations of $769 million and $1.63 billion, respectively, including outstanding commitments of $642 million and $500 million as of November 2007 and November 2006, respectively, related to our new world headquarters in New York City, which is expected to cost between $2.3 billion and $2.5 billion. We are partially financing this construction project with tax-exempt Liberty Bonds. We borrowed approximately $1.40 billion and approximately $250 million in 2005 and 2007, respectively, through the issuance of Liberty Bonds. In addition, we entered into an agreement in 2007 to acquire Litton, the mortgage servicing unit of Credit-Based Asset Servicing and Securitization LLC (C-BASS). The transaction closed in December 2007 at a purchase price of $428 million, plus repayment of $916 million of outstanding Litton debt obligations. As of November 2007, our unsecured long-term borrowings were $164.17 billion, with maturities extending to 2043, and consisted principally of senior borrowings. See Note 5 to the consolidated financial statements for further information regarding our unsecured long-term borrowings. As of November 2007, our future minimum rental payments, net of minimum sublease rentals, under noncancelable leases were $3.89 billion. These lease commitments, principally for office space, expire on various dates through 2069. Certain agreements are subject to periodic escalation provisions for increases in real estate taxes and other charges. See Note 6 to the consolidated financial statements for further information regarding our leases. Our occupancy expenses include costs associated with office space held in excess of our current requirements. This excess space, the cost of which is charged to earnings as incurred, is being held for potential growth or to replace currently occupied space that we may exit in the future. We regularly evaluate our current and future space capacity in relation to current and projected staffing levels. In 2007, we incurred exit costs of $128 million (included in “occupancy” and “depreciation and amortization” expenses in the consolidated statements of earnings). We may incur additional exit costs in 2008 and thereafter to the extent we (i) reduce our space capacity or (ii) commit to, or occupy, new properties in the locations in which we operate and, consequently, dispose of existing space that had been held for potential growth. These exit costs may be material to our results of operations in a given period. 66 Goldman Sachs 2007 Annual Report
  • 69.
    Management’s Discussion andAnalysis of Group Inc. The commitments extended by Commitment Corp. are supported, in part, by funding raised by William Street Funding Corporation (Funding Corp.), another consolidated wholly owned subsidiary of Group Inc. whose assets and liabilities are also legally separated from other assets and liabilities of Goldman Sachs. With respect to most of the William Street commitments, SMFG provides us with credit loss protection that is generally limited to 95% of the first loss we realize on approved loan commitments, up to a maximum of $1.00 billion. In addition, subject to the satisfaction of certain conditions, upon our request, SMFG will provide protection for 70% of the second loss on such commitments, up to a maximum of $1.13 billion. We also use other financial instruments to mitigate credit risks related to certain William Street commitments not covered by SMFG. Our commitments to extend credit also include financing for the warehousing of financial assets to be securitized. These financings are expected to be repaid from the proceeds of the related securitizations for which we may or may not act as underwriter. These arrangements are secured by the warehoused assets, primarily consisting of corporate bank loans and commercial mortgages as of November 2007 and residential mortgages and mortgage-backed securities, corporate bank loans and commercial mortgages as of November 2006. See Note 6 to the consolidated financial statements for further information regarding our commitments, contingencies and guarantees. The following table sets forth our commitments as of November 2007: Commitments Commitment Amount by Fiscal Period of Expiration (in millions) 2008 2009 – 2010 2011– 2012 2013 – Thereafter Total Commitments to extend credit   Commercial lending:    Investment-grade $  4,456 $  3,108 $  3,248 $   907 $  11,719    Non-investment-grade 2,956 2,969 6,845 29,160 41,930   William Street program 2,571 4,046 16,929 942 24,488   Warehouse financing 3,386 1,224 — — 4,610 Total commitments to extend credit 13,369 11,347 27,022 31,009 82,747 Forward starting resale and securities   borrowing agreements 24,269 3,867 — — 28,136 Forward starting repurchase and securities   lending agreements 15,392 — — — 15,392 Commitments under letters of credit   issued by banks to counterparties 8,281 271 183 12 8,747 Investment commitments 6,180 7,827 1,594 2,157 17,758 Underwriting commitments 88 — — — 88 Total $67,579 $23,312 $28,799 $33,178 $152,868 Our commitments to extend credit are agreements to lend to counterparties that have fixed termination dates and are contingent on the satisfaction of all conditions to borrowing set forth in the contract. In connection with our lending activities, we had outstanding commitments to extend credit of $82.75 billion as of November 2007 compared with $100.48 billion as of November 2006. Since these commitments may expire unused or be reduced or cancelled at the counter- party’s request, the total commitment amount does not necessarily reflect the actual future cash flow requirements. Our commercial lending commitments are generally extended in connection with contingent acquisition financing and other types of corporate lending as well as commercial real estate financing. We may seek to reduce our credit risk on these commitments by syndicating all or substantial portions of commitments to other investors. In addition, commitments that are extended for contingent acquisition financing are often intended to be short- term in nature, as borrowers often seek to replace them with other funding sources. Substantially all of the commitments provided under the William Street credit extension program are to investment- grade corporate borrowers. Commitments under the program are extended by William Street Commitment Corporation (Commitment Corp.), a consolidated wholly owned subsidiary of Group Inc. whose assets and liabilities are legally separated from other assets and liabilities of Goldman Sachs, William Street Credit Corporation, GS Bank USA, Goldman Sachs Credit Partners L.P. or other consolidated wholly owned subsidiaries 67Goldman Sachs 2007 Annual Report
  • 70.
    Management’s Discussion andAnalysis Market risk limits are monitored by the Finance Division and are reviewed regularly by the appropriate risk committee. Limit violations are reported to the appropriate risk committee and business unit managers and addressed, as necessary. Credit risk limits are also monitored by the Finance Division and reviewed by the appropriate risk committee. Business Practices Committee. The Business Practices Committee assists senior management in its oversight of compliance and operational risks and related reputational concerns, seeks to ensure the consistency of our policies, practices and procedures with our Business Principles, and makes recommendations on ways to mitigate potential risks. Firmwide Capital Committee. The Firmwide Capital Committee reviews and approves transactions involving commitments of our capital. Such capital commitments include, but are not limited to, extensions of credit, alternative liquidity commitments, certain bond underwritings and certain distressed debt and principal finance activities. The Firmwide Capital Committee is also responsible for establishing business and reputational standards for capital commitments and seeking to ensure that they are maintained on a global basis. Commitments Committee. The Commitments Committee reviews and approves underwriting and distribution activities, primarily with respect to offerings of equity and equity-related securities, and sets and maintains policies and procedures designed to ensure that legal, reputational, regulatory and business standards are maintained in conjunction with these activities. In addition to reviewing specific transactions, the Commitments Committee periodically conducts strategic reviews of industry sectors and products and establishes policies in connection with transaction practices. Credit Policy Committee. The Credit Policy Committee establishes and reviews broad credit policies and parameters that are implemented by the Credit Department. Finance Committee. The Finance Committee establishes and oversees our liquidity policies, sets certain inventory position limits and has oversight responsibility for liquidity risk, the size and composition of our balance sheet and capital base, and our credit ratings. The Finance Committee regularly reviews our funding position and capitalization and makes adjustments in light of current events, risks and exposures. New Products Committee. The New Products Committee, under the oversight of the Firmwide Risk Committee, is responsible for reviewing and approving new products and businesses globally. Operational Risk Committee. The Operational Risk Committee provides oversight of the ongoing development and implementation of our operational risk policies, framework and methodologies, and monitors the effectiveness of operational risk management. Risk Management Management believes that effective risk management is of primary importance to the success of Goldman Sachs. Accordingly, we have a comprehensive risk management process to monitor, evaluate and manage the principal risks we assume in conducting our activities. These risks include market, credit, liquidity, operational, legal and reputational exposures. Risk Management Structure We seek to monitor and control our risk exposure through a variety of separate but complementary financial, credit, operational, compliance and legal reporting systems. In addition, a number of committees are responsible for monitoring risk exposures and for general oversight of our risk management process, as described further below. These committees (including their subcommittees), meet regularly and consist of senior members of both our revenue-producing units and departments that are independent of our revenue-producing units. Segregation of duties and management oversight are fundamental elements of our risk management process. In addition to the committees described below, functions that are independent of the revenue-producing units, such as Compliance, Finance, Legal, Management Controls (Internal Audit) and Operations, perform risk management functions, which include monitoring, analyzing and evaluating risk. Management Committee. All risk control functions ultimately report to our Management Committee. Through both direct and delegated authority, the Management Committee approves all of our operating activities and trading risk parameters. Risk Committees. The Firmwide Risk Committee reviews the activities of existing trading businesses, approves new businesses and products, approves firmwide market risk limits, reviews business unit market risk limits, approves market risk limits for selected sovereign markets and business units, approves sovereign credit risk limits and credit risk limits by ratings group, and reviews scenario analyses based on abnormal or “catastrophic” market movements. The Divisional Risk Committee sets market risk limits for our trading activities subject to overall firmwide risk limits, based on a number of measures, including VaR, stress tests and scenario analyses. Several other committees oversee various risk, valuation, operational, credit and business practice issues related to our asset management business. Business unit risk limits are established by the various risk committees and may be further allocated by the business unit managers to individual trading desks. Trading desk managers have the first line of responsibility for managing risk within prescribed limits. These managers have in-depth knowledge of the primary sources of risk in their respective markets and the instruments available to hedge their exposures. 68 Goldman Sachs 2007 Annual Report
  • 71.
    Management’s Discussion andAnalysis ■ scenario analyses, stress tests and other analytical tools that measure the potential effects on our trading net revenues of various market events, including, but not limited to, a large widening of credit spreads, a substantial decline in equity markets and significant moves in selected emerging markets; and ■ inventory position limits for selected business units. VaR VaR is the potential loss in value of trading positions due to adverse market movements over a defined time horizon with a specified confidence level. For the VaR numbers reported below, a one-day time horizon and a 95% confidence level were used. This means that there is a 1 in 20 chance that daily trading net revenues will fall below the expected daily trading net revenues by an amount at least as large as the reported VaR. Thus, shortfalls from expected trading net revenues on a single trading day greater than the reported VaR would be anticipated to occur, on average, about once a month. Shortfalls on a single day can exceed reported VaR by significant amounts. Shortfalls can also accumulate over a longer time horizon such as a number of consecutive trading days. The modeling of the risk characteristics of our trading positions involves a number of assumptions and approximations. While management believes that these assumptions and approximations are reasonable, there is no standard methodology for estimating VaR, and different assumptions and/or approximations could produce materially different VaR estimates. We use historical data to estimate our VaR and, to better reflect current asset volatilities, we generally weight historical data to give greater importance to more recent observations. Given its reliance on historical data, VaR is most effective in estimating risk exposures in markets in which there are no sudden fundamental changes or shifts in market conditions. An inherent limitation of VaR is that the distribution of past changes in market risk factors may not produce accurate predictions of future market risk. Different VaR methodologies and distributional assumptions could produce a materially different VaR. Moreover, VaR calculated for a one-day time horizon does not fully capture the market risk of positions that cannot be liquidated or offset with hedges within one day. Structured Products Committee. The Structured Products Committee reviews and approves structured product transactions entered into with our clients that raise legal, regulatory, tax or accounting issues or present reputational risk to Goldman Sachs. Market Risk The potential for changes in the market value of our trading and investing positions is referred to as market risk. Such positions result from market-making, proprietary trading, underwriting, specialist and investing activities. Substantially all of our inventory positions are marked-to-market on a daily basis and changes are recorded in net revenues. Categories of market risk include exposures to interest rates, equity prices, currency rates and commodity prices. A description of each market risk category is set forth below: ■ Interest rate risks primarily result from exposures to changes in the level, slope and curvature of the yield curve, the volatility of interest rates, mortgage prepayment speeds and credit spreads. ■ Equity price risks result from exposures to changes in prices and volatilities of individual equities, equity baskets and equity indices. ■ Currency rate risks result from exposures to changes in spot prices, forward prices and volatilities of currency rates. ■ Commodity price risks result from exposures to changes in spot prices, forward prices and volatilities of commodities, such as electricity, natural gas, crude oil, petroleum products, and precious and base metals. We seek to manage these risks by diversifying exposures, controlling position sizes and establishing economic hedges in related securities or derivatives. For example, we may hedge a portfolio of common stocks by taking an offsetting position in a related equity-index futures contract. The ability to manage an exposure may, however, be limited by adverse changes in the liquidity of the security or the related hedge instrument and in the correlation of price movements between the security and related hedge instrument. In addition to applying business judgment, senior management uses a number of quantitative tools to manage our exposure to market risk for “Financial instruments owned, at fair value” and “Financial instruments sold, but not yet purchased, at fair value” in the consolidated statements of financial condition. These tools include: ■ risk limits based on a summary measure of market risk exposure referred to as VaR; 69Goldman Sachs 2007 Annual Report
  • 72.
    Management’s Discussion andAnalysis The following tables set forth the daily VaR: Average Daily VaR (1) (in millions) Year Ended November Risk Categories 2007 2006 2005 Interest rates $  85 $  49 $ 37 Equity prices 100 72 34 Currency rates 23 21 17 Commodity prices 26 30 26 Diversification effect (2) (96) (71) (44) Total $138 $101 $ 70 (1) Certain portfolios and individual positions are not included in VaR, where VaR is not the most appropriate measure of risk (e.g., due to transfer restrictions and/or illiquidity). See “— Other Market Risk Measures” below. (2) Equals the difference between total VaR and the sum of the VaRs for the four risk categories. This effect arises because the four market risk categories are not perfectly correlated. Our average daily VaR increased to $138 million in 2007 from $101 million in 2006. The increase was primarily due to higher levels of exposure and volatility in interest rates and equity prices. Our average daily VaR increased to $101 million in 2006 from $70 million in 2005. We increased our level of exposure across all risk categories, particularly equity prices and interest rates. Daily VaR (in millions) As of November Year Ended November 2007 Risk Categories 2007 2006 High Low Interest rates $ 105 $  51 $152 $  42 Equity prices 82 84 167 59 Currency rates 35 15 41 12 Commodity prices 33 21 51 17 Diversification effect (1) (121) (52) Total $ 134 $119 $181 $104 (1) Equals the difference between total VaR and the sum of the VaRs for the four risk categories. This effect arises because the four market risk categories are not perfectly correlated. 70 Goldman Sachs 2007 Annual Report
  • 73.
    Management’s Discussion andAnalysis Our daily VaR increased to $134 million as of November 2007 from $119 million as of November 2006. The increase primarily reflected higher levels of exposure to interest rates, currency rates and commodity prices, as well as increased levels of volatility in interest rates, partially offset by the benefit of increased diversification effects among different risk categories. The following chart presents our daily VaR during 2007: Daily VaR ($ in millions) 0 First Quarter 2007 Second Quarter 2007 Third Quarter 2007 Fourth Quarter 2007 20 40 60 80 100 120 140 160 180 200 DailyTradingVaR Trading Net Revenues Distribution The following chart sets forth the frequency distribution of our daily trading net revenues for substantially all inventory positions included in VaR for the year ended November 2007: Daily Trading Net Revenues ($ in millions) 0 (100) 15 (100)–(75) 4 (75)–(50) 5 (50)–(25) 12 (25)–0 16 0–25 25 25–50 30 50–75 36 75–100 33 100 10 20 30 40 50 60 70 80 90 100 NumberofDays 88 Daily Trading Net Revenues As part of our overall risk control process, daily trading net revenues are compared with VaR calculated as of the end of the prior business day. Trading losses incurred on a single day exceeded our 95% one-day VaR on ten occasions during 2007. 71Goldman Sachs 2007 Annual Report
  • 74.
    Management’s Discussion andAnalysis instruments, completed or pending third-party transactions in the underlying investment or comparable entities, subsequent rounds of financing, recapitalizations and other transactions across the capital structure, offerings in the equity or debt capital markets, and changes in financial ratios or cash flows. The sensitivity analysis of our investment in the ordinary shares of ICBC excludes interests held by investment funds managed by Goldman Sachs. The sensitivity analysis of our investment in the convertible preferred stock of SMFG, net of the economic hedge on a substantial portion of the common stock underlying our investment, is measured by the impact of a decline in the SMFG common stock price. This sensitivity should not be extrapolated to a significant decline in the SMFG common stock price, as the relationship between the fair value of our investment and the SMFG common stock price would be nonlinear due to downside protection on the conversion stock price. In addition, as of November 2007 and November 2006, in our bank and insurance subsidiaries we held approximately $10.58 billion and $9.95 billion of securities, respectively, primarily consisting of mortgage-backed, federal agency and investment-grade corporate bonds. The following table sets forth market risk for positions not included in VaR. These measures do not reflect diversification benefits across asset categories and, given the differing likelihood of the potential declines in asset categories, these measures have not been aggregated: (in millions) 10% Sensitivity Amount as of November Asset Categories 10% Sensitivity Measure 2007 2006 Trading Risk (1)   Equity Underlying asset value $1,325 $377   Debt Underlying asset value 1,020 725 Non-trading Risk   ICBC ICBC ordinary share price 250 191   SMFG SMFG common stock price 41 140   Other Equity Underlying asset value 1,013 390   Debt Underlying asset value 500 199   Real Estate (2) Underlying asset value 1,108 341 (1) In addition to the positions in these portfolios, which are accounted for at fair value, we make investments accounted for under the equity method and we also make direct investments in real estate, both of which are included in “Other assets” in the consolidated statements of financial condition. Direct investments in real estate are accounted for at cost less accumulated depreciation. See Note 10 to the consolidated financial statements for information on “Other assets.” (2) Relates to interests in our real estate investment funds. Other Market Risk Measures Certain portfolios and individual positions are not included in VaR, where VaR is not the most appropriate measure of risk (e.g., due to transfer restrictions and/or illiquidity). The market risk related to our investments in the ordinary shares of ICBC and the convertible preferred stock of SMFG is measured by estimating the potential reduction in net revenues associated with a 10% decline in the ICBC ordinary share price and a 10% decline in the SMFG common stock price, respectively. The market risk related to the remaining positions is measured by estimating the potential reduction in net revenues associated with a 10% decline in asset values. The sensitivity analyses for equity and debt positions in our trading portfolio and equity, debt (primarily mezzanine instruments) and real estate positions in our non-trading portfolio are measured by the impact of a decline in the asset values (including the impact of leverage in the underlying investments for real estate positions in our non-trading portfolio) of such positions. The fair value of the underlying positions may be impacted by factors such as transactions in similar The increase in our 10% sensitivity measures during 2007 in our trading and non-trading portfolios (excluding ICBC and SMFG) was primarily due to new investments. 72 Goldman Sachs 2007 Annual Report
  • 75.
    Management’s Discussion andAnalysis (3% of total assets) and $23.64 billion (3% of total assets), respectively, of other sovereign obligations, principally consisting of securities issued by the governments of Japan and the United Kingdom. In addition, as of November 2007 and November 2006, $144.92 billion and $104.76 billion of our financial instruments purchased under agreements to resell and securities borrowed, respectively, were collateralized by U.S. government and federal agency obligations. As of November 2007 and 2006, $41.26 billion and $38.22 billion of our financial instruments purchased under agreements to resell and securities borrowed, respectively, were collateralized by other sovereign obligations. As of November 2007 and November 2006, we did not have credit exposure to any other counterparty that exceeded 2% of our total assets. However, over the past several years, the amount and duration of our credit exposures have been increasing, due to, among other factors, the growth of our lending and OTC derivative activities and market evolution toward longer dated transactions. A further discussion of our derivative activities follows below. Derivatives Derivative contracts are instruments, such as futures, forwards, swaps or option contracts, that derive their value from underlying assets, indices, reference rates or a combination of these factors. Derivative instruments may be privately negotiated contracts, which are often referred to as OTC derivatives, or they may be listed and traded on an exchange. Substantially all of our derivative transactions are entered into to facilitate client transactions, to take proprietary positions or as a means of risk management. In addition to derivative transactions entered into for trading purposes, we enter into derivative contracts to manage currency exposure on our net investment in non-U.S. operations and to manage the interest rate and currency exposure on our long-term borrowings and certain short-term borrowings. Derivatives are used in many of our businesses, and we believe that the associated market risk can only be understood relative to all of the underlying assets or risks being hedged, or as part of a broader trading strategy. Accordingly, the market risk of derivative positions is managed together with our nonderivative positions. The fair value of our derivative contracts is reflected net of cash paid or received pursuant to credit support agreements and is reported on a net-by-counterparty basis in our consolidated statements of financial condition when management believes a legal right of setoff exists under an enforceable netting agreement. For an OTC derivative, our credit exposure is directly with our counterparty and continues until the maturity or termination of such contract. Credit Risk Credit risk represents the loss that we would incur if a counter- party or an issuer of securities or other instruments we hold fails to perform under its contractual obligations to us, or upon a deterioration in the credit quality of third parties whose securities or other instruments, including OTC derivatives, we hold. Our exposure to credit risk principally arises through our trading, investing and financing activities. To reduce our credit exposures, we seek to enter into netting agreements with counterparties that permit us to offset receivables and payables with such counterparties. In addition, we attempt to further reduce credit risk with certain counterparties by (i) entering into agreements that enable us to obtain collateral from a counterparty on an upfront or contingent basis, (ii) seeking third-party guarantees of the counterparty’s obligations, and/or (iii) transferring our credit risk to third parties using credit derivatives and/or other structures and techniques. To measure and manage our credit exposures, we use a variety of tools, including credit limits referenced to both current exposure and potential exposure. Potential exposure is generally based on projected worst-case market movements over the life of a transaction. In addition, as part of our market risk management process, for positions measured by changes in credit spreads, we use VaR and other sensitivity measures. To supplement our primary credit exposure measures, we also use scenario analyses, such as credit spread widening scenarios, stress tests and other quantitative tools. Our global credit management systems monitor credit exposure to individual counterparties and on an aggregate basis to counterparties and their affiliates. These systems also provide management, including the Firmwide Risk and Credit Policy Committees, with information regarding credit risk by product, industry sector, country and region. While our activities expose us to many different industries and counterparties, we routinely execute a high volume of transactions with counterparties in the financial services industry, including brokers and dealers, commercial banks, investment funds and other institutional clients, resulting in significant credit concentration with respect to this industry. In the ordinary course of business, we may also be subject to a concentration of credit risk to a particular counterparty, borrower or issuer. As of November 2007 and November 2006, we held $45.75 billion (4% of total assets) and $46.20 billion (6% of total assets), respectively, of U.S. government and federal agency obligations (including securities guaranteed by the Federal National Mortgage Association and the Federal Home Loan Mortgage Corporation) included in “Financial instruments owned, at fair value” and “Cash and securities segregated for regulatory and other purposes” in the consolidated statements of financial condition. As of November 2007 and November 2006, we held $31.65 billion 73Goldman Sachs 2007 Annual Report
  • 76.
    Management’s Discussion andAnalysis The following tables set forth the fair values of our OTC derivative assets and liabilities by product and by remaining contractual maturity: OTC Derivatives (in millions) As of November 2007 0 – 6 6 – 12 1 – 5 5 – 10 10 Years Assets Months Months Years Years or Greater Total Contract Type Interest rates (1) $  5,970 $4,301 $10,417 $ 7,402 $20,614 $48,704 Currencies 10,614 2,342 3,623 901 405 17,885 Commodities 3,335 1,538 8,464 1,299 657 15,293 Equities 4,616 1,329 1,560 2,114 572 10,191 Total $24,535 $9,510 $24,064 $11,716 $22,248 $92,073 0 – 6 6 – 12 1 – 5 5 – 10 10 Years Liabilities Months Months Years Years or Greater Total Contract Type Interest rates (1) $  6,980 $1,212 $11,675 $  6,614 $11,579 $38,060 Currencies 9,662 1,977 3,641 680 657 16,617 Commodities 3,912 2,082 5,827 1,304 338 13,463 Equities 7,526 3,804 3,823 3,393 412 18,958 Total $28,080 $9,075 $24,966 $11,991 $12,986 $87,098 As of November 2006 0 – 6 6 – 12 1 – 5 5 – 10 10 Years Assets Months Months Years Years or Greater Total Contract Type Interest rates (1) $  2,432 $1,706 $  5,617 $  5,217 $6,201 $21,173 Currencies 5,578 943 3,103 1,669 966 12,259 Commodities 3,892 1,215 5,836 1,258 231 12,432 Equities 1,430 1,134 1,329 2,144 1,235 7,272 Total $13,332 $4,998 $15,885 $10,288 $8,633 $53,136 0 – 6 6 – 12 1 – 5 5 – 10 10 Years Liabilities Months Months Years Years or Greater Total Contract Type Interest rates (1) $  2,807 $1,242 $  6,064 $  3,582 $5,138 $18,833 Currencies 6,859 1,290 2,582 494 634 11,859 Commodities 3,078 658 4,253 1,643 273 9,905 Equities 3,235 1,682 2,615 3,239 277 11,048 Total $15,979 $4,872 $15,514 $  8,958 $6,322 $51,645 (1) Includes credit derivatives. 74 Goldman Sachs 2007 Annual Report
  • 77.
    Management’s Discussion andAnalysis instrument, the remaining contractual maturity is generally classified based upon the maturity date of the underlying derivative instrument. In those instances where the underlying instrument does not have a maturity date or either counter- party has the right to settle in cash, the remaining contractual maturity is generally based upon the option expiration date. We enter into certain OTC option transactions that provide us or our counterparties with the right to extend the maturity of the underlying contract. The fair value of these option contracts is not material to the aggregate fair value of our OTC derivative portfolio. In the tables above, for option contracts that require settlement by delivery of an underlying derivative The following table sets forth the distribution, by credit rating, of substantially all of our exposure with respect to OTC derivatives as of November 2007, after taking into consideration the effect of netting agreements. The categories shown reflect our internally determined public rating agency equivalents: OTC Derivative Credit Exposure ($ in millions) As of November 2007 2006 Exposure Percentage of Percentage of Collateral Net of Total Exposure Total Exposure Credit Rating Equivalent Exposure (1) Held Collateral Net of Collateral Net of Collateral AAA/Aaa $16,683 $  2,087 $14,596 21% 12% AA/Aa2 28,562 4,143 24,419 35 29 A/A2 20,742 4,553 16,189 23 29 BBB/Baa2 9,896 3,338 6,558 9 15 BB/Ba2 or lower 13,696 6,218 7,478 10 13 Unrated 2,494 1,325 1,169 2 2 Total $92,073 $21,664 $70,409 100% 100% (1) Net of cash received pursuant to credit support agreements of $59.05 billion. The following tables set forth our OTC derivative credit exposure, net of collateral, by remaining contractual maturity: Exposure Net of Collateral (in millions) As of November 2007 0 – 6 6 – 12 1 – 5 5 – 10 10 Years Credit Rating Equivalent Months Months Years Years or Greater Total (1) AAA/Aaa $  3,669 $1,132 $  2,453 $1,904 $  5,438 $14,596 AA/Aa2 5,569 3,024 4,815 2,683 8,328 24,419 A/A2 5,913 1,242 4,288 1,544 3,202 16,189 BBB/Baa2 2,087 650 2,236 564 1,021 6,558 BB/Ba2 or lower 2,159 670 2,626 1,257 766 7,478 Unrated 271 321 422 90 65 1,169 Total $19,668 $7,039 $16,840 $8,042 $18,820 $70,409 0 – 6 6 – 12 1 – 5 5 – 10 10 Years Contract Type Months Months Years Years or Greater Total (1) Interest rates (2) $  5,454 $3,291 $ 7,255 $5,788 $17,341 $39,129 Currencies 8,266 1,735 3,037 560 381 13,979 Commodities 2,757 1,352 5,619 778 586 11,092 Equities 3,191 661 929 916 512 6,209 Total $19,668 $7,039 $16,840 $8,042 $18,820 $70,409 (1) Where we have obtained collateral from a counterparty under a master trading agreement that covers multiple products and transactions, we have allocated the collateral ratably based on exposure before giving effect to such collateral. (2) Includes credit derivatives. 75Goldman Sachs 2007 Annual Report
  • 78.
    Management’s Discussion andAnalysis Excess Liquidity Our most important liquidity policy is to pre-fund what we estimate will be our likely cash needs during a liquidity crisis and hold such excess liquidity in the form of unencumbered, highly liquid securities that may be sold or pledged to provide same-day liquidity. This “Global Core Excess” liquidity is intended to allow us to meet immediate obligations without needing to sell other assets or depend on additional funding from credit-sensitive markets. We believe that this pool of excess liquidity provides us with a resilient source of funds and gives us significant flexibility in managing through a difficult funding environment. Our Global Core Excess reflects the following principles: ■ The first days or weeks of a liquidity crisis are the most critical to a company’s survival. ■ Focus must be maintained on all potential cash and collateral outflows, not just disruptions to financing flows. Goldman Sachs’ businesses are diverse, and its cash needs are driven by many factors, including market movements, collateral requirements and client commitments, all of which can change dramatically in a difficult funding environment. ■ During a liquidity crisis, credit-sensitive funding, including unsecured debt and some types of secured financing agreements, may be unavailable and the terms or availability of other types of secured financing may change. ■ As a result of our policy to pre-fund liquidity that we estimate may be needed in a crisis, we hold more unencumbered securities and have larger unsecured debt balances than our businesses would otherwise require. We believe that our liquidity is stronger with greater balances of highly liquid unencumbered securities, even though it increases our unsecured liabilities. The size of our Global Core Excess is based on an internal liquidity model together with a qualitative assessment of the condition of the financial markets and of Goldman Sachs. Our liquidity model identifies and estimates cash and collateral outflows over a short-term horizon in a liquidity crisis, including, but not limited to: ■ upcoming maturities of unsecured debt and letters of credit; ■ potential buybacks of a portion of our outstanding negotiable unsecured debt; ■ adverse changes in the terms or availability of secured funding; ■ derivatives and other margin and collateral outflows, including those due to market moves; Derivative transactions may also involve legal risks including the risk that they are not authorized or appropriate for a counter- party, that documentation has not been properly executed or that executed agreements may not be enforceable against the counterparty. We attempt to minimize these risks by obtaining advice of counsel on the enforceability of agreements as well as on the authority of a counterparty to effect the derivative transaction. In addition, certain derivative transactions (e.g., credit derivative contracts) involve the risk that we may have difficulty obtaining, or be unable to obtain, the underlying security or obligation in order to satisfy any physical settlement requirement. Liquidity and Funding Risk Liquidity is of critical importance to companies in the financial services sector. Most failures of financial institutions have occurred in large part due to insufficient liquidity resulting from adverse circumstances. Accordingly, Goldman Sachs has in place a comprehensive set of liquidity and funding policies that are intended to maintain significant flexibility to address both Goldman Sachs-specific and broader industry or market liquidity events. Our principal objective is to be able to fund Goldman Sachs and to enable our core businesses to continue to generate revenues, even under adverse circumstances. Management has implemented a number of policies according to the following liquidity risk management framework: ■ Excess Liquidity. We maintain substantial excess liquidity to meet a broad range of potential cash outflows in a stressed environment including financing obligations. ■ Asset-Liability Management. We seek to maintain funding sources that are sufficiently long-term in order to withstand a prolonged or severe liquidity-stressed environment without having to rely on asset sales. ■ Conservative Liability Structure. We access funding across a diverse range of markets, products and counter- parties, emphasize less credit-sensitive sources of funding and conservatively manage the distribution of funding across our entity structure. ■ Crisis Planning. We base our liquidity and funding management on stress-scenario planning and maintain a crisis plan detailing our response to a liquidity-threatening event. 76 Goldman Sachs 2007 Annual Report
  • 79.
    Management’s Discussion andAnalysis We maintain Global Core Excess and other unencumbered assets in an amount that, if pledged or sold, would provide the funds necessary to replace at least 110% of our unsecured obligations that are scheduled to mature (or where holders have the option to redeem) within the next 12 months. We assume conservative loan values that are based on stress- scenario borrowing capacity and we regularly review these assumptions asset class by asset class. The estimated aggregate loan value of our Global Core Excess and our other unencumbered assets averaged $156.74 billion and $134.38 billion for the fiscal years ended 2007 and 2006, respectively. Asset-Liability Management We seek to maintain a highly liquid balance sheet and substantially all of our inventory is marked-to-market daily. We utilize aged inventory limits for certain financial instruments as a disincentive to our businesses to hold inventory over longer periods of time. We believe that these limits provide a complementary mechanism for ensuring appropriate balance sheet liquidity in addition to our standard position limits. Although our balance sheet fluctuates due to seasonal activity, market conventions and periodic market opportunities in certain of our businesses, our total assets and adjusted assets at financial statement dates are not materially different from those occurring within our reporting periods. We seek to manage the maturity profile of our funding base such that we should be able to liquidate our assets prior to our liabilities coming due, even in times of prolonged or severe liquidity stress. We do not rely on immediate sales of assets (other than our Global Core Excess) to maintain liquidity in a distressed environment, although we recognize orderly asset sales may be prudent and necessary in a persistent liquidity crisis. In order to avoid reliance on asset sales, our goal is to ensure that we have sufficient total capital (unsecured long-term borrowings plus total shareholders’ equity) to fund our balance sheet for at least one year. The amount of our total capital is based on an internal liquidity model, which incorporates, among other things, the following long-term financing requirements: ■ the portion of financial instruments owned that we believe could not be funded on a secured basis in periods of market stress, assuming conservative loan values; ■ goodwill and identifiable intangible assets, property, leasehold improvements and equipment, and other illiquid assets; ■ derivative and other margin and collateral requirements; ■ anticipated draws on our unfunded loan commitments; and ■ capital or other forms of financing in our regulated subsidiaries that is in excess of their long-term financing requirements. See “— Conservative Liability Structure” below for a further discussion of how we fund our subsidiaries. ■ potential cash outflows associated with our prime brokerage business; ■ additional collateral that could be called in the event of a two-notch downgrade in our credit ratings; ■ draws on our unfunded commitments not supported by William Street Funding Corporation (1) ; and ■ upcoming cash outflows, such as tax and other large payments. The following table sets forth the average loan value (the estimated amount of cash that would be advanced by counter- parties against these securities) of our Global Core Excess: Year Ended November (in millions) 2007 2006 U.S. dollar-denominated $48,635 $40,862 Non-U.S. dollar-denominated 11,928 10,202 Total Global Core Excess $60,563 $51,064 The U.S. dollar-denominated excess is comprised of only unencumbered U.S. government securities, U.S. agency securities and highly liquid U.S. agency mortgage-backed securities, all of which are Federal Reserve repo-eligible, as well as overnight cash deposits. Our non-U.S. dollar-denominated excess is comprised of only unencumbered French, German, United Kingdom and Japanese government bonds and euro, British pound and Japanese yen overnight cash deposits. We strictly limit our Global Core Excess to this narrowly defined list of securities and cash because we believe they are highly liquid, even in a difficult funding environment. We do not believe other potential sources of excess liquidity, such as lower-quality unencumbered securities or committed credit facilities, are as reliable in a liquidity crisis. The majority of our Global Core Excess is structured such that it is available to meet the liquidity requirements of our parent company, Group Inc., and all of its subsidiaries. The remainder is held in our principal non-U.S. operating entities, primarily to better match the currency and timing requirements for those entities’ potential liquidity obligations. In addition to our Global Core Excess, we have a significant amount of other unencumbered securities as a result of our business activities. These assets, which are located in the United States, Europe and Asia, include other government bonds, high-grade money market securities, corporate bonds and marginable equities. We do not include these securities in our Global Core Excess. (1) The Global Core Excess excludes liquid assets of $6.17 billion held separately by William Street Funding Corporation. See “— Contractual Obligations and Commitments” above for a further discussion of the William Street credit extension program. 77Goldman Sachs 2007 Annual Report
  • 80.
    Management’s Discussion andAnalysis ■ We fund a substantial portion of our inventory on a secured basis. We believe secured financing provides Goldman Sachs with a more stable source of liquidity than unsecured financing, as it is less sensitive to changes in our credit due to the underlying collateral. ■ Our liquidity depends to an important degree on the stability of our short-term unsecured financing base. Accordingly, we prefer the use of promissory notes (in which Goldman Sachs does not make a market) over commercial paper, which we may repurchase prior to maturity through the ordinary course of business as a market maker. As of November 2007 and November 2006, our unsecured short-term borrowings, including the current portion of unsecured long-term borrowings, were $71.56 billion and $47.90 billion, respectively. See Note 4 to the consolidated financial statements for further information regarding our unsecured short-term borrowings. ■ We recognize that secured funding transactions have greater refinancing risk when the underlying collateral is more difficult to fund. Consequently, we seek longer maturities for secured funding transactions collateralized by these assets. In some cases, we use extendible maturity features to obtain a rolling minimum term to the funding. ■ We issue substantially all of our unsecured debt without provisions that would, based solely upon an adverse change in our credit ratings, financial ratios, earnings, cash flows or stock price, trigger a requirement for an early payment, collateral support, change in terms, acceleration of maturity or the creation of an additional financial obligation. We seek to maintain broad and diversified funding sources globally for both secured and unsecured funding. We make extensive use of the repurchase agreement and securities lending markets, as well as other secured funding markets. In addition, we issue debt through syndicated U.S. registered offerings, U.S. registered and 144A medium-term note programs, offshore medium-term note offerings and other bond offerings, U.S. and non-U.S. commercial paper and promissory note issuances, and other methods. We also arrange for letters of credit to be issued on our behalf. We benefit from distributing our debt issuances through our own sales force to a large, diverse global creditor base and we believe that our relationships with our creditors are critical to our liquidity. Our creditors include banks, governments, securities lenders, pension funds, insurance companies and mutual funds. We access funding in a variety of markets in the Americas, Europe and Asia. We have imposed various internal guidelines on investor concentration, including the amount of our commercial paper that can be owned and letters of credit that can be issued by any single investor or group of investors. Certain financial instruments may be more difficult to fund on a secured basis during times of market stress. Accordingly, we generally hold higher levels of total capital for these assets than more liquid types of financial instruments. The table below sets forth our aggregate holdings in these categories of financial instruments: As of November (in millions) 2007 2006 Mortgage and other asset-backed   loans and securities (1) $46,436 $41,017 Bank loans (2) 49,154 28,196 High-yield securities 12,807 9,403 Emerging market debt securities 3,343 2,291 Private equity and real estate   fund investments (3) 16,244 5,968 Emerging market equity securities 8,014 3,046 ICBC ordinary shares (4) 6,807 5,194 SMFG convertible preferred stock 4,060 4,505 Other restricted public   equity securities 3,455 1,730 Other investments in funds (5) 3,437 260 (1) Excludes $7.64 billion of mortgage whole loans that were transferred to securitization vehicles where such transfers were accounted for as secured financings rather than sales under SFAS No. 140. We distributed to investors the securities that were issued by the securitization vehicles and therefore do not bear economic exposure to the underlying mortgage whole loans. (2) Includes funded commitments and inventory held in connection with our origination and secondary trading activities. (3) Includes interests in our merchant banking funds. Such amounts exclude assets related to consolidated investment funds of $8.13 billion and $6.03 billion as of November 2007 and November 2006, respectively, for which Goldman Sachs does not bear economic exposure. (4) Includes interests of $4.30 billion and $3.28 billion as of November 2007 and November 2006, respectively, held by investment funds managed by Goldman Sachs. (5) Includes interests in other investment funds that we manage. A large portion of these assets are funded through secured funding markets or nonrecourse financing. We focus on demonstrating a consistent ability to fund these assets on a secured basis for extended periods of time to reduce refinancing risk and to help ensure that they have an established amount of loan value in order that they can be funded in periods of market stress. See Note 3 to the consolidated financial statements for further information regarding the financial instruments we hold. Conservative Liability Structure We seek to structure our liabilities conservatively to reduce refinancing risk and the risk that we may redeem or repurchase certain of our borrowings prior to their contractual maturity. Our conservative liability structure reflects the following policies: 78 Goldman Sachs 2007 Annual Report
  • 81.
    Management’s Discussion andAnalysis To mitigate refinancing risk, we have created internal guidelines on the principal amount of debt maturing on any one day or during any week or year. The following table sets forth our quarterly unsecured long-term borrowings maturity profile through 2013: Unsecured Long-Term Borrowings Maturity Profile ($ in millions) 0 1Q 2009 2Q 2009 3Q 2009 4Q 2009 1Q 2010 2Q 2010 3Q 2010 4Q 2010 1Q 2011 2Q 2011 3Q 2011 4Q 2011 1Q 2012 2Q 2012 3Q 2012 4Q 2012 1Q 2013 2Q 2013 3Q 2013 4Q 2013 1,000 2,000 3,000 4,000 6,000 5,000 7,000 8,000 9,000 10,000 11,000 Fiscal Quarters The weighted average maturity of our unsecured long-term borrowings as of November 2007 was approximately seven years. We swap a substantial portion of our long-term borrowings into U.S. dollar obligations with short-term floating interest rates in order to minimize our exposure to interest rates and foreign exchange movements. For a discussion of factors that could impair our ability to access the capital markets, see “— Certain Risk Factors That May Affect Our Business” above as well as “Risk Factors” in Part I, Item 1A of the Annual Report on Form 10-K. 79Goldman Sachs 2007 Annual Report
  • 82.
    Management’s Discussion andAnalysis Crisis Planning In order to be prepared for a liquidity event, or a period of market stress, we base our liquidity risk management framework and our resulting funding and liquidity policies on conservative stress-scenario assumptions. Our planning incorporates several market-based and operational stress scenarios. We also periodically conduct liquidity crisis drills to test our lines of communication and backup funding procedures. In addition, we maintain a liquidity crisis plan that specifies an approach for analyzing and responding to a liquidity-threatening event. The plan provides the framework to estimate the likely impact of a liquidity event on Goldman Sachs based on some of the risks identified above and outlines which and to what extent liquidity maintenance activities should be implemented based on the severity of the event. It also lists the crisis management team and internal and external parties to be contacted to ensure effective distribution of information. Credit Ratings We rely upon the short-term and long-term debt capital markets to fund a significant portion of our day-to-day operations. The cost and availability of debt financing is influenced by our credit ratings. Credit ratings are important when we are competing in certain markets and when we seek to engage in longer term transactions, including OTC derivatives. We believe our credit ratings are primarily based on the credit rating agencies’ assessment of our liquidity, market, credit and operational risk management practices, the level and variability of our earnings, our capital base, our franchise, reputation and management, our corporate governance and the external operating environment. See “— Certain Risk Factors That May Affect Our Business” above for a discussion of the risks associated with a reduction in our credit ratings. Subsidiary Funding Policies. Substantially all of our unsecured funding is raised by our parent company, Group Inc. The parent company then lends the necessary funds to its subsidiaries, some of which are regulated, to meet their asset financing and capital requirements. In addition, the parent company provides its regulated subsidiaries with the necessary capital to meet their regulatory requirements. The benefits of this approach to subsidiary funding include enhanced control and greater flexibility to meet the funding requirements of our subsidiaries. Our intercompany funding policies are predicated on an assumption that, unless legally provided for, funds or securities are not freely available from a subsidiary to its parent company or other subsidiaries. In particular, many of our subsidiaries are subject to laws that authorize regulatory bodies to block or limit the flow of funds from those subsidiaries to Group Inc. Regulatory action of that kind could impede access to funds that Group Inc. needs to make payments on obligations, including debt obligations. As such, we assume that capital or other financing provided to our regulated subsidiaries is not available to our parent company or other subsidiaries. In addition, we assume that the Global Core Excess held in our principal non-U.S. operating entities will not be available to our parent company or other subsidiaries and therefore is available only to meet the potential liquidity requirements of those entities. We also manage our liquidity risk by requiring senior and subordinated intercompany loans to have maturities equal to or shorter than the maturities of the aggregate borrowings of the parent company. This policy ensures that the subsidiaries’ obligations to the parent company will generally mature in advance of the parent company’s third-party borrowings. In addition, many of our subsidiaries and affiliates maintain unencumbered assets to cover their intercompany borrowings (other than subordinated debt) in order to mitigate parent company liquidity risk. Group Inc. has provided substantial amounts of equity and subordinated indebtedness, directly or indirectly, to its regulated subsidiaries; for example, as of November 2007, Group Inc. had $24.49 billion of such equity and subordinated indebtedness invested in Goldman, Sachs Co., its principal U.S. registered broker-dealer; $27.51 billion invested in Goldman Sachs International, a regulated U.K. broker-dealer; $2.40 billion invested in Goldman Sachs Execution Clearing, L.P., a U.S. registered broker-dealer; and $3.15 billion invested in Goldman Sachs Japan Co., Ltd., a regulated Japanese broker-dealer. Group Inc. also had $44.99 billion of unsubordinated loans to these entities as of November 2007, as well as significant amounts of capital invested in and loans to its other regulated subsidiaries. 80 Goldman Sachs 2007 Annual Report
  • 83.
    Management’s Discussion andAnalysis Operational Risk Operational risk relates to the risk of loss arising from short- comings or failures in internal processes, people or systems, or from external events. Operational risk can arise from many factors ranging from routine processing errors to potentially costly incidents related to, for example, major systems failures. Operational risk may also cause reputational harm. Thus, efforts to identify, manage and mitigate operational risk must be equally sensitive to the risk of reputational damage as well as the risk of financial loss. We manage operational risk through the application of long- standing, but continuously evolving, firmwide control standards which are supported by the training, supervision and development of our people; the active participation and commitment of senior management in a continuous process of identifying and mitigating key operational risks across Goldman Sachs; and a framework of strong and independent control departments that monitor operational risk on a daily basis. Together, these elements form a strong firmwide control culture that serves as the foundation of our efforts to minimize operational risk exposure. The Operational Risk Department, an independent risk management function, is responsible for developing and implementing a standardized framework to identify, measure, monitor, and report operational risks to support active risk management across Goldman Sachs. This framework, which evolves with the changing needs of our businesses and regulatory guidance, incorporates analysis of internal and external operational risk events, business environment and internal control factors, and scenario analysis. The framework also provides regular reporting of our operational risk exposures to our Board, risk committees and senior management. For a further discussion of operational risk see “— Risk Factors” in Part I, Item 1A of the Annual Report on Form 10-K. As of November 2007, collateral or termination payments pursuant to bilateral agreements with certain counterparties of approximately $728 million would have been required in the event of a one-notch reduction in our long-term credit ratings. In evaluating our liquidity requirements, we consider additional collateral or termination payments that would be required in the event of a two-notch downgrade in our long-term credit ratings, as well as collateral that has not been called by counter- parties, but is available to them. Cash Flows As a global financial institution, our cash flows are complex and interrelated and bear little relation to our net earnings and net assets and, consequently, we believe that traditional cash flow analysis is less meaningful in evaluating our liquidity position than the excess liquidity and asset-liability management policies described above. Cash flow analysis may, however, be helpful in highlighting certain macro trends and strategic initiatives in our business. Year Ended November 2007. Our cash and cash equivalents increased by $5.59 billion to $11.88 billion at the end of 2007. We raised $73.79 billion in net cash from financing and investing activities, primarily through the issuance of unsecured borrowings, partially offset by common stock repurchases. We used net cash of $68.20 billion in our operating activities, primarily to capitalize on trading and investing opportunities for our clients and ourselves. Year Ended November 2006. Our cash and cash equivalents decreased by $3.97 billion to $6.29 billion at the end of 2006. We raised $64.09 billion in net cash from financing activities, primarily in long-term borrowings as well as through secured financings, partially offset by common stock repurchases. We used net cash of $68.06 billion in our operating and investing activities, primarily to capitalize on trading and investing opportunities for our clients and ourselves. The following table sets forth our unsecured credit ratings as of November 2007: Short-Term Debt Long-Term Debt Subordinated Debt Preferred Stock Dominion Bond Rating Service Limited R-1 (middle) AA (low) A (high) A Fitch, Inc. F1+ AA- A+ A+ Moody’s Investors Service P-1 Aa3 A1 A2 Standard Poor’s A-1+ AA- A+ A Rating and Investment Information, Inc. a-1+ AA Not Applicable Not Applicable 81Goldman Sachs 2007 Annual Report
  • 84.
    Management’s Discussion andAnalysis We adopted SFAS No. 157 as of the beginning of 2007. The transition adjustment to beginning retained earnings was a gain of $51 million, net of tax. For the first quarter of 2007, the effect of the nullification of EITF Issue No. 02-3 and the removal of liquidity discounts for actively traded positions was not material. In addition, under SFAS No. 157, gains on principal investments are recorded in the absence of substantial third- party transactions if market evidence is sufficient. In the first quarter of 2007, we recorded approximately $500 million of such gains as a result of adopting SFAS No. 157. SFAS No. 158. In September 2006, the FASB issued SFAS No. 158, “Employers’ Accounting for Defined Benefit Pension and Other Postretirement Plans, an amendment of FASB Statements No. 87, 88, 106 and 132-R.” SFAS No. 158 requires an entity to recognize in its statement of financial condition the funded status of its defined benefit pension and postretirement plans, measured as the difference between the fair value of the plan assets and the benefit obligation. SFAS No. 158 also requires an entity to recognize changes in the funded status of a defined benefit pension and postretirement plan within accumulated other comprehensive income, net of tax, to the extent such changes are not recognized in earnings as components of periodic net benefit cost. SFAS No. 158 is effective as of the end of the fiscal year ending after December 15, 2006. We adopted SFAS No. 158 as of the end of 2007. The adjustment to accumulated other comprehensive loss for the initial application of SFAS No. 158 was $194 million, net of tax. SFAS No. 159. In February 2007, the FASB issued SFAS No. 159, “The Fair Value Option for Financial Assets and Financial Liabilities,” which gives entities the option to measure eligible financial assets, financial liabilities and firm commitments at fair value (i.e., the fair value option), on an instrument-by- instrument basis, that are otherwise not accounted for at fair value under other accounting standards. The election to use the fair value option is available at specified election dates, such as when an entity first recognizes a financial asset or financial liability or upon entering into a firm commitment. Subsequent changes in fair value must be recorded in earnings. Additionally, SFAS No. 159 allows for a one-time election for existing positions upon adoption, with the transition adjustment recorded to beginning retained earnings. Recent Accounting Developments FIN No. 48. In June 2006, the FASB issued FIN No. 48, “Accounting for Uncertainty in Income Taxes — an Interpretation of FASB Statement No. 109.” FIN No. 48 requires that we determine whether a tax position is more likely than not to be sustained upon examination, including resolution of any related appeals or litigation processes, based on the technical merits of the position. Once it is determined that a position meets this recognition threshold, the position is measured to determine the amount of benefit to be recognized in the financial statements. We will adopt the provisions of FIN No. 48 in the first quarter of 2008. Adoption of FIN No. 48 will not have a material effect on our financial condition, results of operations or cash flows. SFAS No. 157. In September 2006, the FASB issued SFAS No. 157, “Fair Value Measurements.” SFAS No. 157 clarifies that fair value is an exit price, representing the amount that would be received to sell an asset or paid to transfer a liability in an orderly transaction between market participants. Under SFAS No. 157, fair value measurements are not adjusted for transaction costs. SFAS No. 157 nullifies the guidance included in Emerging Issues Task Force (EITF) Issue No. 02-3, “Issues Involved in Accounting for Derivative Contracts Held for Trading Purposes and Contracts Involved in Energy Trading and Risk Management Activities,” that prohibited the recognition of a day one gain or loss on derivative contracts (and hybrid financial instruments measured at fair value under SFAS No. 155) where we were unable to verify all of the significant model inputs to observable market data and/or verify the model to market transactions. However, SFAS No. 157 requires that a fair value measurement reflect the assumptions market participants would use in pricing an asset or liability based on the best information available. Assumptions include the risks inherent in a particular valuation technique (such as a pricing model) and/or the risks inherent in the inputs to the model. In addition, SFAS No. 157 prohibits the recognition of “block discounts” for large holdings of unrestricted financial instruments where quoted prices are readily and regularly available for an identical asset or liability in an active market. The provisions of SFAS No. 157 are to be applied prospectively, except changes in fair value measurements that result from the initial application of SFAS No. 157 to existing derivative financial instruments measured under EITF Issue No. 02-3, existing hybrid financial instruments measured at fair value and block discounts, all of which are to be recorded as an adjustment to beginning retained earnings in the year of adoption. 82 Goldman Sachs 2007 Annual Report
  • 85.
    Management’s Discussion andAnalysis SOP No. 07-1 and FSP FIN No. 46-R-7. In June 2007, the American Institute of Certified Public Accountants (AICPA) issued Statement of Position (SOP) No. 07-1, “Clarification of the Scope of the Audit and Accounting Guide ‘Audits of Investment Companies’ and Accounting by Parent Companies and Equity Method Investors for Investments in Investment Companies.’’ SOP No. 07-1 clarifies when an entity may apply the provisions of the Audit and Accounting Guide for Investment Companies (the Guide). In May 2007, the FASB issued FSP FIN No. 46-R-7, “Application of FIN 46-R to Investment Companies,” which amends FIN No. 46-R to make permanent the temporary deferral of the application of FIN No. 46-R to entities within the scope of the revised Guide under SOP No. 07-1. FSP FIN No. 46-R-7 is effective upon adoption of SOP No. 07-1. In November 2007, the FASB issued Proposed FSP SOP No. 07-1-a, “The Effective Date of AICPA Statement of Position 07-1,” which proposes to indefinitely defer the effective date for SOP No. 07-01 and, consequently, FSP FIN No. 46-R-7. EITF Issue No. 06-11. In June 2007, the EITF reached consensus on Issue No. 06-11, “Accounting for Income Tax Benefits of Dividends on Share-Based Payment Awards.” EITF Issue No. 06-11 requires that the tax benefit related to dividend equivalents paid on restricted stock units, which are expected to vest, be recorded as an increase to additional paid-in capital. We currently account for this tax benefit as a reduction to income tax expense. EITF Issue No. 06-11 is to be applied prospectively for tax benefits on dividends declared in fiscal years beginning after December 15, 2007, and we expect to adopt the provisions of EITF Issue No. 06-11 beginning in the first quarter of 2009. We are currently evaluating the impact of adopting EITF Issue No. 06-11 on our financial condition, results of operations and cash flows. We adopted SFAS No. 159 as of the beginning of 2007 and elected to apply the fair value option to the following financial assets and liabilities existing at the time of adoption: ■ certain unsecured short-term borrowings, consisting of all promissory notes and commercial paper; ■ certain other secured financings, primarily transfers accounted for as financings rather than sales under SFAS No. 140 and debt raised through our William Street program; ■ certain unsecured long-term borrowings, including prepaid physical commodity transactions; ■ resale and repurchase agreements; ■ securities borrowed and loaned within Trading and Principal Investments, consisting of our matched book and certain firm financing activities; ■ securities held by GS Bank USA, which were previously accounted for as available-for-sale; and ■ receivables from customers and counterparties arising from transfers accounted for as secured loans rather than purchases under SFAS No. 140. The transition adjustment to beginning retained earnings related to the adoption of SFAS No. 159 was a loss of $45 million, net of tax, substantially all of which related to applying the fair value option to prepaid physical commodity transactions. Subsequent to the adoption of SFAS No. 159, we have elected to apply the fair value option (i) to new positions within the above categories, (ii) to corporate loans, corporate loan commitments and certificates of deposit issued by GS Bank USA and (iii) generally to investments where we would otherwise apply the equity method of accounting. In certain cases, we may continue to apply the equity method of accounting to those investments which are strategic in nature or closely related to our principal business activities, where we have a significant degree of involvement in the cash flows or operations of the investee, and/or where cost-benefit considerations are less significant. The primary reasons for electing the fair value option are mitigating volatility in earnings from using different measurement attributes, simplification and cost-benefit considerations. 83Goldman Sachs 2007 Annual Report
  • 86.
    Management’s Report onInternal Control over Financial Reporting Our internal control over financial reporting includes policies and procedures that pertain to the maintenance of records that, in reasonable detail, accurately and fairly reflect transactions and dispositions of assets; provide reasonable assurances that transactions are recorded as necessary to permit preparation of financial statements in accordance with U.S. generally accepted accounting principles, and that receipts and expenditures are being made only in accordance with authorizations of management and the directors of the firm; and provide reasonable assurance regarding prevention or timely detection of unauthorized acquisition, use or disposition of the firm’s assets that could have a material effect on our financial statements. The firm’s internal control over financial reporting as of November30,2007hasbeenauditedbyPricewaterhouseCoopersLLP, an independent registered public accounting firm, as stated in their report appearing on page 85, which expresses an unqualified opinion on the effectiveness of the firm’s internal control over financial reporting as of November 30, 2007. Management of The Goldman Sachs Group, Inc., together with its consolidated subsidiaries (the firm), is responsible for establishing and maintaining adequate internal control over financial reporting. The firm’s internal control over financial reporting is a process designed under the supervision of the firm’s principal executive and principal financial officers to provide reasonable assurance regarding the reliability of financial reporting and the preparation of the firm’s financial statements for external reporting purposes in accordance with U.S. generally accepted accounting principles. As of the end of the firm’s 2007 fiscal year, management conducted an assessment of the effectiveness of the firm’s internal control over financial reporting based on the framework established in Internal Control — Integrated Framework issued by the Committee of Sponsoring Organizations of the Treadway Commission (COSO). Based on this assessment, management has determined that the firm’s internal control over financial reporting as of November 30, 2007 was effective. 84 Goldman Sachs 2007 Annual Report
  • 87.
    Report of IndependentRegistered Public Accounting Firm As discussed in Note 2 to the consolidated financial statements, the Company has adopted SFAS No. 157, “Fair Value Measurements” and SFAS No. 159, “The Fair Value Option for Financial Assets and Financial Liabilities.” A company’s internal control over financial reporting is a process designed to provide reasonable assurance regarding the reliability of financial reporting and the preparation of financial statements for external purposes in accordance with generally accepted accounting principles. A company’s internal control over financial reporting includes those policies and procedures that (i) pertain to the maintenance of records that, in reasonable detail, accurately and fairly reflect the transactions and dispositions of the assets of the company; (ii) provide reasonable assurance that transactions are recorded as necessary to permit preparation of financial statements in accordance with generally accepted accounting principles, and that receipts and expenditures of the company are being made only in accordance with authorizations of management and directors of the company; and (iii) provide reasonable assurance regarding prevention or timely detection of unauthorized acquisition, use, or disposition of the company’s assets that could have a material effect on the financial statements. Because of its inherent limitations, internal control over financial reporting may not prevent or detect misstatements. Also, projections of any evaluation of effectiveness to future periods are subject to the risk that controls may become inadequate because of changes in conditions, or that the degree of compliance with the policies or procedures may deteriorate. PricewaterhouseCoopers LLP New York, New York January 24, 2008 To the Board of Directors and the Shareholders of The Goldman Sachs Group, Inc.: In our opinion, the accompanying consolidated statements of financial condition and the related consolidated statements of earnings, changes in shareholders’ equity, cash flows and comprehensive income present fairly, in all material respects, the financial position of The Goldman Sachs Group, Inc. and its subsidiaries (the Company) at November 30, 2007 and November 24, 2006, and the results of its operations and its cash flows for each of the three fiscal years in the period ended November 30, 2007 in conformity with accounting principles generally accepted in the United States of America. Also in our opinion, the Company maintained, in all material respects, effective internal control over financial reporting as of November 30, 2007, based on criteria established in Internal Control — Integrated Framework issued by the Committee of Sponsoring Organizations of the Treadway Commission (COSO). The Company’s management is responsible for these financial statements, for maintaining effective internal control over financial reporting and for its assessment of the effectiveness of internal control over financial reporting, included in Management’s Report on Internal Control over Financial Reporting appearing on page 84. Our responsibility is to express opinions on these financial statements and on the Company’s internal control over financial reporting based on our integrated audits. We conducted our audits in accordance with the standards of the Public Company Accounting Oversight Board (United States). Those standards require that we plan and perform the audits to obtain reasonable assurance about whether the financial statements are free of material misstatement and whether effective internal control over financial reporting was maintained in all material respects. Our audits of the financial statements included examining, on a test basis, evidence supporting the amounts and disclosures in the financial statements, assessing the accounting principles used and significant estimates made by management, and evaluating the overall financial statement presentation. Our audit of internal control over financial reporting included obtaining an understanding of internal control over financial reporting, assessing the risk that a material weakness exists, and testing and evaluating the design and operating effectiveness of internal control based on the assessed risk. Our audits also included performing such other procedures as we considered necessary in the circumstances. We believe that our audits provide a reasonable basis for our opinion. 85Goldman Sachs 2007 Annual Report
  • 88.
    Consolidated Statements ofEarnings The accompanying notes are an integral part of these consolidated financial statements. Year Ended November (in millions, except per share amounts) 2007 2006 2005 Revenues Investment banking $ 7,555 $  5,613 $  3,599 Trading and principal investments 29,714 24,027 15,452 Asset management and securities services 4,731 4,527 3,090 Interest income 45,968 35,186 21,250   Total revenues 87,968 69,353 43,391 Interest expense 41,981 31,688 18,153   Revenues, net of interest expense 45,987 37,665 25,238 Operating expenses Compensation and benefits 20,190 16,457 11,758 Brokerage, clearing, exchange and distribution fees 2,758 1,985 1,416 Market development 601 492 378 Communications and technology 665 544 490 Depreciation and amortization 624 521 501 Amortization of identifiable intangible assets 195 173 124 Occupancy 975 850 728 Professional fees 714 545 475 Cost of power generation 335 406 386 Other expenses 1,326 1,132 709   Total non-compensation expenses 8,193 6,648 5,207   Total operating expenses 28,383 23,105 16,965 Pre-tax earnings 17,604 14,560 8,273 Provision for taxes 6,005 5,023 2,647 Net earnings 11,599 9,537 5,626 Preferred stock dividends 192 139 17 Net earnings applicable to common shareholders $11,407 $  9,398 $  5,609 Earnings per common share Basic $  26.34 $  20.93 $  11.73 Diluted 24.73 19.69 11.21 Average common shares outstanding Basic 433.0 449.0 478.1 Diluted 461.2 477.4 500.2 86 Goldman Sachs 2007 Annual Report
  • 89.
    Consolidated Statements ofFinancial Condition As of November (in millions, except share and per share amounts) 2007 2006 Assets Cash and cash equivalents $   11,882 $   6,293 Cash and securities segregated for regulatory and other purposes (includes $94,018   and $20,723 at fair value as of November 2007 and November 2006, respectively) 119,939 80,990 Receivables from brokers, dealers and clearing organizations 19,078 13,223 Receivables from customers and counterparties   (includes $1,950 at fair value as of November 2007) 129,105 79,790 Collateralized agreements:   Securities borrowed (includes $83,277 at fair value as of November 2007) 277,413 219,342   Financial instruments purchased under agreements to resell    (includes $85,717 at fair value as of November 2007) 85,717 82,126 Financial instruments owned, at fair value 406,457 298,563 Financial instruments owned and pledged as collateral, at fair value 46,138 35,998   Total financial instruments owned, at fair value 452,595 334,561 Other assets 24,067 21,876   Total assets $1,119,796 $838,201 Liabilities and shareholders’ equity Unsecured short-term borrowings, including the current portion of unsecured   long-term borrowings (includes $48,331 and $10,220 at fair value as of   November 2007 and November 2006, respectively) $   71,557 $  47,904 Bank deposits (includes $463 at fair value as of November 2007) 15,370 10,697 Payables to brokers, dealers and clearing organizations 8,335 6,293 Payables to customers and counterparties 310,118 206,884 Collateralized financings:   Securities loaned (includes $5,449 at fair value as of November 2007) 28,624 22,208   Financial instruments sold under agreements to repurchase    (includes $159,178 at fair value as of November 2007) 159,178 147,492   Other secured financings (includes $33,581 and $3,300 at fair value as of November 2007    and November 2006, respectively) 65,710 50,424 Financial instruments sold, but not yet purchased, at fair value 215,023 155,805 Other liabilities and accrued expenses 38,907 31,866 Unsecured long-term borrowings (includes $15,928 and $7,250 at fair value as of   November 2007 and November 2006, respectively) 164,174 122,842   Total liabilities 1,076,996 802,415 Commitments, contingencies and guarantees Shareholders’ equity Preferred stock, par value $0.01 per share; 150,000,000 shares authorized,   124,000 shares issued and outstanding as of both November 2007 and November 2006,   with liquidation preference of $25,000 per share 3,100 3,100 Common stock, par value $0.01 per share; 4,000,000,000 shares authorized, 618,707,032 and   599,697,200 shares issued as of November 2007 and November 2006, respectively, and 390,682,013   and 412,666,084 shares outstanding as of November 2007 and November 2006, respectively 6 6 Restricted stock units and employee stock options 9,302 6,290 Nonvoting common stock, par value $0.01 per share; 200,000,000 shares authorized,   no shares issued and outstanding — — Additional paid-in capital 22,027 19,731 Retained earnings 38,642 27,868 Accumulated other comprehensive income/(loss) (118) 21 Common stock held in treasury, at cost, par value $0.01 per share; 228,025,019 and   187,031,116 shares as of November 2007 and November 2006, respectively (30,159) (21,230)   Total shareholders’ equity 42,800 35,786   Total liabilities and shareholders’ equity $1,119,796 $838,201 The accompanying notes are an integral part of these consolidated financial statements. 87Goldman Sachs 2007 Annual Report
  • 90.
    Consolidated Statements ofChanges in Shareholders’ Equity Year Ended November (in millions, except per share amounts) 2007 2006 2005 Preferred stock   Balance, beginning of year $  3,100 $  1,750 $     —   Issued — 1,350 1,750   Balance, end of year 3,100 3,100 1,750 Common stock, par value $0.01 per share   Balance, beginning of year 6 6 6   Issued — — —   Balance, end of year 6 6 6 Restricted stock units and employee stock options   Balance, beginning of year 6,290 3,415 2,013   Issuance and amortization of restricted stock units and employee stock options 4,684 3,787 1,871   Delivery of common stock underlying restricted stock units (1,548) (781) (423)   Forfeiture of restricted stock units and employee stock options (113) (129) (37)   Exercise of employee stock options (11) (2) (9)   Balance, end of year 9,302 6,290 3,415 Additional paid-in capital   Balance, beginning of year 19,731 17,159 15,501   Issuance of common stock, including the delivery of common stock    underlying restricted stock units and proceeds from the exercise    of employee stock options 2,338 2,432 1,580   Cancellation of restricted stock units in satisfaction of withholding    tax requirements (929) (375) (163)   Stock purchase contract fee related to automatic preferred enhanced    capital securities (20) — —   Preferred stock issuance costs — (1) (31)   Excess net tax benefit related to share-based compensation 908 653 272   Cash settlement of share-based compensation (1) (137) —   Balance, end of year 22,027 19,731 17,159 Retained earnings   Balance, beginning of year, as previously reported 27,868 19,085 13,970   Cumulative effect of adjustment from adoption of SFAS No. 157, net of tax 51 — —   Cumulative effect of adjustment from adoption of SFAS No. 159, net of tax (45) — —   Balance, beginning of year, after cumulative effect of adjustments 27,874 19,085 13,970   Net earnings 11,599 9,537 5,626   Dividends and dividend equivalents declared on common stock    and restricted stock units (639) (615) (494)   Dividends declared on preferred stock (192) (139) (17)   Balance, end of year 38,642 27,868 19,085 Unearned compensation   Balance, beginning of year — — (117)   Amortization of restricted stock units — — 117   Balance, end of year — — — Accumulated other comprehensive income/(loss)   Balance, beginning of year 21 — 11   Adjustment from adoption of SFAS No. 158, net of tax (194) — —   Currency translation adjustment, net of tax 39 45 (27)   Minimum pension liability adjustment, net of tax 38 (27) (11)   Net gains/(losses) on cash flow hedges, net of tax (2) (7) 9   Net unrealized gains/(losses) on available-for-sale securities, net of tax (12) 10 18   Reclassification to retained earnings from adoption of SFAS No. 159, net of tax (8) — —   Balance, end of year (118) 21 — Common stock held in treasury, at cost   Balance, beginning of year (21,230) (13,413) (6,305)   Repurchased (8,956) (7,817) (7,108)   Reissued 27 — —   Balance, end of year (30,159) (21,230) (13,413) Total shareholders’ equity $ 42,800 $ 35,786 $ 28,002 The accompanying notes are an integral part of these consolidated financial statements. 88 Goldman Sachs 2007 Annual Report
  • 91.
    Consolidated Statements ofCash Flows Year Ended November (in millions) 2007 2006 2005 Cash flows from operating activities   Net earnings $  11,599 $  9,537 $  5,626   Non-cash items included in net earnings    Depreciation and amortization 916 749 689    Amortization of identifiable intangible assets 251 246 165    Deferred income taxes 129 (1,505) (450)    Share-based compensation 4,465 3,654 1,756   Changes in operating assets and liabilities    Cash and securities segregated for regulatory and other purposes (39,079) (21,044) (3,226)    Net receivables from brokers, dealers and clearing organizations (3,811) (1,794) 1,322    Net payables to customers and counterparties 53,857 9,823 2,953    Securities borrowed, net of securities loaned (51,655) (28,666) (32,777)    Financial instruments sold under agreements to repurchase,     net of financial instruments purchased under agreements to resell 8,095 (42) 62,269    Financial instruments owned, at fair value (118,864) (48,479) (66,899)    Financial instruments sold, but not yet purchased, at fair value 57,938 6,384 16,974    Other, net 7,962 12,823 (815)     Net cash used for operating activities (68,197) (58,314) (12,413) Cash flows from investing activities   Purchase of property, leasehold improvements and equipment (2,130) (1,744) (1,421)   Proceeds from sales of property, leasehold improvements and equipment 93 69 639   Business acquisitions, net of cash acquired (1,900) (1,661) (556)   Proceeds from sales of investments 4,294 2,114 274   Purchase of available-for-sale securities (872) (12,922) —   Proceeds from sales of available-for-sale securities 911 4,396 —     Net cash provided by/(used for) investing activities 396 (9,748) (1,064) Cash flows from financing activities   Unsecured short-term borrowings, net 12,262 (4,031) (5)   Other secured financings (short-term), net 2,780 16,856 2,238   Proceeds from issuance of other secured financings (long-term) 21,703 14,451 7,279   Repayment of other secured financings (long-term), including the current portion (7,355) (7,420) (5,941)   Proceeds from issuance of unsecured long-term borrowings 57,516 48,839 35,898   Repayment of unsecured long-term borrowings, including the current portion (14,823) (13,510) (16,399)   Derivative contracts with a financing element, net 4,814 3,494 1,060   Bank deposits, net 4,673 10,697 —   Common stock repurchased (8,956) (7,817) (7,108)   Dividends and dividend equivalents paid on common stock,    preferred stock and restricted stock units (831) (754) (511)   Proceeds from issuance of common stock 791 1,613 1,143   Proceeds from issuance of preferred stock, net of issuance costs — 1,349 1,719   Excess tax benefit related to share-based compensation 817 464 —   Cash settlement of share-based compensation (1) (137) —     Net cash provided by financing activities 73,390 64,094 19,373    Net increase/(decrease) in cash and cash equivalents 5,589 (3,968) 5,896 Cash and cash equivalents, beginning of year 6,293 10,261 4,365 Cash and cash equivalents, end of year $  11,882 $  6,293 $ 10,261 Supplemental Disclosures: Cash payments for interest, net of capitalized interest, were $40.74 billion, $30.98 billion and $17.49 billion for the years ended November 2007, November 2006 and November 2005, respectively. Cash payments for income taxes, net of refunds, were $5.78 billion, $4.56 billion and $2.47 billion for the years ended November 2007, November 2006 and November 2005, respectively. Non-cash activities: The firm assumed $409 million, $498 million and $1.15 billion of debt in connection with business acquisitions for the years ended November 2007, November 2006 and November 2005, respectively. For the year ended November 2007, the firm issued $17 million of common stock in connection with business acquisitions. The accompanying notes are an integral part of these consolidated financial statements. 89Goldman Sachs 2007 Annual Report
  • 92.
    Consolidated Statements ofComprehensive Income Year Ended November (in millions) 2007 2006 2005 Net earnings $11,599 $9,537 $5,626 Currency translation adjustment, net of tax 39 45 (27) Minimum pension liability adjustment, net of tax 38 (27) (11) Net gains/(losses) on cash flow hedges, net of tax (2) (7) 9 Net unrealized gains/(losses) on available-for-sale securities, net of tax (12) 10 18 Comprehensive income $11,662 $9,558 $5,615 The accompanying notes are an integral part of these consolidated financial statements. 90 Goldman Sachs 2007 Annual Report
  • 93.
    Notes to ConsolidatedFinancial Statements The firm determines whether it has a controlling financial interest in an entity by first evaluating whether the entity is a voting interest entity, a variable interest entity (VIE) or a qualifying special-purpose entity (QSPE) under generally accepted accounting principles. ■ Voting Interest Entities. Voting interest entities are entities in which (i) the total equity investment at risk is sufficient to enable the entity to finance its activities independently and (ii) the equity holders have the obligation to absorb losses, the right to receive residual returns and the right to make decisions about the entity’s activities. Voting interest entities are consolidated in accordance with Accounting Research Bulletin (ARB) No. 51, “Consolidated Financial Statements,” as amended. ARB No. 51 states that the usual condition for a controlling financial interest in an entity is ownership of a majority voting interest. Accordingly, the firm consolidates voting interest entities in which it has a majority voting interest. ■ Variable Interest Entities. VIEs are entities that lack one or more of the characteristics of a voting interest entity. A controlling financial interest in a VIE is present when an enterprise has a variable interest, or a combination of variable interests, that will absorb a majority of the VIE’s expected losses, receive a majority of the VIE’s expected residual returns, or both. The enterprise with a controlling financial interest, known as the primary beneficiary, consolidates the VIE. In accordance with Financial Accounting Standards Board (FASB) Interpretation (FIN) No. 46-R, “Consolidation of Variable Interest Entities,” the firm consolidates VIEs for which it is the primary beneficiary. The firm determines whether it is the primary beneficiary of a VIE by first performing a qualitative analysis of the VIE that includes a review of, among other factors, its capital structure, contractual terms, which interests create or absorb variability, related party relationships and the design of the VIE. Where qualitative analysis is not conclusive, the firm performs a quantitative analysis. For purposes of allocating a VIE’s expected losses and expected residual returns to its variable interest holders, the firm utilizes the “top down” method. Under that method, the firm calculates its share of the VIE’s expected losses and expected residual returns using the specific cash flows that would be allocated to it, based on contractual arrangements and/or the firm’s position in the capital structure of the VIE, under various probability- weighted scenarios. ■ QSPEs. QSPEs are passive entities that are commonly used in mortgage and other securitization transactions. Statement of Financial Accounting Standards (SFAS) No. 140, “Accounting for Transfers and Servicing of Financial Assets and Extinguishments of Liabilities,” sets forth the criteria an entity must satisfy to be a QSPE. These criteria include the Note 1 Description of Business The Goldman Sachs Group, Inc. (Group Inc.), a Delaware corporation, together with its consolidated subsidiaries (collectively, the firm), is a leading global investment banking, securities and investment management firm that provides a wide range of services worldwide to a substantial and diversified client base that includes corporations, financial institutions, governments and high-net-worth individuals. The firm’s activities are divided into three segments: ■ Investment Banking. The firm provides a broad range of investment banking services to a diverse group of corporations, financial institutions, investment funds, governments and individuals. ■ Trading and Principal Investments. The firm facilitates client transactions with a diverse group of corporations, financial institutions, investment funds, governments and individuals and takes proprietary positions through market making in, trading of and investing in fixed income and equity products, currencies, commodities and derivatives on these products. In addition, the firm engages in market- making and specialist activities on equities and options exchanges and clears client transactions on major stock, options and futures exchanges worldwide. In connection with the firm’s merchant banking and other investing activities, the firm makes principal investments directly and through funds that the firm raises and manages. ■ Asset Management and Securities Services. The firm provides investment advisory and financial planning services and offers investment products (primarily through separately managed accounts and commingled vehicles, such as mutual funds and private investment funds) across all major asset classes to a diverse group of institutions and individuals worldwide and provides prime brokerage services, financing services and securities lending services to institutional clients, including hedge funds, mutual funds, pension funds and foundations, and to high-net-worth individuals worldwide. Note 2 Significant Accounting Policies Basis of Presentation These consolidated financial statements include the accounts of Group Inc. and all other entities in which the firm has a controlling financial interest. All material intercompany transactions and balances have been eliminated. 91Goldman Sachs 2007 Annual Report
  • 94.
    Notes to ConsolidatedFinancial Statements and tax audits. Although these and other estimates and assumptions are based on the best available information, actual results could be materially different from these estimates. Revenue Recognition Investment Banking. Underwriting revenues and fees from mergers and acquisitions and other financial advisory assignments are recognized in the consolidated statements of earnings when the services related to the underlying transaction are completed under the terms of the engagement. Expenses associated with such transactions are deferred until the related revenue is recognized or the engagement is otherwise concluded. Underwriting revenues are presented net of related expenses. Expenses associated with financial advisory transactions are recorded as non-compensation expenses, net of client reimbursements. Financial Instruments. “Total financial instruments owned, at fair value” and “Financial instruments sold, but not yet purchased, at fair value” are reflected in the consolidated statements of financial condition on a trade-date basis. Related unrealized gains or losses are generally recognized in “Trading and principal investments” in the consolidated statements of earnings. The fair value of a financial instrument is the amount that would be received to sell an asset or paid to transfer a liability in an orderly transaction between market participants at the measurement date (the exit price). Instruments that the firm owns (long positions) are marked to bid prices, and instruments that the firm has sold, but not yet purchased (short positions), are marked to offer prices. Fair value measurements are not adjusted for transaction costs. The firm adopted SFAS No. 157, “Fair Value Measurements,” as of the beginning of 2007. SFAS No. 157 establishes a fair value hierarchy that prioritizes the inputs to valuation techniques used to measure fair value. The hierarchy gives the highest priority to unadjusted quoted prices in active markets for identical assets or liabilities (level 1 measurements) and the lowest priority to unobservable inputs (level 3 measurements). The three levels of the fair value hierarchy under SFAS No. 157 are described below: Basis of Fair Value Measurement Level 1 Unadjusted quoted prices in active markets that are accessible at the measurement date for identical, unrestricted assets or liabilities; Level 2 Quoted prices in markets that are not active or financial instruments for which all significant inputs are observable, either directly or indirectly; Level 3 Prices or valuations that require inputs that are both significant to the fair value measurement and unobservable. types of assets a QSPE may hold, limits on asset sales, the use of derivatives and financial guarantees, and the level of discretion a servicer may exercise in attempting to collect receivables. These criteria may require management to make judgments about complex matters, including whether a derivative is considered passive and the degree of discretion a servicer may exercise. In accordance with SFAS No. 140 and FIN No. 46-R, the firm does not consolidate QSPEs. ■ Equity-Method Investments. When the firm does not have a controlling financial interest in an entity but exerts significant influence over the entity’s operating and financial policies (generally defined as owning a voting interest of 20% to 50%) and has an investment in common stock or in-substance common stock, the firm accounts for its investment in accordance with the equity method of accounting prescribed by Accounting Principles Board (APB) Opinion No. 18, “The Equity Method of Accounting for Investments in Common Stock.” For investments acquired subsequent to the adoption of SFAS No. 159, “The Fair Value Option for Financial Assets and Financial Liabilities,” the firm generally has elected to apply the fair value option in accounting for such investments. See “— Recent Accounting Developments” for a discussion of the firm’s adoption of SFAS No. 159. ■ Other. If the firm does not consolidate an entity or apply the equity method of accounting, the firm accounts for its investment at fair value. The firm also has formed numerous nonconsolidated investment funds with third-party investors that are typically organized as limited partnerships. The firm acts as general partner for these funds and generally does not hold a majority of the economic interests in these funds. The firm has generally provided the third-party investors with rights to terminate the funds or to remove the firm as the general partner. These fund investments are included in “Financial instruments owned, at fair value” in the consolidated statements of financial condition. Unless otherwise stated herein, all references to November 2007, November 2006 and November 2005 refer to the firm’s fiscal years ended, or the dates, as the context requires, November 30, 2007, November 24, 2006 and November 25, 2005, respectively. Certain reclassifications have been made to previously reported amounts to conform to the current presentation. Use of Estimates These consolidated financial statements have been prepared in accordance with generally accepted accounting principles that require management to make certain estimates and assumptions. The most important of these estimates and assumptions relate to fair value measurements, the accounting for goodwill and identifiable intangible assets and the provision for potential losses that may arise from litigation and regulatory proceedings 92 Goldman Sachs 2007 Annual Report
  • 95.
    Notes to ConsolidatedFinancial Statements For positions that are not traded in active markets or are subject to transfer restrictions, valuations are adjusted to reflect illiquidity and/or non-transferability, and such adjustments are generally based on available market evidence. In the absence of such evidence, management’s best estimate is used. ■ Derivative Contracts. Derivative contracts can be exchange-traded or over-the-counter (OTC). Exchange-traded derivatives typically fall within level 1 or level 2 of the fair value hierarchy depending on whether they are deemed to be actively traded or not. The firm generally values exchange- traded derivatives within portfolios using models which calibrate to market clearing levels and eliminate timing differences between the closing price of the exchange-traded derivatives and their underlying cash instruments. In such cases, exchange-traded derivatives are classified within level 2 of the fair value hierarchy. OTC derivatives are valued using market transactions and other market evidence whenever possible, including market- based inputs to models, model calibration to market clearing transactions, broker or dealer quotations or alternative pricing sources with reasonable levels of price transparency. Where models are used, the selection of a particular model to value an OTC derivative depends upon the contractual terms of, and specific risks inherent in, the instrument as well as the availability of pricing information in the market. The firm generally uses similar models to value similar instruments. Valuation models require a variety of inputs, including contractual terms, market prices, yield curves, credit curves, measures of volatility, prepayment rates and correlations of such inputs. For OTC derivatives that trade in liquid markets, such as generic forwards, swaps and options, model inputs can generally be verified and model selection does not involve significant management judgment. Such instruments are typically classified within level 2 of the fair value hierarchy. Certain OTC derivatives trade in less liquid markets with limited pricing information, and the determination of fair value for these derivatives is inherently more difficult. Such instruments are classified within level 3 of the fair value hierarchy. Where the firm does not have corroborating market evidence to support significant model inputs and cannot verify the model to market transactions, transaction price is initially used as the best estimate of fair value. Accordingly, when a pricing model is used to value such an instrument, the model is adjusted so that the model value at inception equals the transaction price. The valuations of these less liquid OTC derivatives are typically based on level 1 and/or level 2 inputs that can be observed in the market, as well as unobservable level 3 inputs. Subsequent to initial recognition, the firm updates the level 1 and level 2 inputs to reflect observable market changes, with resulting gains and losses reflected within level 3. Level 3 inputs are only changed when corroborated by evidence such as similar market transactions, A financial instrument’s level within the fair value hierarchy is based on the lowest level of any input that is significant to the fair value measurement. See “— Recent Accounting Developments” for a discussion of the impact of adopting SFAS No. 157. In determining fair value, the firm separates its “Financial instruments owned, at fair value” and its “Financial instruments sold, but not yet purchased, at fair value” into two categories: cash instruments and derivative contracts. ■ Cash Instruments. The firm’s cash instruments are generally classified within level 1 or level 2 of the fair value hierarchy because they are valued using quoted market prices, broker or dealer quotations, or alternative pricing sources with reasonable levels of price transparency. The types of instruments valued based on quoted market prices in active markets include most U.S. government and agency securities, many other sovereign government obligations, active listed equities and most money market securities. Such instruments are generally classified within level 1 of the fair value hierarchy. The firm does not adjust the quoted price for such instruments, even in situations where the firm holds a large position and a sale could reasonably impact the quoted price. The types of instruments valued based on quoted prices in markets that are not active, broker or dealer quotations, or alternative pricing sources with reasonable levels of price transparency include most investment-grade and high-yield corporate bonds, most mortgage products, certain corporate bank and bridge loans, less liquid listed equities, state, municipal and provincial obligations, most physical commodities and certain loan commitments. Such instruments are generally classified within level 2 of the fair value hierarchy. Certain cash instruments are classified within level 3 of the fair value hierarchy because they trade infrequently and therefore have little or no price transparency. Such instruments include private equity and real estate fund investments, certain corporate bank and bridge loans, less liquid mortgage whole loans, distressed debt instruments and certain loan commitments. The transaction price is initially used as the best estimate of fair value. Accordingly, when a pricing model is used to value such an instrument, the model is adjusted so that the model value at inception equals the transaction price. This valuation is adjusted only when changes to inputs and assumptions are corroborated by evidence such as transactions in similar instruments, completed or pending third-party transactions in the underlying investment or comparable entities, subsequent rounds of financing, recapitalizations and other transactions across the capital structure, offerings in the equity or debt capital markets, and changes in financial ratios or cash flows. 93Goldman Sachs 2007 Annual Report
  • 96.
    Notes to ConsolidatedFinancial Statements Securities borrowed and loaned within Trading and Principal Investments, which are related to the firm’s matched book and certain firm financing activities, are recorded at fair value as allowed by SFAS No. 159. Prior to the adoption of SFAS No. 159, these transactions were recorded based on the amount of cash collateral advanced or received plus accrued interest. These securities borrowed and loaned transactions are generally valued based on inputs with reasonable levels of price transparency and are classified within level 2 of the fair value hierarchy. ■ Other Secured Financings. In addition to repurchase agreements and securities loaned, the firm funds assets through the use of other secured financing arrangements and pledges financial instruments and other assets as collateral in these transactions. SFAS No. 159 has been adopted for those financings for which the use of fair value would eliminate non-economic volatility in earnings from using different measurement attributes (i.e., assets recorded at fair value with related nonrecourse financings recorded based on the amount of cash received plus accrued interest), primarily transfers accounted for as financings rather than sales under SFAS No. 140 and debt raised through the firm’s William Street program. These other secured financing transactions are generally valued based on inputs with reasonable levels of price transparency and are classified within level 2 of the fair value hierarchy. Other secured financings that are not recorded at fair value are recorded based on the amount of cash received plus accrued interest. See Note 3 for further information regarding other secured financings. Hybrid Financial Instruments. Hybrid financial instruments are instruments that contain bifurcatable embedded derivatives under SFAS No. 133, “Accounting for Derivative Instruments and Hedging Activities,” and do not require settlement by physical delivery of non-financial assets (e.g., physical commodities). If the firm elects to bifurcate the embedded derivative, it is accounted for at fair value and the host contract is accounted for at amortized cost, adjusted for the effective portion of any fair value hedge accounting relationships. If the firm does not elect to bifurcate, the entire hybrid financial instrument is accounted for at fair value under SFAS No. 155, “Accounting for Certain Hybrid Financial Instruments — an amendment of FASB Statements No. 133 and 140.” The primary reasons for electing the fair value option for hybrid financial instruments are mitigating volatility in earnings from using different measurement attributes, simplification and cost- benefit considerations. See Notes 3 and 4 for additional information about hybrid financial instruments. Transfers of Financial Assets. In general, transfers of financial assets are accounted for as sales under SFAS No. 140 when the firm has relinquished control over the transferred assets. For transfers accounted for as sales, any related gains or losses are recognized in net revenues. Transfers that are not third-party pricing services and/or broker or dealer quotations, or other empirical market data. In circumstances where the firm cannot verify the model value to market transactions, it is possible that a different valuation model could produce a materially different estimate of fair value. When appropriate, valuations are adjusted for various factors such as liquidity, bid/offer spreads and credit considerations. Such adjustments are generally based on available market evidence. In the absence of such evidence, management’s best estimate is used. Collateralized Agreements and Financings. Collateralized agreements consist of resale agreements and securities borrowed. Collateralized financings consist of repurchase agreements, securities loaned and other secured financings. Interest on collateralized agreements and collateralized financings is recognized in “Interest income” or “Interest expense,” respectively, over the life of the transaction. ■ Resale and Repurchase Agreements. Financial instruments purchased under agreements to resell and financial instruments sold under agreements to repurchase, principally U.S. government, federal agency and investment-grade sovereign obligations, represent collateralized financing transactions. The firm receives financial instruments purchased under agreements to resell, makes delivery of financial instruments sold under agreements to repurchase, monitors the market value of these financial instruments on a daily basis and delivers or obtains additional collateral as appropriate. Resale and repurchase agreements are carried in the consolidated statements of financial condition at fair value as allowed by SFAS No. 159. Prior to the adoption of SFAS No. 159, these transactions were recorded at contractual amounts plus accrued interest. Resale and repurchase agreements are generally valued based on inputs with reasonable levels of price transparency and are classified within level 2 of the fair value hierarchy. Resale and repurchase agreements are presented on a net-by-counterparty basis when the requirements of FIN No. 41, “Offsetting of Amounts Related to Certain Repurchase and Reverse Repurchase Agreements,” or FIN No. 39, “Offsetting of Amounts Related to Certain Contracts,” are satisfied. ■ Securities Borrowed and Loaned. Securities borrowed and loaned are generally collateralized by cash, securities or letters of credit. The firm receives securities borrowed, makes delivery of securities loaned, monitors the market value of securities borrowed and loaned, and delivers or obtains additional collateral as appropriate. Securities borrowed and loaned within Securities Services, relating to both customer activities and, to a lesser extent, certain firm financing activities, are recorded based on the amount of cash collateral advanced or received plus accrued interest. As these arrangements are generally transacted on-demand, they exhibit little, if any, sensitivity to changes in interest rates. 94 Goldman Sachs 2007 Annual Report
  • 97.
    Notes to ConsolidatedFinancial Statements Asset Management. Management fees are recognized over the period that the related service is provided based upon average net asset values. In certain circumstances, the firm is also entitled to receive incentive fees based on a percentage of a fund’s return or when the return on assets under management exceeds specified benchmark returns or other performance targets. Incentive fees are generally based on investment performance over a 12-month period and are subject to adjustment prior to the end of the measurement period. Accordingly, incentive fees are recognized in the consolidated statements of earnings when the measurement period ends. Asset management fees and incentive fees are included in “Asset management and securities services” in the consolidated statements of earnings. Share-Based Compensation In the first quarter of 2006, the firm adopted SFAS No. 123-R, “Share-Based Payment,” which is a revision to SFAS No. 123, “Accounting for Stock-Based Compensation.” SFAS No. 123-R focuses primarily on accounting for transactions in which an entity obtains employee services in exchange for share-based payments. Under SFAS No. 123-R, the cost of employee services received in exchange for a share-based award is generally measured based on the grant-date fair value of the award. Under SFAS No. 123-R, share-based awards that do not require future service (i.e., vested awards, including awards granted to retirement-eligible employees) are expensed immediately. Share-based employee awards that require future service are amortized over the relevant service period. The firm adopted SFAS No. 123-R under the modified prospective adoption method. Under that method of adoption, the provisions of SFAS No. 123-R are generally applied only to share-based awards granted subsequent to adoption. Share-based awards held by employees that were retirement-eligible on the date of adoption of SFAS No. 123-R must continue to be amortized over the stated service period of the award (and accelerated if the employee actually retires). SFAS No. 123-R requires expected forfeitures to be included in determining share-based employee compensation expense. The firm pays cash dividend equivalents on outstanding restricted stock units. Dividend equivalents paid on restricted stock units accounted for under SFAS No. 123 and SFAS No. 123-R are charged to retained earnings. SFAS No. 123-R requires dividend equivalents paid on restricted stock units expected to be forfeited to be included in compensation expense. Prior to the adoption of SFAS No. 123-R, dividend equivalents paid on restricted stock units that were later forfeited by employees were reclassified to compensation expense from retained earnings. The tax benefit related to dividend equivalents paid on restricted stock units is accounted for as a reduction of income tax expense (see “— Recent Accounting Developments” for a discussion of Emerging Issues Task Force (EITF) Issue No. 06-11, “Accounting for Income Tax Benefits of Dividends on Share-Based Payment Awards”). accounted for as sales are accounted for as collateralized financings, with the related interest expense recognized in net revenues over the life of the transaction. Power Generation. Power generation revenues associated with the firm’s consolidated power generation facilities are included in “Trading and principal investments” in the consolidated statements of earnings when power is delivered. These revenues were $421 million, $553 million and $496 million for the years ended November 2007, November 2006 and November 2005, respectively. Direct employee costs associated with the firm’s consolidated power generation facilities of $97 million, $78 million and $70 million for the years ended November 2007, November 2006 and November 2005, respectively, are included in “Compensation and benefits.” The other direct costs associated with these power generation facilities and related contractual assets are included in “Cost of power generation.” Commissions. Commission revenues from executing and clearing client transactions on stock, options and futures markets worldwide are recognized in “Trading and principal investments” in the consolidated statements of earnings on a trade-date basis. Insurance Activities. Revenues from variable annuity and life insurance contracts, and from providing reinsurance of such contracts, generally consist of fees assessed on contract holder account balances for mortality charges, policy administration and surrender charges. These fees are recognized within “Trading and principal investments” in the consolidated statements of earnings in the period that services are provided. Interest credited to variable annuity and life insurance account balances and changes in reserves are recognized in “Other expenses” in the consolidated statements of earnings. Premiums earned for providing property catastrophe reinsurance are recognized within “Trading and principal investments” in the consolidated statements of earnings over the coverage period, net of premiums ceded for the cost of reinsurance. Expenses for liabilities related to property catastrophe reinsurance claims, including estimates of claims that have been incurred but not reported, are recognized within “Other expenses” in the consolidated statements of earnings. Merchant Banking Overrides. The firm is entitled to receive merchant banking overrides (i.e., an increased share of a fund’s income and gains) when the return on the funds’ investments exceeds certain threshold returns. Overrides are based on investment performance over the life of each merchant banking fund, and future investment underperformance may require amounts of override previously distributed to the firm to be returned to the funds. Accordingly, overrides are recognized in the consolidated statements of earnings only when all material contingencies have been resolved. Overrides are included in “Trading and principal investments” in the consolidated statements of earnings. 95Goldman Sachs 2007 Annual Report
  • 98.
    Notes to ConsolidatedFinancial Statements No. 144. An impairment loss, calculated as the difference between the estimated fair value and the carrying value of an asset or asset group, is recognized if the sum of the expected undiscounted cash flows relating to the asset or asset group is less than the corresponding carrying value. The firm’s operating leases include space held in excess of current requirements. Rent expense relating to space held for growth is included in “Occupancy” in the consolidated statements of earnings. In accordance with SFAS No. 146, “Accounting for Costs Associated with Exit or Disposal Activities,” the firm records a liability, based on the fair value of the remaining lease rentals reduced by any potential or existing sublease rentals, for leases where the firm has ceased using the space and management has concluded that the firm will not derive any future economic benefits. Costs to terminate a lease before the end of its term are recognized and measured at fair value upon termination. Foreign Currency Translation Assets and liabilities denominated in non-U.S. currencies are translated at rates of exchange prevailing on the date of the consolidated statement of financial condition, and revenues and expenses are translated at average rates of exchange for the year. Gains or losses on translation of the financial statements of a non-U.S. operation, when the functional currency is other than the U.S. dollar, are included, net of hedges and taxes, in the consolidated statements of comprehensive income. The firm seeks to reduce its net investment exposure to fluctuations in foreign exchange rates through the use of foreign currency forward contracts and foreign currency-denominated debt. For foreign currency forward contracts, hedge effectiveness is assessed based on changes in forward exchange rates; accordingly, forward points are reflected as a component of the currency translation adjustment in the consolidated statements of comprehensive income. For foreign currency-denominated debt, hedge effectiveness is assessed based on changes in spot rates. Foreign currency remeasurement gains or losses on transactions in nonfunctional currencies are included in the consolidated statements of earnings. Income Taxes Deferred tax assets and liabilities are recognized for temporary differences between the financial reporting and tax bases of the firm’s assets and liabilities. Valuation allowances are established to reduce deferred tax assets to the amount that more likely than not will be realized. The firm’s tax assets and liabilities are presented as a component of “Other assets” and “Other liabilities and accrued expenses,” respectively, in the consolidated statements of financial condition. Tax provisions are computed in accordance with SFAS No. 109, “Accounting for Income Taxes.” Contingent liabilities related to income taxes are recorded when the criteria for loss recognition under In certain cases, primarily related to the death of an employee or conflicted employment (as outlined in the applicable award agreements), the firm may cash settle share-based compensation awards. For awards accounted for as equity instruments, “Additional paid-in capital” is adjusted to the extent of the difference between the current value of the award and the grant-date value of the award. Goodwill Goodwill is the cost of acquired companies in excess of the fair value of identifiable net assets at acquisition date. In accordance with SFAS No. 142, “Goodwill and Other Intangible Assets,” goodwill is tested at least annually for impairment. An impairment loss is triggered if the estimated fair value of an operating segment, which is a component one level below the firm’s three business segments, is less than its estimated net book value. Such loss is calculated as the difference between the estimated fair value of goodwill and its carrying value. Identifiable Intangible Assets Identifiable intangible assets, which consist primarily of customer lists, specialist rights and the value of business acquired (VOBA) and deferred acquisition costs (DAC) in the firm’s insurance subsidiaries, are amortized over their estimated useful lives in accordance with SFAS No. 142. Identifiable intangible assets are tested for potential impairment whenever events or changes in circumstances suggest that an asset’s or asset group’s carrying value may not be fully recoverable in accordance with SFAS No. 144, “Accounting for the Impairment or Disposal of Long-Lived Assets.” An impairment loss, calculated as the difference between the estimated fair value and the carrying value of an asset or asset group, is recognized if the sum of the estimated undiscounted cash flows relating to the asset or asset group is less than the corresponding carrying value. Property, Leasehold Improvements and Equipment Property, leasehold improvements and equipment, net of accumulated depreciation and amortization, are included in “Other assets” in the consolidated statements of financial condition. Substantially all property and equipment are depreciated on a straight-line basis over the useful life of the asset. Leasehold improvements are amortized on a straight-line basis over the useful life of the improvement or the term of the lease, whichever is shorter. Certain costs of software developed or obtained for internal use are capitalized and amortized on a straight-line basis over the useful life of the software. Property, leasehold improvements and equipment are tested for potential impairment whenever events or changes in circumstances suggest that an asset’s or asset group’s carrying value may not be fully recoverable in accordance with SFAS 96 Goldman Sachs 2007 Annual Report
  • 99.
    Notes to ConsolidatedFinancial Statements No. 157 requires that a fair value measurement reflect the assumptions market participants would use in pricing an asset or liability based on the best information available. Assumptions include the risks inherent in a particular valuation technique (such as a pricing model) and/or the risks inherent in the inputs to the model. In addition, SFAS No. 157 prohibits the recognition of “block discounts” for large holdings of unrestricted financial instruments where quoted prices are readily and regularly available for an identical asset or liability in an active market. The provisions of SFAS No. 157 are to be applied prospectively, except changes in fair value measurements that result from the initial application of SFAS No. 157 to existing derivative financial instruments measured under EITF Issue No. 02-3, existing hybrid financial instruments measured at fair value and block discounts, all of which are to be recorded as an adjustment to beginning retained earnings in the year of adoption. The firm adopted SFAS No. 157 as of the beginning of 2007. The transition adjustment to beginning retained earnings was a gain of $51 million, net of tax. For the first quarter of 2007, the effect of the nullification of EITF Issue No. 02-3 and the removal of liquidity discounts for actively traded positions was not material. In addition, under SFAS No. 157, gains on principal investments are recorded in the absence of substantial third- party transactions if market evidence is sufficient. In the first quarter of 2007, the firm recorded approximately $500 million of such gains as a result of adopting SFAS No. 157. SFAS No. 158. In September 2006, the FASB issued SFAS No. 158, “Employers’ Accounting for Defined Benefit Pension and Other Postretirement Plans, an amendment of FASB Statements No. 87, 88, 106 and 132-R.” SFAS No. 158 requires an entity to recognize in its statement of financial condition the funded status of its defined benefit pension and postretirement plans, measured as the difference between the fair value of the plan assets and the benefit obligation. SFAS No. 158 also requires an entity to recognize changes in the funded status of a defined benefit pension and postretirement plan within accumulated other comprehensive income, net of tax, to the extent such changes are not recognized in earnings as components of periodic net benefit cost. SFAS No. 158 is effective as of the end of the fiscal year ending after December 15, 2006. The firm adopted SFAS No. 158 as of the end of 2007. The adjustment to accumulated other comprehensive loss for the initial application of SFAS No. 158 was $194 million, net of tax. SFAS No. 159. In February 2007, the FASB issued SFAS No. 159, “The Fair Value Option for Financial Assets and Financial Liabilities,” which gives entities the option to measure eligible financial assets, financial liabilities and firm commitments at fair value (i.e., the fair value option), on an instrument-by- instrument basis, that are otherwise not accounted for at fair value under other accounting standards. The election to use the SFAS No. 5, “Accounting for Contingencies,” as amended, have been met (see “— Recent Accounting Developments” below for a discussion of the impact of FIN No. 48, “Accounting for Uncertainty in Income Taxes — an Interpretation of FASB Statement No. 109,” on SFAS No. 109). Earnings Per Common Share (EPS) Basic EPS is calculated by dividing net earnings applicable to common shareholders by the weighted average number of common shares outstanding. Common shares outstanding includes common stock and restricted stock units for which no future service is required as a condition to the delivery of the underlying common stock. Diluted EPS includes the determinants of basic EPS and, in addition, reflects the dilutive effect of the common stock deliverable pursuant to stock options and to restricted stock units for which future service is required as a condition to the delivery of the underlying common stock. Cash and Cash Equivalents The firm defines cash equivalents as highly liquid overnight deposits held in the ordinary course of business. Recent Accounting Developments FIN No. 48. In June 2006, the FASB issued FIN No. 48, “Accounting for Uncertainty in Income Taxes — an Interpretation of FASB Statement No. 109.” FIN No. 48 requires that the firm determine whether a tax position is more likely than not to be sustained upon examination, including resolution of any related appeals or litigation processes, based on the technical merits of the position. Once it is determined that a position meets this recognition threshold, the position is measured to determine the amount of benefit to be recognized in the financial statements. The firm will adopt the provisions of FIN No. 48 in the first quarter of 2008. Adoption of FIN No. 48 will not have a material effect on the firm’s financial condition, results of operations or cash flows. SFAS No. 157. In September 2006, the FASB issued SFAS No. 157, “Fair Value Measurements.” SFAS No. 157 clarifies that fair value is an exit price, representing the amount that would be received to sell an asset or paid to transfer a liability in an orderly transaction between market participants. Under SFAS No. 157, fair value measurements are not adjusted for transaction costs. SFAS No. 157 nullifies the guidance included in EITF Issue No. 02-3, “Issues Involved in Accounting for Derivative Contracts Held for Trading Purposes and Contracts Involved in Energy Trading and Risk Management Activities,” that prohibited the recognition of a day one gain or loss on derivative contracts (and hybrid financial instruments measured at fair value under SFAS No. 155) where the firm was unable to verify all of the significant model inputs to observable market data and/or verify the model to market transactions. However, SFAS 97Goldman Sachs 2007 Annual Report
  • 100.
    Notes to ConsolidatedFinancial Statements The primary reasons for electing the fair value option are mitigating volatility in earnings from using different measurement attributes, simplification and cost-benefit considerations. SOP No. 07-1 and FSP FIN No. 46-R-7. In June 2007, the American Institute of Certified Public Accountants (AICPA) issued Statement of Position (SOP) No. 07-1, “Clarification of the Scope of the Audit and Accounting Guide ‘Audits of Investment Companies’ and Accounting by Parent Companies and Equity Method Investors for Investments in Investment Companies.’’ SOP No. 07-1 clarifies when an entity may apply the provisions of the Audit and Accounting Guide for Investment Companies (the Guide). In May 2007, the FASB issued FSP FIN No. 46-R-7, “Application of FIN 46-R to Investment Companies,” which amends FIN No. 46-R to make permanent the temporary deferral of the application of FIN No. 46-R to entities within the scope of the revised Guide under SOP No. 07-1. FSP FIN No. 46-R-7 is effective upon adoption of SOP No. 07-1. In November 2007, the FASB issued Proposed FSP SOP No. 07-1-a, “The Effective Date of AICPA Statement of Position 07-1,” which proposes to indefinitely defer the effective date for SOP No. 07-01 and, consequently, FSP FIN No. 46-R-7. EITF Issue No. 06-11. In June 2007, the EITF reached consensus on Issue No. 06-11, “Accounting for Income Tax Benefits of Dividends on Share-Based Payment Awards.” EITF Issue No. 06-11 requires that the tax benefit related to dividend equivalents paid on restricted stock units, which are expected to vest, be recorded as an increase to additional paid-in capital. The firm currently accounts for this tax benefit as a reduction to income tax expense. EITF Issue No. 06-11 is to be applied prospectively for tax benefits on dividends declared in fiscal years beginning after December 15, 2007, and the firm expects to adopt the provisions of EITF Issue No. 06-11 beginning in the first quarter of 2009. The firm is currently evaluating the impact of adopting EITF Issue No. 06-11 on its financial condition, results of operations and cash flows. fair value option is available at specified election dates, such as when an entity first recognizes a financial asset or financial liability or upon entering into a firm commitment. Subsequent changes in fair value must be recorded in earnings. Additionally, SFAS No. 159 allows for a one-time election for existing positions upon adoption, with the transition adjustment recorded to beginning retained earnings. The firm adopted SFAS No. 159 as of the beginning of 2007 and elected to apply the fair value option to the following financial assets and liabilities existing at the time of adoption: ■ certain unsecured short-term borrowings, consisting of all promissory notes and commercial paper; ■ certain other secured financings, primarily transfers accounted for as financings rather than sales under SFAS No. 140 and debt raised through the firm’s William Street program; ■ certain unsecured long-term borrowings, including prepaid physical commodity transactions; ■ resale and repurchase agreements; ■ securities borrowed and loaned within Trading and Principal Investments, consisting of the firm’s matched book and certain firm financing activities; ■ securities held by Goldman Sachs Bank USA (GS Bank USA), which were previously accounted for as available- for-sale; and ■ receivables from customers and counterparties arising from transfers accounted for as secured loans rather than purchases under SFAS No. 140. The transition adjustment to beginning retained earnings related to the adoption of SFAS No. 159 was a loss of $45 million, net of tax, substantially all of which related to applying the fair value option to prepaid physical commodity transactions. Subsequent to the adoption of SFAS No. 159, the firm has elected to apply the fair value option (i) to new positions within the above categories, (ii) to corporate loans, corporate loan commitments and certificates of deposit issued by GS Bank USA and (iii) generally to investments where the firm would otherwise apply the equity method of accounting. In certain cases, the firm may continue to apply the equity method of accounting to those investments which are strategic in nature or closely related to the firm’s principal business activities, where the firm has a significant degree of involvement in the cash flows or operations of the investee, and/or where cost- benefit considerations are less significant. 98 Goldman Sachs 2007 Annual Report
  • 101.
    Notes to ConsolidatedFinancial Statements Total financial assets at fair value classified within level 3 were $69.15 billion or 6% of “Total assets” on the consolidated statement of financial condition as of November 2007. This includes $14.44 billion of financial assets at fair value classified within level 3 for which the firm does not bear economic exposure. Excluding assets for which the firm does not bear economic exposure, level 3 assets were 5% of “Total assets” as of November 2007. Fair Value Hierarchy The following tables set forth by level within the fair value hierarchy “Financial instruments owned, at fair value,” “Financial instruments sold, but not yet purchased, at fair value” and financial assets and liabilities accounted for at fair value under SFAS No. 155 and SFAS No. 159 as of November 2007 (see Note 2 for further information on the fair value hierarchy). As required by SFAS No. 157, assets and liabilities are classified in their entirety based on the lowest level of input that is significant to the fair value measurement. Note 3 Financial Instruments Fair Value of Financial Instruments The following table sets forth the firm’s financial instruments owned, at fair value, including those pledged as collateral, and financial instruments sold, but not yet purchased, at fair value. At any point in time, the firm may use cash instruments as well as derivatives to manage a long or short risk position. As of November 2007 2006 (in millions) Assets Liabilities Assets Liabilities Commercial paper, certificates of deposit, time deposits and   other money market instruments $   8,985 (1) $      — $  14,723 (1) $      — U.S. government, federal agency and sovereign obligations 70,774 58,637 68,071 51,200 Mortgage and other asset-backed loans and securities 54,073 (2) — 41,017 253 Bank loans 49,154 3,563 28,196 1,154 Corporate debt securities and other debt obligations 39,219 8,280 29,806 7,050 Equities and convertible debentures 122,205 45,130 83,282 30,441 Physical commodities 2,571 35 1,923 211 Derivative contracts 105,614 (3) 99,378 (5) 67,543 (3) 65,496 (5) Total $452,595 (4) $215,023 $334,561 (4) $155,805 (1) Includes $6.17 billion and $6.93 billion as of November 2007 and November 2006, respectively, of money market instruments held by William Street Funding Corporation to support the William Street credit extension program (see Note 6 for further information regarding the William Street program). (2) Includes $7.64 billion of mortgage whole loans that were transferred to securitization vehicles where such transfers were accounted for as secured financings rather than sales under SFAS No. 140. The firm distributed to investors the securities that were issued by the securitization vehicles and therefore does not bear economic exposure to the underlying mortgage whole loans. (3) Net of cash received pursuant to credit support agreements of $59.05 billion and $24.06 billion as of November 2007 and November 2006, respectively. (4) Includes $1.17 billion of securities held within the firm’s insurance subsidiaries which are accounted for as available-for-sale under SFAS No. 115, “Accounting for Certain Investments in Debt and Equity Securities” as of November 2007. Includes $9.95 billion of securities held within GS Bank USA and the firm’s insurance subsidiaries which were accounted for as available-for-sale as of November 2006. (5) Net of cash paid pursuant to credit support agreements of $27.76 billion and $16.00 billion as of November 2007 and November 2006, respectively. 99Goldman Sachs 2007 Annual Report
  • 102.
    Notes to ConsolidatedFinancial Statements Assets at Fair Value as of November 2007 Netting and (in millions) Level 1 Level 2 Level 3 Collateral Total    Commercial paper, certificates of     deposit, time deposits and other     money market instruments $   6,237 $  2,748 $     — $      — $   8,985    U.S. government, federal agency and     sovereign obligations 37,966 32,808 — — 70,774    Mortgage and other asset-backed loans     and securities — 38,073 16,000 — 54,073    Bank loans — 35,820 13,334 — 49,154    Corporate debt securities and other     debt obligations 915 32,193 6,111 — 39,219    Equities and convertible debentures 68,727 35,472 18,006 (6) — 122,205    Physical commodities — 2,571 — — 2,571   Cash instruments 113,845 179,685 53,451 — 346,981   Derivative contracts 286 153,065 15,700 (63,437) (7) 105,614 Financial instruments owned, at fair value 114,131 332,750 69,151 (63,437) 452,595 Securities segregated for regulatory   and other purposes 24,078 (4) 69,940 (5) — — 94,018 Receivables from customers and counterparties (1) — 1,950 — — 1,950 Securities borrowed (2) — 83,277 — — 83,277 Financial instruments purchased under   agreements to resell, at fair value — 85,717 — — 85,717 Total assets at fair value $138,209 $573,634 $ 69,151 $(63,437) $717,557 Level 3 assets for which the firm   does not bear economic exposure (3) (14,437) Level 3 assets for which the firm   bears economic exposure $ 54,714 (1) Consists of transfers accounted for as secured loans rather than purchases under SFAS No. 140 and prepaid variable share forwards. (2) Reflects securities borrowed within Trading and Principal Investments. Excludes securities borrowed within Securities Services, which are accounted for based on the amount of cash collateral advanced plus accrued interest. (3) Consists of level 3 assets which are financed by nonrecourse debt, attributable to minority investors or attributable to employee interests in certain consolidated funds. (4) Consists of U.S. Treasury securities and money market instruments as well as insurance separate account assets measured at fair value under AICPA SOP 03-1, “Accounting and Reporting by Insurance Enterprises for Certain Nontraditional Long-Duration Contracts and for Separate Accounts.” (5) Principally consists of securities borrowed and resale agreements. The underlying securities have been segregated to satisfy certain regulatory requirements. (6) Consists of private equity and real estate fund investments. (7) Represents cash collateral and the impact of netting across the levels of the fair value hierarchy. Netting among positions classified within the same level is included in that level. 100 Goldman Sachs 2007 Annual Report
  • 103.
    Notes to ConsolidatedFinancial Statements Liabilities at Fair Value as of November 2007 Netting and (in millions) Level 1 Level 2 Level 3 Collateral Total    U.S. government, federal agency and     sovereign obligations $  57,714 $    923 $     — $     — $  58,637    Bank loans — 3,525 38 — 3,563    Corporate debt securities and     other debt obligations — 7,764 516 — 8,280    Equities and convertible debentures 44,076 1,054 — — 45,130    Physical commodities — 35 — — 35   Cash instruments 101,790 13,301 554 — 115,645   Derivative contracts 212 117,794 13,644 (32,272) (6) 99,378 Financial instruments sold, but not yet   purchased, at fair value 102,002 131,095 14,198 (32,272) 215,023 Unsecured short-term borrowings (1) — 44,060 4,271 — 48,331 Bank deposits (2) — 463 — — 463 Securities loaned (3) — 5,449 — — 5,449 Financial instruments sold under agreements   to repurchase, at fair value — 159,178 — — 159,178 Other secured financings (4) — 33,581 — — 33,581 Unsecured long-term borrowings (5) — 15,161 767 — 15,928 Total liabilities at fair value $102,002 $388,987 $19,236 $(32,272) $477,953 (1) Consists of promissory notes, commercial paper and hybrid financial instruments. (2) Consists of certificates of deposit issued by GS Bank USA. (3) Reflects securities loaned within Trading and Principal Investments. Excludes securities loaned within Securities Services, which are accounted for based on the amount of cash collateral received plus accrued interest. (4) Primarily includes transfers accounted for as financings rather than sales under SFAS No. 140 and debt raised through the firm’s William Street program. (5) Primarily includes hybrid financial instruments and prepaid physical commodity transactions. (6) Represents cash collateral and the impact of netting across the levels of the fair value hierarchy. Netting among positions classified within the same level is included in that level. Cash Instruments The net unrealized loss on level 3 cash instruments was $2.59 billion for the year ended November 2007 (which included $2.29 billion of unrealized losses on assets and $294 million of unrealized losses on liabilities), primarily consisting of unrealized losses on subprime residential mortgage loans and securities as well as non-investment-grade loan commitments, partially offset by unrealized gains on principal investments. Level 3 cash instruments are frequently hedged with instruments classified in level 1 and level 2, and accordingly, gains or losses that have been reported in level 3 are frequently offset by gains or losses attributable to instruments classified in level 1 or level 2 or by gains or losses on derivative contracts classified in level 3 of the fair value hierarchy. Level 3 Gains and Losses The table below sets forth a summary of changes in the fair value of the firm’s level 3 financial assets and liabilities for the year ended November 2007. The table reflects gains and losses for the full year for all financial assets and liabilities categorized as level 3 as of November 2007. The table does not include gains or losses that were reported in level 3 in prior periods for financial assets and liabilities that were transferred out of level 3 prior to November 2007. As reflected in the table below, the net unrealized gain on level 3 financial assets and liabilities was $1.31 billion for the year ended November 2007. This net unrealized gain should be considered in the context of the factors discussed below. 101Goldman Sachs 2007 Annual Report
  • 104.
    Notes to ConsolidatedFinancial Statements ■ Gains or losses that have been reported in level 3 resulting from changes in level 1 or level 2 inputs are frequently offset by gains or losses attributable to instruments classified in level 1 or level 2 or by cash instruments reported in level 3 of the fair value hierarchy. The unrealized gains referenced above principally resulted from changes in level 2 inputs, as opposed to changes in level 3 inputs. own credit spread on liabilities carried at fair value by discounting future cash flows at a rate which incorporates the firm’s observable credit spreads. As of November 2007, the difference between the fair value and the aggregate contractual principal amount of both long-term receivables and long-term debt instruments (principal and non-principal protected) for which the fair value option was elected was not material. Derivative Contracts The net unrealized gain on level 3 derivative contracts was $4.54 billion for the year ended November 2007. Level 3 gains and losses on derivative contracts should be considered in the context of the following factors: ■ A derivative contract with level 1 and/or level 2 inputs is classified as a level 3 financial instrument in its entirety if it has at least one significant level 3 input. ■ If there is one significant level 3 input, the entire gain or loss from adjusting only observable inputs (i.e., level 1 and level 2) is still classified as level 3. As of November 2007, the changes in the fair value of receivables (including securities borrowed and resale agreements) for which the fair value option was elected that were attributable to changes in instrument-specific credit spreads were not material. During 2007, the firm recognized gains of $216 million attributable to the observable impact of the market’s widening of the firm’s own credit spread on liabilities for which the fair value option was elected. The firm calculates the impact of its Level 3 Financial Assets and Liabilities Year Ended November 2007 Cash Cash Derivative Unsecured Unsecured Instruments Instruments Contracts Short-Term Long-Term Total (in millions) – Assets – Liabilities – Net Borrowings Borrowings Gains Balance, beginning of year $29,905 $(223) $   580 $(3,253) $(135) N/A Realized gains/(losses) 2,232 (1) (9) (2) 1,713 (2) 167 (2) (7) (2) $4,096 Unrealized gains/(losses)   relating to instruments still   held at the reporting date (2,292) (1) (294) (2) 4,543 (2) (3) (666) (2) 22 (2) $1,313 Purchases, issuances and   settlements 22,561 (30) (1,365) (1,559) (567) N/A  Transfers in and/or out of level 3 1,045 2 (3,415) 1,040 (80) N/A Balance, end of period $53,451 $(554) $ 2,056 $(4,271) $(767) N/A (1) The aggregate amounts include approximately $(1.77) billion and $1.71 billion reported in “Trading and principal investments” and “Interest income,” respectively, in the consolidated statements of earnings. (2) Substantially all is reported in “Trading and principal investments” in the consolidated statements of earnings. (3) Principally resulted from changes in level 2 inputs. 102 Goldman Sachs 2007 Annual Report
  • 105.
    Notes to ConsolidatedFinancial Statements As of November 2007 and November 2006, the firm held $45.75 billion (4% of total assets) and $46.20 billion (6% of total assets), respectively, of U.S. government and federal agency obligations (including securities guaranteed by the Federal National Mortgage Association and the Federal Home Loan Mortgage Corporation) included in “Financial instruments owned, at fair value” and “Cash and securities segregated for regulatory and other purposes” in the consolidated statements of financial condition. As of November 2007 and November 2006, the firm held $31.65 billion (3% of total assets) and $23.64 billion (3% of total assets), respectively, of other sovereign obligations, principally consisting of securities issued by the governments of Japan and the United Kingdom. In addition, as of November 2007 and November 2006, $144.92 billion and $104.76 billion of the firm’s financial instruments purchased under agreements to resell and securities borrowed, respectively, were collateralized by U.S. government and federal agency obligations. As of November 2007 and 2006, $41.26 billion and $38.22 billion of the firm’s financial instruments purchased under agreements to resell and securities borrowed, respectively, were collateralized by other sovereign obligations. As of November 2007 and November 2006, the firm did not have credit exposure to any other counterparty that exceeded 2% of the firm’s total assets. Derivative Activities Derivative contracts are instruments, such as futures, forwards, swaps or option contracts, that derive their value from underlying assets, indices, reference rates or a combination of these factors. Derivative instruments may be privately negotiated contracts, which are often referred to as OTC derivatives, or they may be listed and traded on an exchange. Derivatives may involve future commitments to purchase or sell financial instruments or commodities, or to exchange currency or interest payment streams. The amounts exchanged are based on the specific terms of the contract with reference to specified rates, securities, commodities, currencies or indices. Certain cash instruments, such as mortgage-backed securities, interest-only and principal-only obligations, and indexed debt instruments, are not considered derivatives even though their values or contractually required cash flows are derived from the price of some other security or index. However, certain commodity-related contracts are included in the firm’s derivatives disclosure, as these contracts may be settled in cash or the assets to be delivered under the contract are readily convertible into cash. The firm enters into derivative transactions to facilitate client transactions, to take proprietary positions and as a means of risk management. Risk exposures are managed through diversification, by controlling position sizes and by entering into offsetting positions. For example, the firm may manage the risk related to a portfolio of common stock by entering into an offsetting position in a related equity-index futures contract. The following table sets forth the gains and (losses) included in earnings for the year ended November 2007 related to financial assets and liabilities for which the firm has elected to apply the fair value option under SFAS No. 155 and SFAS No. 159. The table does not reflect the impact to the firm’s earnings of adopting SFAS No. 159 because a significant amount of these gains and losses would have also been recognized under previously issued generally accepted accounting principles. In addition, instruments for which the firm has elected the fair value option are economically hedged with instruments accounted for at fair value under other generally accepted accounting principles that are not reflected in the table below. (in millions) Year Ended November 2007 Unsecured long-term borrowings $(1,979) Other secured financings (1) 1,896 Unsecured short-term borrowings (1,064) Financial instruments owned, at fair value (2) (43) Other (3) 18 Total (4) $(1,172) (1) Includes gains of $2.08 billion related to financings recorded as a result of certain mortgage securitizations that are accounted for as secured financings rather than sales under SFAS No. 140. Changes in the fair value of the secured financings are equally offset by changes in the fair value of the related mortgage whole loans, which are included within the firm’s “Financial instruments owned, at fair value” in the consolidated statement of financial condition. (2) Consists of investments where the firm would otherwise have applied the equity method of accounting as well as securities held in GS Bank USA (previously accounted for as available-for-sale). (3) Consists of resale and repurchase agreements and securities borrowed and loaned within Trading and Principal Investments and certificates of deposit issued by GS Bank USA. (4) Reported within “Trading and principal investments” within the consolidated statements of earnings. The amounts exclude contractual interest, which is included in “Interest Income” and “Interest Expense,” for all instruments other than hybrid financial instruments. Credit Concentrations Credit concentrations may arise from trading, investing, underwriting and securities borrowing activities and may be impacted by changes in economic, industry or political factors. The firm seeks to mitigate credit risk by actively monitoring exposures and obtaining collateral as deemed appropriate. While the firm’s activities expose it to many different industries and counterparties, the firm routinely executes a high volume of transactions with counterparties in the financial services industry, including brokers and dealers, commercial banks, investment funds and other institutional clients, resulting in significant credit concentration with respect to this industry. In the ordinary course of business, the firm may also be subject to a concentration of credit risk to a particular counterparty, borrower or issuer. 103Goldman Sachs 2007 Annual Report
  • 106.
    Notes to ConsolidatedFinancial Statements shifts of the relevant yield curve. Parallel shifts change the interest rate of all maturities by identical amounts. Slope shifts change the curvature of the yield curve. For both the prospective assessment, in response to each of the simulated yield curve shifts, and the retrospective assessment, a hedging relationship is deemed to be effective if the fair value of the hedging instrument and the hedged item change inversely within a range of 80% to 125%. For fair value hedges, gains or losses on derivative transactions are recognized in “Interest expense” in the consolidated statements of earnings. The change in fair value of the hedged item attributable to the risk being hedged is reported as an adjustment to its carrying value and is subsequently amortized into interest expense over its remaining life. Gains or losses related to hedge ineffectiveness for all hedges are generally included in “Interest expense.” These gains or losses and the component of gains or losses on derivative transactions excluded from the assessment of hedge effectiveness (e.g., the effect of the passage of time on fair value hedges of the firm’s borrowings) were not material to the firm’s results of operations for the years ended November 2007, November 2006 and November 2005. Gains and losses on derivatives used for trading purposes are included in “Trading and principal investments” in the consolidated statements of earnings. The firm also has embedded derivatives that have been bifurcated from related borrowings under SFAS No. 133. Such derivatives, which are classified in unsecured short-term and unsecured long-term borrowings, had a carrying value of $463 million and $1.13 billion (excluding the debt host contract) as of November 2007 and November 2006, respectively. See Notes 4 and 5 for further information regarding the firm’s unsecured borrowings. The firm applies hedge accounting under SFAS No. 133 to certain derivative contracts. The firm uses these derivatives to manage certain interest rate and currency exposures, including the firm’s net investment in non-U.S. operations. The firm designates certain interest rate swap contracts as fair value hedges. These interest rate swap contracts hedge changes in the relevant benchmark interest rate (e.g., London Interbank Offered Rate (LIBOR)), effectively converting a substantial portion of the firm’s unsecured long-term and certain unsecured short-term borrowings into floating rate obligations. See Note 2 for information regarding the firm’s accounting policy for foreign currency forward contracts used to hedge its net investment in non-U.S. operations. The firm applies a long-haul method to substantially all of its hedge accounting relationships to perform an ongoing assessment of the effectiveness of these relationships in achieving offsetting changes in fair value or offsetting cash flows attributable to the risk being hedged. The firm utilizes a dollar-offset method, which compares the change in the fair value of the hedging instrument to the change in the fair value of the hedged item, excluding the effect of the passage of time, to prospectively and retrospectively assess hedge effectiveness. The firm’s prospective dollar-offset assessment utilizes scenario analyses to test hedge effectiveness via simulations of numerous parallel and slope The fair value of derivatives accounted for as qualifying hedges under SFAS No. 133 consisted of $5.12 billion and $2.66 billion in assets as of November 2007 and November 2006, respectively, and $354 million and $551 million in liabilities as of November 2007 and November 2006, respectively. The fair value of the firm’s derivative contracts is reflected net of cash paid or received pursuant to credit support agreements and is reported on a net-by-counterparty basis in the firm’s consolidated statements of financial condition when management believes a legal right of setoff exists under an enforceable netting agreement. The fair value of derivative financial instruments, computed in accordance with the firm’s netting policy, is set forth below: As of November 2007 2006 (in millions) Assets Liabilities Assets Liabilities Forward settlement contracts   $ 17,447 $20,799 $11,751 $14,335 Swap agreements 54,428 39,271 28,012 22,471 Option contracts 33,739 39,308 27,780 28,690 Total $105,614 $99,378 $67,543 $65,496 104 Goldman Sachs 2007 Annual Report
  • 107.
    Notes to ConsolidatedFinancial Statements During the year ended November 2007, the firm securitized $81.40 billion of financial assets ($24.95 billion of residential mortgages, $19.50 billion of commercial mortgages and $36.95 billion of other financial assets, primarily in connection with collateralized debt and loan obligations (CDOs and CLOs)). During the year ended November 2006, the firm securitized $103.92 billion of financial assets ($67.73 billion of residential mortgages, $12.78 billion of commercial mortgages and $23.41 billion of other financial assets, primarily in connection with CDOs and CLOs). Cash flows received on retained interests were approximately $705 million and $801 million for the years ended November 2007 and November 2006, respectively. As of November 2007 and November 2006, the firm held $4.57 billion and $7.08 billion of retained interests, respectively, from these securitization activities, including $2.72 billion and $5.18 billion, respectively, held in QSPEs. assumptions to the change in fair value is not usually linear. In addition, the impact of a change in a particular assumption is calculated independently of changes in any other assumption. In practice, simultaneous changes in assumptions might magnify or counteract the sensitivities disclosed above. Securitization Activities The firm securitizes commercial and residential mortgages, home equity and auto loans, government and corporate bonds and other types of financial assets. The firm acts as underwriter of the beneficial interests that are sold to investors. The firm derecognizes financial assets transferred in securitizations provided it has relinquished control over such assets. Transferred assets are accounted for at fair value prior to securitization. Net revenues related to these underwriting activities are recognized in connection with the sales of the underlying beneficial interests to investors. The firm may retain interests in securitized financial assets, primarily in the form of senior or subordinated securities, including residual interests. Retained interests are accounted for at fair value and are included in “Total financial instruments owned, at fair value” in the consolidated statements of financial condition. The preceding table does not give effect to the offsetting benefit of other financial instruments that are held to mitigate risks inherent in these retained interests. Changes in fair value based on an adverse variation in assumptions generally cannot be extrapolated because the relationship of the change in The following table sets forth the weighted average key economic assumptions used in measuring the fair value of the firm’s retained interests and the sensitivity of this fair value to immediate adverse changes of 10% and 20% in those assumptions: As of November 2007 As of November 2006 Type of Retained Interests Type of Retained Interests Mortgage- CDOs and Corporate Mortgage- CDOs and Corporate ($ in millions) Backed CLOs (3) Debt Backed CLOs (3) Debt (4) Fair value of retained interests $3,378 $1,188 $— $4,013 $1,973 $1,097 Weighted average life (years) 6.6 2.7 — 6.0 7.0 2.2 Constant prepayment rate 15.1% 11.9% N/A 21.2% 24.5% N/A Impact of 10% adverse change $     (50) $   (43) $— $  (121) $    (2) $    — Impact of 20% adverse change (91) (98) — (221) (6) — Anticipated credit losses (1) 4.3% N/A N/A 2.0% N/A N/A Impact of 10% adverse change (2) $     (45) $    — $— $   (81) $    — $    — Impact of 20% adverse change (2) (72) — — (155) — — Discount rate 8.4% 23.1% N/A 9.4% 6.9% 3.9% Impact of 10% adverse change $     (89) $   (46) $— $  (136) $   (38) $     (9) Impact of 20% adverse change (170) (92) — (266) (74) (17) (1) Anticipated credit losses are computed only on positions for which expected credit loss is a key assumption in the determination of fair value or positions for which expected credit loss is not reflected within the discount rate. (2) The impacts of adverse change take into account credit mitigants incorporated in the retained interests, including over-collateralization and subordination provisions. (3) Includes $905 million and $1.26 billion as of November 2007 and November 2006, respectively, of retained interests related to transfers of securitized assets that were accounted for as secured financings rather than sales under SFAS No. 140. (4) Includes retained interests in bonds and other types of financial assets that are not subject to prepayment risk. 105Goldman Sachs 2007 Annual Report
  • 108.
    Notes to ConsolidatedFinancial Statements VIEs generally purchase assets by issuing debt and equity instruments. In certain instances, the firm provides guarantees to VIEs or holders of variable interests in VIEs. In such cases, the maximum exposure to loss included in the tables set forth below is the notional amount of such guarantees. Such amounts do not represent anticipated losses in connection with these guarantees. The firm’s variable interests in VIEs include senior and subordinated debt; loan commitments; limited and general partnership interests; preferred and common stock; interest rate, foreign currency, equity, commodity and credit derivatives; guarantees; and residual interests in mortgage-backed and asset-backed securitization vehicles, CDOs and CLOs. The firm’s exposure to the obligations of VIEs is generally limited to its interests in these entities. The following tables set forth total assets in nonconsolidated VIEs in which the firm holds significant variable interests and the firm’s maximum exposure to loss associated with these variable interests. The firm has aggregated nonconsolidated VIEs based on principal business activity, as reflected in the first column. The nature of the firm’s variable interests can take different forms, as described in the columns under maximum exposure to loss. In addition to the retained interests described above, the firm also held interests in residential mortgage QSPEs purchased in connection with secondary market-making activities. These purchased interests approximated $6 billion and $8 billion as of November 2007 and November 2006, respectively. As of November 2007 and November 2006, the firm held mortgage servicing rights with a fair value of $93 million and $62 million, respectively, substantially all of which were retained in connection with residential mortgage securitizations. These servicing assets represent the firm’s right to receive a future stream of cash flows associated with the firm’s obligation to service residential mortgages. The fair value of mortgage servicing rights will fluctuate in response to changes in certain economic variables, such as interest rates, loan prepayment assumptions and default rates. The firm determines the fair value of mortgage servicing rights by using valuation models that incorporate these variables in quantifying anticipated cash flows related to servicing activities. Variable Interest Entities (VIEs) The firm, in the ordinary course of business, retains interests in VIEs in connection with its securitization activities. The firm also purchases and sells variable interests in VIEs, which primarily issue mortgage-backed and other asset-backed securities, CDOs and CLOs, in connection with its market-making activities and makes investments in and loans to VIEs that hold performing and nonperforming debt, equity, real estate, power-related and other assets. In addition, the firm utilizes VIEs to provide investors with principal-protected notes, credit-linked notes and asset-repackaged notes designed to meet their objectives. 106 Goldman Sachs 2007 Annual Report
  • 109.
    Notes to ConsolidatedFinancial Statements These tables do not give effect to the benefit of any offsetting financial instruments that are held to mitigate risks related to the firm’s interests in nonconsolidated VIEs. As of November 2007 Maximum Exposure to Loss in Nonconsolidated VIEs (1) Purchased and Retained Commitments Loans and (in millions) VIE Assets Interests and Guarantees Derivatives Investments Total Mortgage CDOs (2) $18,914 $1,011 $    — $10,089 $    — $11,100 Corporate CDOs and CLOs (3) 10,750 411 — 2,218 — 2,629 Real estate, credit-related   and other investing (4) 17,272 — 107 12 3,141 3,260 Municipal bond securitizations 1,413 — 1,413 — — 1,413 Other mortgage-backed 3,881 719 — — — 719 Other asset-backed 3,771 — — 1,579 — 1,579 Power-related 438 2 37 — 16 55 Principal-protected notes (5) 5,698 — — 5,186 — 5,186 Total $62,137 $2,143 $1,557 $19,084 $3,157 $25,941 As of November 2006 Maximum Exposure to Loss in Nonconsolidated VIEs (1) Purchased and Retained Commitments Loans and (in millions) VIE Assets Interests and Guarantees Derivatives Investments Total Mortgage CDOs (2) $26,225 $2,172 $    — $  7,119 $    — $  9,291 Corporate CDOs and CLOs (3) 11,385 234 — 2,663 — 2,897 Real estate, credit-related   and other investing (4) 16,300 — 113 8 2,088 2,209 Municipal bond securitizations 1,182 — 1,182 — — 1,182 Other mortgage-backed 8,143 477 — — — 477 Other asset-backed 96 — — 66 — 66 Power-related 3,422 10 73 — 597 680 Principal-protected notes (5) 4,363 — — 3,437 — 3,437 Total $71,116 $2,893 $1,368 $13,293 $2,685 $20,239 (1) Such amounts do not represent the anticipated losses in connection with these transactions. (2) Derivatives related to mortgage CDOs primarily consist of written protection on investment-grade, short-term collateral held by VIEs that have issued CDOs. (3) Derivatives related to corporate CDOs and CLOs primarily consist of total return swaps on CDOs and CLOs. The firm has generally transferred the risks related to the underlying securities through derivatives with non-VIEs. (4) The firm obtains interests in these VIEs in connection with making proprietary investments in real estate, distressed loans and other types of debt, mezzanine instruments and equities. (5) Derivatives related to principal-protected notes consist of out-of-the-money written put options that provide principal protection to clients invested in various fund products, with risk to the firm mitigated through portfolio rebalancing. 107Goldman Sachs 2007 Annual Report
  • 110.
    Notes to ConsolidatedFinancial Statements November 2006, respectively. Financial instruments owned and pledged in connection with repurchase agreements, securities lending agreements and other secured financings to counterparties that did not have the right to sell or repledge are included in “Financial instruments owned, at fair value” in the consolidated statements of financial condition and were $156.92 billion and $134.31 billion as of November 2007 and November 2006, respectively. Other assets (primarily real estate and cash) owned and pledged in connection with other secured financings to counterparties that did not have the right to sell or repledge were $5.86 billion and $5.34 billion as of November 2007 and November 2006, respectively. In addition to repurchase agreements and securities lending agreements, the firm obtains secured funding through the use of other arrangements. Other secured financings include arrangements that are nonrecourse, that is, only the subsidiary that executed the arrangement or a subsidiary guaranteeing the arrangement is obligated to repay the financing. Other secured financings consist of liabilities related to the firm’s William Street program, consolidated variable interest entities, collateralized central bank financings, transfers of financial assets that are accounted for as financings rather than sales under SFAS No. 140 (primarily pledged bank loans and mortgage whole loans) and other structured financing arrangements. Collateralized Transactions The firm receives financial instruments as collateral, primarily in connection with resale agreements, securities borrowed, derivative transactions and customer margin loans. Such financial instruments may include obligations of the U.S. government, federal agencies, sovereigns and corporations, as well as equities and convertibles. In many cases, the firm is permitted to deliver or repledge these financial instruments in connection with entering into repurchase agreements, securities lending agreements and other secured financings, collateralizing derivative transactions and meeting firm or customer settlement requirements. As of November 2007 and November 2006, the fair value of financial instruments received as collateral by the firm that it was permitted to deliver or repledge was $891.05 billion and $746.08 billion, respectively, of which the firm delivered or repledged $785.62 billion and $639.87 billion, respectively. The firm also pledges assets that it owns to counterparties who may or may not have the right to deliver or repledge them. Financial instruments owned and pledged to counterparties that have the right to deliver or repledge are reported as “Financial instruments owned and pledged as collateral, at fair value” in the consolidated statements of financial condition and were $46.14 billion and $36.00 billion as of November 2007 and The following table sets forth the firm’s total assets and maximum exposure to loss associated with its significant variable interests in consolidated VIEs where the firm does not hold a majority voting interest. The firm has aggregated consolidated VIEs based on principal business activity, as reflected in the first column. The table does not give effect to the benefit of any offsetting financial instruments that are held to mitigate risks related to the firm’s interests in consolidated VIEs. As of November 2007 2006 Maximum Maximum Exposure Exposure (in millions) VIE Assets (1) to Loss (2) VIE Assets (1) to Loss (2) Real estate, credit-related and other investing $2,118 $  525 $3,077 $1,368 Municipal bond securitizations 1,959 1,959 2,715 2,715 CDOs, mortgage-backed and other asset-backed 604 109 1,537 20 Foreign exchange and commodities 300 329 433 340 Principal-protected notes 1,119 1,118 894 774 Total $6,100 $4,040 $8,656 $5,217 (1) Consolidated VIE assets include assets financed on a nonrecourse basis. (2) Such amounts do not represent the anticipated losses in connection with these transactions. 108 Goldman Sachs 2007 Annual Report
  • 111.
    Notes to ConsolidatedFinancial Statements Other secured financings are set forth in the table below: As of November (in millions) 2007 2006 Other secured financings (short-term) (1) (2) $32,410 $24,290 Other secured financings (long-term):   2008 — 5,535   2009 2,903 877   2010 2,301 1,894   2011 2,427 5,105   2012 4,973 1,928   2013 – thereafter 20,696 10,795   Total other secured financings (long-term) (3) (4) 33,300 26,134 Total other secured financings (5) $65,710 $50,424 (1) As of November 2007, consists of U.S. dollar-denominated financings of $18.47 billion with a weighted average interest rate of 5.32% and non-U.S. dollar-denominated financings of $13.94 billion with a weighted average interest rate of 0.91%, after giving effect to hedging activities. As of November 2006, consists of U.S. dollar- denominated financings of $14.28 billion with a weighted average interest rate of 5.22% and non-U.S. dollar-denominated financings of $10.01 billion with a weighted average interest rate of 2.00%, after giving effect to hedging activities. The weighted average interest rates as of November 2007 and November 2006 excluded financial instruments accounted for at fair value under SFAS No. 155 or SFAS No. 159. (2) Includes other secured financings maturing within one year of the financial statement date and other secured financings that are redeemable within one year of the financial statement date at the option of the holder. (3) As of November 2007, consists of U.S. dollar-denominated financings of $22.13 billion with a weighted average interest rate of 5.73% and non-U.S. dollar-denominated financings of $11.17 billion with a weighted average interest rate of 4.28%, after giving effect to hedging activities. As of November 2006, consists of U.S. dollar- denominated financings of $16.97 billion with a weighted average interest rate of 5.61% and non-U.S. dollar-denominated financings of $9.16 billion with a weighted average interest rate of 3.81%, after giving effect to hedging activities. (4) Secured long-term financings that are repayable prior to maturity at the option of the firm are reflected at their contractual maturity dates. Secured long-term financings that are redeemable prior to maturity at the option of the holder are reflected at the dates such options become exercisable. (5) As of November 2007, $61.34 billion of these financings were collateralized by financial instruments and $4.37 billion by other assets (primarily real estate and cash). As of November 2006, $47.22 billion of these financings were collateralized by financial instruments and $3.20 billion by other assets. Other secured financings include $25.37 billion and $19.79 billion of nonrecourse obligations as of November 2007 and November 2006, respectively. 109Goldman Sachs 2007 Annual Report
  • 112.
    Notes to ConsolidatedFinancial Statements Note 4 Unsecured Short-Term Borrowings The firm obtains unsecured short-term borrowings primarily through the issuance of promissory notes, commercial paper and hybrid financial instruments. As of November 2007 and November 2006, these borrowings were $71.56 billion and $47.90 billion, respectively. Such amounts include the portion of unsecured long-term borrowings maturing within one year of the financial statement date and unsecured long-term borrowings that are redeemable within one year of the Unsecured short-term borrowings are set forth below: As of November (in millions) 2007 2006 Promissory notes $13,251 $13,811 Commercial paper 4,343 1,489 Current portion of unsecured long-term borrowings 22,740 14,115 Hybrid financial instruments 22,318 14,060 Other short-term borrowings 8,905 4,429 Total (1) $71,557 $47,904 (1) The weighted average interest rates for these borrowings, after giving effect to hedging activities, were 5.05% and 5.16% as of November 2007 and November 2006, respectively. The weighted average interest rates as of November 2007 and November 2006 excluded financial instruments accounted for at fair value under SFAS No. 155 or SFAS No. 159. financial statement date at the option of the holder. The firm accounts for promissory notes, commercial paper and certain hybrid financial instruments at fair value under SFAS No. 155 or SFAS No. 159. Short-term borrowings that are not recorded at fair value are recorded based on the amount of cash received plus accrued interest, and such amounts approximate fair value due to the short-term nature of the obligations. 110 Goldman Sachs 2007 Annual Report
  • 113.
    Notes to ConsolidatedFinancial Statements Note 5 Unsecured Long-Term Borrowings The firm’s unsecured long-term borrowings extend through 2043 and consist principally of senior borrowings. As of November 2007 and November 2006, these borrowings were $164.17 billion and $122.84 billion, respectively. Unsecured long-term borrowings are set forth below: As of November (in millions) 2007 2006 Fixed rate obligations (1)   U.S. dollar $  55,281 $  41,719   Non-U.S. dollar 29,139 22,854 Floating rate obligations (2)   U.S. dollar 47,308 38,342   Non-U.S. dollar 32,446 19,927 Total $164,174 $122,842 (1) As of November 2007 and November 2006, interest rates on U.S. dollar fixed rate obligations ranged from 3.88% to 10.04% and from 3.88% to 12.00%, respectively. As of November 2007 and November 2006, interest rates on non-U.S. dollar fixed rate obligations ranged from 0.67% to 8.88% and from 0.31% to 8.88%, respectively. (2) Floating interest rates generally are based on LIBOR or the federal funds target rate. Equity-linked and indexed instruments are included in floating rate obligations. Unsecured long-term borrowings by maturity date are set forth below: As of November 2007 (1) (2) 2006(1) (2) U.S. Non-U.S. U.S. Non-U.S. (in millions) Dollar Dollar Total Dollar Dollar Total 2008 $      — $     — $      — $14,848 $  3,038 $  17,886 2009 20,204 2,978 23,182 12,398 2,978 15,376 2010 7,989 5,714 13,703 5,034 4,945 9,979 2011 5,848 4,839 10,687 5,675 4,389 10,064 2012 14,913 3,695 18,608 4,500 2,098 6,598 2013-thereafter 53,635 44,359 97,994 37,606 25,333 62,939 Total $102,589 $61,585 $164,174 $80,061 $42,781 $122,842 (1) Unsecured long-term borrowings maturing within one year of the financial statement date and certain unsecured long-term borrowings that are redeemable within one year of the financial statement date at the option of the holder are included as unsecured short-term borrowings in the consolidated statements of financial condition. (2) Unsecured long-term borrowings that are repayable prior to maturity at the option of the firm are reflected at their contractual maturity dates. Unsecured long-term borrowings that are redeemable prior to maturity at the option of the holder are reflected at the dates such options become exercisable. The firm enters into derivative contracts, such as interest rate futures contracts, interest rate swap agreements, currency swap agreements, commodity contracts and equity-linked and indexed contracts, to effectively convert a substantial portion of its unsecured long-term borrowings into U.S. dollar-based floating rate obligations. Accordingly, the carrying value of unsecured long-term borrowings approximated fair value as of November 2007 and November 2006. 111Goldman Sachs 2007 Annual Report
  • 114.
    Notes to ConsolidatedFinancial Statements pay dividends on or make certain repurchases of its common stock. The Trust is not permitted to pay any distributions on the common beneficial interests held by the firm unless all dividends payable on the preferred beneficial interests have been paid in full. These debentures are junior in right of payment to all of the firm’s senior indebtedness and all of the firm’s subordinated borrowings, other than the junior subordinated debt issued in connection with the Normal Automatic Preferred Enhanced Capital Securities (see discussion below). Junior Subordinated Debt Issued to Trusts in Connection with Fixed-to-Floating and Floating Rate Normal Automatic Preferred Enhanced Capital Securities. In the second quarter of 2007, the firm issued a total of $2.25 billion of remarketable junior subordinated notes to Goldman Sachs Capital II and Goldman Sachs Capital III (the Trusts), Delaware statutory trusts that, in turn, issued $2.25 billion of guaranteed perpetual Automatic Preferred Enhanced Capital Securities (APEX) to third parties and a de minimis amount of common securities to the firm. The firm also entered into contracts with the Trusts to sell $2.25 billion of perpetual non-cumulative preferred stock to be issued by the firm (the stock purchase contracts). The Trusts are wholly owned finance subsidiaries of the firm for regulatory and legal purposes but are not consolidated for accounting purposes. The firm pays interest semiannually on $1.75 billion of junior subordinated notes issued to Goldman Sachs Capital II at a fixed annual rate of 5.59% and the notes mature on June 1, 2043. The firm pays interest quarterly on $500 million of junior subordinated notes issued to Goldman Sachs Capital III at a rate per annum equal to three-month LIBOR plus .57% and the notes mature on September 1, 2043. In addition, the firm makes contract payments at a rate of .20% per annum on the stock purchase contracts held by the Trusts. The firm has the right to defer payments on the junior subordinated notes and the stock purchase contracts, subject to limitations, and therefore Subordinated Borrowings Unsecured long-term borrowings include subordinated borrowings with outstanding principal amounts of $16.32 billion and $7.51 billion as of November 2007 and November 2006, respectively, as set forth below. Subordinated Notes. As of November 2007, the firm had $11.23 billion of subordinated notes outstanding with maturities ranging from fiscal 2009 to 2037. The effective weighted average interest rate on these subordinated notes was 5.75%, after giving effect to derivative contracts used to convert fixed rate obligations into floating rate obligations. As of November 2006, the firm had $4.67 billion of subordinated notes outstanding with maturities ranging from 2007 to 2036 and with an effective weighted average interest rate of 6.24%. These notes are junior in right of payment to all of the firm’s senior indebtedness. Junior Subordinated Debt Issued to a Trust in Connection with Trust Preferred Securities. The firm issued $2.84 billion of junior subordinated debentures in its first quarter of 2004 to Goldman Sachs Capital I (the Trust), a Delaware statutory trust that, in turn, issued $2.75 billion of guaranteed preferred beneficial interests to third parties and $85 million of common beneficial interests to the firm and invested the proceeds from the sale in junior subordinated debentures issued by the firm. The Trust is a wholly owned finance subsidiary of the firm for regulatory and legal purposes but is not consolidated for accounting purposes. The firm pays interest semiannually on these debentures at an annual rate of 6.345% and the debentures mature on February 15, 2034. The coupon rate and the payment dates applicable to the beneficial interests are the same as the interest rate and payment dates applicable to the debentures. The firm has the right, from time to time, to defer payment of interest on the debentures, and, therefore, cause payment on the Trust’s preferred beneficial interests to be deferred, in each case up to ten consecutive semiannual periods. During any such extension period, the firm will not be permitted to, among other things, The effective weighted average interest rates for unsecured long-term borrowings are set forth below: As of November 2007 2006 ($ in millions) Amount Rate Amount Rate Fixed rate obligations $  3,787 5.28% $   1,997 6.13% Floating rate obligations (1) (2) 160,387 5.68 120,845 5.75 Total $164,174 5.67 $122,842 5.75 (1) Includes fixed rate obligations that have been converted into floating rate obligations through derivative contracts. (2) The weighted average interest rates as of November 2007 and November 2006 excluded financial instruments accounted for at fair value under SFAS No. 155 or SFAS No. 159. 112 Goldman Sachs 2007 Annual Report
  • 115.
    Notes to ConsolidatedFinancial Statements Note 6 Commitments, Contingencies and Guarantees Commitments Forward Starting Collateralized Agreements and Financings. The firm had forward starting resale agreements and securities borrowing agreements of $28.14 billion and $18.29 billion as of November 2007 and November 2006, respectively. The firm had forward starting repurchase agreements and securities lending agreements of $15.39 billion and $17.15 billion as of November 2007 and November 2006, respectively. Commitments to Extend Credit. In connection with its lending activities, the firm had outstanding commitments to extend credit of $82.75 billion and $100.48 billion as of November 2007 and November 2006, respectively. The firm’s commitments to extend credit are agreements to lend to counter- parties that have fixed termination dates and are contingent on the satisfaction of all conditions to borrowing set forth in the contract. Since these commitments may expire unused or be reduced or cancelled at the counterparty’s request, the total commitment amount does not necessarily reflect the actual future cash flow requirements. The firm accounts for these commitments at fair value. To the extent that the firm recognizes losses on these commitments, such losses are recorded within the firm’s Trading and Principal Investments segment net of any related underwriting fees. short-term in nature, as borrowers often seek to replace them with other funding sources. Included within the non-investment- grade amount as of November 2007 was $26.09 billion of exposure to leveraged lending capital market transactions, $3.50 billion related to commercial real estate transactions and $12.34 billion arising from other unfunded credit facilities. Included within the non-investment-grade amount as of November 2006 was $39.68 billion of exposure to leveraged lending capital market transactions, $12.11 billion related to commercial real estate transactions and $5.23 billion arising from other unfunded credit facilities. The following table summarizes the firm’s commitments to extend credit as of November 2007 and November 2006: Year Ended November (in millions) 2007 2006 Commercial lending commitments   Investment-grade $11,719 $   7,604   Non-investment-grade 41,930 57,017 William Street program 24,488 18,831 Warehouse financing 4,610 17,026 Total commitments to extend credit $82,747 $100,478 cause payment on the APEX to be deferred. During any such extension period, the firm will not be permitted to, among other things, pay dividends on or make certain repurchases of its common or preferred stock. The junior subordinated notes are junior in right of payment to all of the firm’s senior indebtedness and all of the firm’s other subordinated borrowings. In connection with the APEX issuance, the firm covenanted in favor of certain of its debtholders, who are initially the holders of the firm’s 6.345% Junior Subordinated Debentures due February 15, 2034, that, subject to certain exceptions, the firm would not redeem or purchase (i) the firm’s junior subordinated debt issued to the APEX trusts prior to the applicable stock purchase date or (ii) APEX or shares of the firm’s Series E or Series F Preferred Stock prior to the date that is ten years after the applicable stock purchase date, unless the applicable redemption or purchase price does not exceed a maximum amount determined by reference to the aggregate amount of net cash proceeds that the firm has received from the sale of qualifying equity securities during the 180 day period preceding the redemption or purchase. The firm has accounted for the stock purchase contracts as equity instruments under EITF Issue No. 00-19, “Accounting for Derivative Financial Instruments Indexed to, and Potentially Settled in, a Company’s Own Stock,” and, accordingly, recorded the cost of the stock purchase contracts as a reduction to additional paid-in capital. See Note 7 for information on the preferred stock that the firm will issue in connection with the stock purchase contracts. ■ Commercial lending commitments. The firm extends commercial lending commitments primarily in connection with contingent acquisition financing and other types of corporate lending as well as commercial real estate financing. The total commitment amount does not necessarily reflect the actual future cash flow requirements, as the firm often syndicates all or substantial portions of these commitments, the commitments may expire unused, or the commitments may be cancelled or reduced at the request of the counter- party. In addition, commitments that are extended for contingent acquisition financing are often intended to be 113Goldman Sachs 2007 Annual Report
  • 116.
    Notes to ConsolidatedFinancial Statements Letters of Credit. The firm provides letters of credit issued by various banks to counterparties in lieu of securities or cash to satisfy various collateral and margin deposit requirements. Letters of credit outstanding were $8.75 billion and $5.73 billion as of November 2007 and November 2006, respectively. Investment Commitments. In connection with its merchant banking and other investing activities, the firm invests in private equity, real estate and other assets directly and through funds that it raises and manages. In connection with these activities, the firm had commitments to invest up to $17.76 billion and $8.24 billion as of November 2007 and November 2006, respectively, including $12.32 billion and $4.41 billion, respectively, of commitments to invest in funds managed by the firm. Construction-Related Commitments. As of November 2007 and November 2006, the firm had construction-related commitments of $769 million and $1.63 billion, respectively, including outstanding commitments of $642 million and $500 million as of November 2007 and November 2006, respectively, related to the firm’s new world headquarters in New York City, which is expected to cost between $2.3 billion and $2.5 billion. The firm is partially financing this construction project with tax-exempt Liberty Bonds. The firm borrowed approximately $1.40 billion and approximately $250 million in 2005 and 2007, respectively, through the issuance of Liberty Bonds. Underwriting Commitments. As of November 2007 and November 2006, the firm had commitments to purchase $88 million and $2.62 billion, respectively, of securities in connection with its underwriting activities. Other. The firm had other purchase commitments of $420 million and $393 million as of November 2007 and November 2006, respectively. In addition, the firm entered into an agreement in 2007 to acquire Litton Loan Servicing LP (Litton), the mortgage servicing unit of Credit-Based Asset Servicing and Securitization LLC (C-BASS). The transaction closed in December 2007 at a purchase price of $428 million, plus the repayment of $916 million of outstanding Litton debt obligations. ■ William Street program. Substantially all of the commitments provided under the William Street credit extension program are to investment-grade corporate borrowers. Commitments under the program are extended by William Street Commitment Corporation (Commitment Corp.), a consolidated wholly owned subsidiary of Group Inc. whose assets and liabilities are legally separated from other assets and liabilities of the firm, William Street Credit Corporation, GS Bank USA, Goldman Sachs Credit Partners L.P. or other consolidated wholly owned subsidiaries of Group Inc. The commitments extended by Commitment Corp. are supported, in part, by funding raised by William Street Funding Corporation (Funding Corp.), another consolidated wholly owned subsidiary of Group Inc. whose assets and liabilities are also legally separated from other assets and liabilities of the firm. The assets of Commitment Corp. and of Funding Corp. will not be available to their respective shareholders until the claims of their respective creditors have been paid. In addition, no affiliate of either Commitment Corp. or Funding Corp., except in limited cases as expressly agreed in writing, is responsible for any obligation of either entity. With respect to most of the William Street commitments, Sumitomo Mitsui Financial Group, Inc. (SMFG) provides the firm with credit loss protection that is generally limited to 95% of the first loss the firm realizes on approved loan commitments, up to a maximum of $1.00 billion. In addition, subject to the satisfaction of certain conditions, upon the firm’s request, SMFG will provide protection for 70% of the second loss on such commitments, up to a maximum of $1.13 billion. The firm also uses other financial instruments to mitigate credit risks related to certain William Street commitments not covered by SMFG. ■ Warehouse financing. The firm provides financing for the warehousing of financial assets to be securitized. These financings are expected to be repaid from the proceeds of the related securitizations for which the firm may or may not act as underwriter. These arrangements are secured by the warehoused assets, primarily consisting of corporate bank loans and commercial mortgages as of November 2007 and residential mortgages and mortgage-backed securities, corporate bank loans and commercial mortgages as of November 2006. In connection with its warehouse financing activities, the firm had loans of $44 million collateralized by subprime mortgages as of November 2007. 114 Goldman Sachs 2007 Annual Report
  • 117.
    Notes to ConsolidatedFinancial Statements In connection with its insurance business, the firm is contingently liable to provide guaranteed minimum death and income benefits to certain contract holders and has established a reserve related to $10.84 billion and $8.04 billion of contract holder account balances as of November 2007 and November 2006, respectively, for such benefits. The weighted average attained age of these contract holders was 67 years and 70 years as of November 2007 and November 2006, respectively. The net amount at risk, representing guaranteed minimum death and income benefits in excess of contract holder account balances, was $1.04 billion and $1.27 billion as of November 2007 and November 2006, respectively. See Note 10 for more information on the firm’s insurance liabilities. Guarantees The firm enters into various derivative contracts that meet the definition of a guarantee under FIN No. 45, “Guarantor’s Accounting and Disclosure Requirements for Guarantees, Including Indirect Guarantees of Indebtedness of Others.” Such derivative contracts include credit default and total return swaps, written equity and commodity put options, written currency contracts and interest rate caps, floors and swaptions. FIN No. 45 does not require disclosures about derivative contracts if such contracts may be cash settled and the firm has no basis to conclude it is probable that the counterparties held, at inception, the underlying instruments related to the derivative contracts. The firm has concluded that these conditions have been met for certain large, internationally active commercial and investment bank end users and certain other users. Accordingly, the firm has not included such contracts in the tables below. The firm, in its capacity as an agency lender, indemnifies most of its securities lending customers against losses incurred in the event that borrowers do not return securities and the collateral held is insufficient to cover the market value of the securities borrowed. In the ordinary course of business, the firm provides other financial guarantees of the obligations of third parties (e.g., performance bonds, standby letters of credit and other guarantees to enable clients to complete transactions and merchant banking fund-related guarantees). These guarantees represent obligations to make payments to beneficiaries if the guaranteed party fails to fulfill its obligation under a contractual arrangement with that beneficiary. Leases. The firm has contractual obligations under long-term noncancelable lease agreements, principally for office space, expiring on various dates through 2069. Certain agreements are subject to periodic escalation provisions for increases in real estate taxes and other charges. Future minimum rental payments, net of minimum sublease rentals are set forth below: (in millions) Minimum rental payments   2008 $   450   2009 478   2010 372   2011 313   2012 255   2013 – thereafter 2,022 Total $3,890 Rent charged to operating expense is set forth below: (in millions) Net rent expense   2005 $359   2006 404   2007 412 Contingencies The firm is involved in a number of judicial, regulatory and arbitration proceedings concerning matters arising in connection with the conduct of its businesses. Management believes, based on currently available information, that the results of such proceedings, in the aggregate, will not have a material adverse effect on the firm’s financial condition, but may be material to the firm’s operating results for any particular period, depending, in part, upon the operating results for such period. Given the inherent difficulty of predicting the outcome of the firm’s litigation and regulatory matters, particularly in cases or proceedings in which substantial or indeterminate damages or fines are sought, the firm cannot estimate losses or ranges of losses for cases or proceedings where there is only a reasonable possibility that a loss may be incurred. 115Goldman Sachs 2007 Annual Report
  • 118.
    Notes to ConsolidatedFinancial Statements In the ordinary course of business, the firm indemnifies and guarantees certain service providers, such as clearing and custody agents, trustees and administrators, against specified potential losses in connection with their acting as an agent of, or providing services to, the firm or its affiliates. The firm also indemnifies some clients against potential losses incurred in the event specified third-party service providers, including sub-custodians and third-party brokers, improperly execute transactions. In addition, the firm is a member of payment, clearing and settlement networks as well as securities exchanges around the world that may require the firm to meet the obligations of such networks and exchanges in the event of member defaults. In connection with its prime brokerage and clearing businesses, the firm agrees to clear and settle on behalf of its clients the transactions entered into by them with other brokerage firms. The firm’s obligations in respect of such transactions are secured by the assets in the client’s account as well as any proceeds received from the transactions cleared and settled by the firm on behalf of the client. In connection with joint venture investments, the firm The firm has established trusts, including Goldman Sachs Capital I, II and III, and other entities for the limited purpose of issuing securities to third parties, lending the proceeds to the firm and entering into contractual arrangements with the firm and third parties related to this purpose. (See Note 5 for information regarding the transactions involving Goldman Sachs Capital I, II and III.) The firm effectively provides for the full and unconditional guarantee of the securities issued by these entities, which are not consolidated for accounting purposes. Timely payment by the firm of amounts due to these entities under the borrowing, preferred stock and related contractual arrangements will be sufficient to cover payments due on the securities issued by these entities. Management believes that it is unlikely that any circumstances will occur, such as nonperformance on the part of paying agents or other service providers, that would make it necessary for the firm to make payments related to these entities other than those required under the terms of the borrowing, preferred stock and related contractual arrangements and in connection with certain expenses incurred by these entities. The following tables set forth certain information about the firm’s derivative contracts that meet the definition of a guarantee and certain other guarantees as of November 2007 and November 2006: As of November 2007 Maximum Payout/Notional Amount by Period of Expiration (1) (in millions) 2008 2009 – 2010 2011– 2012 2013 – Thereafter Total Derivatives (2) $580,769 $492,563 $457,511 $514,498 $2,045,341 Securities lending indemnifications (3) 26,673 — — — 26,673 Performance bonds (4) 2,046 — — — 2,046 Other financial guarantees (5) 381 121 258 46 806 As of November 2006 Maximum Payout/Notional Amount by Period of Expiration (1) (in millions) 2007 2008 – 2009 2010 – 2011 2012– Thereafter Total Derivatives (2) $379,256 $428,258 $460,088 $399,449 $1,667,051 Securities lending indemnifications (3) 19,023 — — — 19,023 Performance bonds — — — — — Other financial guarantees (5) 592 99 76 86 853 (1) Such amounts do not represent the anticipated losses in connection with these contracts. (2) The aggregate carrying value of these derivatives as of November 2007 was a liability of $33.10 billion. The aggregate carrying value of these derivatives as of November 2006 was an asset of $1.12 billion, consisting of contracts with an asset value of $11.06 billion and contracts with a liability value of $9.94 billion. The carrying value excludes the effect of a legal right of setoff that may exist under an enforceable netting agreement. These derivative contracts are risk managed together with derivative contracts that are not considered guarantees under FIN No. 45, and therefore, these amounts do not reflect the firm’s overall risk related to its derivative activities. (3) Collateral held by the lenders in connection with securities lending indemnifications was $27.49 billion and $19.70 billion as of November 2007 and November 2006, respectively. (4) Excludes collateral of $2.05 billion related to these obligations. (5) The carrying value of these guarantees was a liability of $43 million and $15 million as of November 2007 and November 2006, respectively. 116 Goldman Sachs 2007 Annual Report
  • 119.
    Notes to ConsolidatedFinancial Statements Note 7 Shareholders’ Equity Dividends declared per common share were $1.40 in 2007, $1.30 in 2006, and $1.00 in 2005. On December 17, 2007, the Board of Directors of Group Inc. (the Board) declared a dividend of $0.35 per common share to be paid on February 28, 2008, to common shareholders of record on January 29, 2008. During 2007 and 2006, the firm repurchased 41.2 million and 50.2 million shares of its common stock at a total cost of $8.96 billion and $7.82 billion, respectively. The average price paid per share for repurchased shares was $217.29 and $155.64 for the years ended November 2007 and November 2006, respectively. In addition, to satisfy minimum statutory employee tax withholding requirements related to the delivery of common stock underlying restricted stock units, the firm cancelled 4.7 million and 3.0 million of restricted stock units with a total value of $929 million and $375 million in 2007 and 2006, respectively. The firm’s share repurchase program is intended to help maintain the appropriate level of common equity and to substantially offset increases in share count over time resulting from employee share-based compensation. The repurchase program is effected primarily through regular open-market purchases, the amounts and timing of which are determined primarily by the firm’s current and projected capital positions (i.e., comparisons of the firm’s desired level of capital to its actual level of capital) but which may also be influenced by general market conditions and the prevailing price and trading volumes of the firm’s common stock. may issue loan guarantees under which it may be liable in the event of fraud, misappropriation, environmental liabilities and certain other matters involving the borrower. The firm is unable to develop an estimate of the maximum payout under these guarantees and indemnifications. However, management believes that it is unlikely the firm will have to make any material payments under these arrangements, and no liabilities related to these guarantees and indemnifications have been recognized in the consolidated statements of financial condition as of November 2007 and November 2006. The firm provides representations and warranties to counter- parties in connection with a variety of commercial transactions and occasionally indemnifies them against potential losses caused by the breach of those representations and warranties. The firm may also provide indemnifications protecting against changes in or adverse application of certain U.S. tax laws in connection with ordinary-course transactions such as securities issuances, borrowings or derivatives. In addition, the firm may provide indemnifications to some counterparties to protect them in the event additional taxes are owed or payments are withheld, due either to a change in or an adverse application of certain non-U.S. tax laws. These indemnifications generally are standard contractual terms and are entered into in the ordinary course of business. Generally, there are no stated or notional amounts included in these indemnifications, and the contingencies triggering the obligation to indemnify are not expected to occur. The firm is unable to develop an estimate of the maximum payout under these guarantees and indemnifications. However, management believes that it is unlikely the firm will have to make any material payments under these arrangements, and no liabilities related to these arrangements have been recognized in the consolidated statements of financial condition as of November 2007 and November 2006. As of November 2007, the firm had 124,000 shares of perpetual non-cumulative preferred stock issued and outstanding in four series as set forth in the following table: Shares Shares Earliest Redemption Value Series Issued Authorized Dividend Rate Redemption Date (in millions) A 30,000 50,000 3 month LIBOR + 0.75%, with floor of 3.75% per annum April 25, 2010 $  750 B 32,000 50,000 6.20% per annum October 31, 2010 800 C 8,000 25,000 3 month LIBOR + 0.75%, with floor of 4% per annum October 31, 2010 200 D 54,000 60,000 3 month LIBOR + 0.67%, with floor of 4% per annum May 24, 2011 1,350 124,000 185,000 $3,100 117Goldman Sachs 2007 Annual Report
  • 120.
    Notes to ConsolidatedFinancial Statements declared, will be payable semiannually at a fixed annual rate of 5.79% if the stock is issued prior to June 1, 2012 and quarterly thereafter, at a rate per annum equal to the greater of (i) three- month LIBOR plus .77% and (ii) 4%. Dividends on Series F preferred stock, if declared, will be payable quarterly at a rate per annum equal to three-month LIBOR plus .77% if the stock is issued prior to September 1, 2012 and quarterly thereafter, at a rate per annum equal to the greater of (i) three-month LIBOR plus .77% and (ii) 4%. The preferred stock may be redeemed at the option of the firm on the stock purchase dates or any day thereafter, subject to the approval of the Securities and Exchange Commission (SEC) and certain covenant restrictions governing the firm’s ability to redeem or purchase the preferred stock without issuing common stock or other instruments with equity-like characteristics. Dividends declared per preferred share were $1,563.51, $1,550.00, $1,563.51 and $1,543.06 for Series A, Series B, Series C and Series D preferred stock, respectively, in 2007. Dividends declared per preferred share were $1,434.79, $1,593.06, $1,465.19 and $709.10 for Series A, Series B, Series C and Series D preferred stock, respectively, in 2006. In addition, on December 17, 2007, the Board declared dividends per preferred share of $351.84, $387.50, $351.84 and $346.84 for Series A, Series B, Series C and Series D preferred stock, respectively, to be paid on February 11, 2008 to preferred shareholders of record on January 27, 2008. Each share of preferred stock issued and outstanding has a par value of $0.01, has a liquidation preference of $25,000, is represented by 1,000 depositary shares and is redeemable at the firm’s option at a redemption price equal to $25,000 plus declared and unpaid dividends. Dividends on each series of preferred stock, if declared, are payable quarterly in arrears. The firm’s ability to declare or pay dividends on, or purchase, redeem or otherwise acquire, its common stock is subject to certain restrictions in the event that the firm fails to pay or set aside full dividends on the preferred stock for the latest completed dividend period. All series of preferred stock are pari passu and have a preference over the firm’s common stock upon liquidation. In the second quarter of 2007, the Board authorized 17,500.1 shares of perpetual Non-Cumulative Preferred Stock, Series E and 5,000.1 shares of perpetual Non-Cumulative Preferred Stock, Series F in connection with the APEX issuance (see Note 5 for further information on the APEX issuance). Under the stock purchase contracts, the firm will issue on the relevant stock purchase dates (on or before June 1, 2013 and September 1, 2013 for Series E and Series F preferred stock, respectively) one share of Series E and Series F preferred stock to Goldman Sachs Capital II and III, respectively, for each $100,000 principal amount of subordinated notes held by these trusts. When issued, each share of Series E and Series F preferred stock will have a par value of $0.01 and a liquidation preference of $100,000 per share. Dividends on Series E preferred stock, if The following table sets forth the firm’s accumulated other comprehensive income/(loss) by type: As of November (in millions) 2007 2006 Adjustment from adoption of SFAS No. 158, net of tax $(194) $  — Currency translation adjustment, net of tax 68 29 Minimum pension liability adjustment, net of tax — (38) Net gains on cash flow hedges, net of tax — 2 Net unrealized gains on available-for-sale securities, net of tax 8 (1) 28 Total accumulated other comprehensive income, net of tax $(118) $ 21 (1) Consists of net unrealized gains of $9 million on available-for-sale securities held by investees accounted for under the equity method and net unrealized losses of $1 million on available-for-sale securities held by the firm’s insurance subsidiaries. 118 Goldman Sachs 2007 Annual Report
  • 121.
    Notes to ConsolidatedFinancial Statements Note 8 Earnings Per Common Share The computations of basic and diluted earnings per common share are set forth below: Year Ended November (in millions, except per share amounts) 2007 2006 2005 Numerator for basic and diluted EPS — net earnings   applicable to common shareholders $11,407 $9,398 $5,609 Denominator for basic EPS — weighted average   number of common shares 433.0 449.0 478.1 Effect of dilutive securities   Restricted stock units 13.6 13.6 9.9   Stock options 14.6 14.8 12.2 Dilutive potential common shares 28.2 28.4 22.1 Denominator for diluted EPS — weighted average number of   common shares and dilutive potential common shares (1) 461.2 477.4 500.2 Basic EPS $ 26.34 $20.93 $11.73 Diluted EPS 24.73 19.69 11.21 (1) The diluted EPS computations do not include the anti-dilutive effect of the following options: Year Ended November (in millions) 2007 2006 2005 Number of anti-dilutive options, end of period — — 1 Note 9 Goodwill and Identifiable Intangible Assets Goodwill The following table sets forth the carrying value of the firm’s goodwill by operating segment, which is included in “Other assets” in the consolidated statements of financial condition: As of November (in millions) 2007 2006 Investment Banking   Financial Advisory $    — $    —   Underwriting 125 125 Trading and Principal Investments   FICC 123 136   Equities (1) 2,381 2,381   Principal Investments 11 4 Asset Management and Securities Services   Asset Management (2) 564 421   Securities Services 117 117 Total $3,321 $3,184 (1) Primarily related to SLK LLC (SLK). (2) Primarily related to The Ayco Company, L.P. (Ayco). The increase in goodwill from November 2006 relates to the firm’s acquisition of Macquarie — IMM Investment Management. 119Goldman Sachs 2007 Annual Report
  • 122.
    Notes to ConsolidatedFinancial Statements The estimated future amortization for existing identifiable intangible assets through 2012 is set forth below: (in millions) 2008 $186 2009 164 2010 149 2011 140 2012 131 Substantially all of the firm’s identifiable intangible assets are considered to have finite lives and are amortized over their estimated useful lives. The weighted average remaining life of the firm’s identifiable intangibles is approximately 12 years. Amortization expense associated with identifiable intangible assets was $251 million, $246 million and $165 million for the years ended November 2007, November 2006 and November 2005, respectively. Amortization expense associated with the firm’s consolidated power generation facilities is reported within “Cost of power generation” in the consolidated statements of earnings. Identifiable Intangible Assets The following table sets forth the gross carrying amount, accumulated amortization and net carrying amount of the firm’s identifiable intangible assets: As of November (in millions) 2007 2006 Customer lists (1) Gross carrying amount $1,086 $1,034 Accumulated amortization (354) (297) Net carrying amount $  732 $  737 New York Stock Exchange (NYSE) specialist rights Gross carrying amount $  714 $  714 Accumulated amortization (212) (172) Net carrying amount $  502 $  542 Insurance-related assets (2) Gross carrying amount $  461 $  396 Accumulated amortization (89) (34) Net carrying amount $  372 $  362 Exchange-traded fund (ETF) specialist rights Gross carrying amount $  138 $  138 Accumulated amortization (38) (33) Net carrying amount $  100 $  105 Power contracts (3) Gross carrying amount $   33 $  750 Accumulated amortization (13) (83) Net carrying amount $   20 $  667 Other (4) Gross carrying amount $  327 $  335 Accumulated amortization (282) (246) Net carrying amount $    45 $   89 Total Gross carrying amount $2,759 $3,367 Accumulated amortization (988) (865) Net carrying amount $1,771 $2,502 (1) Primarily includes the firm’s clearance and execution and NASDAQ customer lists related to SLK and financial counseling customer lists related to Ayco. (2) Consists of VOBA and DAC. VOBA represents the present value of estimated future gross profits of the variable annuity and life insurance business. DAC results from commissions paid by the firm to the primary insurer (ceding company) on life and annuity reinsurance agreements as compensation to place the business with the firm and to cover the ceding company’s acquisition expenses. VOBA and DAC are amortized over the estimated life of the underlying contracts based on estimated gross profits, and amortization is adjusted based on actual experience. The weighted average remaining amortization period for VOBA and DAC is seven years as of November 2007. (3) The reduction in power contracts from November 2006 is due to the sale of the majority of the firm’s ownership interests in 14 power generation facilities during 2007. (4) Primarily includes marketing and technology-related assets. 120 Goldman Sachs 2007 Annual Report
  • 123.
    Notes to ConsolidatedFinancial Statements Other Liabilities The following table sets forth the firm’s other liabilities and accrued expenses by type: As of November (in millions) 2007 2006 Compensation and benefits $11,816 $  9,165 Insurance-related liabilities (1) 10,344 11,471 Minority interest (2) 7,265 2,069 Income tax-related liabilities 2,546 2,639 Employee interests in   consolidated funds 2,187 2,690 Accrued expenses and   other payables 4,749 3,832 Total $38,907 $31,866 (1) Insurance-related liabilities are set forth in the table below: As of November (in millions) 2007 2006 Separate account liabilities $ 7,039 $  7,957 Liabilities for future benefits   and unpaid claims 2,142 2,123 Contract holder account balances 937 1,134 Reserves for guaranteed minimum   death and income benefits 226 257 Total insurance-related liabilities $10,344 $11,471 Separate account liabilities are offset by separate account assets, representing segregated contract holder funds under variable annuity and life insurance contracts. Separate account assets are included in “Cash and securities segregated for regulatory and other purposes” in the consolidated statements of financial condition. Liabilities for future benefits and unpaid claims include liabilities arising from reinsurance provided by the firm to other insurers. The firm had a receivable for $1.30 billion and $1.33 billion as of November 2007 and November 2006, respectively, related to such reinsurance contracts, which is reported in “Receivables from customers and counterparties” in the consolidated statements of financial condition. In addition, the firm has ceded risks to reinsurers related to certain of its liabilities for future benefits and unpaid claims and had a receivable of $785 million and $786 million as of November 2007 and November 2006, respectively, related to such reinsurance contracts, which is reported in “Receivables from customers and counterparties” in the consolidated statements of financial condition. Contracts to cede risks to reinsurers do not relieve the firm from its obligations to contract holders. Reserves for guaranteed minimum death and income benefits represent a liability for the expected value of guaranteed benefits in excess of projected annuity account balances. These reserves are computed in accordance with AICPA SOP 03-1 and are based on total payments expected to be made less total fees expected to be assessed over the life of the contract. (2) Includes $5.95 billion and $619 million related to consolidated investment funds as of November 2007 and November 2006, respectively. Note 10 Other Assets and Other Liabilities Other Assets Other assets are generally less liquid, nonfinancial assets. The following table sets forth the firm’s other assets by type: As of November (in millions) 2007 2006 Property, leasehold improvements   and equipment (1) $  8,975 $  6,990 Goodwill and identifiable   intangible assets (2) 5,092 5,686 Income tax-related assets 4,177 3,427 Equity-method investments (3) 2,014 2,764 Miscellaneous receivables   and other 3,809 3,009 Total $24,067 $21,876 (1) Net of accumulated depreciation and amortization of $5.88 billion and $5.06 billion as of November 2007 and November 2006, respectively. (2) See Note 9 for further information regarding the firm’s goodwill and identifiable intangible assets. (3) Excludes investments of $2.25 billion accounted for at fair value under SFAS No. 159 as of November 2007, which are included in “Financial instruments owned, at fair value” in the consolidated statements of financial condition. 121Goldman Sachs 2007 Annual Report
  • 124.
    Notes to ConsolidatedFinancial Statements On November 30, 2007, the firm adopted SFAS No. 158 which requires an entity to recognize in its statement of financial condition the funded status of its defined benefit pension and postretirement plans, measured as the difference between the fair value of the plan assets and the benefit obligation. Upon adoption, SFAS No. 158 requires an entity to recognize previously unrecognized actuarial gains and losses, prior service costs, and transition obligations and assets within “Accumulated other comprehensive income/(loss)” in the consolidated statements of changes in shareholders’ equity. Additional minimum pension liabilities are derecognized upon adoption of the new standard. As a result of adopting SFAS No. 158, the firm recorded increases of $59 million and $253 million to “Other assets” and “Other liabilities and accrued expenses,” respectively, and a $194 million loss, net of taxes, within “Accumulated other comprehensive income/(loss).” The accumulated other comprehensive loss at November 30, 2007 includes actuarial losses, prior service costs, and transition assets of $269 million, $37 million, and $(9) million, pre-tax, respectively, of which $8 million, $13 million and $(2) million, pre-tax, respectively, will be amortized from accumulated other comprehensive loss into net periodic benefit cost in 2008. Note 11 Employee Benefit Plans The firm sponsors various pension plans and certain other postretirement benefit plans, primarily healthcare and life insurance. The firm also provides certain benefits to former or inactive employees prior to retirement. Defined Benefit Pension Plans and Postretirement Plans Employees of certain non-U.S. subsidiaries participate in various defined benefit pension plans. These plans generally provide benefits based on years of credited service and a percentage of the employee’s eligible compensation. The firm maintains a defined benefit pension plan for substantially all U.K. employees. The firm expects to close the U.K. pension plan to new participants during the first half of 2008, but will continue to accrue benefits for existing participants. The firm also maintains a defined benefit pension plan for substantially all U.S. employees hired prior to November 1, 2003. As of November 2004, this plan has been closed to new participants and no further benefits will be accrued to existing participants. In addition, the firm has unfunded postretirement benefit plans that provide medical and life insurance for eligible retirees and their dependents covered under these programs. 122 Goldman Sachs 2007 Annual Report
  • 125.
    Notes to ConsolidatedFinancial Statements The following table provides a summary of the changes in the plans’ benefit obligations and the fair value of assets for November 2007 and November 2006 and a statement of the funded status of the plans as of November 2007 and November 2006: As of or for the Year Ended November 2007 2006 U.S. Non-U.S. Post- U.S. Non-U.S. Post- (in millions) Pension Pension retirement Pension Pension retirement Benefit obligation   Balance, beginning of year $395 $ 673 $ 372 $393 $ 486 $ 277   Service cost — 78 21 — 58 19   Interest cost 22 34 23 21 25 19   Plan amendments — (1) — — 1 48   Actuarial loss (11) (79) 36 (13) 38 17   Benefits paid (7) (1) (7) (6) (4) (8)   Effect of foreign exchange rates — 44 — — 69 — Balance, end of year $399 $ 748 $ 445 $395 $ 673 $ 372 Fair value of plan assets   Balance, beginning of year $423 $ 506 $    — $354 $ 392 $    —   Actual return on plan assets 34 36 — 55 58 —   Firm contributions — 38 7 20 4 8   Employee contributions — 1 — — 1 —   Benefits paid (7) (1) (7) (6) (3) (8)   Effect of foreign exchange rates — 34 — — 54 — Balance, end of year $450 $ 614 $    — $423 $ 506 $    — Prepaid/(accrued) benefit cost   Funded status $  51 $(134) $(445) $  28 $(167) $(372)   Unrecognized loss — — — 77 159 101   Unrecognized transition    (asset)/obligation — — — (17) 5 1   Unrecognized prior service cost — — — — 5 46   Adjustment to recognize    additional minimum liability — — — (10) (46) — Prepaid/(accrued) benefit cost $  51 $(134) $(445) $  78 $  (44) $(224) Amounts recognized in the Statements   of Financial Condition consist of:   Other assets $  51 $    — $    — $  99 $    — $    —   Other liabilities and    accrued expenses — (134) (445) (21) (44) (224) Net amounts recognized $  51 $(134) $(445) $  78 $  (44) $(224) 123Goldman Sachs 2007 Annual Report
  • 126.
    Notes to ConsolidatedFinancial Statements The accumulated benefit obligation for all defined benefit pension plans was $1.05 billion and $944 million as of November 2007 and November 2006, respectively. For plans in which the accumulated benefit obligation exceeded plan assets, the aggregate projected benefit obligation and accumulated benefit obligation was $722 million and $636 million, respectively, as of November 2007, and $771 million and $647 million, respectively, as of November 2006. The fair value of plan assets for each of these plans was $590 million and $583 million as of November 2007 and November 2006, respectively. The components of pension expense/(income) and postretirement expense are set forth below: Year Ended November (in millions) 2007 2006 2005 U.S. pension   Service cost $  — $  — $  —   Interest cost 22 21 19   Expected return on plan assets (32) (26) (27)   Net amortization 1 7 6 Total $  (9) $  2 $  (2) Non-U.S. pension   Service cost $ 78 $ 58 $ 44   Interest cost 34 25 20   Expected return on plan assets (36) (29) (23)   Net amortization 10 11 12   Other (1) — — (17) Total $ 86 $ 65 $ 36 Postretirement   Service cost $ 21 $ 19 $ 23   Interest cost 23 19 13   Net amortization 19 18 4 Total $ 63 $ 56 $ 40 (1) Represents a benefit as a result of the termination of a Japanese pension plan. 124 Goldman Sachs 2007 Annual Report
  • 127.
    Notes to ConsolidatedFinancial Statements The weighted average assumptions used to develop the actuarial present value of the projected benefit obligation and net periodic pension cost are set forth below. These assumptions represent a weighted average of the assumptions used for the U.S. and non-U.S. plans and are based on the economic environment of each applicable country. Year Ended November 2007 2006 2005 Defined benefit pension plans   U.S. pension — projected benefit obligation    Discount rate 6.00% 5.50% 5.25%    Rate of increase in future compensation levels N/A N/A N/A   U.S. pension — net periodic benefit cost    Discount rate 5.50 5.25 5.50    Rate of increase in future compensation levels N/A N/A N/A    Expected long-term rate of return on plan assets 7.50 7.50 7.50   Non-U.S. pension — projected benefit obligation    Discount rate 5.91 4.85 4.81    Rate of increase in future compensation levels 5.38 4.98 4.75   Non-U.S. pension — net periodic benefit cost    Discount rate 4.85 4.81 4.63    Rate of increase in future compensation levels 4.98 4.75 4.49    Expected long-term rate of return on plan assets 6.84 6.93 6.35 Postretirement plans — benefit obligation   Discount rate 6.00 5.50 5.25   Rate of increase in future compensation levels 5.00 5.00 5.00 Postretirement plans — net periodic benefit cost   Discount rate 5.50 5.25 5.50   Rate of increase in future compensation levels 5.00 5.00 5.00 For measurement purposes, an annual growth rate in the per capita cost of covered healthcare benefits of 10.02% was assumed for the year ending November 2008. The rate was assumed to decrease ratably to 5.00% for the year ending November 2015 and remain at that level thereafter. Generally, the firm determined the discount rates for its defined benefit plans by referencing indices for long-term, high-quality bonds and ensuring that the discount rate does not exceed the yield reported for those indices after adjustment for the duration of the plans’ liabilities. The firm’s approach in determining the long-term rate of return for plan assets is based upon historical financial market relationships that have existed over time with the presumption that this trend will generally remain constant in the future. 125Goldman Sachs 2007 Annual Report
  • 128.
    Notes to ConsolidatedFinancial Statements The assumed cost of healthcare has an effect on the amounts reported for the firm’s postretirement plans. A 1% change in the assumed healthcare cost trend rate would have the following effects: 1% Increase 1% Decrease (in millions) 2007 2006 2007 2006 Service plus interest costs $12 $  9 $  (9) $  (7) Obligation 94 79 (72) (62) The following table sets forth the composition of plan assets for the U.S. and non-U.S. defined benefit pension plans by asset category: As of November 2007 2006 U.S. Non-U.S. U.S. Non-U.S. Pension Pension Pension Pension Equity securities 63% 45% 64% 61% Debt securities 23 8 22 8 Other 14 47 14 31 Total 100% 100% 100% 100% The following table sets forth benefits projected to be paid from the firm’s U.S. and non-U.S. defined benefit pension and postretirement plans (net of Medicare subsidy receipts) and reflects expected future service costs, where appropriate: U.S. Non-U.S. Post- (in millions) Pension Pension retirement 2008 $  8 $  7 $   9 2009 9 7 12 2010 9 8 14 2011 10 8 15 2012 11 8 16 2013 – 2017 74 41 103 Defined Contribution Plans The firm contributes to employer-sponsored U.S. and non- U.S. defined contribution plans. The firm’s contribution to these plans was $258 million, $230 million and $305 million for the years ended November 2007, November 2006 and November 2005, respectively. The investment approach of the firm’s U.S. and major non-U.S. defined benefit pension plans involves employing a sufficient level of flexibility to capture investment opportunities as they occur, while maintaining reasonable parameters to ensure that prudence and care are exercised in the execution of the investment programs. The plans employ a total return on investment approach, whereby a mix, which is broadly similar to the actual asset allocation as of November 2007, of equity securities, debt securities and other assets, is targeted to maximize the long- term return on assets for a given level of risk. Investment risk is measured and monitored on an ongoing basis by the firm’s Retirement Committee through periodic portfolio reviews, meetings with investment managers and annual liability measurements. The firm expects to contribute a minimum of $133 million to its pension plans and $9 million to its postretirement plans in 2008. 126 Goldman Sachs 2007 Annual Report
  • 129.
    Notes to ConsolidatedFinancial Statements Other Compensation Arrangements The firm has deferred compensation plans for eligible employees. In general, under the plans, participants are able to defer payment of a portion of their cash year-end compensation. During the deferral period, participants are able to nominally invest their deferrals in certain alternatives available under the plans. Generally, under current tax law, participants are not subject to income tax on amounts deferred or on any notional investment earnings until the returns are distributed, and the firm is not entitled to a corresponding tax deduction until the amounts are distributed. The firm has recognized compensation expense for the amounts deferred under these plans. As of November 2007 and November 2006, $281 million and $245 million, respectively, related to these plans was included in “Other liabilities and accrued expenses” in the consolidated statements of financial condition. The firm has a discount stock program through which eligible senior executives may acquire restricted stock units at an effective 25% discount. The 25% discount is effected by an additional grant of restricted stock units equal to one-third of the number of restricted stock units purchased by qualifying participants. The purchased restricted stock units are 100% vested when granted, but the shares underlying them are not able to be sold or transferred (other than to satisfy tax obligations) before the third anniversary of the grant date. The shares underlying the restricted stock units that are granted in order to effect the 25% discount will generally vest in equal installments on the second and third anniversaries following the grant date and will not be transferable before the third anniversary of the grant date. Compensation expense related to these restricted stock units is recognized over the vesting period. The total value of restricted stock units granted in 2007 and 2006 in order to effect the 25% discount was $66 million and $72 million, respectively. Note 12 Employee Incentive Plans Stock Incentive Plan The firm sponsors a stock incentive plan, The Goldman Sachs Amended and Restated Stock Incentive Plan (the Amended SIP), which provides for grants of incentive stock options, nonqualified stock options, stock appreciation rights, dividend equivalent rights, restricted stock, restricted stock units, awards with performance conditions and other share-based awards. In the second quarter of 2003, the Amended SIP was approved by the firm’s shareholders, effective for grants after April 1, 2003. The total number of shares of common stock that may be issued under the Amended SIP through 2008 may not exceed 250 million shares and, in each year thereafter, may not exceed 5% of the issued and outstanding shares of common stock, determined as of the last day of the immediately preceding year, increased by the number of shares available for awards in previous years but not covered by awards granted in such years. As of November 2007 and November 2006, 160.6 million and 180.0 million shares, respectively, were available for grant under the Amended SIP. 127Goldman Sachs 2007 Annual Report
  • 130.
    Notes to ConsolidatedFinancial Statements Restricted Stock Units The firm issued restricted stock units to employees under the Amended SIP, primarily in connection with year-end compensation and acquisitions. Restricted stock units are valued based on the closing price of the underlying shares at the date of grant. Year-end restricted stock units generally vest as outlined in the applicable restricted stock unit agreements and deliver shortly after the third anniversary of the grant date. All employee restricted stock unit agreements provide that vesting is accelerated in certain circumstances, such as upon retirement, death and extended absence. Of the total restricted stock units outstanding as of November 2007 and November 2006, (i) 22.0 million Weighted Average Grant-Date Restricted Stock Fair Value of Restricted Units Outstanding Stock Units Outstanding Future No Future Future No Future Service Service Service Service Required Required Required Required Outstanding, November 2006 (1) 26,380,372 38,918,141 $138.83 $138.22   Granted (2) (3) (4) 7,968,028 13,870,644 224.40 223.97   Forfeited (816,924) (282,019) 145.30 135.46   Delivered (5) — (12,447,338) — 103.49   Vested (4) (11,506,129) 11,506,129 116.95 116.95 Outstanding, November 2007 22,025,347 51,565,557 $180.98 $164.94 (1) Includes restricted stock units granted to employees during the year ended November 2007 as part of compensation for 2006. (2) Includes restricted stock units granted to employees subsequent to November 2007 as part of compensation for 2007. (3) The weighted average grant-date fair value of restricted stock units granted during the years ended November 2007, November 2006 and November 2005 was $224.13, $196.99 and $129.03, respectively. (4) The aggregate fair value of awards vested during the years ended November 2007, November 2006 and November 2005 was $5.63 billion, $4.40 billion and $2.05 billion, respectively. (5) Includes restricted stock units that were cash settled. units and 26.4 million units, respectively, required future service as a condition to the delivery of the underlying shares of common stock and (ii) 51.6 million units and 38.9 million units, respectively, did not require future service. In all cases, delivery of the underlying shares of common stock is conditioned on the grantees satisfying certain vesting and other requirements outlined in the award agreements. When delivering the underlying shares to employees, the firm generally issues new shares of common stock. The activity related to these restricted stock units is set forth below: 128 Goldman Sachs 2007 Annual Report
  • 131.
    Notes to ConsolidatedFinancial Statements agreements provide that vesting is accelerated in certain circumstances, such as upon retirement, death and extended absence. In general, all stock options expire on the tenth anniversary of the grant date, although they may be subject to earlier termination or cancellation under certain circumstances in accordance with the terms of the Amended SIP and the applicable stock option agreement. The dilutive effect of the firm’s outstanding stock options is included in “Average common shares outstanding — Diluted” on the consolidated statements of earnings. Stock Options Stock options granted to employees generally vest as outlined in the applicable stock option agreement and first become exercisable on or after the third anniversary of the grant date. Year-end stock options for 2007 and 2006 become exercisable in January 2011 and January 2010, respectively, and expire on November 24, 2017 and November 25, 2016, respectively. Shares received on exercise prior to January 2013 for year-end 2007 options and January 2011 for year-end 2006 options can not be sold, transferred or otherwise disposed of until January 2013 and January 2011, respectively. All employee stock option The activity related to these stock options is set forth below: Weighted Weighted Aggregate Average Options Average Intrinsic Value Remaining Outstanding Exercise Price (in millions) Life (years) Outstanding, November 2006 (1) 45,647,096 $  93.12   Granted (2) 3,549,856 204.16   Exercised (9,918,538) 79.54   Forfeited (48,785) 75.08 Outstanding, November 2007 39,229,629 $106.63 $4,708 5.05 Exercisable, November 2007 29,613,029 $  83.05 $4,252 3.75 (1) Includes stock options granted to employees during the year ended November 2007 as part of compensation for 2006. (2) Includes stock options granted to employees subsequent to November 2007 as part of compensation for 2007. The total intrinsic value of options exercised during the years ended November 2007, November 2006 and November 2005 was $1.32 billion, $1.52 billion and $766 million, respectively. The options outstanding as of November 2007 are set forth below: Weighted Weighted Average Options Average Remaining Exercise Price Outstanding Exercise Price Life (years) $  45.00 – $  59.99 2,943,014 $  52.98 1.50    60.00 –    74.99 — — —    75.00 –    89.99 13,537,137 81.03 3.94    90.00 –   104.99 13,132,878 91.86 4.07   105.00 –   119.99 — — —   120.00 –   134.99 3,128,972 131.64 8.00   135.00 –   194.99 — — —   195.00 –   209.99 6,487,628 202.20 9.55 Outstanding, November 2007 39,229,629 (1) (1) Includes stock options granted to employees subsequent to November 2007 as part of compensation for 2007. 129Goldman Sachs 2007 Annual Report
  • 132.
    Notes to ConsolidatedFinancial Statements The weighted average fair value of options granted for 2007, 2006 and 2005 was $51.04, $49.96 and $32.91 per option, respectively. Fair value was estimated as of the grant date based on a Black-Scholes option-pricing model principally using the following weighted average assumptions: Year Ended November 2007 2006 2005 Risk-free interest rate 4.0% 4.6% 4.5% Expected volatility 35.0 27.5 30.0 Dividend yield 0.7 0.7 0.9 Expected life 7.5 years 7.5 years 7.5 years The common stock underlying the options granted in 2007, 2006 and 2005 is subject to transfer restrictions for a period of 2 years, 1 year and 1 year, respectively, from the date the options become exercisable. The value of the common stock underlying the options granted in 2007, 2006 and 2005 reflects a liquidity discount of 24.0%, 17.5% and 17.5%, respectively, as a result of these transfer restrictions. The liquidity discount was based on the firm’s pre-determined written liquidity discount policies. The 7.5 years expected life of the options reflects the estimated impact of these sales restrictions on the life of the awards. The following table sets forth share-based compensation and the related tax benefit: Year Ended November (in millions) 2007 2006 2005 Share-based compensation $4,549 $3,669 $1,758 Excess tax benefit related to options exercised 469 542 268 Excess tax benefit related to share-based compensation (1) 908 653 272 (1) Represents the tax benefit, recognized in additional paid-in capital, on stock options exercised and the delivery of common stock underlying restricted stock units. As of November 2007, there was $2.75 billion of total unrecognized compensation cost related to nonvested share-based compensation arrangements. This cost is expected to be recognized over a weighted average period of 2.15 years. $596 million and $362 million, respectively. Additionally, the firm may invest alongside the third-party investors in certain funds. The aggregate carrying value of the firm’s interests in these funds was $12.90 billion and $3.94 billion as of November 2007 and November 2006, respectively. In the ordinary course of business, the firm may also engage in other activities with these funds, including, among others, securities lending, trade execution, trading, custody and acquisition and bridge financing. See Note 6 for the firm’s commitments related to these funds. Note 13 Transactions with Affiliated Funds The firm has formed numerous nonconsolidated investment funds with third-party investors. The firm generally acts as the investment manager for these funds and, as such, is entitled to receive management fees and, in certain cases, advisory fees, incentive fees or overrides from these funds. These fees amounted to $3.62 billion, $3.37 billion and $2.08 billion for the years ended November 2007, November 2006 and November 2005, respectively. As of November 2007 and November 2006, the fees receivable from these funds were 130 Goldman Sachs 2007 Annual Report
  • 133.
    Notes to ConsolidatedFinancial Statements During 2007, the valuation allowance was increased by $31 million, primarily due to an increase in deferred tax assets relating to net operating losses considered more likely than not to expire unused. Net operating loss carryforwards were $2.12 billion and $1.78 billion as of November 2007 and November 2006, respectively. Note 14 Income Taxes The components of the net tax expense reflected in the consolidated statements of earnings are set forth below: Year Ended November (in millions) 2007 2006 2005 Current taxes   U.S. federal $2,934 $ 3,736 $1,504   State and local 388 627 213   Non-U.S. 2,554 2,165 1,380 Total current tax expense 5,876 6,528 3,097 Deferred taxes   U.S. federal 118 (635) 3   State and local 100 (262) (4)   Non-U.S. (89) (608) (449) Total deferred tax (benefit)/expense 129 (1,505) (450) Net tax expense $6,005 $ 5,023 $2,647 Deferred income taxes reflect the net tax effects of temporary differences between the financial reporting and tax bases of assets and liabilities. These temporary differences result in taxable or deductible amounts in future years and are measured using the tax rates and laws that will be in effect when such differences are expected to reverse. Significant components of the firm’s deferred tax assets and liabilities are set forth below: As of November (in millions) 2007 2006 Deferred tax assets   Compensation and benefits $3,869 $2,763   Other, net 997 1,104 4,866 3,867   Valuation allowance (1) (112) (81) Total deferred tax assets $4,754 $3,786 Deferred tax liabilities   Depreciation and amortization $1,208 $1,040   Unrealized gains 1,279 367 Total deferred tax liabilities $2,487 $1,407 (1) Relates primarily to the ability to utilize losses in various tax jurisdictions. The firm permanently reinvests eligible earnings of certain foreign subsidiaries and, accordingly, does not accrue any U.S. income taxes that would arise if such earnings were repatriated. As of November 2007, this policy resulted in an unrecognized net deferred tax liability of $350 million attributable to reinvested earnings of $4.97 billion. 131Goldman Sachs 2007 Annual Report
  • 134.
    Notes to ConsolidatedFinancial Statements The firm is subject to examination by the U.S. Internal Revenue Service (IRS) and other taxing authorities in jurisdictions where the firm has significant business operations, such as the United Kingdom, Japan, Korea and various states, such as New York. During fiscal 2007, the IRS substantially concluded its examination of fiscal years 2003 and 2004 and the firm does not expect that potential additional assessments from this examination will be material to its results of operations. The firm expects the IRS examination of the firm’s 2005 and 2006 fiscal years will begin during 2008. Tax reserves have been established, which the firm believes are adequate in relation to the potential for additional assessments. The resolution of tax matters is not expected to have a material effect on the firm’s financial condition but may be material to the firm’s operating results for a particular period, depending, in part, upon the operating results for that period and the firm’s effective tax rate for that period. The firm had federal net operating loss carryforwards, primarily resulting from acquisitions, of $139 million and $203 million as of November 2007 and November 2006, respectively. The firm recorded a related net deferred income tax asset of $44 million and $69 million as of November 2007 and November 2006, respectively. These carryforwards are subject to annual limitations on utilization and will begin to expire in 2011. The firm had state and local net operating loss carryforwards, primarily resulting from acquisitions, of $1.62 billion and $1.52 billion as of November 2007 and November 2006, respectively. The firm recorded a related net deferred income tax asset of $21 million and $31 million as of November 2007 and November 2006, respectively. These carryforwards are subject to annual limitations on utilization and will begin to expire in 2012. The firm had foreign net operating loss carryforwards of $306 million and $50 million as of November 2007 and November 2006, respectively. The firm recorded a related net deferred income tax asset of $84 million and $13 million as of November 2007 and November 2006, respectively. These carryforwards are subject to limitation on utilization and can be carried forward indefinitely. A reconciliation of the U.S. federal statutory income tax rate to the firm’s effective income tax rate is set forth below: Year Ended November 2007 2006 2005 U.S. federal statutory income tax rate 35.0% 35.0% 35.0% Increase related to state and local taxes, net of U.S. income tax effects 1.8 1.6 1.6 Tax credits (0.5) (0.6) (1.6) Foreign operations (1.6) (1.3) (1.2) Tax-exempt income, including dividends (0.4) (0.4) (0.6) Other (0.2) 0.2 (1) (1.2) Effective income tax rate 34.1% 34.5% 32.0% (1) Primarily includes the effect of audit settlements. Tax benefits of approximately $908 million in November 2007, $653 million in November 2006 and $272 million in November 2005, related to the delivery of common stock underlying restricted stock units and the exercise of options, were credited directly to “Additional paid-in capital” in the consolidated statements of financial condition and changes in shareholders’ equity. 132 Goldman Sachs 2007 Annual Report
  • 135.
    Notes to ConsolidatedFinancial Statements The firm has U.S. insurance subsidiaries that are subject to state insurance regulation and oversight in the states in which they are domiciled and in the other states in which they are licensed. In addition, certain of the firm’s insurance subsidiaries are regulated by the Bermuda Registrar of Companies. The firm’s insurance subsidiaries were in compliance with all regulatory capital requirements as of November 2007 and November 2006. The firm’s principal non-U.S. regulated subsidiaries include Goldman Sachs International (GSI) and Goldman Sachs Japan Co., Ltd. (GSJCL). GSI, the firm’s regulated U.K. broker-dealer, is subject to the capital requirements of the U.K.’s Financial Services Authority. GSJCL, the firm’s regulated Japanese broker- dealer, is subject to the capital requirements of Japan’s Financial Services Agency. As of November 2007 and November 2006, GSI and GSJCL were in compliance with their local capital adequacy requirements. Certain other non-U.S. subsidiaries of the firm are also subject to capital adequacy requirements promulgated by authorities of the countries in which they operate. As of November 2007 and November 2006, these subsidiaries were in compliance with their local capital adequacy requirements. The regulatory requirements referred to above restrict Group Inc.’s ability to withdraw capital from its regulated subsidiaries. As of November 2007, approximately $18.10 billion of net assets of regulated subsidiaries were restricted as to the payment of dividends to Group Inc. Note 15 Regulation The firm is regulated by the U.S. Securities and Exchange Commission as a Consolidated Supervised Entity (CSE). As such, it is subject to group-wide supervision and examination by the SEC and to minimum capital standards on a consolidated basis. As of November 2007 and November 2006, the firm was in compliance with the CSE capital standards. The firm’s principal U.S. regulated subsidiaries include Goldman, Sachs Co. (GSCo.) and Goldman Sachs Execution Clearing, L.P. (GSEC). GSCo. and GSEC are registered U.S. broker-dealers and futures commission merchants subject to Rule 15c3-1 of the SEC and Rule 1.17 of the Commodity Futures Trading Commission, which specify uniform minimum net capital requirements, as defined, for their registrants, and also require that a significant part of the registrants’ assets be kept in relatively liquid form. GSCo. and GSEC have elected to compute their minimum capital requirements in accordance with the “Alternative Net Capital Requirement” as permitted by Rule 15c3-1. As of November 2007 and November 2006, GSCo. and GSEC had net capital in excess of their minimum capital requirements. In addition to its alternative minimum net capital requirements, GSCo. is also required to hold tentative net capital in excess of $1 billion and net capital in excess of $500 million in accordance with the market and credit risk standards of Appendix E of Rule 15c3-1. GSCo. is also required to notify the SEC in the event that its tentative net capital is less than $5 billion. As of November 2007 and November 2006, GSCo. had tentative net capital and net capital in excess of both the minimum and the notification requirements. GS Bank USA, a wholly owned industrial bank, is regulated by the Federal Deposit Insurance Corporation and the State of Utah Department of Financial Institutions and is subject to minimum capital requirements. As of November 2007, GS Bank USA was in compliance with all regulatory capital requirements. Substantially all of the firm’s bank deposits as of November 2007 consisted of U.S. dollar-denominated savings accounts at GS Bank USA. Savings accounts at GS Bank USA have no stated maturity and can be withdrawn upon short notice. The weighted average interest rates for savings deposits were 4.71% and 5.17% as of November 2007 and November 2006, respectively. The carrying value of savings deposits approximated fair value as of November 2007 and November 2006. 133Goldman Sachs 2007 Annual Report
  • 136.
    Notes to ConsolidatedFinancial Statements The firm allocates revenues and expenses among the three business segments. Due to the integrated nature of these segments, estimates and judgments have been made in allocating certain revenue and expense items. Transactions between segments are based on specific criteria or approximate third- party rates. Total operating expenses include corporate items that have not been allocated to individual business segments. The allocation process is based on the manner in which management views the business of the firm. The segment information presented in the table below is prepared according to the following methodologies: ■ Revenues and expenses directly associated with each segment are included in determining pre-tax earnings. ■ Net revenues in the firm’s segments include allocations of interest income and interest expense to specific securities, commodities and other positions in relation to the cash generated by, or funding requirements of, such underlying positions. Net interest is included within segment net revenues as it is consistent with the way in which management assesses segment performance. ■ Overhead expenses not directly allocable to specific segments are allocated ratably based on direct segment expenses. Note 16 Business Segments In reporting to management, the firm’s operating results are categorized into the following three business segments: Investment Banking, Trading and Principal Investments, and Asset Management and Securities Services. Basis of Presentation In reporting segments, certain of the firm’s business lines have been aggregated where they have similar economic characteristics and are similar in each of the following areas: (i) the nature of the services they provide, (ii) their methods of distribution, (iii) the types of clients they serve and (iv) the regulatory environments in which they operate. The cost drivers of the firm taken as a whole — compensation, headcount and levels of business activity — are broadly similar in each of the firm’s business segments. Compensation and benefits expenses within the firm’s segments reflect, among other factors, the overall performance of the firm as well as the performance of individual business units. Consequently, pre-tax margins in one segment of the firm’s business may be significantly affected by the performance of the firm’s other business segments. 134 Goldman Sachs 2007 Annual Report
  • 137.
    Notes to ConsolidatedFinancial Statements Segment Operating Results Management believes that the following information provides a reasonable representation of each segment’s contribution to consolidated pre-tax earnings and total assets: As of or for the Year Ended November (in millions) 2007 2006 2005 Investment Banking Net revenues $    7,555 $   5,629 $   3,671 Operating expenses 4,985 4,062 3,258 Pre-tax earnings $    2,570 $   1,567 $    413 Segment assets $    5,526 $   4,967 $   4,869 Trading and Principal Investments Net revenues $   31,226 $  25,562 $  16,818 Operating expenses 17,998 14,962 10,600 Pre-tax earnings $   13,228 $  10,600 $   6,218 Segment assets $  744,647 $566,499 $505,536 Asset Management and Securities Services Net revenues $    7,206 $   6,474 $   4,749 Operating expenses 5,363 4,036 3,070 Pre-tax earnings $    1,843 $   2,438 $   1,679 Segment assets $  369,623 $266,735 $196,399 Total Net revenues (1) $   45,987 $  37,665 $  25,238 Operating expenses (2) 28,383 23,105 16,965 Pre-tax earnings (3) $   17,604 $  14,560 $   8,273 Total assets $1,119,796 $838,201 $706,804 (1) Net revenues include net interest as set forth in the table below: Year Ended November (in millions) 2007 2006 2005 Investment Banking $    — $   16 $   72 Trading and Principal Investments 1,512 1,535 1,366 Asset Management and Securities Services 2,475 1,947 1,659 Total net interest $3,987 $3,498 $3,097 (2) Operating expenses include net provisions for a number of litigation and regulatory proceedings of $37 million, $45 million and $37 million for the years ended November 2007, November 2006 and November 2005, respectively, that have not been allocated to the firm’s segments. (3) Pre-tax earnings include total depreciation and amortization as set forth in the table below: Year Ended November (in millions) 2007 2006 2005 Investment Banking $  137 $119 $143 Trading and Principal Investments 845 725 565 Asset Management and Securities Services 185 151 146 Total depreciation and amortization $1,167 $995 $854 135Goldman Sachs 2007 Annual Report
  • 138.
    Notes to ConsolidatedFinancial Statements Geographic results are generally allocated as follows: ■ Investment Banking: location of the client and investment banking team. ■ Fixed Income, Currency and Commodities, and Equities: location of the trading desk. ■ Principal Investments: location of the investment. ■ Asset Management: location of the sales team. ■ Securities Services: location of the primary market for the underlying security. Geographic Information Due to the highly integrated nature of international financial markets, the firm manages its businesses based on the profitability of the enterprise as a whole. Since a significant portion of the firm’s activities require cross-border coordination in order to facilitate the needs of the firm’s clients, the methodology for allocating the firm’s profitability to geographic regions is dependent on the judgment of management. The following table sets forth the total net revenues and pre-tax earnings of the firm and its consolidated subsidiaries by geographic region allocated on the methodology described above, as well as the percentage of total net revenues and total pre-tax earnings for each geographic region: Year Ended November ($ in millions) 2007 2006 2005 Net revenues   Americas (1) $23,412 51% $20,361 54% $14,639 58%   EMEA (2) 13,538 29 9,354 25 6,063 24   Asia 9,037 20 7,950 21 4,536 18 Total net revenues $45,987 100% $37,665 100% $25,238 100% Pre-tax earnings   Americas (1) $ 7,673 43% $  7,515 52% $  4,977 60%   EMEA (2) 5,458 31 3,075 21 1,457 17   Asia 4,510 26 4,015 27 1,876 23   Corporate (3) (37) — (45) — (37) — Total pre-tax earnings $17,604 100% $14,560 100% $  8,273 100% (1) Substantially all relates to U.S. results. (2) EMEA (Europe, Middle East and Africa). (3) Consists of net provisions for a number of litigation and regulatory proceedings. 136 Goldman Sachs 2007 Annual Report
  • 139.
    Supplemental Financial Information QuarterlyResults (unaudited) The following represents the firm’s unaudited quarterly results for 2007 and 2006. These quarterly results were prepared in accordance with generally accepted accounting principles and reflect all adjustments that are, in the opinion of management, necessary for a fair statement of the results. These adjustments are of a normal recurring nature. 2007 Quarter (in millions, except per share data) First Second Third Fourth Total revenues $22,280 $20,351 $23,803 $21,534 Interest expense 9,550 10,169 11,469 10,793 Revenues, net of interest expense 12,730 10,182 12,334 10,741 Operating expenses (1) 7,871 6,751 8,075 5,686 Pre-tax earnings 4,859 3,431 4,259 5,055 Provision for taxes 1,662 1,098 1,405 1,840 Net earnings 3,197 2,333 2,854 3,215 Preferred stock dividends 49 46 48 49 Net earnings applicable to common shareholders $ 3,148 $ 2,287 $ 2,806 $ 3,166 Earnings per common share   Basic $  7.08 $   5.25 $   6.54 $  7.49   Diluted 6.67 4.93 6.13 7.01 Dividends declared and paid per common share 0.35 0.35 0.35 0.35 2006 Quarter (in millions, except per share data) First Second Third Fourth Total revenues $17,246 $18,002 $15,979 $18,126 Interest expense 6,813 7,761 8,395 8,719 Revenues, net of interest expense 10,433 10,241 7,584 9,407 Operating expenses (1) 6,744 6,717 5,222 4,422 Pre-tax earnings 3,689 3,524 2,362 4,985 Provision for taxes 1,210 1,212 768 1,833 Net earnings 2,479 2,312 1,594 3,152 Preferred stock dividends 26 26 39 48 Net earnings applicable to common shareholders $  2,453 $  2,286 $  1,555 $  3,104 Earnings per common share   Basic $   5.36 $   5.08 $   3.46 $   7.06   Diluted 5.08 4.78 3.26 6.59 Dividends declared and paid per common share 0.25 0.35 0.35 0.35 (1) The timing and magnitude of changes in the firm’s bonus accruals can have a significant effect on results in a given quarter. 137Goldman Sachs 2007 Annual Report
  • 140.
    Supplemental Financial Information CommonStock Price Range The following table sets forth, for the quarters indicated, the high and low sales prices per share of the firm’s common stock. Sales Price 2007 2006 2005 High Low High Low High Low First quarter $222.75 $191.50 $146.35 $124.23 $113.93 $101.79 Second quarter 232.41 189.85 169.31 139.18 114.25 95.16 Third quarter 233.97 157.38 157.00 136.79 114.87 94.75 Fourth quarter 250.70 175.00 203.35 145.66 134.99 108.86 As of January 18, 2008, there were 7,784 holders of record of the firm’s common stock. On January 18, 2008, the last reported sales price for the firm’s common stock on the New York Stock Exchange was $187.21 per share. Common Stock Price Performance The following graph compares the performance of an investment in the firm’s common stock from November 29, 2002 through November 30, 2007, with the SP 500 Index and the SP 500 Financial Index. The graph assumes $100 was invested on November 29, 2002 in each of the firm’s common stock, the SP 500 Index and the SP 500 Financial Index, and the dividends were reinvested on the date of payment without payment of any commissions. The performance shown in the graph represents past performance and should not be considered an indication of future performance. $50 Nov–02 Nov–03 Nov–04 Nov–05 Nov–06 Nov–07 $100 $150 $200 $250 $300 $350 The Goldman Sachs Group, Inc. SP 500 Index SP 500 Financial Index The table below shows the cumulative total returns in dollars of the firm’s common stock, the SP 500 Index and the SP 500 Financial Index for Goldman Sachs’ last five fiscal year ends, assuming $100 was invested on November 29, 2002 in each of the firm’s common stock, the SP 500 Index and the SP 500 Financial Index, and the dividends were reinvested on the date of payment without payment of any commissions. The performance shown in the table represents past performance and should not be considered an indication of future performance. 11/29/02 11/28/03 11/26/04 11/25/05 11/24/06 11/30/07 The Goldman Sachs Group, Inc. $100.00 $122.90 $135.47 $174.88 $265.03 $300.00 SP 500 Index 100.00 113.02 126.31 135.45 149.62 158.19 SP 500 Financial Index 100.00 115.42 126.37 138.36 153.77 132.30 138 Goldman Sachs 2007 Annual Report
  • 141.
    Supplemental Financial Information SelectedFinancial Data As of or for the Year Ended November 2007 2006 2005 2004 2003 Income statement data (in millions) Total revenues $   87,968 $  69,353 $  43,391 $  29,839 $  23,623 Interest expense 41,981 31,688 18,153 8,888 7,600 Revenues, net of interest expense 45,987 37,665 25,238 20,951 16,023 Compensation and benefits 20,190 16,457 11,758 9,681 7,515 Other operating expenses 8,193 6,648 5,207 4,594 4,063 Pre-tax earnings $   17,604 $  14,560 $   8,273 $   6,676 $   4,445 Balance sheet data (in millions) Total assets $1,119,796 $838,201 $706,804 $531,379 $403,799 Other secured financings (long-term) 33,300 26,134 15,669 12,087 6,043 Unsecured long-term borrowings 164,174 122,842 84,338 68,609 51,439 Total liabilities 1,076,996 802,415 678,802 506,300 382,167 Total shareholders’ equity 42,800 35,786 28,002 25,079 21,632 Common share data (in millions, except per share amounts) Earnings per common share   Basic $    26.34 $   20.93 $   11.73 $    9.30 $    6.15   Diluted 24.73 19.69 11.21 8.92 5.87 Dividends declared and paid per common share 1.40 1.30 1.00 1.00 0.74 Book value per common share (1) 90.43 72.62 57.02 50.77 43.60 Average common shares outstanding   Basic 433.0 449.0 478.1 489.5 488.4   Diluted 461.2 477.4 500.2 510.5 511.9 Selected data (unaudited) Employees   United States 17,383 15,477 14,466 13,846 13,189   Non-U.S. 13,139 10,990 9,157 7,890 7,170 Total employees 30,522 26,467 23,623 21,736 20,359 Assets under management (in billions) (2) Asset class   Alternative investments (3) $      151 $    145 $    110 $     95 $     68   Equity 255 215 167 133 104   Fixed income 256 198 154 134 112 Total non-money market assets 662 558 431 362 284 Money markets 206 118 101 90 89 Total assets under management $      868 $    676 $    532 $    452 $    373 (1) Book value per common share is based on common shares outstanding, including restricted stock units granted to employees with no future service requirements, of 439.0 million, 450.1 million, 460.4 million, 494.0 million and 496.1 million as of November 2007, November 2006, November 2005, November 2004 and November 2003, respectively. (2) Substantially all assets under management are valued as of calendar month-end. (3) Primarily includes hedge funds, private equity, real estate, currencies, commodities and asset allocation strategies. 139Goldman Sachs 2007 Annual Report
  • 142.
    Board Members, Officersand Directors Board of Directors Lloyd C. Blankfein Chairman and Chief Executive Officer Jon Winkelried President and Co-Chief Operating Officer Gary D. Cohn President and Co-Chief Operating Officer John H. Bryan Retired Chairman and Chief Executive Officer of Sara Lee Corporation Claes Dahlbäck Senior Advisor to Investor AB and Foundation Asset Management Stephen Friedman Chairman of Stone Point Capital William W. George Professor at Harvard Business School and Former Chairman and Chief Executive Officer of Medtronic, Inc. Rajat K. Gupta Senior Partner Emeritus of McKinsey Company James A. Johnson Vice Chairman of Perseus, L.L.C. Lois D. Juliber Former Vice Chairman and Chief Operating Officer of Colgate-Palmolive Company Edward M. Liddy Chairman of The Allstate Corporation Ruth J. Simmons President of Brown University John F.W. Rogers Secretary to the Board Managing Directors Lloyd C. Blankfein Howard A. Silverstein Kevin W. Kennedy* Thomas E. Tuft John P. Curtin, Jr. Frank L. Coulson, Jr. Richard A. Friedman Joseph H. Gleberman Timothy J. O’Neill John J. Powers Jon Winkelried Gregory K. Palm Masanori Mochida Gene T. Sykes David A. Viniar John S. Weinberg Sharmin Mossavar-Rahmani Armen A. Avanessians Gary D. Cohn Christopher A. Cole Henry Cornell J. Michael Evans Peter S. Kraus Robert Litterman Michael S. Sherwood Esta E. Stecher Byron D. Trott Tracy R. Wolstencroft* Terence J. O’Neill E. Gerald Corrigan Milton R. Berlinski Jean-Luc Biamonti Thomas C. Brasco Peter D. Brundage Andrew A. Chisholm Abby Joseph Cohen* Frank T. Connor Randolph L. Cowen* Philip M. Darivoff Glenn P. Earle Charles P. Eve Edward C. Forst Christopher G. French C. Douglas Fuge Richard J. Gnodde Jeffrey B. Goldenberg David B. Heller Timothy J. Ingrassia Robert C. Jones Bruce M. Larson Gwen R. Libstag Victor M. Lopez-Balboa Sanjeev K. Mehra Richard T. Ong Management Committee Lloyd C. Blankfein Chairman and Chief Executive Officer Jon Winkelried President and Co-Chief Operating Officer Gary D. Cohn President and Co-Chief Operating Officer John S. Weinberg Vice Chairman Christopher A. Cole J. Michael Evans Edward C. Forst Richard A. Friedman Richard J. Gnodde Kevin W. Kennedy Peter S. Kraus Masanori Mochida John F.W. Rogers Michael S. Sherwood David M. Solomon David A. Viniar Gregory K. Palm Esta E. Stecher General Counsels Alan M. Cohen Head of Global Compliance Sanjay H. Patel Stuart M. Rothenberg* Richard M. Ruzika* Muneer A. Satter Howard B. Schiller John P. Shaughnessy Theodore T. Sotir Marc A. Spilker Mark R. Tercek Susan A. Willetts* W. Thomas York, Jr.* Philippe J. Altuzarra Jonathan A. Beinner Andrew S. Berman James J. Birch David R. Boles Charles W.A. Bott Steven M. Bunson George H. Butcher III Laura C. Conigliaro John W. Curtis Matthew S. Darnall Alexander C. Dibelius Karlo J. Duvnjak Isabelle Ealet Elizabeth C. Fascitelli Laurie R. Ferber Oliver L. Frankel H. John Gilbertson, Jr. Douglas C. Grip Celeste A. Guth Gregory T. Hoogkamp William L. Jacob III Andrew J. Kaiser Robert C. King, Jr. Mitchell J. Lieberman Josephine Linden Francisco Lopez-Balboa Antigone Loudiadis John A. Mahoney Charles G.R. Manby David J. Mastrocola Theresa E. McCabe Stephen J. McGuinness J. William McMahon Audrey A. McNiff Wayne L. Moore Donald J. Mulvihill Stephen R. Pierce John J. Rafter Charlotte P. Ransom John F.W. Rogers J. Michael Sanders Victor R. Simone, Jr. *Partnership Committee Member 140 Goldman Sachs 2007 Annual Report
  • 143.
    Board Members, Officersand Directors Michael M. Smith Jonathan S. Sobel Michael A. Troy Kaysie P. Uniacke Haruko Watanuki Todd A. Williams Paolo Zannoni Yoel Zaoui* Joan H. Zief Kendrick R. Wilson III Peter C. Aberg Frances R. Bermanzohn Robert A. Berry Craig W. Broderick Richard M. Campbell-Breeden Anthony H. Carpet Michael J. Carr Kent A. Clark Timothy J. Cole Edith W. Cooper* John S. Daly Juan A. Del Rivero Simon P. Dingemans Jana Hale Doty Gordon E. Dyal Michael P. Esposito Steven M. Feldman Stephen C. Fitzgerald* Matthew T. Fremont-Smith Andrew M. Gordon David J. Greenwald* Roger C. Harper Maykin Ho Timothy E. Hodgson Christopher G. Hogg Robert D. Hormats James A. Hudis Colin E. King David J. Kostin Koji Kotaka Paulo C. Leme Hughes B. Lepic Robert J. Markwick Kathy M. Matsui Richard F.X. McArdle Geraldine F. McManus James E. Milligan Yukihiro Moroe Jeffrey M. Moslow Michael J. Poulter Dioscoro-Roy I. Ramos Joseph Ravitch Pamela P. Root Jacob D. Rosengarten Ronald S. Levin Kathleen M. Maloney Robert S. Mancini Richard P. McNeil Michael R. Miele Suok J. Noh Geoffrey M. Parker David B. Philip Ellen R. Porges Richard H. Powers Kevin A. Quinn Ivan Ross Katsunori Sago* Pablo J. Salame* Jeffrey W. Schroeder Harvey M. Schwartz* Karen D. Seitz Ravi M. Singh Trevor A. Smith Daniel L. Sparks Shahriar Tadjbakhsh Donald J. Truesdale John S. Willian Kenneth W. Willman Andrew F. Wilson Paul M. Young Thomas J. Kenny Jack Levy Mark F. Dehnert Michael H. Siegel Matthew C. Westerman* Jason H. Ekaireb Antonio Borges Seaborn S. Eastland William C. Montgomery Stephen P. Hickey Yusuf A. Aliredha John A. Ashdown William A. Badia Christopher M. Barter John D. Bertuzzi Elizabeth E. Beshel Alan J. Brazil Melissa R. Brown Amy L. Chasen W. Reed Chisholm II Jane P. Chwick Peter H. Comisar Brahm S. Cramer Nicholas P. Crapp Michael D. Daffey Jean A. De Pourtales Joseph P. DiSabato Suzanne O. Donohoe* Paul M. Russo Gary B. Schermerhorn Steven M. Scopellite Ravi Sinha Edward M. Siskind Sarah E. Smith* Steven H. Strongin* Patrick Sullivan Daisuke Toki John J. Vaske Hsueh Ming Wang David M. Weil Tetsufumi Yamakawa R. Douglas Henderson Eileen Rominger Michael S. Wishart David M. Solomon Karen R. Cook Gregory A. Agran Raanan A. Agus Dean C. Backer* Stuart N. Bernstein Alison L. Bott Mary D. Byron Mark M. Carhart Thomas G. Connolly Michael G. De Lathauwer James Del Favero Martin R. Devenish Michele I. Docharty Thomas M. Dowling Brian J. Duffy Edward K. Eisler Jeffrey F. Fastov James A. Fitzpatrick Lorenzo Grabau Peter W. Grieve Keith L. Hayes Bruce A. Heyman Joanne M. Hill Daniel E. Holland III Teresa E. Holliday Michael R. Housden Paul J. Huchro Edith A. Hunt Toni-Dara Infante Raymond J. Iwanowski Andrew J. Jonas David K. Kaugher Lawrence S. Keusch Timothy M. Kingston John J. Lauto Matthew Lavicka David N. Lawrence James H. Donovan Donald J. Duet Michael L. Dweck Gregory H. Ekizian Earl S. Enzer Christopher H. Eoyang Norman Feit Robert K. Frumkes Richard A. Genna Robert R. Gheewalla Gary T. Giglio Pedro Gonzalez Grau Michael J. Graziano Peter Gross Douglas C. Heidt Peter C. Herbert Kenneth W. Hitchner Peter Hollmann Philip Holzer Zu Liu Frederick Hu* Walter A. Jackson Andrew R. Jessop Peter T. Johnston Roy R. Joseph James C. Katzman Carsten Kengeter Gioia M. Kennett Shigeki Kiritani Gregory D. Lee Todd W. Leland Johan H. Leven George C. Liberopoulos Anthony W. Ling Bonnie S. Litt Joseph Longo Peter B. MacDonald Mark G. Machin John V. Mallory Blake W. Mather John J. McCabe James A. McNamara Robert A. McTamaney Leslie S. Nelson Fergal J. O’Driscoll L. Peter O’Hagan Taneki Ono Nigel M. O’Sullivan James R. Paradise Arthur J. Peponis B. Andrew Rabin Philip A. Raper Michael J. Richman Michael S. Rotter Thomas M. Schwartz *Partnership Committee Member 141Goldman Sachs 2007 Annual Report
  • 144.
    Board Members, Officersand Directors Lisa M. Shalett David G. Shell Ralph J. Silva David T. Simons Johannes R. Sulzberger Richard J. Sussman Caroline H. Taylor Peter K. Tomozawa Eiji Ueda Lucas van Praag Ashok Varadhan Casper W. Von Koskull Gregg S. Weinstein Scott R. Weinstein Martin M. Werner C. Howard Wietschner Kurt D. Winkelmann Wassim G. Younan Brian Duggan Nicholas G. Giordano Donald W. Himpele James H. Rogan Gary J. Sveva Christopher P. Sullivan Ruud G. Hendriks Harry Silver William J. Young Donald R. Mullen* Alison J. Mass James A. Jacobson, Jr. Ben I. Adler Ignacio Alvarez-Rendueles Lori B. Appelbaum Philip S. Armstrong William J. Bannon Scott B. Barringer Steven M. Barry Jordan M. Bender Paul D. Bernard George M. Brady Joseph M. Busuttil Jin Yong Cai Valentino D. Carlotti Eduardo Centola James B. Clark Linda S. Daines Stephen Davies Oral W. Dawe Diego De Giorgi Daniel L. Dees Kenneth M. Eberts, III Luca D. Ferrari David A. Fishman Alexander W. Fletcher Abraham Shua Jeffrey S. Sloan John E. Smollen Raymond B. Strong, III Nicolas F. Tiffou David H. Voon John E. Waldron Robert P. Wall Michael W. Warren David D. Wildermuth Kevin L. Willens Jon A. Woodruff William M. Wicker Edward R. Wilkinson Timothy H. Moe Akio Asuke Matthew H. Cyzer Phillip S. Hylander Larry M. Kellerman Gene Reilly Hilary E. Ackermann Jeffrey D. Adams Elizabeth D. Anderson Charles Baillie Bernardo Bailo Stacy Bash-Polley Driss Ben-Brahim Susan M. Benz Johannes M. Boomaars J. Theodore Borter Timothy J. Bridges David D. Buckley Nicholas F. Burgin Gerald J. Cardinale Lik Shuen David Chan Thomas V. Cholnoky Colin Coleman Kenneth W. Coquillette Michael J. Crinieri Craig W. Crossman Jeffrey R. Currie Stephen D. Daniel Giorgio De Santis Bradley S. DeFoor Alvaro del Castano Robert K. Ehudin Kathy G. Elsesser Peter C. Enns Katherine B. Enquist James P. Esposito Douglas L. Feagin Gail S. Fierstein Pierre-Henri Flamand Timothy T. Furey Orit P. Freedman Enrico S. Gaglioti James R. Garvey Gregg A. Gonsalves Larry J. Goodwin Stefan Green David J. Grounsell Mary L. Harmon Valerie J. Harrison Rumiko Hasegawa Edward A. Hazel Melina E. Higgins Margaret J. Holen Sean C. Hoover Robert F. Incorvaia Kenneth L. Josselyn Toshinobu Kasai Eric S. Lane Gregg R. Lemkau Ryan D. Limaye Jill E. Lohrfink Christopher J. Magarro Allan S. Marson Robert A. Mass George N. Mattson Ian R. McCormick Gerald C. McNamara, Jr. Stuart G. McPherson Lance P. Meaney Bernard A. Mensah Julian R. Metherell Masatoki J. Mitsumata J. Ronald Morgan, III James P. Morris Rie Murayama Mark J. Naylor Jeffrey P. Nedelman Gavin G. O’Connor Todd G. Owens Fumiko Ozawa Helen Paleno Archie W. Parnell Todd J. Phillips Anthony J. Principato Alan M. Rapfogel Sara E. Recktenwald Jeffrey A. Resnick Thomas S. Riggs, III Normann G. Roesch David C. Ryan David M. Ryan James E. Sawtell Susan J. Scher Stephen M. Scherr Gonzalo R. Garcia Justin G. Gmelich Eldridge F. Gray Michael J. Grimaldi Benoit Herault Axel Hoerger Simon N. Holden Shin Horie Adrian M. Jones Alan S. Kava J. Christopher A. Kojima Kazuaki Kojima Takahiro Komatsu Simon M. Lamb Rudolf N. Lang Brian J. Lee George C. Lee Tim Leissner Allan S. Levine Brian T. Levine Lisette M. Lieberman Terence Tayseop Lim Paula B. Madoff Puneet Malhi Simon I. Mansfield Naomi Matsuoka Matthew B. McLennan Bruce H. Mendelsohn Michael J. Millette Milton R. Millman Philip J. Moffitt Simon P. Morris Thomas C. Morrow Marc O. Nachmann Erik F. Nielsen James B. Otness Steven M. Pinkos Andrew F. Pyne William M. Quinn Jean Raby Richard J. Revell Kirk L. Rimer David J. Rosenblum Marc A. Rothenberg Matthew L. Schroeder Peter A. Seibold Daniel M. Shefter David A. Shiffman Guy C. Slimmon Claudia Spiess Joseph F. Squeri Christoph W. Stanger Chase O. Stevenson Richard J. Stingi *Partnership Committee Member 142 Goldman Sachs 2007 Annual Report
  • 145.
    Board Members, Officersand Directors Roland W. Tegeder Robin A. Vince Andrea A. Vittorelli Theodore T. Wang Elisha Wiesel Neil J. Wright Denise A. Wyllie Yi Kevin Zhang Marina L. Roesler Howard Q. Spooner Sanaz Zaimi Sheila H. Patel William M. Roberts William Lee Hemphill Thomas V. Conigliaro Olusegun O. Aganga Mark E. Agne Thomas K. Amster Anton J. Arriola Gareth W. Bater Marjorie Boliscar Oliver R. Bolitho Sally A. Boyle Lester R. Brafman Cynthia A. Brower Randall S. Burkert Philippe L. Camu John W. Cembrook Robert J. Ceremsak James R. Cielinski William J. Conley, Jr. Colin J. Corgan Thomas W. Cornacchia Frederick C. Darling David H. Dase François-Xavier de Mallmann L. Brooks Entwistle Gregory A. Finck Mark B. Florian Timothy B. Flynn Elisabeth Fontenelli Elizabeth J. Ford Colleen A. Foster Linda M. Fox Kieu L. Frisby Timur F. Galen Rachel C. Golder Kevin J. Guidotti Vishal Gupta Elizabeth M. Hammack Kuniyoshi Hayashi Kenneth L. Hirsch Robert Howard Mark Howard-Johnson Shinichi Yokote Peter J. Zangari Alan M. Cohen Michiel P. Lap Jane Hargreaves Peter E. Scialla Helena Koo Dhruv Narain Takushi Abe Reinhard B. Koester Peter F. Spies Stefan R. Bollinger Linnea K. Conrad Gregory B. Carey Paul R. Aaron Koichiro Abe Andrew W. Alford Fareed T. Ali William D. Anderson, Jr. Yoshio Ando Rachel Ascher Dolores S. Bamford Benjamin C. Barber Slim C. Bentami Leslie A. Biddle Susan G. Bowers Christoph M. Brand Michael J. Brandmeyer Andrew I. Braun Anne F. Brennan Patrick T. Briody Adam J. Brooks Jason M. Brown Nancy D. Browne Elizabeth M. Burban Anthony Cammarata, Jr. David C. Carlebach Donald J. Casturo James R. Charnley Martin Cher Elena Ciallie Matthew J. Clark Scott Coleman Ann S. Costello Elizabeth Cottam Jeffrey F. Daly Debora J. Daskivich Michael C. Dawley Ahmad B. Deek Karl M. Devine Jamal Dhanani Aidan P. Dunn Laurent M. Dupeyron William J. Elliott Zubin P. Irani Kevin M. Jordan James P. Kenney Steven E. Kent Yasuro K. Koizumi Robert A. Koort Tak Sing Kenneth Kwok Brian J. Lahey Jonathan A. Langer Hugh J. Lawson Cham Chung Ken Lee Ronald Lee Deborah R. Leone Thomas R. Lynch Peter J. Lyon Aadarsh K. Malde Alexander M. Marshall Thomas H. Mattox James P. McCarthy Dermot W. McDonogh Olivier F. Meyohas Scott E. Molin Arjun N. Murti Craig J. Nossel Peter C. Oppenheimer Lisa L. Parisi John M. Perlowski Carol V. Pledger Gilberto Pozzi Krishna S. Rao Louisa G. Ritter Lisa A. Rotenberg Pamela S. Ryan Josephine Scesney Clare R. Scherrer Vivian C. Schneck-Last John A. Sebastian Peter A. Seccia Peter D. Selman Heather K. Shemilt Kunihiko Shiohara Gavin Simms Alec P. Stais Laurence Stein Patrick M. Street Morgan C. Sze Thomas D. Teles Frederick Towfigh Greg A. Tusar Philip J. Venables Alejandro Vollbrechthausen Eileen M. White Deborah B. Wilkens Samuel J. Wisnia Mark Evans William J. Fallon Matthew J. Fassler Nigel K. Faulkner Jose M. Fernandez Wolfgang Fink Silverio Foresi Dino Fusco James R. Garman Kevin S. Gasvoda Paul E. Germain Sarah J. Gray Jason R. Haas Edward G. Hadden Thomas E. Halverson Eric I. Hamou Jan Hatzius Jens D. Hofmann Laura A. Holleman Dane E. Holmes Leo Z. Huang Robyn A. Huffman Alastair J. Hunt Leonid Ioffe David L. Jasper Pernille D. Jensen Arihiro Kanda Shafiq A. Karmali Steffen J. Kastner Stuart A. Katz Poir-Mok Kee Christopher M. Keogh Bjorn P. Killmer Peter Kimpel Scott G. Kolar Annette L. Krassner Gregory Kuppenheimer Linda A. LaGorga Harvey Chi Chung Lee Joseph B. Lee Eugene H. Leouzon Wayne M. Leslie Kemp J. Lewis John S. Lindfors Iain Lindsay Michael C. Liou Hugo P. MacNeill Arline Mann Andrew A. McEachern Christopher D. McFadden Kevin T. McGuire Thomas J. McLaughlin Avinash Mehrotra Jonathan M. Meltzer 143Goldman Sachs 2007 Annual Report
  • 146.
    Board Members, Officersand Directors Christopher Milner Elizabeth A. Mily Christina P. Minnis Cheri S. Mowrey Davison Yumiko Murakami Kenichi Nagasu Tetsuo Naraha Massimiliano Nardulli Kiele E. Neas Ted K. Neely II Michael L. November Toru Okabe Timothy J. O’Reilly Konstantinos N. Pantazopoulos Bryant C. Park Alfredo J. Pastro Robert D. Patch Bruce B. Petersen Cameron P. Poetzscher Kenneth A. Pontarelli Vijay C. Popat Lora J. Price Lorin P. Radtke Deepak K. Rao Buckley T. Ratchford Luigi G. Rizzo J. Timothy Romer Howard M. Rowe Robert W. Savage John R. Sawtell Alexander Schrantz Paul D. Scialla Lewis M. Segal Harvey S. Shapiro Mark D. Shattan Adam Sherman Keith A. Shultis Suhail A. Sikhtian Norborne G. Smith III Ying Ying Glenda So David Z. Solomon Robert C. Spofford Joseph J. Struzziery III Randolph A. Stuzin Damian E. Sutcliffe Robert J. Sweeney Yozo Tachibana Adam L. Taetle Pawan Tewari J. David Tracy Terrence P. Travis Damian J. Valentino Paul Walker Alan S. Waxman Andrew C. Bound Patricia L. Bowden John E. Bowman III Oonagh T. Bradley Samuel S. Britton Russell A. Broome Torrey J. Browder Derek T. Brown Samantha R. Brown Steve M. Bunkin Mark J. Buono Charles E. Burrows Shawn P. Byron Jason G. Cahilly Marguarite A. Carmody Stuart A. Cash Christopher L. Castello Nien Tze Elizabeth Chen Chul Chung Denis P. Coleman III Kevin P. Connors Richard N. Cormack James V. Covello Christian P. de Haaij Mark E. DeNatale Olaf Diaz-Pintado Albert F. Dombrowski Katinka I. Domotorffy Keith Douglas Daniel A. Dreyfus Kirsten A. Dzialga Henrik G. Ehrnrooth David P. Eisman Carl Faker Stephan J. Feldgoise Patrick J. Fels Benjamin W. Ferguson Samuel W. Finkelstein Peter E. Finn Yuji Fujimori Sean J. Gallagher Ivan C. Gallegos Rivas James P. Ganley Francesco U. Garzarelli Basil P. Geoghegan Michelle Gill Alicia K. Glen James Gomez Francisco X. Gonzalez Jason A. Gottlieb Maria M. Grant Christoph Gugelmann John D. Haase Mark K. Hancock Nicholas H. Weber Dominic A. Wilson Gavin E. Wilson Steve Windsor Martin Wiwen-Nilsson Yoshihiko Yano Pei Pei Yu Mark R. Beveridge Xing Zhang Hector E. Negroni R. Martin Chavez William T. Howard, Jr. Mark Perwien Atosa Moini Edward Madara III Stephen J. O’Flaherty Court E. Golumbic Alasdair J. Warren Douglas Borden Yoshiyuki Hoshino Howard Fisher Ian Gilday Dorothee Blessing Amar Kuchinad Marshall Smith Robert K. Jacobsen Charles F. Adams John Chrysikopoulos Richard A. Kimball, Jr. Kent D. Daniel Min Hee Kim Salvatore Di Stasi Nancy Gloor Guy M. du Parc Braham James C. Wardlaw Vincent Duhamel Thomas J. Stein Farid Pasha Asif M. Adatia Nick S. Advani Sang Gyun Ahn Analisa M. Allen Mark A. Allen Ichiro Amano Andrea Anselmetti Lori H. Arndt Akihiko Asami Jeffrey D. Barnett Stephanie K. Bell-Rose Tracey E. Benford Gaurav Bhandari Marc O. Boheim Vivek Bohra Ralane F. Bonn Martin Hintze Todd Hohman James P. Houghton Bradley Hunt Christopher E. Hussey Etsuko Kanayama Hiroyuki Kaneda Maria Karahalis Dimitrios Kavvathas C. Annette Kelton Scott E. Kilgallen John J. Kim James A. King Hideki Kinuhata Michael E. Koester John N. Kolz Christopher P. Lalli Lori A. Lancaster Roy I. Lapidus Geoffrey C. Lee Laurent Lellouche Jesse H. Lentchner John R. Levene Bradford S. Levy Terence M. Lim Hao Cheng Liu Lindsay P. LoBue Joseph W. Macaione Ian W. MacLeod David M. Marcinek Marvin Markus Roger C. Matthews, Jr. Thomas F. Matthias F. Scott McDermott John J. McGuire, Jr. Sean T. McHugh Carolina Minio-Paluello James G. Mitchell David R. Mittelbusher Bryan P. Mix Timothy A. Morgan Junko Mori Takashi Murata Massoud Mussavian Amol S. Naik Basant Nanda Michael T. Nartey Chiang-Ling Ng Junya Nishiwaki Masatomo Odagawa Tosa Ogbomo Mitsunari Okamoto Husnu H. Okvuran San W. Orr III 144 Goldman Sachs 2007 Annual Report
  • 147.
    Board Members, Officersand Directors Peter J. Ort Jennifer A. Padovani Fred B. Parish, Jr. Martin A. Pennay Nicholas W. Phillips Louis Piliego Michelle H. Pinggera M. Louise Pitt James F. Radecki Richard N. Ramsden Shlomi Raz Carl J. Reed Andrew D. Richard Scott A. Romanoff Michael J. Rost David T. Rusoff Ankur A. Sahu Guy E. Saidenberg Julian C. Salisbury Brian J. Saluzzo David A. Schwimmer David D. Seeberan Nobuhiko Seki Rebecca M. Shaghalian Magid N. Shenouda Hiroyuki Shimizu Julian F. Simon Michael L. Simpson Barry Sklar Jeremy S. Sloan Jeffrey E. Sockwell Mark R. Sorrell John D. Storey Jonathan W. Summers Ram K. Sundaram Tatsuya Suzuki Michael J. Swenson Joseph D. Swift Henry Seiichi Takata Jasper Tans Eric N. Tavel Cory W. Thackeray Klaus B. Toft Jeffrey M. Tomasi David G. Torrible Naoki Toyoizumi John H. Tribolati Suzette M. Unger Leo J. Van Der Linden Lai Kun Judy Vas Chau Simone Verri Paul E. Vigilante Toby C. Watson Andrew J. Weisz Gail Kreitman Enrique Del Rio Iain N. Drayton Fadi Abuali Kevin L. Adams Elif A. Aktug Christian S. Alexander David Z. Alter Vincent L. Amatulli Rajesh Amin Koral Anderson Stephen Arnold Kulbir S. Arora Omar M. Asali Ramaz A. Ashurov Paul E. Bachman Andrew J. Bagley Mustafa Bagriacik Susan E. Balogh Jennifer A. Barbetta Ali K. Bastani Gerard M. Beatty Henry Becker, Jr. Roger S. Begelman Oliver B. Benkert Avanish R. Bhavsar Joshua S. Birnbaum Christopher E. Blume Shane M. Bolton Peter V. Bonanno William C. Bousquette, Jr. Patrick T. Boyle Stephen Branton-Speak Simon A. Bregazzi Emmanuel Bresson Benjamin R. Broadbent Janet A. Broeckel William E. Burgess Trevor R. Busche Richard J. Butland Jon Butler Joseph A. Camarda Roy E. Campbell II John H. Chartres Martin E. Chavez Henry L. Chen Hong Lum Julian Cheong Alex S. Chi Steven N. Cho Han Ching Choong Gary W. Chropuvka Teresa Clarke Ellis Jesse H. Cole Brian M. Coleman Teresa M. Wilkinson Oliver C. Will Joel M. Wine Andrew E. Wolff Jennifer O. Youde Thomas G. Young Han Song Zhu Lauren J. Zucker Hidehiro Imatsu Wei Zhu Edin Buturovic Pekka I. Soininen Steven A. Mayer Kenneth N. Murphy Mitsuo Kojima Michael T. Smith Thomas G. Fruge Kenichiro Yoshida Clifford D. Schlesinger Krishnamurthy Sudarshan Paul A. Bartlett Maziar Minovi Steven Ricciardi Heather Arnold Tuan Lam Saad Ashraf James W. Kilman Todd E. Eagle Jess T. Fardella Simone Russo Robin Rousseau Kristin F. Gannon Charles W. Lockyer Adam S. Clayton Christian A. Katz Stefan Dorfmeister James H. Sprayregen Jonathan M. Penkin Mark R. Etherington Laurent Bouaziz Craig W. Packer David A. George Michael Rimland Keith Ackerman Jeff Abt Kevin A. Lockhart Carlos Pertejo Reza Ali Dojin Kim Massimo Della Ragione Lachlan Edwards Vesna Nevistic Rene Mottas Chang-Po Yang Cyril Cottu Timothy Craighead Joshua C. Critchley Vijay B. Culas Giovanni Cutaia Kyle R. Czepiel Manda J. D’Agata Sven Dahlmeyer John F. Daly Rajeev R. Das Michael J. Daum Alexander Davidovich Nicola A. Davies Philip J. Davies Tracy DeBlieck Craig M. Delizia Stacey Ann DeMatteis Michael Dinias Christina Drews Vance M. Duigan Steven T. Elia Harry Eliades Suzanne Escousse Steven A. Ferjentsik Carlos Fernandez-Aller Gregory C. Ferrero Sarah J. Friar David A. Friedland John J. Gauthier Elizabeth Gilbert Masaki Gobayashi John H. Godfrey Irwin Goldberg Billy Goldstein Juan D. Gomez-Villalba Maria V. Gordon Roberta M. Goss Paul Graves Philip W. Grovit Jonathan J. Hall Dylan S. Halterlein Greger C. Hamilton Magnus C. Hardeberg Norman A. Hardie Kandace K. Heck Ali G. Hedayat Joanna Hislop Ryan H. Holsheimer Harold P. Hope III Gregory P. Hopper Ericka T. Horan Joanne Howard Alison J. Howe Stephanie Hui 145Goldman Sachs 2007 Annual Report
  • 148.
    Board Members, Officersand Directors Paul Humphreys Irfan S. Hussain Kota Igarashi Tsuyoshi Inoue Katsuhiro Ishikawa Makoto Ito Kathleen Jack Matthew A. Jaume Tanweer Kabir Christian Kames Raymond W. Kamrath Afwa D. Kandawire Nicola S. Kane Henry Wen-Herng King Andrew J. Kleeger Herman R. Klein Wassink Edward C. Knight Akiko Koda Ravi G. Krishnan Jorg H. Kukies Shiv Kumar Svetlana Kurilova Edwin Wing-Tang Kwok David W. Lang Nyron Z. Latif Wai-Yen Vivian Lau Matthew D. Leavitt David A. Lehman James E. Levine Leland Lim Alexander G. Loosley David B. Ludwig John H. Ma Aedan M. MacGreevy Raghav Maliah Matthew F. Mallgrave Edith Mandel Karim H. Manji Scott D. Marchakitus Fabio N. Mariani Ramnek S. Matharu Shogo Matsuzawa Thomas C. Mazarakis Patrick S. McClymont Graeme E. McEvoy John E. McGarry Shane McKenna Penny A. McSpadden Celine-Marie G. Mechain Justin E. Metz Takashi Mikkaichi Simon H. Moseley William E. Muecke Jeff Mullen Timothy H. Thornton Oliver Thym Ingrid C. Tierens Nadia Titarchuk Joseph K. Todd Mark R. Tolette Hiroyuki Tomokiyo Jill L. Toporek David Townshend Patrick M. Tribolet Richard J. Tufft Michael S. Turok Klaus Umek Toshihiko Umetani John P. Underwood Thomas S. Vandever Richard C. Vanecek Sebastian Varga von Kibed Massimiliano Veneziani Kurt J. Von Holzhausen Nicholas H. von Moltke Daniel Wainstein Timothy D. Walding Fred Waldman Kevin A. Walker Daniel S. Weiner Owen O. West Alan S. Wilmit David T. Wilson Edward C. Wilson Donna A. Winston Carinne S. Withey Christopher D. Woolley Brendan Wootten David Tien-Wei Wu John M. Yae Haitao Zhai Richard K. Lyons Salvatore T. Lentini Ruibin Meng Gregg J. Felton David N. Frechette Will E. Matthews Brendan M. McGovern Shigemitsu Sugisaki Takashi Yoshimura James M. Li Justin J. Pascoe Drake Pike Joseph D. Stecher James W. Wight Alexander Dubitsky Xuan Karen Fang David K. Cheung Yoshie Naumann Edward T. Naylor Scott R. Norby Graham H. Officer Hideyuki Fred Omokawa Maire M. O’Neill Lisa Opoku Gerald B. Ouderkirk III Martin C. Pankau Charles L. Park Jae Hyuk Park Francesco Pascuzzi Barend M. Pennings Zara Pratley Curtis S. Probst Lisa Rabbe Jeffrey Rabinowitz Lawrence J. Restieri, Jr. Lloyd S. Reynolds Samuel D. Robinson Philippa A. Rogers Michael E. Ronen Adam C. Rosenberg Wendy E. Sacks Ricardo Salaman Thierry Sancier David J. Santina Kara Saxon Ian M. Schmidek Paul E. Schurman Steven M. Schwartz Stephen B. Scobie Devesh P. Shah Judith L. Shandling Adrianne W. Shapira Graham P. Shaw Hazem A. Shawki Steven R. Sher Justin W. Slatky Radford Small Ian G. Smith Ramsey D. Smith Robert A. Sorrell Raghu Srinivasan Kevin M. Sterling Robert M. Suss J. Richard Suth Yusuke Takahashi Daiki Takayama Tin Hsien Tan Renaud Tartanson Megan M. Taylor Richard J. Taylor Maria Teresa Tejada Douglas R. Manchester Matthew C. Schwab Stephen Graham Khaled Eldabag Leonard Brooks III Keith Tuffley Nobuaki Miyatake Julie A. Harris Takeshi Yamamoto William L. Blais Alla Gil Michael S. Swell Sarakorn Gerjarusak Tamim H. Al-Kawari John C. Shaffer Timothy F. Vincent Ana C. Cabral Ronald S. Kent Damien Liebaut William F. Spoor Erich Bluhm David G. McDonald Ezra Nahum Dina H. Powell Anthony Gutman Steve Sang Yong Park Peter C. Russell Celeste J. Tambaro Michael M. Furth James P. Kelly Andrew Wilkinson Eric M. Kirsch Gregory P. Lee Alexis Maged Peter Scaturro Wai Cheong Shum Randall L.J. Yasny Jason B. Mollin Robert M. Pulford Osamu Nakajima Linda Koster Paul A. Craven Filippo Cartiglia Miriam T. Esteve Maximillian C. Justicz Adriano C. Piccinin John G. Bruno Patrick Tassin de Nonneville Gabriel Perahia Diego E. Ferro David M. Inggs Kenneth J. Newcombe James M. Karp Shirish B. Godbole 146 Goldman Sachs 2007 Annual Report
  • 149.
    Board Members, Officersand Directors Chetan Bhandari Edward B. Droesch Timothy J. Talkington Daniel J. Bingham Sergei S. Stankovski Jonathan R. Symonds Kyu Sang Cho Ji Hyung Lee Robert Son Andre H. du Plessis Gerald Messier Steven Tulip David R. Cukierman Konstantinos Skouras Clark B. Winter Andrea Vella Serge Marquie Clarke D. Adams Matthew A. Grayson Karl J. Robijns Jeff R. Stolz Timothy Callahan Markus L. Aakko Yotaro Agari Julian C. Allen Joanne L. Alma Nicholas Alston Quentin Andre Alexandra J. Anido Sergei Arsenyev Aaron M. Arth George Assaly Arun J. Assumall Victoria J. Attwood Scott Jean-Baptiste Aussourd Ian T. Bailey Vivek J. Bantwal Michael H. Bartsch Philip G. Beatty Caroline R. Benton Philip R. Berlinski Neeti Bhalla Brian W. Bolster Timothy J. Bowler Sharon A. Bradley Lawrence S. Brandman C. Kane Brenan Kristin L. Breuss Michael J. Buchanan Donna Burns Stephen P. Byrne, Jr. Roberto Caccia Francesco Cafagna Michael A. Cagnassola Jean-Christophe Germani Donald G. Gervais, Jr. Tamilla F. Ghodsi Brad D. Gillman Federico J. Gilly Marc C. Gilly John L. Glover III David J. Goldburg Melissa Goldman Edward J. Goldthorpe Mark R. Gordon Richard C. Govers Bennett Grau Bradley J. Gross Franz A. Hall Patrick P. Hargreaves Arni G. Hauksson Vicky M. Hayes Michael L. Hensch Steven P. Herrup Ning Hong Douglas Horlick Pierre Hudry Jonathan O. Hughes Yuji Ito Brian J. Jacoby Andrius Jankunas Dominique M. Jooris Rajiv K. Kamilla Brian A. Kane Hun Sok Kang Amna Karim Vijay M. Karnani Noriko Kawamura Dirk-Jan J. Keijer William P. Keirstead Shuya Kekke Prashant R. Khemka Vivien Khoo Tammy A. Kiely Jisuk Kim Lee Guan Kelvin Koh Masafumi Koike Tsui-Li Kok Qing Ying Kong Vanessa L. Koo Satoshi Kubo Lewis S. Kunkel Shane M. Lanoway Jan K. Laubjerg Eddie Siu Wah Law Edward J. Lawrence Kim M. Lazaroo Scott L. Lebovitz Alfredo A. Capote Christian H. Carl Jimmy R. Carlberg Glen T. Casey Chia-Lin Chang Christian Channell Westley D. Chapman Eva Chau Yves Checoury David Chou Thalia Chryssikou Charles J. Citro Michael J. Civitella Luke E. Clayton Ira H. Cohen Remi Colinmaire Kathleen A. Connolly John G. Creaton Cecile Crochu Gavin S. Da Cunha Lauren Dang Anne Marie B. Darling Paul S. Davies Andrew K. Davilman Bruno P. De Kegel Matthew P. DeFusco Daniel Deng Thomas Deng Jeffrey L. Dodge Jonathan G. Donne William P. Douglas Andrew J. Duke Mary L. Dupay Alessandro Dusi Mark S. Edwards Babak Eftekhari Jonathan M. Egol Akishige Eguchi Halil Emecen Andre Eriksson Kazunobu Ezawa Thomas D. Ferguson David P. Ferris Jonathan H. Fine David A. Fox Karen A. Frank Jay A. Friedman Timothy Gallagher Ramani Ganesh Maria Paola Garbarino Huntley Garriott Belinda S. Gaynor Maksim Gelfer Gabe E. Gelman Geoffery Y.A. Lee Edward T. Lees David A. Levy Xiang Li Jie Lian Hong Liang Dirk L. Lievens Dimitri Linde Philip G.W. Lindop Michael W. Linse David B. Lischer Stephen I. Lucas Patrick O. Luthi Rory A. MacFarquhar Whitney C. Magruder Suneil Mahindru Christoffer L. Malmer Monica M. Mandelli Richard M. Manley Nicole Martin Joseph S. Mauro Matthew D. McAskin Matthew B. McClure Christina M. McFarland Carolyn E. McGuire Grainne McNamara Joseph J. McNeila Sandeep Mehta Francesco Mele Jack Mendelson Xavier C. Menguy Lance M. Meyerowich Rodney B. Miller Jason Moo Karim Moussalem Grant R. Moyer Gersoni A. Munhoz Michael Nachmani Kazuya Nagasawa Kazuma Naito Rishi Nangalia Allison F. Nathan Dario Negri Emmanuel P. Niogret Chris Oberoi Dimitri Offengenden Jun Ohama Gregory G. Olafson Beverly L. O’Toole Daniel A. Ottensoser Edward S. Pallesen Yanis Papagiannis Dave S. Park Anthony W. Pasquariello 147Goldman Sachs 2007 Annual Report
  • 150.
    Board Members, Officersand Directors Jignesh Patel Sandeep H. Patel Nirubhan Pathmanabhan Mark A. Patterson Richard A. Peacock Vincent Shen Peng Antonio R. Pereira Peter J. Perrone James R. Peters Marco Piccioni James F. Powell Luis Puchol-Plaza Sumit Rajpal Padideh N. Raphael Peggy D. Rawitt Kathleen M. Redgate Donald C. Reed Mark G. Retik James H. Reynolds Sean D. Rice Robert E. Ritchie Scott M. Rofey Jeroen Rombouts Brice M. Rosenzweig Denis R. Roux Chiel Ruiter John M. Ruth Douglas L. Sacks Vikram P. Sahu Yann Samuelides Laura D. Sanchez Sunil Sanghai Luke A. Sarsfield III Andrei M. Saunders Richard A. Schafrann Oliver Schiller Martin A. Schneider Gabriel T. Schwartz Michael T. Seigne Konstantin A. Shakhnovich Richard Shannon Wenbo Shao Daniel A. Sharfman Song Shen Jonathan M. Sheridan James Roger Francis Shipton Faryar Shirzad Connie J. Shoemaker Anna K. Skoglund Andrew J. Smith Courtney B. Smith Ronny Soemitro Bing Song Jonathan E.H. Sorrell Rafael I. de Fex John M. Draghi Mary Pang Joseph M. Demarest Bertram N. Spence Ken Sugimoto James Kin Kong Sun Steve Sun Aurora J. Swithenbank Hidekazu Tani Carl H. Taniguchi Sulian M. Tay Mark J. Taylor Ryan J. Thall Robert B. Thompson Terence Ting Jacquelyn G. Titus Mark C. Toomey Kenneth A. Topping Pamela C. Torres Ronald Trichon, Jr. Kenro Tsutsumi Stellar K. Tucker Peter van der Goes, Jr. Damien R. Vanderwilt Ram S. Venkateswaran Vincenzo Volpe Gerard N. Von Dohlen, Jr. Christoph von Reiche Elizabeth S. Wahab Sherif J. Wahba John M. Wang Zhixue Josh Wang Michael L. Warren Haruko Watanabe Russell J. Watson Simon R. Watson Douglas C. Weaver Vivien Webb Wong Peter A. Weidman Karl D. Wianecki Rory L. Wilfork Gavin A. Wills Steven D. Winegar Kenneth Hong Kit Wong Stephen T.C. Wong Xin Xia Shunichi Yamada Kentaro Yamagishi Raymond L. Yin Ka Yan Wilfred Yiu Hisaaki Yokoo Hsin Yue Yong Sergei Zhiltsov George F. Travers Frank Richter Jack B. Navarro Vinit Sahni 148 Goldman Sachs 2007 Annual Report
  • 151.
    Directors, Advisors andOffices Advisory Directors George M. Ross Eric S. Dobkin Jonathan L. Cohen William C. Landreth Alan A. Shuch Robert E. Higgins Carlos A. Cordeiro Lawrence H. Linden Pieter Maarten Feenstra Timothy G. Freshwater Frederic E. Steck Mark Tracey Paul S. Efron Patrick J. Ward Matthew G. L’Heureux Anthony Lauto Hsueh Sung Robert J. Pace Peter D. Sutherland KCMG Chairman of Goldman Sachs International Board of International Advisors Ambassador Eduardo Aninat Dr. Thomas Bär Dr. Diethart Breipohl Efthymios Christodoulou Keki Dadiseth Charles de Croisset Guillermo de la Dehesa Vladimír Dlouhý Walter W. Driver Jr. Oscar Fanjul Jaime García-Parra Lord Griffiths of Fforestfach Professor Victor Halberstadt Professor Otmar Issing Dr. Gianni Letta Klaus Luft Jacques Mayoux Mario Monti Karel van Miert Dr. Ludolf v. Wartenberg Charles Curran, A.C. Ian Macfarlane, A.C. International Advisors to Goldman Sachs JBWere Senior Directors John C. Whitehead H. Frederick Krimendahl II George E. Doty Donald R. Gant James P. Gorter Robert B. Menschel Robert E. Mnuchin Sidney J. Weinberg, Jr. Thomas B. Walker, Jr. Richard L. Menschel Eugene Mercy, Jr. Stephen B. Kay Robert N. Downey Roy J. Zuckerberg Robert M. Conway David M. Silfen Eugene V. Fife Peter G. Sachs Willard J. Overlock, Jr. Mark O. Winkelman John R. Farmer Robert J. Katz Robin Neustein Robert S. Kaplan Robert Hurst Peter M. Sacerdote Suzanne M. Nora Johnson Eric S. Schwartz Offices Atlanta Auckland* Bangalore Bangkok Beijing Boston Buenos Aires Calgary Chicago Dallas Doha Dubai Dublin Frankfurt Geneva George Town Hong Kong Houston Jersey City Johannesburg London Los Angeles Madrid Melbourne* Mexico City Miami Milan Moscow Mumbai New York Paris Philadelphia Princeton Salt Lake City San Francisco São Paulo Seattle Seoul Shanghai Singapore Stockholm Sydney* Taipei Tampa Tel Aviv Tokyo Toronto Washington, D.C. Zurich *Goldman Sachs JBWere 149Goldman Sachs 2007 Annual Report
  • 152.
    Shareholder Information SEC Certifications Thecertifications by the Chief Executive Officer and the Chief Financial Officer of The Goldman Sachs Group, Inc., required under Section 302 of the Sarbanes-Oxley Act of 2002, have been filed as exhibits to the firm’s 2007 Annual Report on Form 10-K. NYSE Certification In April 2007, the Chief Executive Officer of The Goldman Sachs Group, Inc. made an unqualified certification to the NYSE with respect to the firm’s compliance with the NYSE corporate governance listing standards. Transfer Agent and Registrar for Common Stock Questions from registered shareholders of The Goldman Sachs Group, Inc. regarding lost or stolen stock certificates, dividends, changes of address and other issues related to registered share ownership should be addressed to: Mellon Investor Services LLC 480 Washington Boulevard Jersey City, New Jersey 07310 U.S. and Canada: 1-800-419-2595 International: 1-201-680-6541 www.melloninvestor.com Independent Registered Public Accounting Firm PricewaterhouseCoopers LLP PricewaterhouseCoopers Center 300 Madison Avenue New York, New York 10017 Executive Offices The Goldman Sachs Group, Inc. 85 Broad Street New York, New York 10004 1-212-902-1000 www.gs.com Common Stock The common stock of The Goldman Sachs Group, Inc. is listed on the New York Stock Exchange and trades under the ticker symbol “GS.” Shareholder Inquiries Information about the firm, including all quarterly earnings releases and financial filings with the U.S. Securities and Exchange Commission, can be accessed via our Web site at www.gs.com. Shareholder inquiries can also be directed to Investor Relations via email at gs-investor-relations@gs.com or by calling 1-212-902-0300. 2007 Annual Report on Form 10-K Copies of the firm’s 2007 Annual Report on Form 10-K as filed with the U.S. Securities and Exchange Commission can be accessed via our Web site at www.gs.com/shareholders/. Copies can also be obtained by contacting Investor Relations via email at gs-investor-relations@gs.com or by calling 1-212-902-0300. The cover, narrative and financial papers utilized in the printing of this Annual Report are certified by the Forest Stewardship Council, which promotes environmentally appropriate, socially beneficial and economically viable management of the world’s forest. These papers contain a mix of pulp that is derived from FSC certified well-managed forests; post-consumer recycled paper fibers and other controlled sources. Cenveo Anderson Lithograph’s FSC “Chain of Custody” certification is SCS-COC-00533. Goldman Sachs employed a printer for the production of this Annual Report that produces all its own electricity and is a certified “totally enclosed” facility that releases virtually no volatile organic compound emissions to the atmosphere. © 2008 The Goldman Sachs Group, Inc. All rights reserved. Except where specifically defined, the terms “Goldman Sachs,” “firm,” “we,” “us” and “our” in this document may refer to The Goldman Sachs Group, Inc. and/ or its subsidiaries and affiliates worldwide, or to one or more of them, depending on the context in each instance. Except where otherwise noted, all marks indicated by ®, TM, or SM are trademarks or service marks of Goldman, Sachs Co. or its affiliates. Photo of Alex Rodriguez © New York Yankees Photo of Bovespa © Antonio Carreiro 4350-07-102 18% Cert no. SCS-COC-00533 150 Goldman Sachs 2007 Annual Report
  • 153.
    Every day, we seeunique opportunities for growth —  for our clients and for Goldman Sachs. With expanding markets and growing capital flows, in countries around the world, amidst constantly shifting conditions, we see new potential and new challenges. As long-term growth and global finance continue to transform economies even in challenging circumstances, capital markets will play an increasingly vital role as people, capital and ideas come together in new ways. Goldman Sachs helps allocate capital and manage risk, and thus helps foster entrepreneurship, drive efficiency and encourage economic reform. As this year’s report illustrates, our clients’ aspirations and the risks they take drive change. Clients fund strategic initiatives, build new businesses and strengthen existing ones. They look for new ways to improve investment performance and take advantage of the opportunities that arise every day. 1 Our clients’ interests always come first. Our experience shows that if we serve our clients well, our own success will follow. 2 Our assets are our people, capital and reputation. If any of these is ever diminished, the last is the most difficult to restore. We are dedicated to complying fully with the letter and spirit of the laws, rules and ethical principles that govern us. Our continued success depends upon unswerving adherence to this standard. 3 Our goal is to provide superior returns to our shareholders. Profitability is critical to achieving superior returns, building our capital, and attracting and keeping our best people. Significant employee stock ownership aligns the interests of our employees and our shareholders. 4 We take great pride in the professional quality of our work. We have an uncompromising determination to achieve excellence in everything we undertake. Though we may be involved in a wide variety and heavy volume of activity, we would, if it came to a choice, rather be best than biggest. 5 We stress creativity and imagination in everything we do. While recognizing that the old way may still be the best way, we constantly strive to find a better solution to a client’s problems. We pride ourselves on having pioneered many of the practices and techniques that have become standard in the industry. 6 We make an unusual effort to identify and recruit the very best person for every job. Although our activities are measured in billions of dollars, we select our people one by one. In a service business, we know that without the best people, we cannot be the best firm. 7 We offer our people the opportunity to move ahead more rapidly than is possible at most other places. Advancement depends on merit and we have yet to find the limits to the responsibility our best people are able to assume. For us to be successful, our men and women must reflect the diversity of the communities and cultures in which we operate. That means we must attract, retain and motivate people from many backgrounds and perspectives. Being diverse is not optional; it is what we must be. 8 We stress teamwork in everything we do. While individual creativity is always encouraged, we have found that team effort often produces the best results. We have no room for those who put their personal interests ahead of the interests of the firm and its clients. 9 The dedication of our people to the firm and the intense effort they give their jobs are greater than one finds in most other organizations. We think that this is an important part of our success. 10 We consider our size an asset that we try hard to preserve. We want to be big enough to undertake the largest project that any of our clients could contemplate, yet small enough to maintain the loyalty, the intimacy and the esprit de corps that we all treasure and that contribute greatly to our success. 11 We constantly strive to anticipate the rapidly changing needs of our clients and to develop new services to meet those needs. We know that the world of finance will not stand still and that complacency can lead to extinction. 12 We regularly receive confidential information as part of our normal client relationships. To breach a confidence or to use confidential information improperly or carelessly would be unthinkable. 13 Our business is highly competitive, and we aggressively seek to expand our client relationships. However, we must always be fair competitors and must never denigrate other firms. 14 Integrity and honesty are at the heart of our business. We expect our people to maintain high ethical standards in everything they do, both in their work for the firm and in their personal lives. The Goldman Sachs Business Principles
  • 154.
    goldman sachs 2007 annualreport We See Opportunity www.gs.com WESEEOPPORTUNITYgoldmansachs2007annualreport