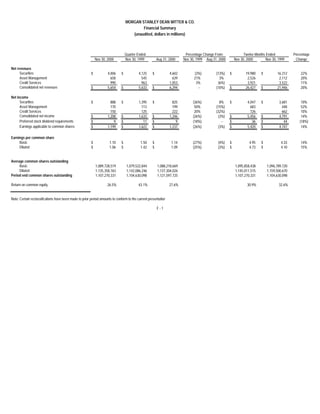
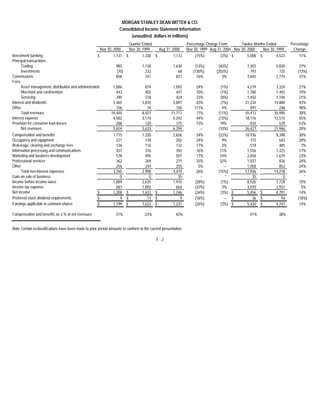
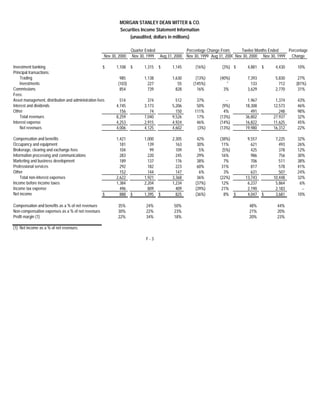
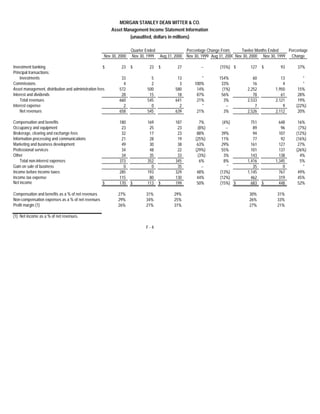
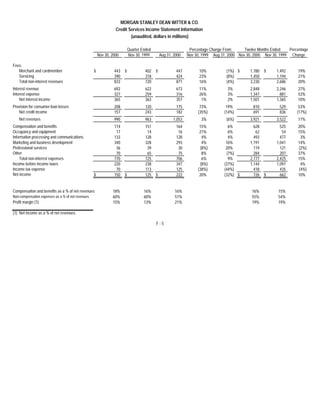
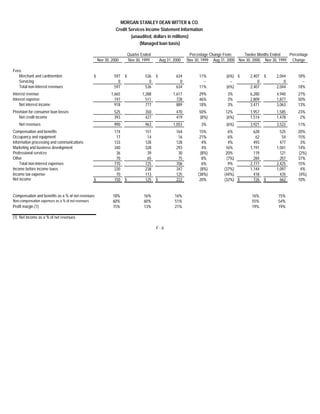
Morgan Stanley Dean Witter announced record full-year and fourth quarter results. For the full year, net income was $5.5 billion, up 14% from the prior year. Fourth quarter net income was $1.2 billion, down 26% from the previous year's fourth quarter. The company's securities, asset management, and credit services businesses all achieved record annual net income. The board also declared a 15% increase in the quarterly dividend to $0.23 per share.
The Evolution of Non-Banking Financial Companies (NBFCs) in India: Challenges...beulahfernandes8
Role in Financial System
NBFCs are critical in bridging the financial inclusion gap.
They provide specialized financial services that cater to segments often neglected by traditional banks.
Economic Impact
NBFCs contribute significantly to India's GDP.
They support sectors like micro, small, and medium enterprises (MSMEs), housing finance, and personal loans.
how to sell pi coins at high rate quickly.DOT TECH
Where can I sell my pi coins at a high rate.
Pi is not launched yet on any exchange. But one can easily sell his or her pi coins to investors who want to hold pi till mainnet launch.
This means crypto whales want to hold pi. And you can get a good rate for selling pi to them. I will leave the telegram contact of my personal pi vendor below.
A vendor is someone who buys from a miner and resell it to a holder or crypto whale.
Here is the telegram contact of my vendor:
@Pi_vendor_247
how to sell pi coins effectively (from 50 - 100k pi)DOT TECH
Anywhere in the world, including Africa, America, and Europe, you can sell Pi Network Coins online and receive cash through online payment options.
Pi has not yet been launched on any exchange because we are currently using the confined Mainnet. The planned launch date for Pi is June 28, 2026.
Reselling to investors who want to hold until the mainnet launch in 2026 is currently the sole way to sell.
Consequently, right now. All you need to do is select the right pi network provider.
Who is a pi merchant?
An individual who buys coins from miners on the pi network and resells them to investors hoping to hang onto them until the mainnet is launched is known as a pi merchant.
debuts.
I'll provide you the Telegram username
@Pi_vendor_247
how can i use my minded pi coins I need some funds.DOT TECH
If you are interested in selling your pi coins, i have a verified pi merchant, who buys pi coins and resell them to exchanges looking forward to hold till mainnet launch.
Because the core team has announced that pi network will not be doing any pre-sale. The only way exchanges like huobi, bitmart and hotbit can get pi is by buying from miners.
Now a merchant stands in between these exchanges and the miners. As a link to make transactions smooth. Because right now in the enclosed mainnet you can't sell pi coins your self. You need the help of a merchant,
i will leave the telegram contact of my personal pi merchant below. 👇 I and my friends has traded more than 3000pi coins with him successfully.
@Pi_vendor_247
what is the future of Pi Network currency.DOT TECH
The future of the Pi cryptocurrency is uncertain, and its success will depend on several factors. Pi is a relatively new cryptocurrency that aims to be user-friendly and accessible to a wide audience. Here are a few key considerations for its future:
Message: @Pi_vendor_247 on telegram if u want to sell PI COINS.
1. Mainnet Launch: As of my last knowledge update in January 2022, Pi was still in the testnet phase. Its success will depend on a successful transition to a mainnet, where actual transactions can take place.
2. User Adoption: Pi's success will be closely tied to user adoption. The more users who join the network and actively participate, the stronger the ecosystem can become.
3. Utility and Use Cases: For a cryptocurrency to thrive, it must offer utility and practical use cases. The Pi team has talked about various applications, including peer-to-peer transactions, smart contracts, and more. The development and implementation of these features will be essential.
4. Regulatory Environment: The regulatory environment for cryptocurrencies is evolving globally. How Pi navigates and complies with regulations in various jurisdictions will significantly impact its future.
5. Technology Development: The Pi network must continue to develop and improve its technology, security, and scalability to compete with established cryptocurrencies.
6. Community Engagement: The Pi community plays a critical role in its future. Engaged users can help build trust and grow the network.
7. Monetization and Sustainability: The Pi team's monetization strategy, such as fees, partnerships, or other revenue sources, will affect its long-term sustainability.
It's essential to approach Pi or any new cryptocurrency with caution and conduct due diligence. Cryptocurrency investments involve risks, and potential rewards can be uncertain. The success and future of Pi will depend on the collective efforts of its team, community, and the broader cryptocurrency market dynamics. It's advisable to stay updated on Pi's development and follow any updates from the official Pi Network website or announcements from the team.
Introduction to Indian Financial System ()Avanish Goel
The financial system of a country is an important tool for economic development of the country, as it helps in creation of wealth by linking savings with investments.
It facilitates the flow of funds form the households (savers) to business firms (investors) to aid in wealth creation and development of both the parties
The secret way to sell pi coins effortlessly.DOT TECH
Well as we all know pi isn't launched yet. But you can still sell your pi coins effortlessly because some whales in China are interested in holding massive pi coins. And they are willing to pay good money for it. If you are interested in selling I will leave a contact for you. Just telegram this number below. I sold about 3000 pi coins to him and he paid me immediately.
Telegram: @Pi_vendor_247
Poonawalla Fincorp and IndusInd Bank Introduce New Co-Branded Credit Cardnickysharmasucks
The unveiling of the IndusInd Bank Poonawalla Fincorp eLITE RuPay Platinum Credit Card marks a notable milestone in the Indian financial landscape, showcasing a successful partnership between two leading institutions, Poonawalla Fincorp and IndusInd Bank. This co-branded credit card not only offers users a plethora of benefits but also reflects a commitment to innovation and adaptation. With a focus on providing value-driven and customer-centric solutions, this launch represents more than just a new product—it signifies a step towards redefining the banking experience for millions. Promising convenience, rewards, and a touch of luxury in everyday financial transactions, this collaboration aims to cater to the evolving needs of customers and set new standards in the industry.
What price will pi network be listed on exchangesDOT TECH
The rate at which pi will be listed is practically unknown. But due to speculations surrounding it the predicted rate is tends to be from 30$ — 50$.
So if you are interested in selling your pi network coins at a high rate tho. Or you can't wait till the mainnet launch in 2026. You can easily trade your pi coins with a merchant.
A merchant is someone who buys pi coins from miners and resell them to Investors looking forward to hold massive quantities till mainnet launch.
I will leave the telegram contact of my personal pi vendor to trade with.
@Pi_vendor_247
Exploring Abhay Bhutada’s Views After Poonawalla Fincorp’s Collaboration With...beulahfernandes8
The financial landscape in India has witnessed a significant development with the recent collaboration between Poonawalla Fincorp and IndusInd Bank.
The launch of the co-branded credit card, the IndusInd Bank Poonawalla Fincorp eLITE RuPay Platinum Credit Card, marks a major milestone for both entities.
This strategic move aims to redefine and elevate the banking experience for customers.
USDA Loans in California: A Comprehensive Overview.pptxmarketing367770
USDA Loans in California: A Comprehensive Overview
If you're dreaming of owning a home in California's rural or suburban areas, a USDA loan might be the perfect solution. The U.S. Department of Agriculture (USDA) offers these loans to help low-to-moderate-income individuals and families achieve homeownership.
Key Features of USDA Loans:
Zero Down Payment: USDA loans require no down payment, making homeownership more accessible.
Competitive Interest Rates: These loans often come with lower interest rates compared to conventional loans.
Flexible Credit Requirements: USDA loans have more lenient credit score requirements, helping those with less-than-perfect credit.
Guaranteed Loan Program: The USDA guarantees a portion of the loan, reducing risk for lenders and expanding borrowing options.
Eligibility Criteria:
Location: The property must be located in a USDA-designated rural or suburban area. Many areas in California qualify.
Income Limits: Applicants must meet income guidelines, which vary by region and household size.
Primary Residence: The home must be used as the borrower's primary residence.
Application Process:
Find a USDA-Approved Lender: Not all lenders offer USDA loans, so it's essential to choose one approved by the USDA.
Pre-Qualification: Determine your eligibility and the amount you can borrow.
Property Search: Look for properties in eligible rural or suburban areas.
Loan Application: Submit your application, including financial and personal information.
Processing and Approval: The lender and USDA will review your application. If approved, you can proceed to closing.
USDA loans are an excellent option for those looking to buy a home in California's rural and suburban areas. With no down payment and flexible requirements, these loans make homeownership more attainable for many families. Explore your eligibility today and take the first step toward owning your dream home.
Even tho Pi network is not listed on any exchange yet.
Buying/Selling or investing in pi network coins is highly possible through the help of vendors. You can buy from vendors[ buy directly from the pi network miners and resell it]. I will leave the telegram contact of my personal vendor.
@Pi_vendor_247
1. MORGAN STANLEY DEAN WITTER & CO.
News
Contact: Investor Relations Media Relations
John Beneke Raymond O’Rourke
212-762-7282 212-761-4262
MORGAN STANLEY DEAN WITTER ANNOUNCES
RECORD FULL-YEAR NET INCOME OF $5.5 BILLION;
FOURTH QUARTER NET INCOME OF $1.2 BILLION;
DIVIDEND INCREASE OF 15%
NEW YORK, December 19, 2000 — Morgan Stanley Dean Witter & Co. (NYSE:
MWD) today reported record net income for the full fiscal year of $5,456 million, 14
percent higher than $4,791 million a year ago. Diluted earnings per share were $4.73,
up 15 percent from last year’s $4.10. Full year net revenues (total revenues less
interest expense and the provision for loan losses) rose 20 percent to a record $26.4
billion and the return on average common equity was 30.9 percent.
Net income for the fourth quarter ended November 30, 2000 was $1,208 million — a
26 percent decline from last year’s fourth quarter record $1,633 million. Diluted
earnings per share were $1.06 — down 25 percent from $1.42 a year ago. Fourth
quarter net revenues of $5.7 billion equaled last year’s fourth quarter. The annualized
return on average common equity for the quarter was 26.5 percent.
Philip J. Purcell, Chairman, and John J. Mack, President, said in a joint statement,
“We are very pleased with our results for the year, which included a 20 percent
increase in revenues and a 31 percent return on equity. Our three major businesses —
2. securities, asset management and Discover Card — all had record net income for the
year. At the same time, we are disappointed with the decline in our operating margins.
Weak results in fixed income and private equity and unusual compensation pressure in
institutional securities contributed to the decline. However, we continued to invest in
our businesses and as a result, we believe we are well-positioned to take full advantage
of the strong secular growth in global financial services.”
The Company also announced that its Board of Directors declared a $.23 quarterly
dividend per common share — a 15 percent increase from $.20 per common share in
the previous quarter. The dividend is payable on January 30, 2001 to common
shareholders of record on January 12, 2001.
SECURITIES
FULL YEAR
The Company’s securities business posted record net income of $4,047 million in
fiscal 2000, up 10 percent over last year. Net revenues rose 22% to $20 billion,
reflecting record revenues in the Company’s institutional and individual securities
businesses.
In institutional securities, the Company achieved record revenues in equities,
investment banking and commodities, and continued to benefit from its expanding
global presence. For the first eleven months of calendar 2000, the Company
maintained its industry leadership position in announced and completed global merger
and acquisition transactions, worldwide equity and equity-related underwritings, and
worldwide investment grade debt underwriting. In M&A, the Company achieved
global announced transaction dollar volume of $1.1 trillion and market share of 35
percent.1 In equity research, the Company ranked first in Institutional Investor’s 2000
Global Research Poll and tied for first in the 2000 All-America Research Poll.
1
Source: Thomson Financial Securities Data – January 1 to November 30, 2000.
2
3. The Individual Investor Group (IIG, formerly the Private Client Group) also achieved
record full-year results, driven by higher revenues from fee-based products and record
volumes in listed and over-the-counter equity markets. The number of global financial
advisors increased by 1,236 to a record 13,910. The Individual Investor Group also
achieved a net increase of 664,000 domestic client accounts to a record 5.4 million.
Client assets in fee-based accounts increased 28 percent from a year ago, and total
client assets increased $64 billion to stand at $659 billion at fiscal year end.
FOURTH QUARTER
The Company’s securities business posted net income of $888 million, a 36% decline
versus the record fourth quarter 1999. The decrease reflected a modest decline in net
revenues and broadly higher expenses related to higher compensation levels and staff
increases in our global equities, investment banking and individual investor businesses.
• Continued strong revenues in equities and investment banking helped offset
weakness in the high yield market and lower customer volumes in fixed income
overall. Institutional securities also continued to benefit from its strong global
franchise, particularly in the European and Asian markets.
• Equities’ results were driven by strong performances in both cash products and
derivatives trading. Cash benefited from record domestic volume levels and
increased volumes in Europe and Asia, while derivatives benefited from increased
volatility.
• Investment banking quarterly results were adversely affected by unusual
compensation pressure, related to increased staff and the competitive environment,
which more than offset the benefits of high volume in global M&A activity and the
continued strong performance in our equity underwriting business.
• IIG's quarterly results benefited from significant increases in fee-based revenues
which more than offset a modest decline in commissions. In addition, sales of fee-
based products this quarter were above levels reached a year earlier.
3
4. • The private equity group reported negative investment revenues of $73 million for
the fourth quarter compared to a gain of $173 million a year ago. These results
reflected lower securities prices, primarily in the telecommunications and Internet
sectors.
ASSET MANAGEMENT
FULL YEAR
The Company’s asset management business reported record net income of $683
million, up 52 percent over 1999. The Company continued to grow its assets under
management. At fiscal year end, these assets stood at $502 billion, an increase of $30
billion from a year ago. The Company had positive net sales for the year and launched
20 new funds generating sales of $13.5 billion, compared to 18 new funds and sales of
$6.1 billion a year ago. In addition, Unit Investment Trust sales were a record $16.6
billion, 25 percent above last year.
FOURTH QUARTER
Asset management’s quarterly net income was $170 million, up 50 percent from $113
million in the fourth quarter of 1999. The increase resulted primarily from growth in
the Company’s average assets under management and a shift in asset mix to a greater
percentage of equity products.
• Retail assets fell $35 billion during the quarter but were up $27 billion over a year
ago — to stand at $319 billion. Institutional assets declined $11 billion during the
quarter but increased $3 billion over the past twelve months to stand at $183
billion. Both businesses had positive net fund sales for the quarter. However,
quarter-to-quarter declines resulted from lower market values.
• The launch of the MSDW Technology Fund was the Company’s second largest
equity fund offering ever — raising $1.3 billion in initial assets.
4
5. • Reflecting continued improvement in fund performance, the number of the
company’s funds rated four or five stars overall by Morningstar2 rose to 59 from 51
funds a year ago. The Company continued to have the second highest number of
domestic funds receiving Morningstar’s two highest ratings.
CREDIT SERVICES
FULL YEAR
Credit services record net income of $726 million increased 10 percent from a year
ago. Net revenues rose approximately $400 million, or 11 percent, to more than $3.9
billion. Managed consumer loans increased 24 percent to a record $47.1 billion and
transaction volume surged 28 percent to a record $90.1 billion. The consumer loan
charge-off rate declined 102 basis points to 4.40 percent and the over-thirty-day
delinquency rate fell 40 basis points to 5.92 percent. Discover enrolled a record
670,000 merchant locations during the year, and added 6.1 million new cardmember
accounts — the largest number of new accounts since 1987.
FOURTH QUARTER
Credit services net income rose 20 percent from a year ago to $150 million. Higher
consumer loan balances and increased transaction volume contributed to this increase.
• Managed consumer loans rose to a record $47.1 billion, an increase of $9.2 billion,
or 24 percent, from a year ago.
• Merchant and cardmember fees increased 11 percent from a year ago to $597
million. Transaction volume also increased 11 percent to $22.8 billion, driven by
higher sales volume and balance transfers.
• The consumer loan net charge-off rate was 4.57 percent compared to last year’s
fourth quarter 4.63 percent.
• Discover opened over 1.6 million new cardmember accounts during the quarter and
now has a record 42.6 million accounts.
2
As of October 31, 2000.
5
6. Total capital at November 30, 2000 was $49.6 billion, including $19.7 billion of
common and preferred stockholders’ equity and preferred securities issued by
subsidiaries. Book value per common share was $16.91, based on quarter-end shares
outstanding of 1.1 billion.
The Company repurchased approximately 47 million shares of its common stock
during the 2000 fiscal year.
Morgan Stanley Dean Witter & Co. is a global financial services firm and a market
leader in securities, asset management and credit services. The Company has offices in
New York, London, Tokyo, Hong Kong and other principal financial centers around
the world and has 524 securities branch offices throughout the United States.
Access this press release on-line @www.msdw.com
###
(See Attached Schedules)
This release may contain forward-looking statements. These statements, which reflect
management’s beliefs and expectations, are subject to risks and uncertainties that may cause
actual results to differ materially. For a discussion of the risks and uncertainties that may
affect the Company’s future results, please see “Management’s Discussion and Analysis of
Financial Condition and Results of Operations” in the Company’s 1999 Annual Report to
Shareholders and the Company’s Quarterly Reports on Form 10-Q for fiscal 2000.
6
7. MORGAN STANLEY DEAN WITTER & CO.
Financial Summary
(unaudited, dollars in millions)
Quarter Ended Percentage Change From: Twelve Months Ended Percentage
Nov 30, 2000 Nov 30, 1999 Aug 31, 2000 Nov 30, 1999 Aug 31, 2000 Nov 30, 2000 Nov 30, 1999 Change
Net revenues
Securities $ 4,006 $ 4,125 $ 4,602 (3%) (13%) $ 19,980 $ 16,312 22%
Asset Management 658 545 639 21% 3% 2,526 2,112 20%
Credit Services 990 963 1,053 3% (6%) 3,921 3,522 11%
Consolidated net revenues $ 5,654 $ 5,633 $ 6,294 -- (10%) $ 26,427 $ 21,946 20%
Net income
Securities $ 888 $ 1,395 $ 825 (36%) 8% $ 4,047 $ 3,681 10%
Asset Management 170 113 199 50% (15%) 683 448 52%
Credit Services 150 125 222 20% (32%) 726 662 10%
Consolidated net income $ 1,208 $ 1,633 $ 1,246 (26%) (3%) $ 5,456 $ 4,791 14%
Preferred stock dividend requirements $ 9 $ 11 $ 9 (18%) -- $ 36 $ 44 (18%)
Earnings applicable to common shares $ 1,199 $ 1,622 $ 1,237 (26%) (3%) $ 5,420 $ 4,747 14%
Earnings per common share
Basic $ 1.10 $ 1.50 $ 1.14 (27%) (4%) $ 4.95 $ 4.33 14%
Diluted $ 1.06 $ 1.42 $ 1.09 (25%) (3%) $ 4.73 $ 4.10 15%
Average common shares outstanding
Basic 1,089,728,519 1,079,522,844 1,088,218,669 1,095,858,438 1,096,789,720
Diluted 1,135,358,763 1,142,086,246 1,137,304,026 1,145,011,515 1,159,500,670
Period end common shares outstanding 1,107,270,331 1,104,630,098 1,121,597,725 1,107,270,331 1,104,630,098
Return on common equity 26.5% 43.1% 27.6% 30.9% 32.6%
Note: Certain reclassifications have been made to prior period amounts to conform to the current presentation
F-1
8. MORGAN STANLEY DEAN WITTER & CO.
Consolidated Income Statement Information
(unaudited, dollars in millions)
Quarter Ended Percentage Change From: Twelve Months Ended Percentage
Nov 30, 2000 Nov 30, 1999 Aug 31, 2000 Nov 30, 1999 Aug 31, 2000 Nov 30, 2000 Nov 30, 1999 Change
Investment banking $ 1,131 $ 1,338 $ 1,172 (15%) (3%) $ 5,008 $ 4,523 11%
Principal transactions:
Trading 985 1,138 1,630 (13%) (40%) 7,393 5,830 27%
Investments (70) 232 68 (130%) (203%) 193 725 (73%)
Commissions 858 741 831 16% 3% 3,645 2,774 31%
Fees:
Asset management, distribution and administration 1,086 874 1,092 24% (1%) 4,219 3,324 27%
Merchant and cardmember 443 402 447 10% (1%) 1,780 1,492 19%
Servicing 390 318 424 23% (8%) 1,450 1,194 21%
Interest and dividends 5,465 3,810 5,897 43% (7%) 21,234 14,880 43%
Other 156 74 150 111% 4% 491 248 98%
Total revenues 10,444 8,927 11,711 17% (11%) 45,413 34,990 30%
Interest expense 4,582 3,174 5,242 44% (13%) 18,176 12,515 45%
Provision for consumer loan losses 208 120 175 73% 19% 810 529 53%
Net revenues 5,654 5,633 6,294 -- (10%) 26,427 21,946 20%
Compensation and benefits 1,775 1,320 2,656 34% (33%) 10,936 8,398 30%
Occupancy and equipment 221 178 202 24% 9% 772 643 20%
Brokerage, clearing and exchange fees 136 116 132 17% 3% 519 485 7%
Information processing and communications 437 376 392 16% 11% 1,556 1,325 17%
Marketing and business development 578 495 507 17% 14% 2,058 1,679 23%
Professional services 362 269 275 35% 32% 1,037 836 24%
Other 256 244 255 5% -- 1,058 852 24%
Total non-interest expenses 3,765 2,998 4,419 26% (15%) 17,936 14,218 26%
Gain on sale of business 0 0 35 -- * 35 0 *
Income before income taxes 1,889 2,635 1,910 (28%) (1%) 8,526 7,728 10%
Income tax expense 681 1,002 664 (32%) 3% 3,070 2,937 5%
Net income $ 1,208 $ 1,633 $ 1,246 (26%) (3%) $ 5,456 $ 4,791 14%
Preferred stock dividend requirements $ 9 $ 11 $ 9 (18%) -- $ 36 $ 44 (18%)
Earnings applicable to common shares $ 1,199 $ 1,622 $ 1,237 (26%) (3%) $ 5,420 $ 4,747 14%
Compensation and benefits as a % of net revenues 31% 23% 42% 41% 38%
Note:Certain reclassifications have been made to prior period amounts to conform to the current presentation.
F-2
9. MORGAN STANLEY DEAN WITTER & CO.
Securities Income Statement Information
(unaudited, dollars in millions)
Quarter Ended Percentage Change From: Twelve Months Ended Percentage
Nov 30, 2000 Nov 30, 1999 Aug 31, 2000 Nov 30, 1999 Aug 31, 2000 Nov 30, 2000 Nov 30, 1999 Change
Investment banking $ 1,108 $ 1,315 $ 1,145 (16%) (3%) $ 4,881 $ 4,430 10%
Principal transactions:
Trading 985 1,138 1,630 (13%) (40%) 7,393 5,830 27%
Investments (103) 227 55 (145%) * 133 712 (81%)
Commissions 854 739 828 16% 3% 3,629 2,770 31%
Fees:
Asset management, distribution and administration fees 514 374 512 37% -- 1,967 1,374 43%
Interest and dividends 4,745 3,173 5,206 50% (9%) 18,308 12,573 46%
Other 156 74 150 111% 4% 491 248 98%
Total revenues 8,259 7,040 9,526 17% (13%) 36,802 27,937 32%
Interest expense 4,253 2,915 4,924 46% (14%) 16,822 11,625 45%
Net revenues 4,006 4,125 4,602 (3%) (13%) 19,980 16,312 22%
Compensation and benefits 1,421 1,000 2,305 42% (38%) 9,557 7,225 32%
Occupancy and equipment 181 139 163 30% 11% 621 493 26%
Brokerage, clearing and exchange fees 104 99 109 5% (5%) 425 378 12%
Information processing and communications 283 220 245 29% 16% 986 756 30%
Marketing and business development 189 137 176 38% 7% 706 511 38%
Professional services 292 182 223 60% 31% 817 578 41%
Other 152 144 147 6% 3% 631 507 24%
Total non-interest expenses 2,622 1,921 3,368 36% (22%) 13,743 10,448 32%
Income before income taxes 1,384 2,204 1,234 (37%) 12% 6,237 5,864 6%
Income tax expense 496 809 409 (39%) 21% 2,190 2,183 --
Net income $ 888 $ 1,395 $ 825 (36%) 8% $ 4,047 $ 3,681 10%
Compensation and benefits as a % of net revenues 35% 24% 50% 48% 44%
Non-compensation expenses as a % of net revenues 30% 22% 23% 21% 20%
Profit margin (1) 22% 34% 18% 20% 23%
(1) Net income as a % of net revenues.
F-3
10. MORGAN STANLEY DEAN WITTER & CO.
Asset Management Income Statement Information
(unaudited, dollars in millions)
Quarter Ended Percentage Change From: Twelve Months Ended Percentage
Nov 30, 2000 Nov 30, 1999 Aug 31, 2000 Nov 30, 1999 Aug 31, 2000 Nov 30, 2000 Nov 30, 1999 Change
Investment banking $ 23 $ 23 $ 27 -- (15%) $ 127 $ 93 37%
Principal transactions:
Investments 33 5 13 * 154% 60 13 *
Commissions 4 2 3 100% 33% 16 4 *
Asset management, distribution and administration fees 572 500 580 14% (1%) 2,252 1,950 15%
Interest and dividends 28 15 18 87% 56% 78 61 28%
Total revenues 660 545 641 21% 3% 2,533 2,121 19%
Interest expense 2 0 2 * -- 7 9 (22%)
Net revenues 658 545 639 21% 3% 2,526 2,112 20%
Compensation and benefits 180 169 187 7% (4%) 751 648 16%
Occupancy and equipment 23 25 23 (8%) -- 89 96 (7%)
Brokerage, clearing and exchange fees 32 17 23 88% 39% 94 107 (12%)
Information processing and communications 21 28 19 (25%) 11% 77 92 (16%)
Marketing and business development 49 30 38 63% 29% 161 127 27%
Professional services 34 48 22 (29%) 55% 101 137 (26%)
Other 34 35 33 (3%) 3% 143 138 4%
Total non-interest expenses 373 352 345 6% 8% 1,416 1,345 5%
Gain on sale of business 0 0 35 -- * 35 0 *
Income before income taxes 285 193 329 48% (13%) 1,145 767 49%
Income tax expense 115 80 130 44% (12%) 462 319 45%
Net income $ 170 $ 113 $ 199 50% (15%) $ 683 $ 448 52%
Compensation and benefits as a % of net revenues 27% 31% 29% 30% 31%
Non-compensation expenses as a % of net revenues 29% 34% 25% 26% 33%
Profit margin (1) 26% 21% 31% 27% 21%
(1) Net income as a % of net revenues.
F-4
11. MORGAN STANLEY DEAN WITTER & CO.
Credit Services Income Statement Information
(unaudited, dollars in millions)
Report dated: 12/18/00 17:39
Vs Report dated: 12/18/00 17:21 Quarter Ended Percentage Change From: Twelve Months Ended Percentage
Nov 30, 2000 Nov 30, 1999 Aug 31, 2000 Nov 30, 1999 Aug 31, 2000 Nov 30, 2000 Nov 30, 1999 Change
Fees:
Merchant and cardmember $ 443 $ 402 $ 447 10% (1%) $ 1,780 $ 1,492 19%
Servicing 390 318 424 23% (8%) 1,450 1,194 21%
Total non-interest revenues 833 720 871 16% (4%) 3,230 2,686 20%
Interest revenue 692 622 673 11% 3% 2,848 2,246 27%
Interest expense 327 259 316 26% 3% 1,347 881 53%
Net interest income 365 363 357 1% 2% 1,501 1,365 10%
Provision for consumer loan losses 208 120 175 73% 19% 810 529 53%
Net credit income 157 243 182 (35%) (14%) 691 836 (17%)
Net revenues 990 963 1,053 3% (6%) 3,921 3,522 11%
Compensation and benefits 174 151 164 15% 6% 628 525 20%
Occupancy and equipment 17 14 16 21% 6% 62 54 15%
Information processing and communications 133 128 128 4% 4% 493 477 3%
Marketing and business development 340 328 293 4% 16% 1,191 1,041 14%
Professional services 36 39 30 (8%) 20% 119 121 (2%)
Other 70 65 75 8% (7%) 284 207 37%
Total non-interest expenses 770 725 706 6% 9% 2,777 2,425 15%
Income before income taxes 220 238 347 (8%) (37%) 1,144 1,097 4%
Income tax expense 70 113 125 (38%) (44%) 418 435 (4%)
Net income $ 150 $ 125 $ 222 20% (32%) $ 726 $ 662 10%
Compensation and benefits as a % of net revenues 18% 16% 16% 16% 15%
Non-compensation expenses as a % of net revenues 60% 60% 51% 55% 54%
Profit margin (1) 15% 13% 21% 19% 19%
(1) Net income as a % of net revenues.
F-5
12. MORGAN STANLEY DEAN WITTER & CO.
Credit Services Income Statement Information
(unaudited, dollars in millions)
(Managed loan basis)
Report dated: 12/18/00 17:39
Vs Report dated: 12/18/00 17:21 Quarter Ended Percentage Change From: Twelve Months Ended Percentage
Nov 30, 2000 Nov 30, 1999 Aug 31, 2000 Nov 30, 1999 Aug 31, 2000 Nov 30, 2000 Nov 30, 1999 Change
Fees:
Merchant and cardmember $ 597 $ 536 $ 634 11% (6%) $ 2,407 $ 2,044 18%
Servicing 0 0 0 -- -- 0 0 --
Total non-interest revenues 597 536 634 11% (6%) 2,407 2,044 18%
Interest revenue 1,665 1,288 1,617 29% 3% 6,280 4,940 27%
Interest expense 747 511 728 46% 3% 2,809 1,877 50%
Net interest income 918 777 889 18% 3% 3,471 3,063 13%
Provision for consumer loan losses 525 350 470 50% 12% 1,957 1,585 23%
Net credit income 393 427 419 (8%) (6%) 1,514 1,478 2%
Net revenues 990 963 1,053 3% (6%) 3,921 3,522 11%
Compensation and benefits 174 151 164 15% 6% 628 525 20%
Occupancy and equipment 17 14 16 21% 6% 62 54 15%
Information processing and communications 133 128 128 4% 4% 493 477 3%
Marketing and business development 340 328 293 4% 16% 1,191 1,041 14%
Professional services 36 39 30 (8%) 20% 119 121 (2%)
Other 70 65 75 8% (7%) 284 207 37%
Total non-interest expenses 770 725 706 6% 9% 2,777 2,425 15%
Income before income taxes 220 238 347 (8%) (37%) 1,144 1,097 4%
Income tax expense 70 113 125 (38%) (44%) 418 435 (4%)
Net income $ 150 $ 125 $ 222 20% (32%) $ 726 $ 662 10%
Compensation and benefits as a % of net revenues 18% 16% 16% 16% 15%
Non-compensation expenses as a % of net revenues 60% 60% 51% 55% 54%
Profit margin (1) 15% 13% 21% 19% 19%
(1) Net income as a % of net revenues.
F-6
13. MORGAN STANLEY DEAN WITTER & CO.
Financial Information and Statistical Data
(unaudited)
Quarter Ended Percentage Change From:
Nov 30, 2000 Nov 30, 1999 Aug 31, 2000 Nov 30, 1999 Aug 31, 2000
MSDW
Total assets (millions) $ 427,000 $ 367,000 $ 404,000 16% 6%
Period end common shares outstanding 1,107,270,331 1,104,630,098 1,121,597,725 -- (1%)
Book value per common share $ 16.91 $ 14.85 $ 16.19 14% 4%
Shareholders’ equity (millions) (1) $ 19,671 $ 17,414 $ 19,054 13% 3%
Total capital (millions) (2) $ 49,637 $ 39,699 $ 50,311 25% (1%)
SECURITIES ($ billions)
Individual Investor Group
Global financial advisors 13,910 12,674 13,789 10% 1%
Total client assets $ 659 $ 595 $ 778 11% (15%)
Fee-based client account assets (3) $ 142 $ 111 $ 155 28% (8%)
Institutional Securities (4)
Mergers and acquisitions announced transactions (5)
MSDW global market volume $ 1,069.5 $ 1,003.3 $ 926.2
Rank 2 3 1
Worldwide equity and related issues (5)
MSDW global market volume $ 59.3 $ 61.8 $ 43.9
Rank 3 1 2
ASSET MANAGEMENT ($ billions)
Assets under management or supervision
Products offered primarily to individuals
Mutual funds
Equity $ 103 $ 94 $ 122 10% (16%)
Fixed income 46 53 49 (13%) (6%)
Money markets 57 47 55 21% 4%
Total mutual funds 206 194 226 6% (9%)
ICS Assets 31 23 34 35% (9%)
Separate accounts, unit trust and other arrangements 82 75 94 9% (13%)
Sub-total Individual 319 292 354 9% (10%)
Products offered primarily to institutional clients
Mutual funds 36 33 38 9% (5%)
Separate accounts, pooled vehicle and other arrangements 147 147 156 -- (6%)
Sub-total Institutional 183 180 194 2% (6%)
Total assets under management or supervision $ 502 $ 472 $ 548 6% (8%)
(1) Includes preferred and common equity and preferred securities issued by subsidiaries.
(2) Includes preferred and common equity, preferred securities issued by subsidiaries, capital units and non-current portion of long-term debt.
(3) Represents the amount of assets in client accounts where the basis of payment for services is a fee calculated on those assets.
(4) Source: Thomson Financial Securities Data.
(5) Information is year to date and stated on a calendar year basis.
F-7
14. MORGAN STANLEY DEAN WITTER & CO.
Financial Information and Statistical Data
(unaudited, dollars in millions)
Quarter Ended Percentage Change From: Twelve Months Ended Percentage
Nov 30, 2000 Nov 30, 1999 Aug 31, 2000 Nov 30, 1999 Aug 31, 2000 Nov 30, 2000 Nov 30, 1999 Change
CREDIT SERVICES
Owned consumer loans
Period end $ 21,870 $ 20,998 $ 19,817 4% 10% $ 21,870 $ 20,998 4%
Average $ 20,901 $ 18,341 $ 20,091 14% 4% $ 21,910 $ 16,177 35%
Managed consumer loans (1)
Period end $ 47,126 $ 37,975 $ 44,841 24% 5% $ 47,126 $ 37,975 24%
Average $ 45,828 $ 35,608 $ 44,345 29% 3% $ 43,540 $ 33,534 30%
Interest yield 14.13% 14.15% 14.05% (2 bp) 8 bp 13.82% 14.23% (41 bp)
Interest spread 7.39% 8.22% 7.35% (83 bp) 4 bp 7.28% 8.49% (121 bp)
Net charge-off rate 4.57% 4.63% 4.18% (6 bp) 39 bp 4.40% 5.42% (102 bp)
Delinquency rate (over 30 days) 5.92% 6.32% 5.47% (40 bp) 45 bp 5.92% 6.32% (40 bp)
Credit Card
Transaction volume (billions) $ 22.8 $ 20.5 $ 21.9 11% 4% $ 90.1 $ 70.6 28%
Accounts (millions) 42.6 38.5 41.4 11% 3% 42.6 38.5 11%
Active accounts (millions) 23.8 22.1 23.1 8% 3% 23.8 22.1 8%
Average receivables per average active account (actual $) $ 1,960 $ 1,654 $ 1,924 19% 2% $ 1,893 $ 1,581 20%
Discover Business Services’ increase in merchant locations (thousands) 263 233 134 13% 96% 670 615 9%
(1) Includes owned and securitized consumer loans.
F-8