Download to read offline
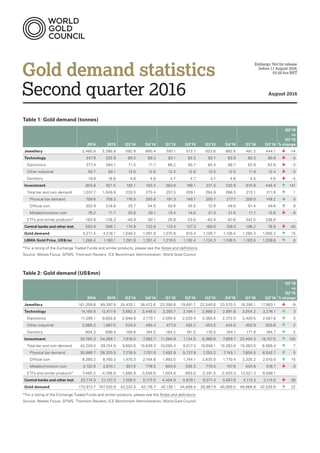
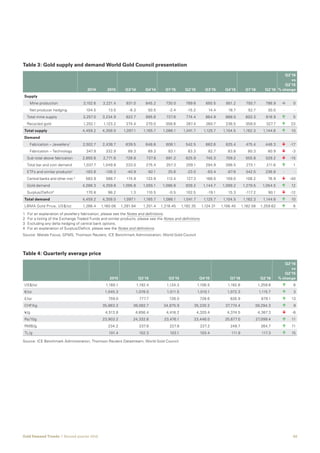
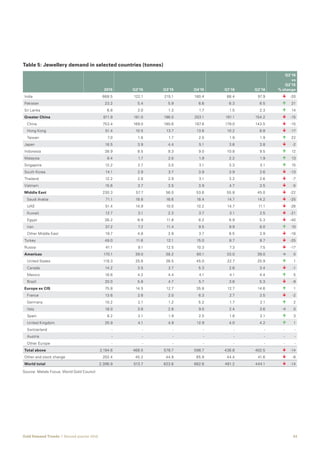
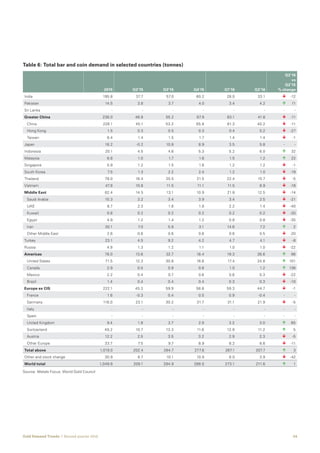
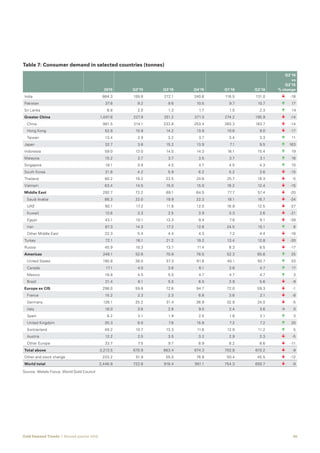
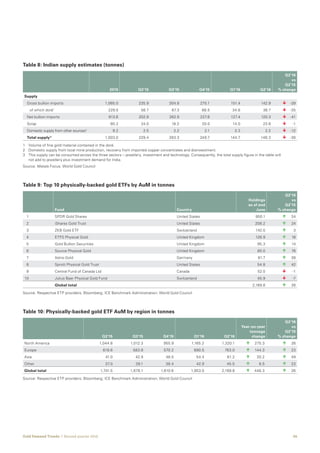
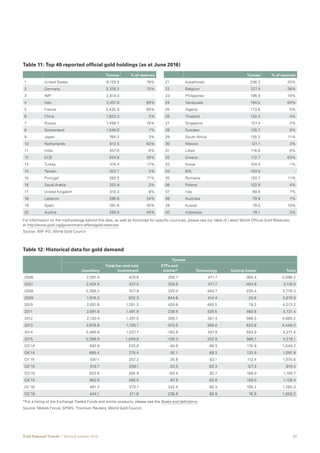

The document provides quarterly gold demand statistics from Q3 2014 to Q2 2016. Some key points: - Global gold demand decreased 14% year-over-year to 444.1 tonnes in Q2 2016, driven by lower jewellery demand in China and India. - Investment demand increased 141% in Q1 2016 and 1% in Q2 2016, with strong growth in ETFs and similar products. - The LBMA Gold Price increased 6% year-over-year in Q2 2016 to $1,259.62/oz.