Download to read offline

![06Gold Demand Trends | First quarter 2016
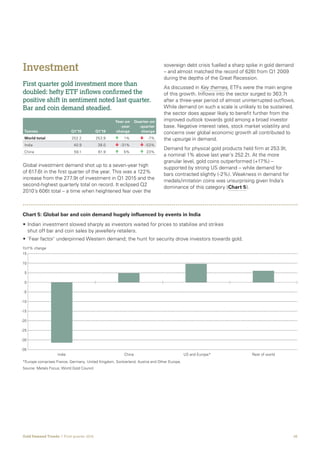
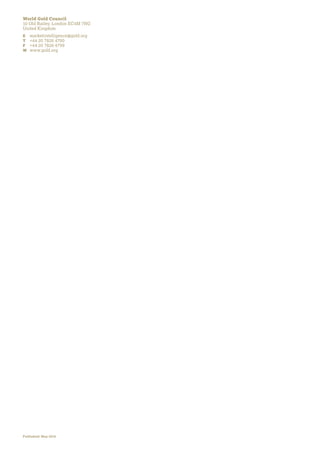
Then, in the government’s budget on 29 February, the
Finance Ministry announced plans to impose a 1% excise
duty on jewellery manufacturing.4
The response from the
jewellery sector was swift and decisive: a nationwide
strike was called from 2 March with the support of national
industry associations.5
While jewellery stores in the south
of India re-opened on 19 March, retailers across vast
swathes of the country remained shut for the remainder of
the quarter and into April. Given the higher penetration of
single store retailers in the North, East and West of India,
the impact on sales was more prominent for unorganised
players, while branded chain stores were relatively resilient.
The widespread media coverage of the strike ensured that
customers stayed away, even from those shops that chose
not to strike. In its quarterly update to investors, jewellery
giant Titan noted that it’s premier brand, Tanishq was
“not participating in the strike but many of the stores had
to be shut down on many occasions across the country
due to agitations by striking jewellery associations.
The customer walk-ins in the ensuing period have also
been poor due to the customer perception that [the] entire
industry is on strike due to which the sales performance for
the month of March has been affected adversely.” 6
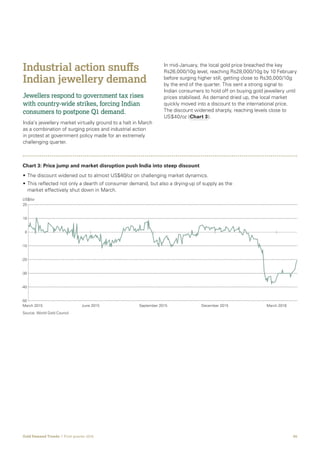
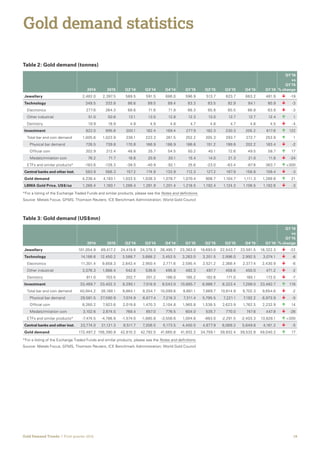
Taken in this context, demand for gold jewellery was
unsurprisingly weak. Quarterly demand of 88.4t was down
41% year-on-year and the lowest quarterly total since
Q1 2009. Importantly, though, we believe demand from
Q1 is postponed rather than lost. Most stores re-opened
in the second half of April, ahead of the Akshaya Tritiya
festival in early May and the start of the wedding season.
This view is also supported by the sharp narrowing of the
local discount as manufacturing activity resumed in April.7
The pro-rural budget and expectations for an above-average
monsoon should further support rural incomes, which
has positive implications for gold demand over the
coming quarters.
4 An excise duty of 1% on jewellery manufacturing was proposed in the budget. The introduction of this tax is a prelude to the Goods and Services Tax
(GST) Bill. Jewellery manufacturers whose turnover exceeded Rs12 crore during the preceding financial year will be liable to pay this additional tax
during current financial year.
5 All India Gems and Jewellery Trade Federation (http://gjf.in/domestic_news.html) and Indian Bullion and Jewellers Association
(http://ibja.co/ibja-news.aspx)
6 http://www.titan.co.in/TitanEcom/corporate/pdflinks/Investor%20Update/Q4%20FY%2015-16.pdf
7 The local discount immediately narrowed to US$16/oz as soon as the strike ended on 13 April, shrinking further to US$4/oz by the end of the month.](https://image.slidesharecdn.com/gdtq12016report-160512133441/85/Gold-Demand-Trends-Q1-2016-report-6-320.jpg)
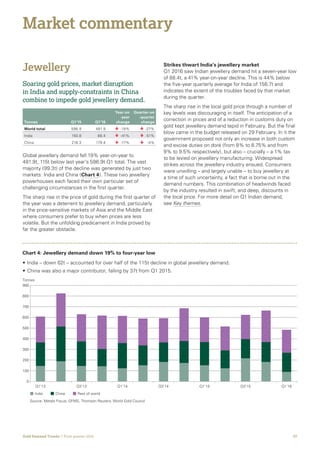
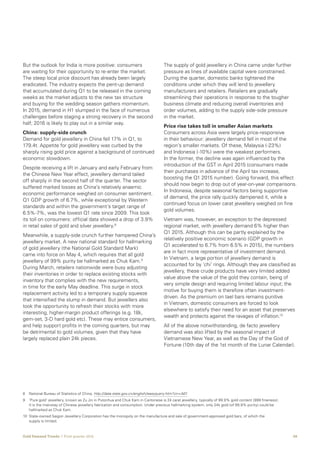

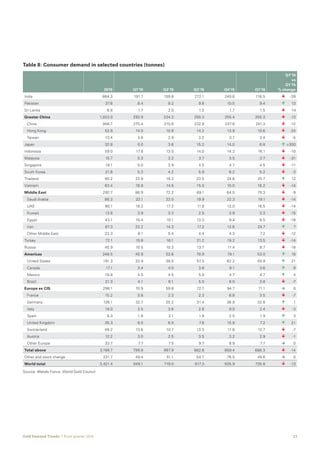

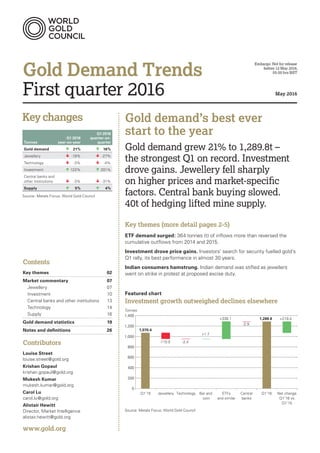
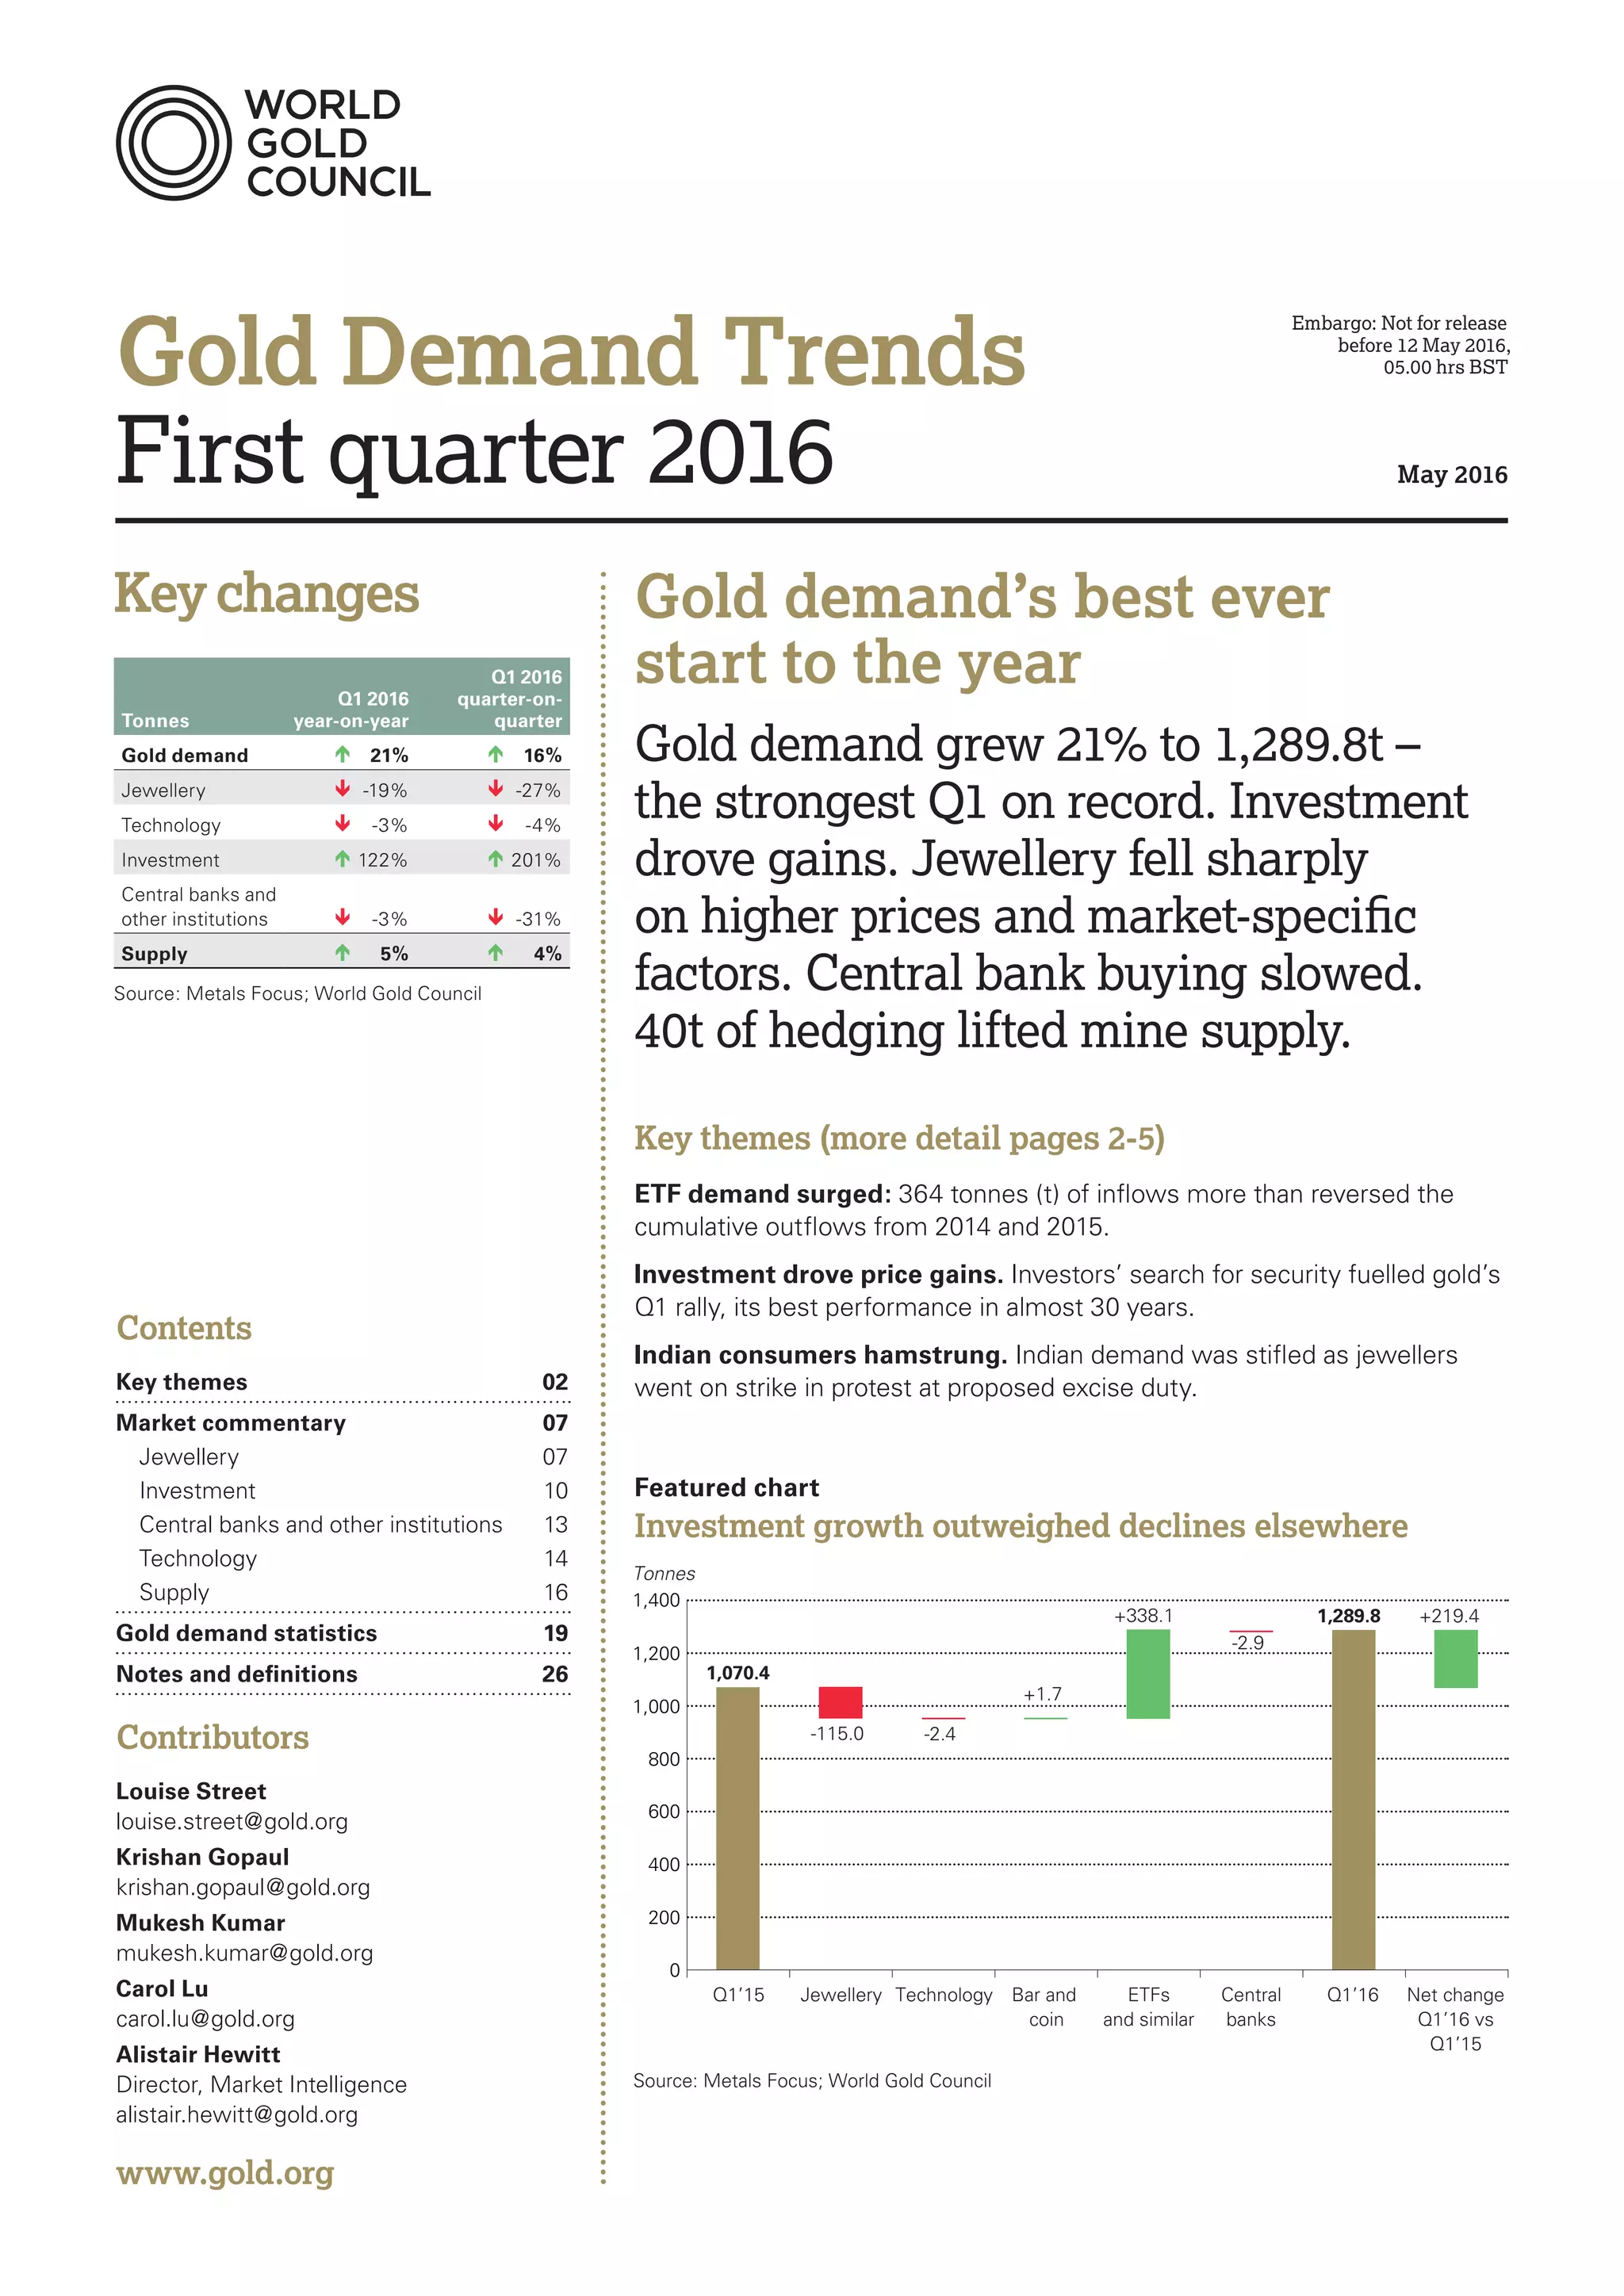
Gold demand grew 21% in Q1 2016 to the strongest start on record, driven by a surge in investment demand. ETF inflows of 364 tonnes more than reversed outflows from 2014-2015 as investors sought gold's security amid economic uncertainty. However, Indian jewellery demand fell sharply as jewellers went on strike in protest of a proposed excise duty, stifling consumer demand. Overall gains in investment outweighed declines in other sectors such as jewellery.


