Download to read offline
![03Gold Demand Trends | Second quarter 2016
1 Volume of Eagle gold coins in ounces to end-June 2016 (year-on-year): 501,000oz vs 273,000oz in H1 2015.
2 http://www.royalmint.com/aboutus/news/a-golden-year-for-britains-oldest-manufacturer-as-annual-results-reveal-a-silver-lining
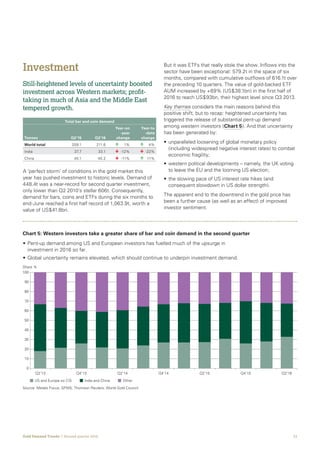
The speed of the upswing in investment was in no small
part due to the scale of pent-up demand that had built in
Western markets. We noted this phenomenon in Gold
Demand Trends Q1 2016, commenting that ‘…inflows
are from investors initiating or rebuilding strategic, long-
term holdings after the wash-out of positions since early
2013. …latent demand among investors who have been
looking for an opportunity to re-enter the market was a
key factor [driving ETF demand].’ And the trend continued
in the second quarter. Investors who had been awaiting a
catalyst to enter (or re-enter) the market found they had
reason enough to do so.
A number of factors turned the attention of the western
investor community towards gold in the opening months
of the year…and brought it even more sharply into focus in
the second quarter. Global monetary policy remained front
and centre. Negative interest rate policies (NIRP) in Japan
and Europe, combined with expectations of a slowdown in
the cycle of US rate hikes, underpinned investors’ gold-
positive sentiment, as did a growing optimism that gold’s
long term downtrend had come to an end. Heightened
uncertainty has further focussed their minds.
2016 has unleashed a variety of events creating economic
and political uncertainty, compounded by NIRP and further
highlighting gold’s role as a high-quality, liquid asset.
The US election, the UK referendum on EU membership
and possible implications of the ‘Brexit’ outcome, the
increasingly parlous state of Italy’s banking sector; these
have proved a potent combination as far as gold investors
are concerned. Add to that continued geopolitical unrest
in the Middle East and the investment case for gold
was cemented.
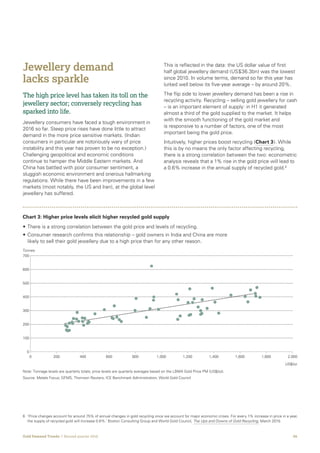
Smaller-scale investors have been very much in evidence
in many Western markets: demand for US gold Eagle coins
has jumped 84%1
so far this year. And the UK’s Royal Mint
has registered a sharp rise in profits, which it attributes
partly to the launch last year of ‘Signature Gold’, an online
offering allowing investors to make fractional purchases of
gold bars.2
The Mint also revealed a huge spike in demand
for this product after the result of the UK referendum.
Similarly, smaller-scale investors came out in droves in
other European markets, although this was countered
by some substantial profit-taking in June as the euro-
denominated gold price rallied to a two-year high.](https://image.slidesharecdn.com/gdtq22016report-160812101427/85/Gold-Demand-Trends-Q2-2016-report-3-320.jpg)
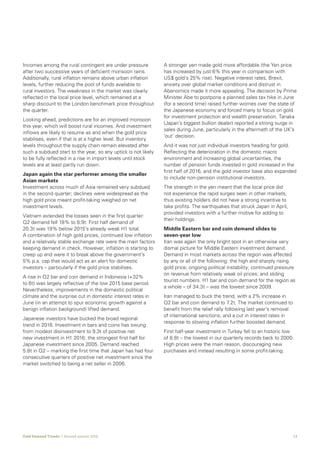
![09Gold Demand Trends | Second quarter 2016
The national strike by jewellers which had effectively
closed the market for six weeks, came to an end in
mid-April. But there was no relief rally. Consumers were
unprepared for the huge jump in the gold price when the
market re-opened. Despite the discount, domestic prices
pushed their way up to – and above – Rs30,000/10g, a
significant psychological barrier for Indian consumers and
the highest domestic price for more than two and a half
years. Consumers were not only put off by the high cost,
but also by the belief that such a price level would prove
only temporary. Aside from essential purchasing and
gifting around Akshaya Tritiya, demand was largely put on
hold awaiting lower prices as a buying opportunity.
Lower spending by rural Indians was another blow to
demand. The rural population accounts for more than
half of India’s jewellery demand, so any difficulty in this
sector has a material impact on demand. Two consecutive
years of deficient monsoon rainfalls have taken their toll
on rural incomes. This is clear in other sectors, too. Poor
rural spending has been cited as a reason for weak car
sales and demand for consumer goods. Commenting on
disappointing Q2 revenue figures for Hindustan Unilever
Ltd, CEO Sanjiv Mehta said that ‘The continued pressure
on areas with deficient monsoon are manifest from the
fact that …rural growth [has] lagged urban for another
quarter…’ 8
While IHS Automotive analyst Anil Sharma
noted that ‘Cars …derive a lot of volumes from… rural
markets. What we see… is a reflection of rural stress,
stemming from rainfall deficit in the last two years.’ 9
Lastly, the market continued to feel the reverberations
from government regulation. The introduction of an
additional 1% excise duty (which prompted the jewellers’
strike in Q1) and the requirement that purchases above
Rs200,000 need a Permanent Account Number (PAN)
card have acted as headwinds to the industry, impacting
demand in the organised sector most notably. An
unintended side-effect has been to increase the flow of
unofficial gold into India – in part as the trade attempts
to find ways around the legislation. Despite demand
remaining weak, an estimated 44t of smuggled gold
entered the market during the quarter. This is in line with
our 2016 full-year forecast range of 140–160t, up from
around 120t last year.
Faced with these regulatory challenges and the increase
in smuggling, India’s bullion sector continues to make
moves to formalise its business, with the intention that this
will also encourage the jewellery sector to do the same.
The large national and regional jewellery chains do not
oppose the implementation of the excise duty. But smaller,
independent and family-based retailers, who prefer to
use cash-based transactions, are opposed to the duty
and the additional administrative and financial burden it
creates. The ‘Bullion Federation of India’, an industry body
composed of 50 leading bullion dealers across
17 states, was created amid a groundswell of intention
to conduct their business in a transparent way, avoiding
any unaccounted money and fully complying with tax
requirements and regulation.
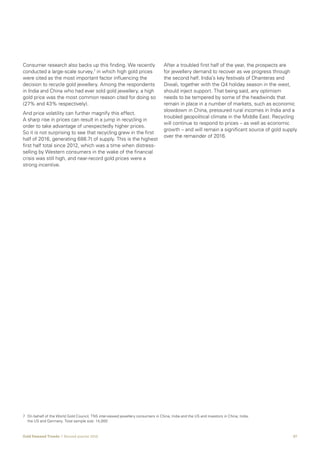
High prices and low economic growth weigh on
Chinese consumer sentiment
Gold jewellery demand in China was similarly weak, but
– with the exception of the high gold price – the reasons
were somewhat different. Q2 demand fell 15% to 143.5t.
Following on from the disappointing first quarter, this
resulted in the lowest first half total for Chinese jewellery
since 2012 (322.5t). Weak consumer confidence was the
backdrop to this picture.
In China, the relatively high volatility in the gold price
proved to be off-putting for many who were concerned
that the swift price rise may just as quickly be reversed.
This also helps to explain the jump in recycling activity
during Q2, which reached a 9-quarter high.
The broader background to the slow jewellery environment
was China’s continued general economic slowdown. GDP
growth held steady at a relatively weak 6.7% in Q2 2016
and this continued to weigh on consumer sentiment.
Changing consumer tastes in China are also having
a continued impact on demand volumes. A shifting
preference for fashionable, unique, highly-designed 18k
or gem-set pieces has come at the expense of traditional
24k jewellery. This trend may continue, given the younger
profile of 18k gold jewellery customers as highlighted
by our consumer research. Our survey showed that, of
the more-than 1,000 respondents who had bought gold
in 2015, 18–30 year olds were more likely to buy 18k
jewellery than 24k (39% vs 25%).
8 Comment made during HUL Q2 2016 Earnings call, 18 July 2016; https://www.hul.co.in/Images/jq-16-transcript_tcm1255-484738_en.pdf
9 http://asia.nikkei.com/Business/AC/India-car-sales-fall-in-May-on-weak-rural-demand](https://image.slidesharecdn.com/gdtq22016report-160812101427/85/Gold-Demand-Trends-Q2-2016-report-9-320.jpg)
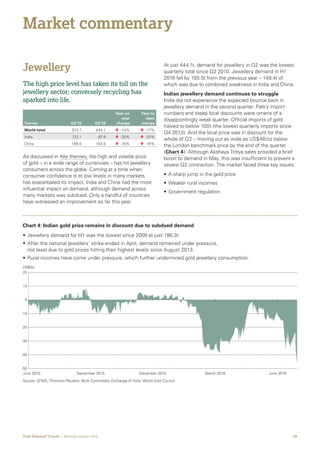
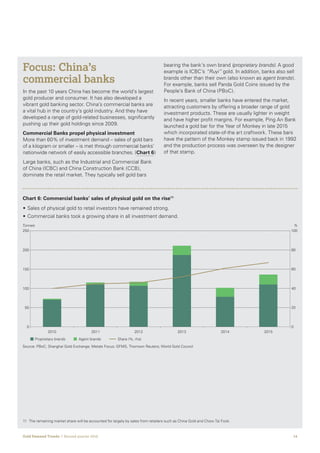
![12Gold Demand Trends | Second quarter 2016
Demand for gold bars and coins in Q2 (211.6t) was
marginally firmer year-on-year. This took H1 investment
to 484.7t, 17% down on the previous six-month period,
but 4% higher than the first half of last year. Within this
category, coin demand was the most robust while demand
for medals and imitation coins deteriorated (the latter being
almost a pure reflection of weak demand in India).
Positive sentiment in Western markets, combined
with lacklustre demand in India and China, resulted
in Europe being the largest market for gold bars and
coins in Q2
After a solid start to 2016, European investment demand
remained well supported in the second quarter – broadly
stable at 44.7t (a figure that made it the largest gold retail
investment market). For the first half-year, investment was
fractionally ahead of 2015 at 104t. Intra-quarter trends
reveal strong buying in April and May, which were largely
cancelled out by a surge in profit-taking in June as the gold
price jumped 9% in euro terms and 19% in pound sterling
over the course of the month.
While the widely unexpected result of the referendum
came too late in the quarter to materially impact European
investment numbers for Q2, there was undoubtedly
considerable interest in gold both in the run-up to, and
aftermath of, the decision. This is supported by the Royal
Mint, which stated that “one week on from the Brexit
vote… [we] … continued to see strong activity from
investors”. Further evidence of this trend comes from
online gold platform BullionVault’s analysis, which in
early July noted that although gold buying among private
Western investors had “raced to the fastest pace in three
years amid last month’s Brexit referendum and financial
shock,” this was matched by profit-taking as gold “jumped
in price like never before.”
Within Europe, there were some slight differences
across markets. The UK in particular showed heightened
interest in gold investment products as the prospect
of the referendum at the end of the quarter generated
considerable caution among investors, although volumes
remain small. Q2 demand jumped 65% to 3t. The H1 total
reached a three-year high of 6.2t.
Contrastingly, in Germany, bar and coin demand for Q2
of 21.9t was 5% below Q2 last year. Two-way activity
was healthy, but the heavy selling that kicked in after the
sharp June price increase outweighed buying among
retail investors.
US investors respond to sharp price moves
Investor behaviour in the US during the second quarter
was a repeat of Q1: bar and coin investment closely
mirrored the surge in demand for ETFs. First half demand
for gold retail investment products was 75% higher than
2015, boosted by the sharp price increase. Sales of gold
coins by the US Mint went through the roof. The number
of 1oz Eagle coins sold in the first six months of 2015
more than doubled – to 405,000 from 198,500 in 2015
– and these coins were far more popular than smaller
denomination (half- and quarter-oz) coins. Trade data
also showed a huge influx in imports of gold coins from
other countries.
Chinese investors see price rally as profit-taking
opportunity
Chinese investment dropped off in the second quarter:
demand halved from Q1 to 40.2t, an 11% year-on-year
decline. Nonetheless, the H1 total of 121.4t was the
strongest since 2013’s exceptional surge.10
Profit-taking activity was boosted by price volatility: the
spike in the price encouraged considerable liquidations,
particularly as many expected a near-term correction
to follow. A similar pattern was seen in activity in Gold
Accumulation Plans (GAP), with a sharp increase in
redemptions outweighing a healthy increase in gross
inflows. A more detailed explanation of these products
and the role they play in helping to meet investor needs is
covered in the Focus Box ‘China’s commercial banks.’
However, Chinese investors’ appetite for gold products
goes beyond just bars and coins. The sector has seen
increasing competition from other products, as reflected
in the sharp rise in gold-backed ETFs over H1 2016 from
6.3t to 24.4t.
Price volatility and weak rural incomes undermine
Indian investment
India’s gold market was very weak between January and
June: imports plummeted as supply-led weakness was
compounded by high and volatile gold prices. H1 bar and
coin demand of 61.2t (-22%) was the lowest first half
total since 2009. Notably, this is 9% lower than average
quarterly demand over the last five years.
Demand in Q2 did not replicate the severe declines seen
in Q1, but was weak nonetheless – down 12% year-on-
year at 33.1t. Akshaya Tritiya offered some respite after
the difficult start to the year, with the strike in the Indian
jewellery sector (which restricted investment demand,
due to the importance of the jewellery retail network as
a distribution channel for gold investment products to the
rural community in particular). But sharp, volatile gold price
increases deterred investment-related purchases.
10 World Gold Council, Gold market update Q2 2013 http://www.gold.org/search/research/market%20update](https://image.slidesharecdn.com/gdtq22016report-160812101427/85/Gold-Demand-Trends-Q2-2016-report-12-320.jpg)


The document discusses gold demand trends in the second quarter of 2016. Some key points: - Investment demand for gold reached a record high in the first half of 2016, accounting for almost half of overall demand. This was driven by strong inflows into gold-backed ETFs from Western investors seeking a hedge against economic and political uncertainty. - The gold price increased substantially in the first half of the year, rising 25% which was its strongest first half performance since 1980. However, high volatility impacted consumer demand, with jewellery demand declining. - While investment momentum may be difficult to sustain, positive sentiment among large Western investors appears founded due to ongoing global uncertainties from issues like the UK's Brexit vote


![Awareness of digital currency[1] (1).pptx](https://cdn.slidesharecdn.com/ss_thumbnails/awarenessofdigitalcurrency11-260125155504-b1badee4-thumbnail.jpg?width=640&height=640&fit=bounds)


