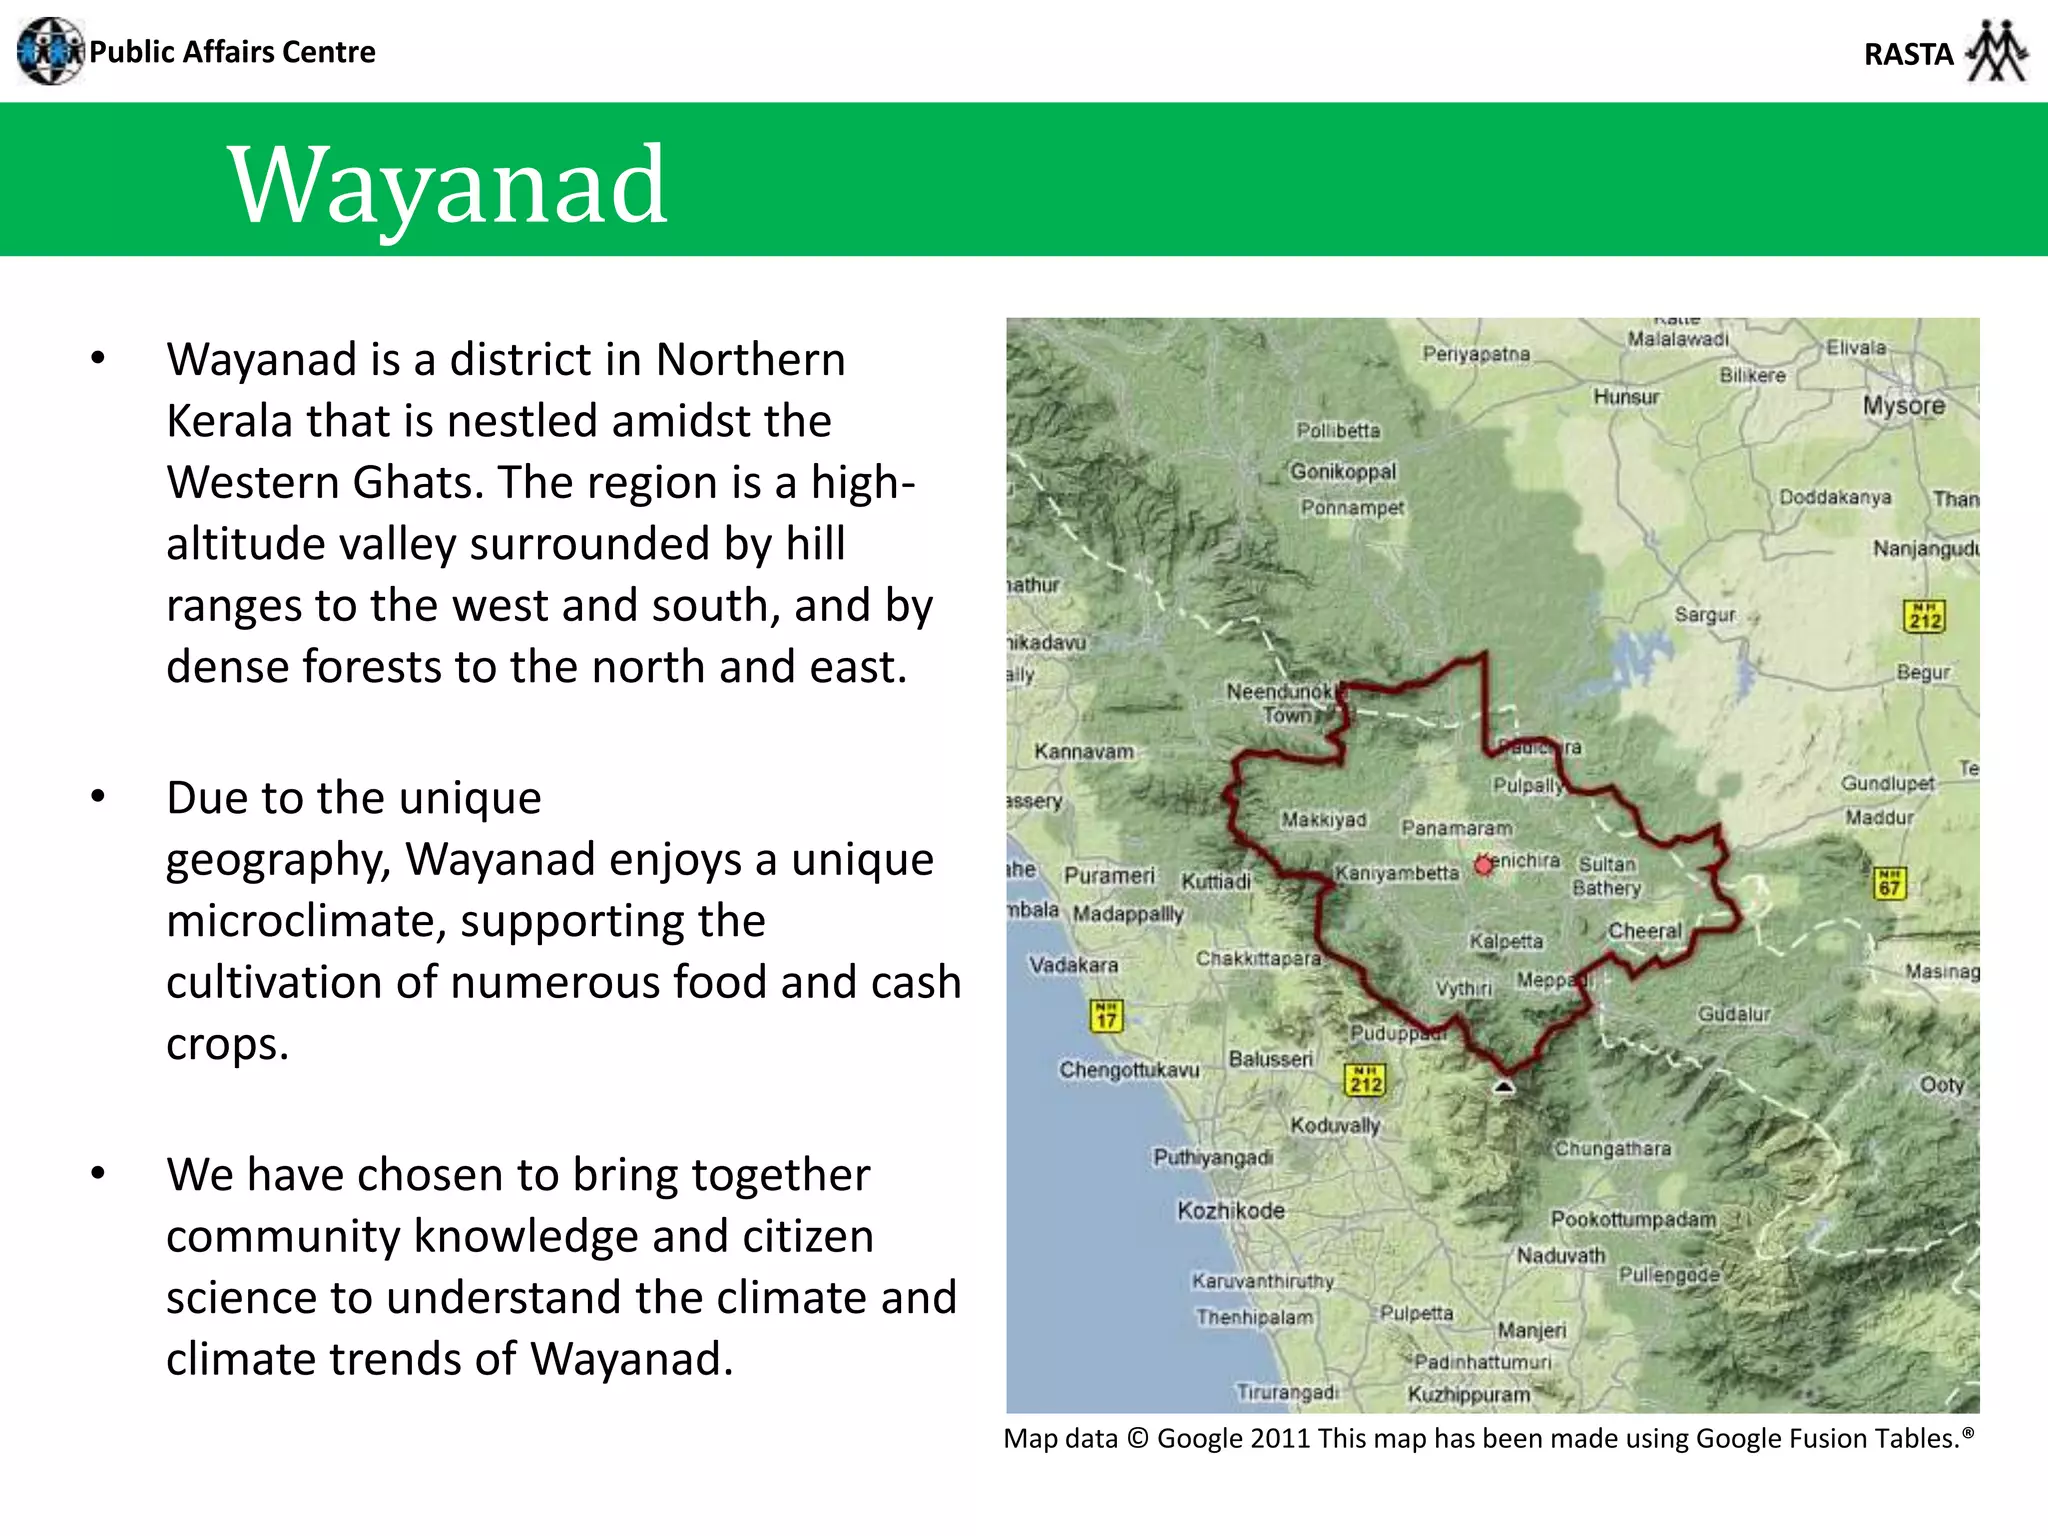
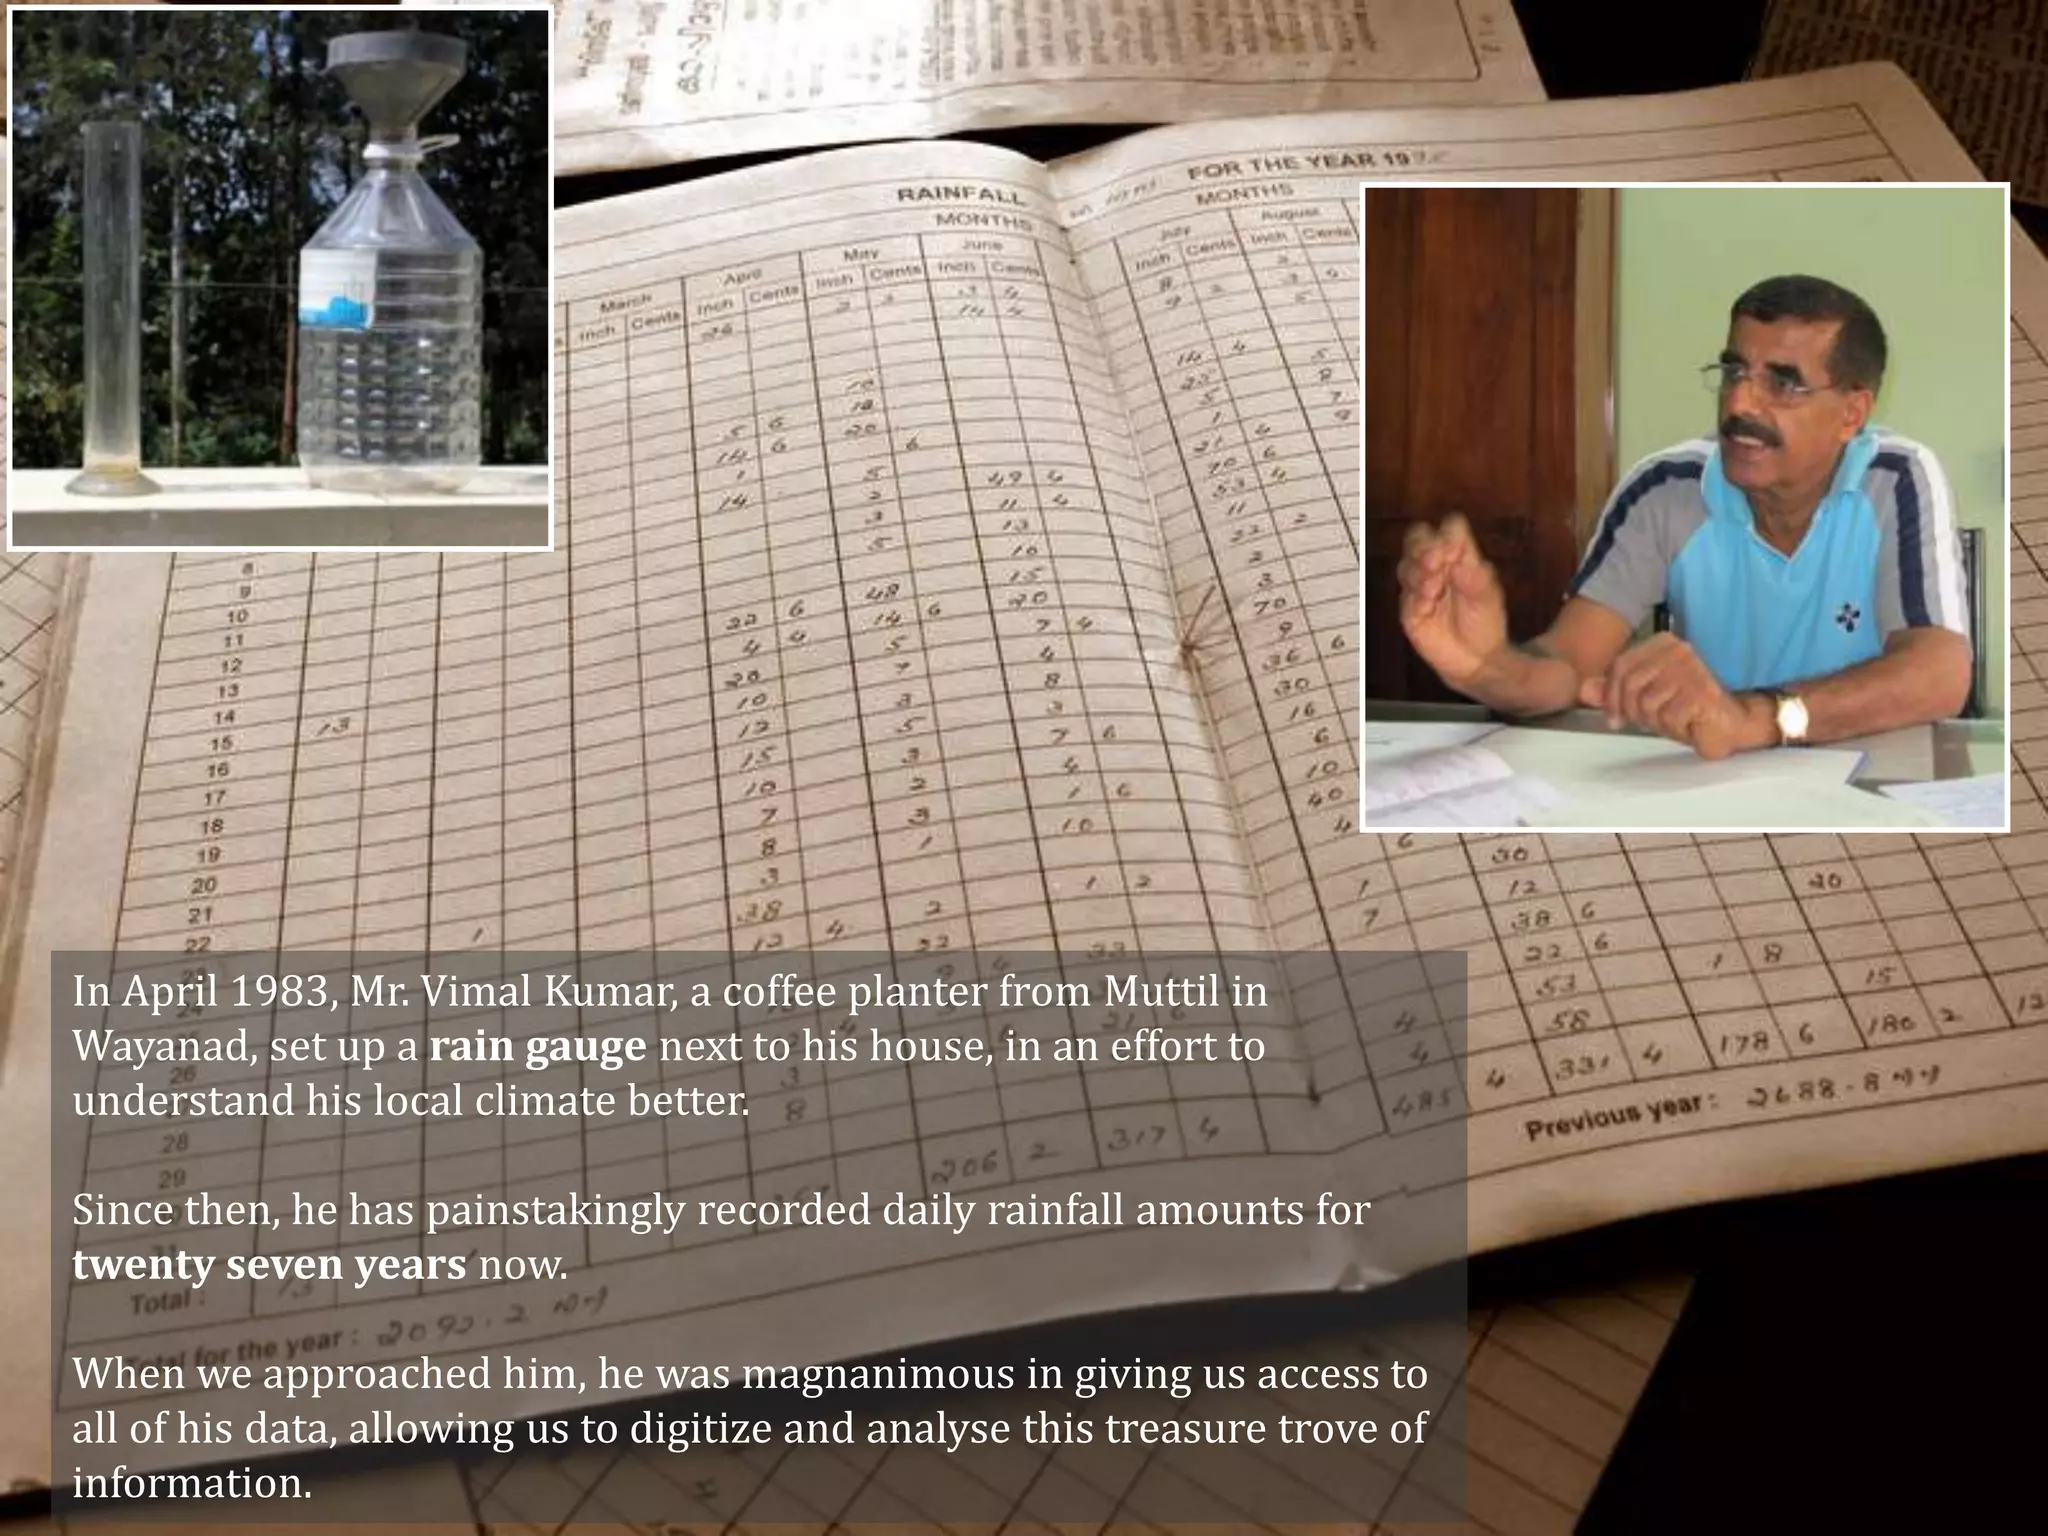
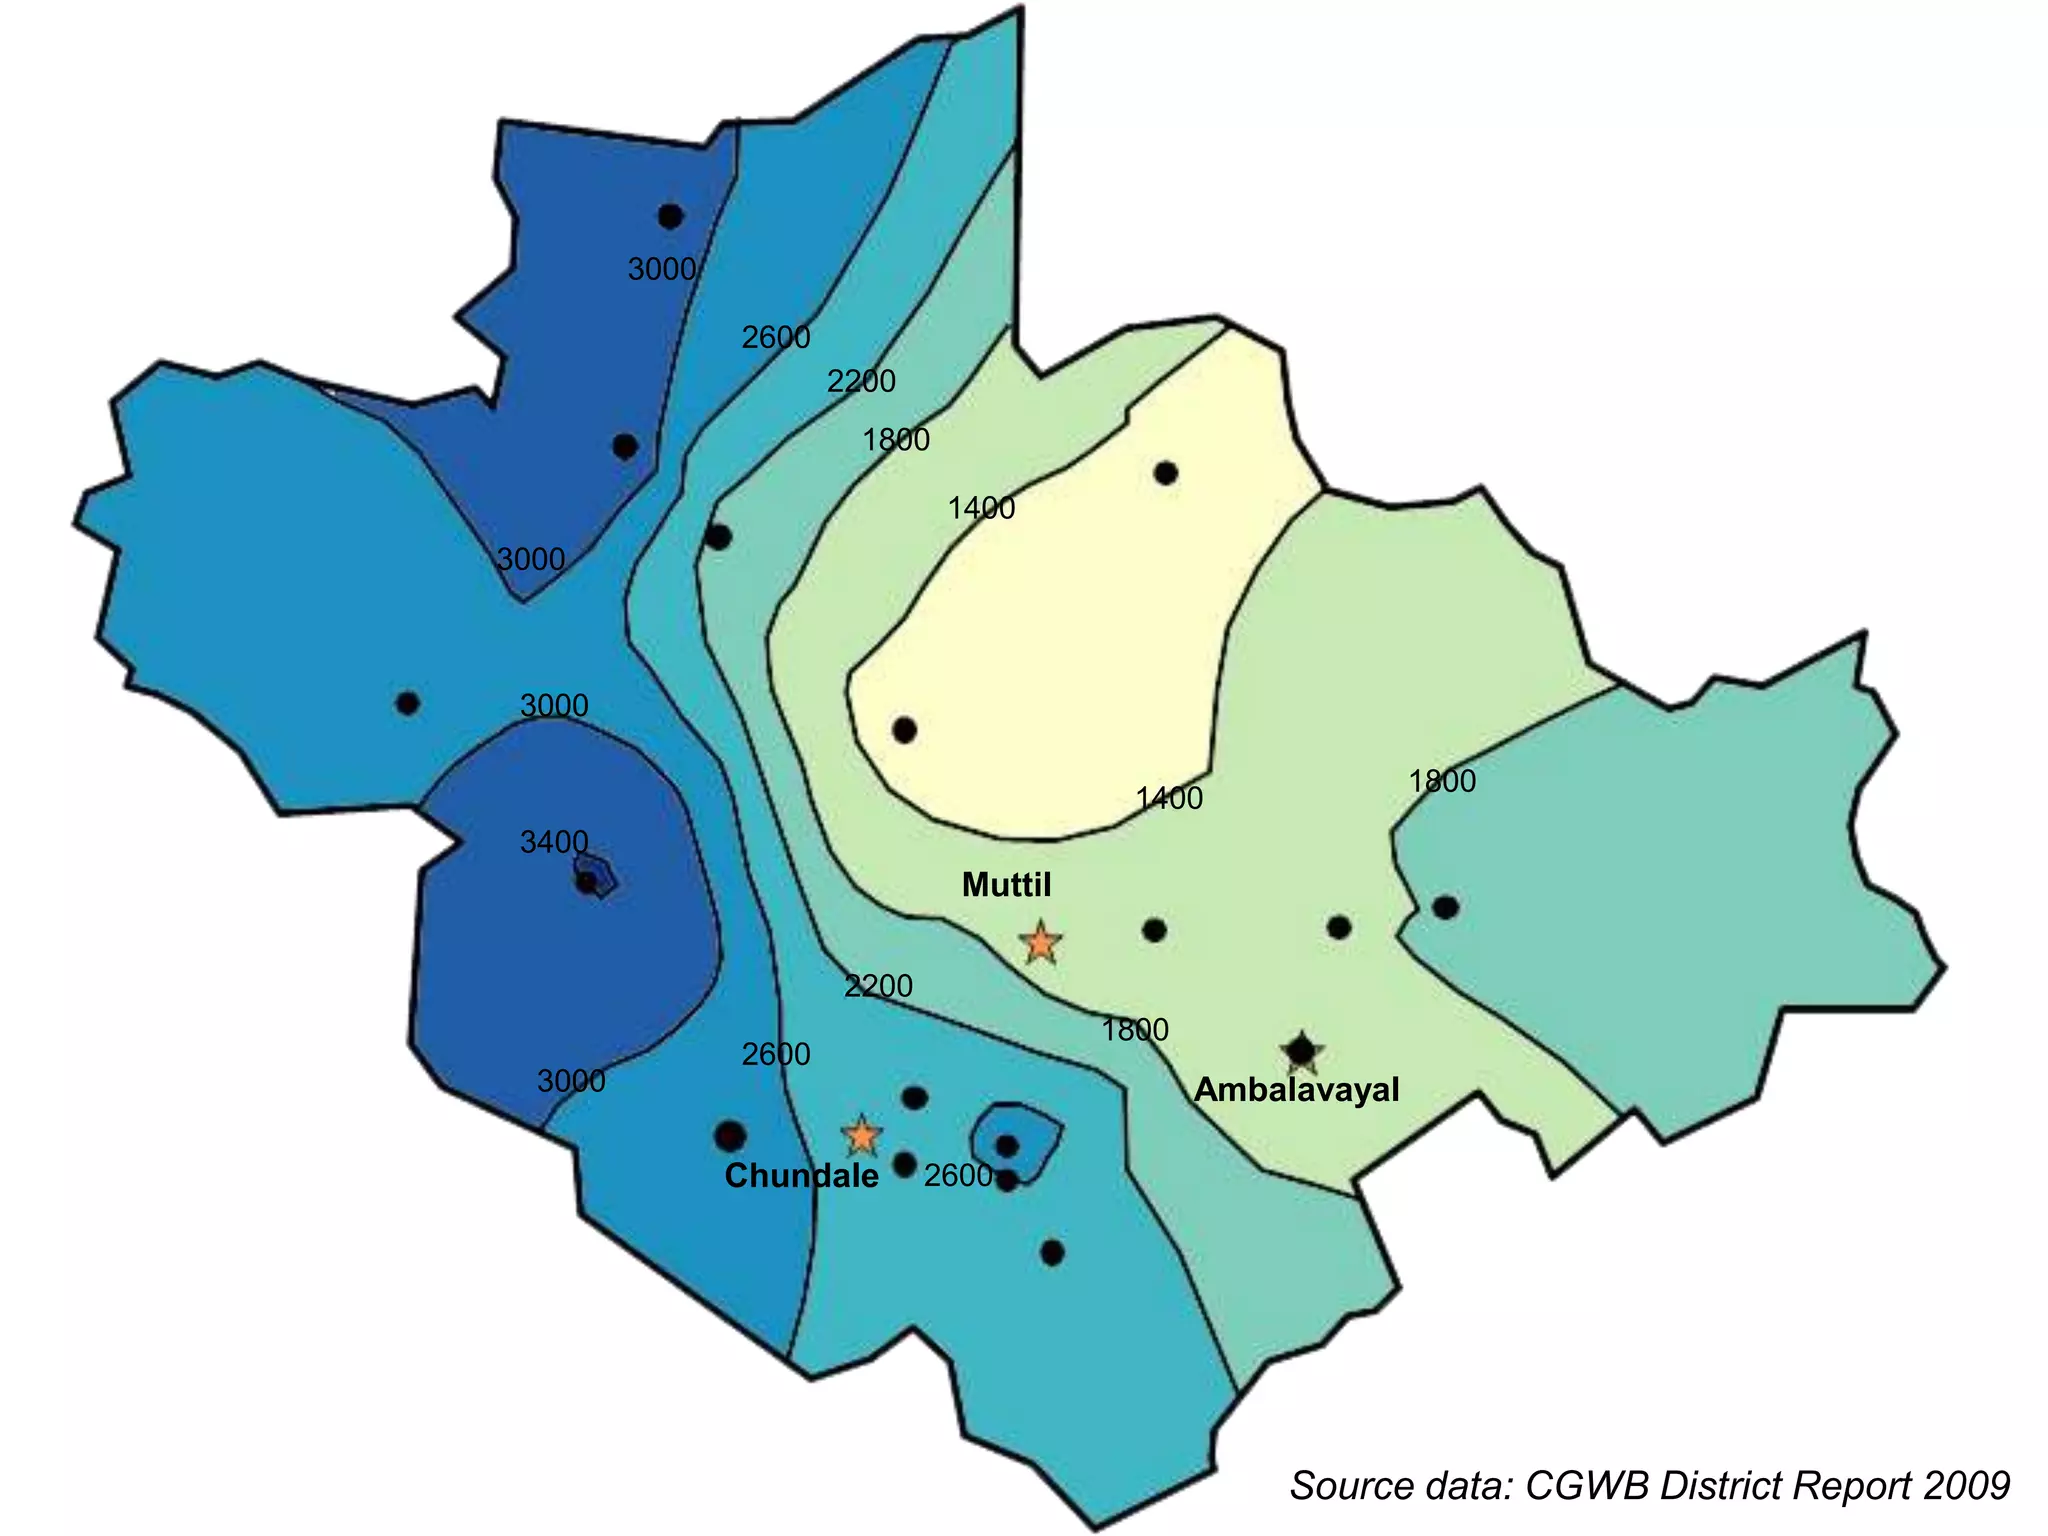
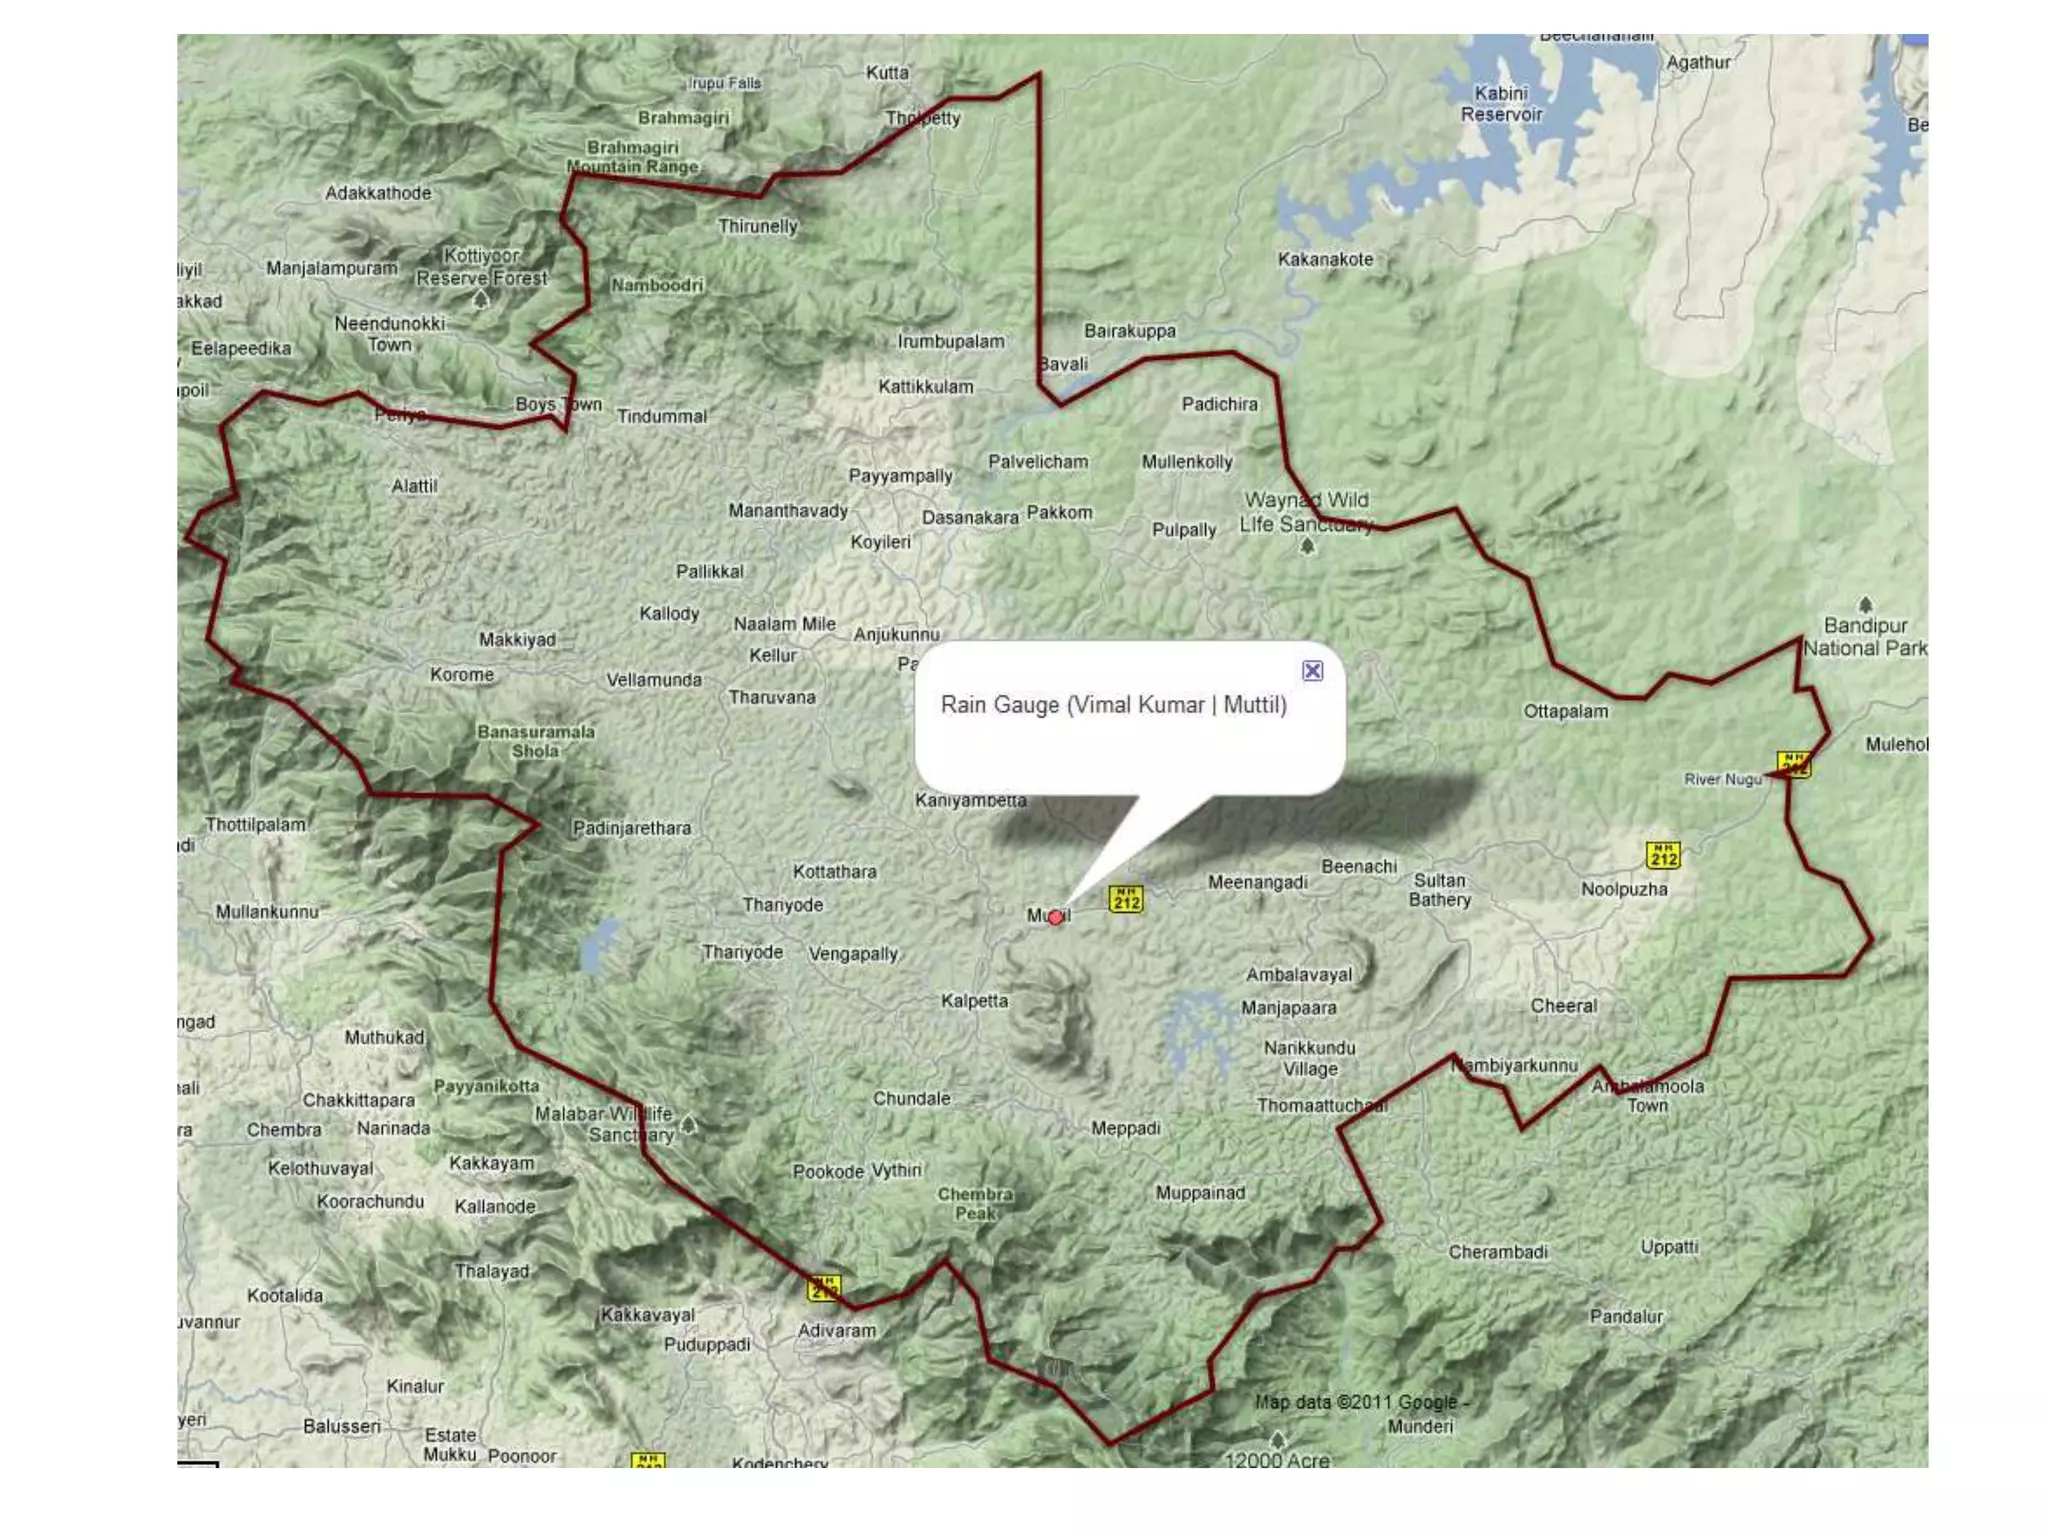
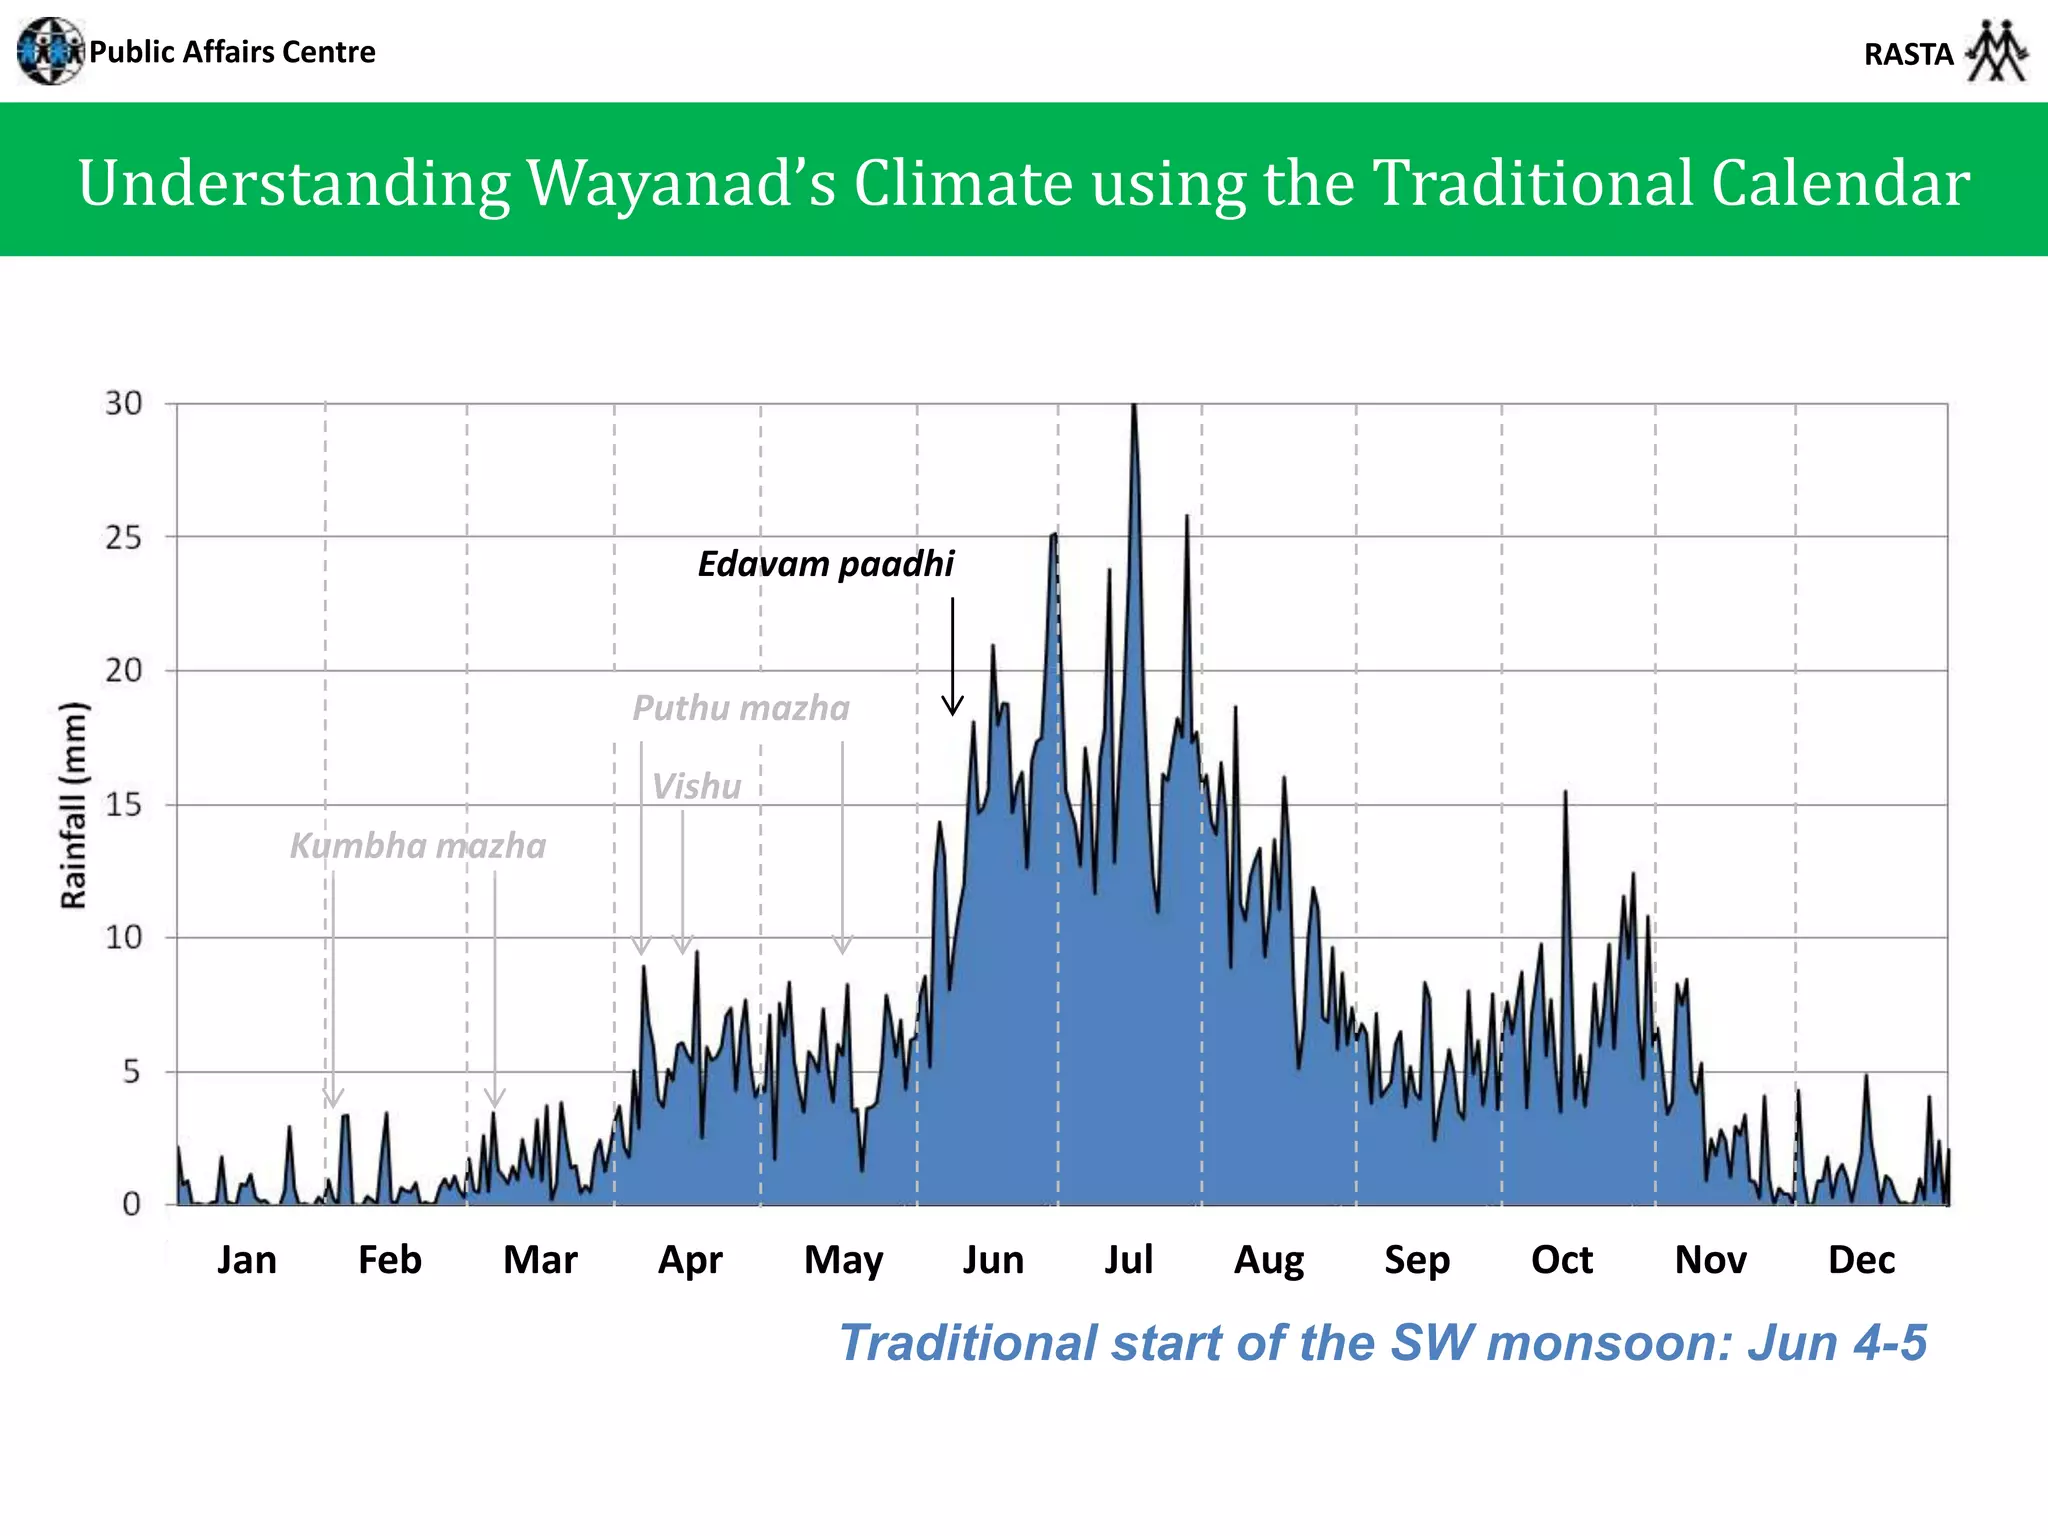
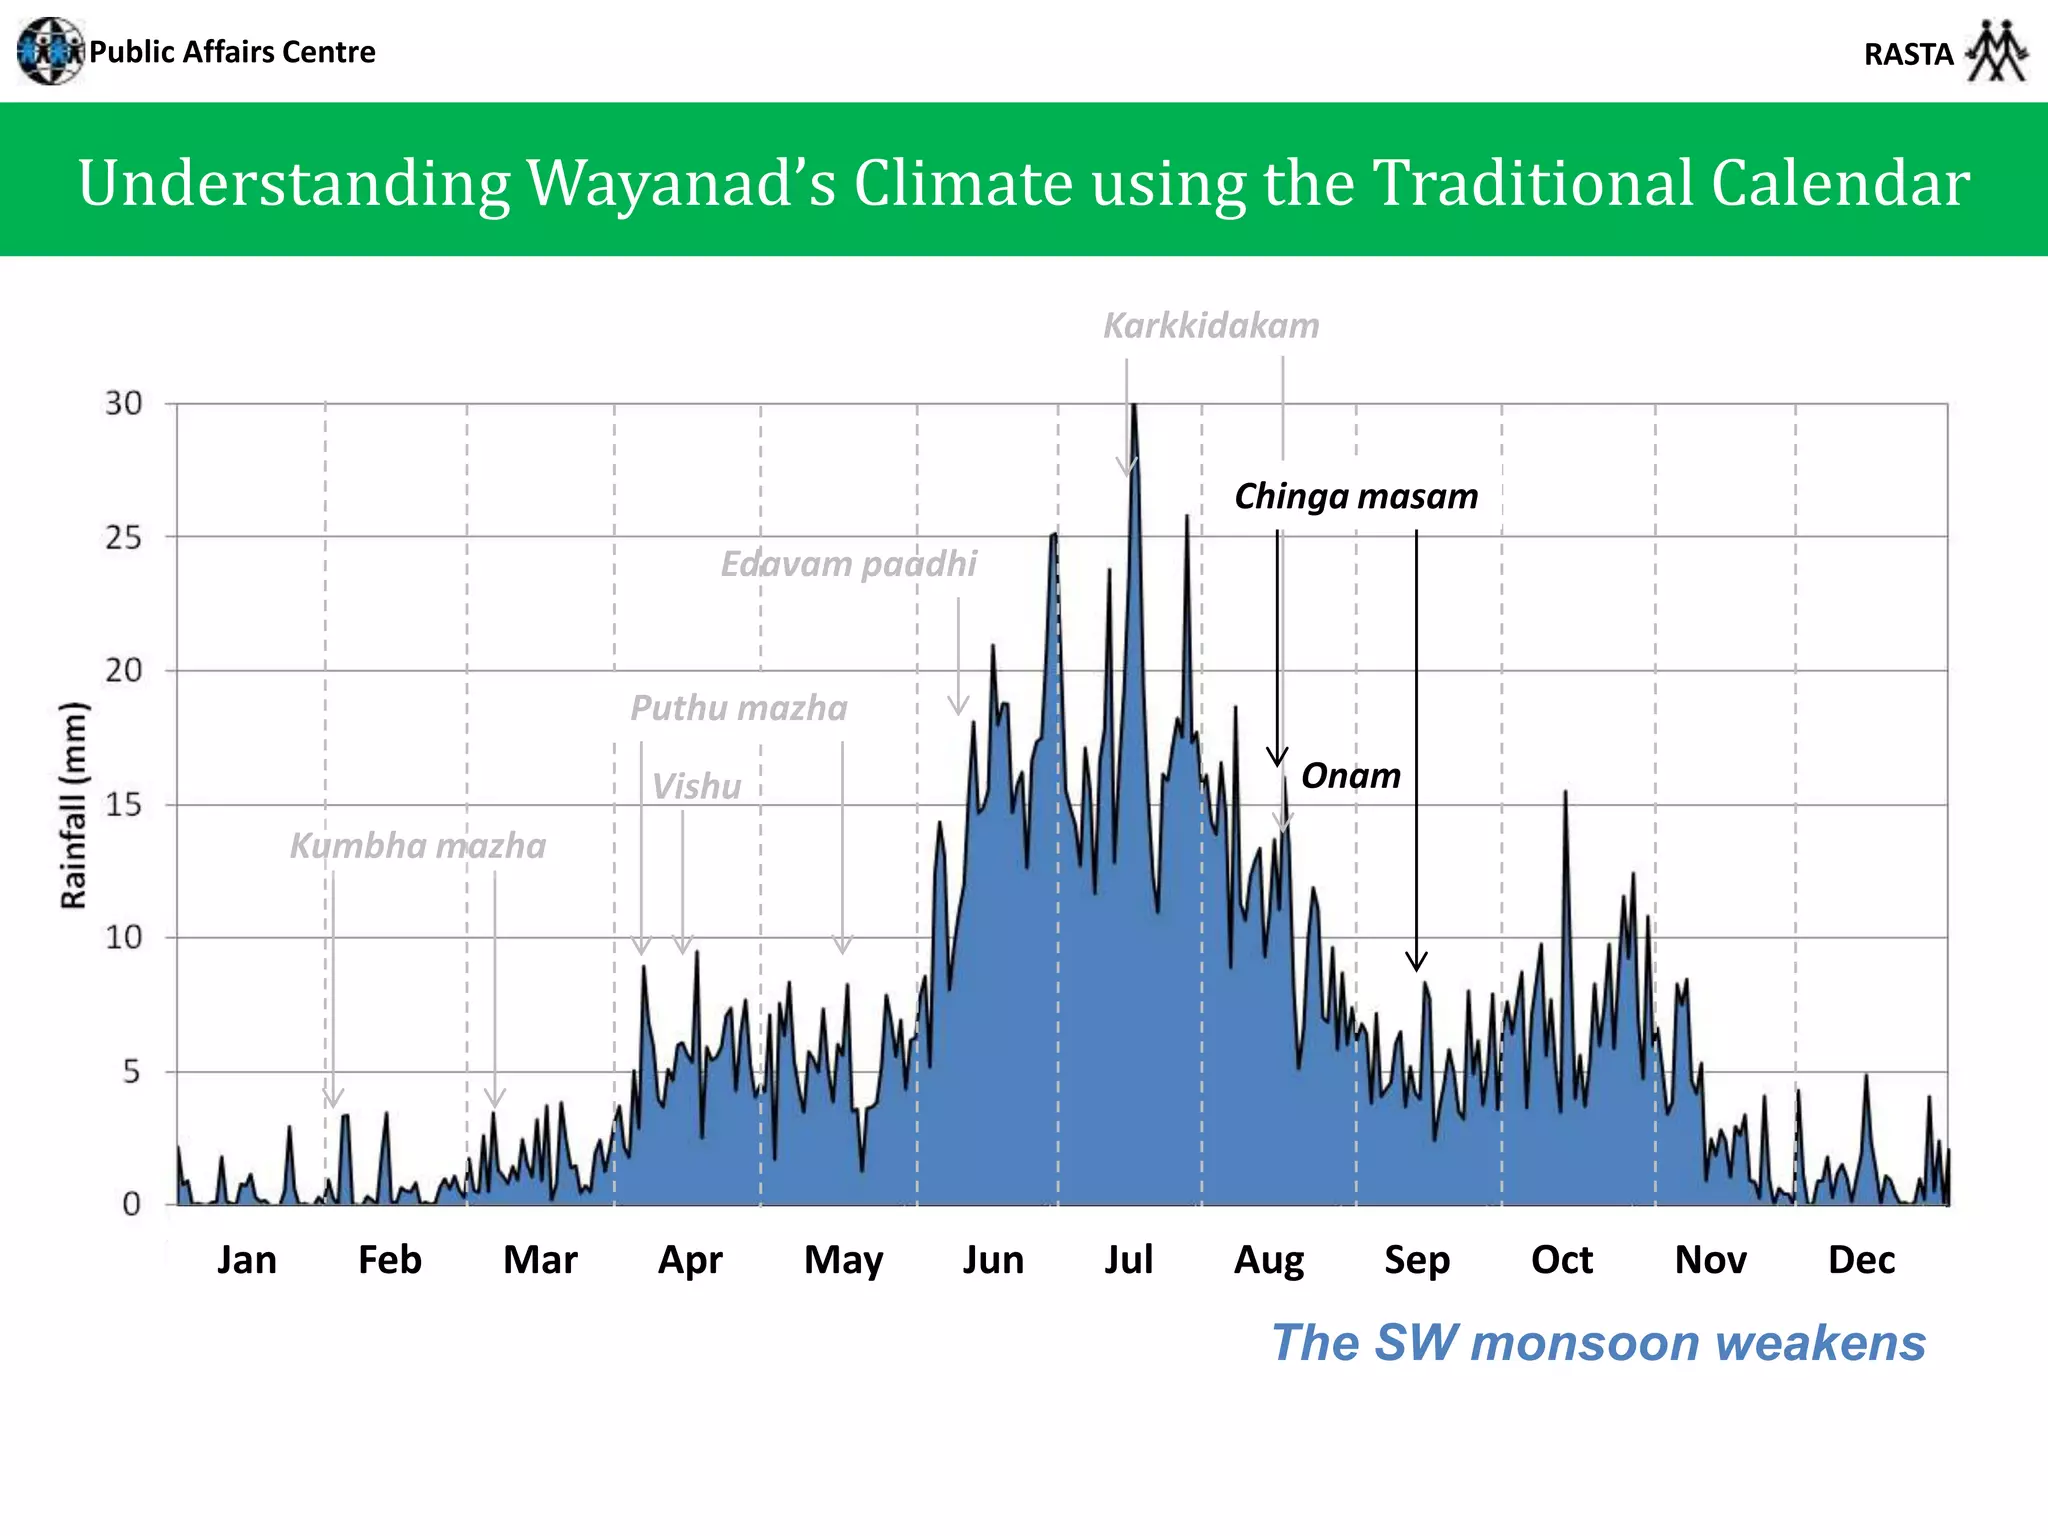
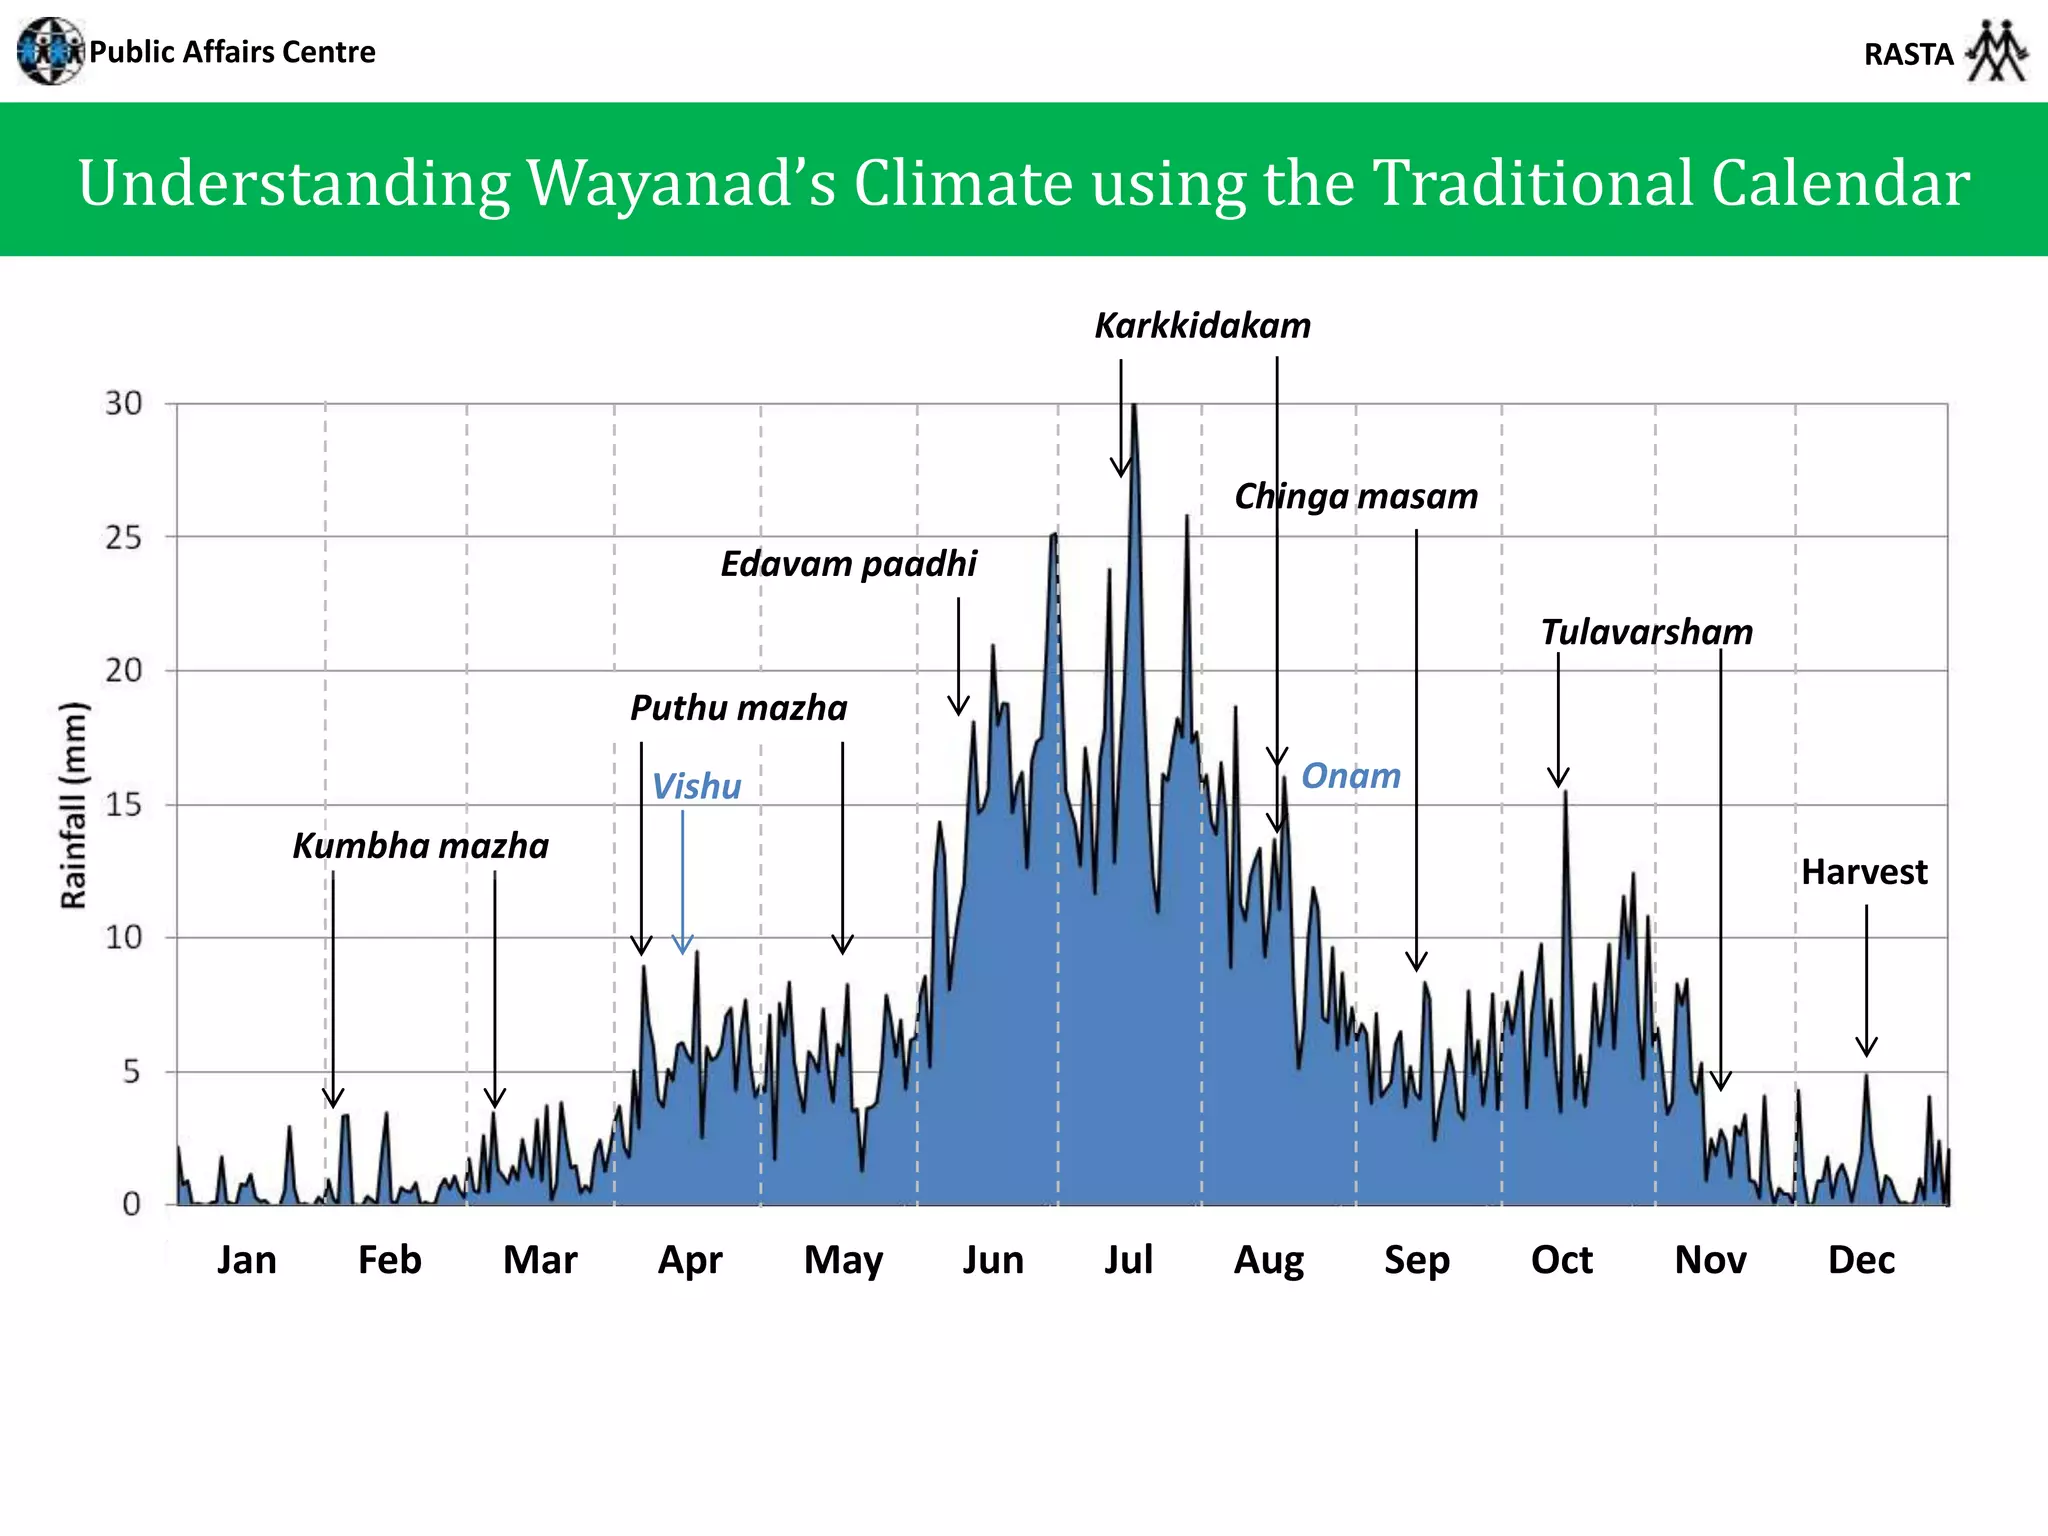
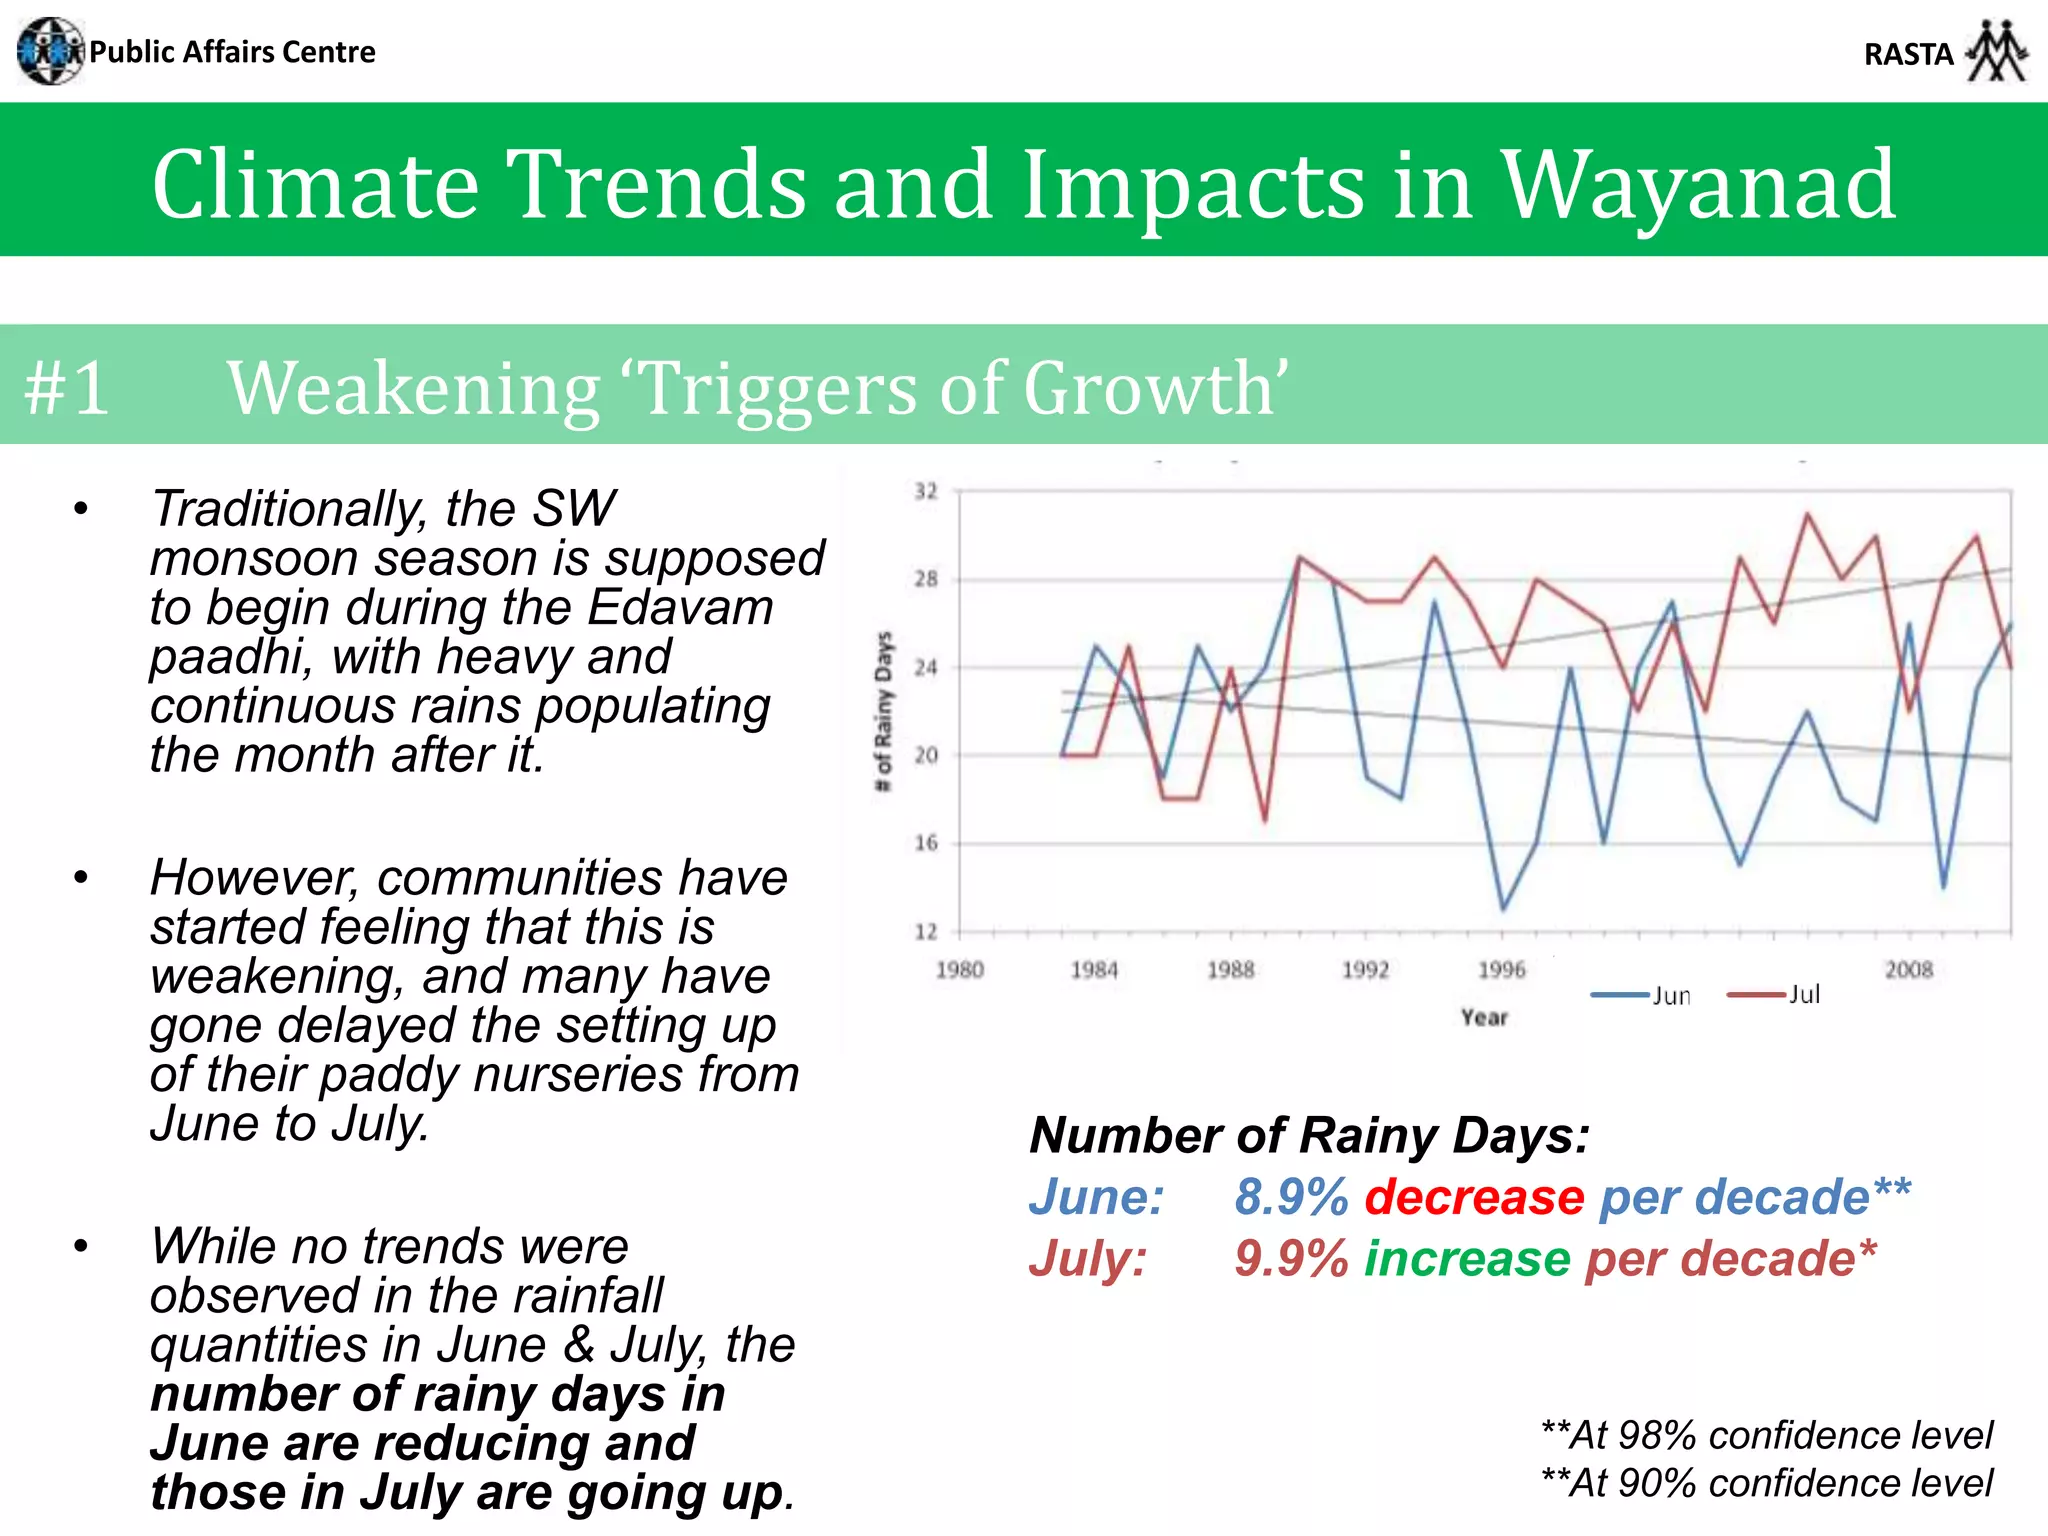
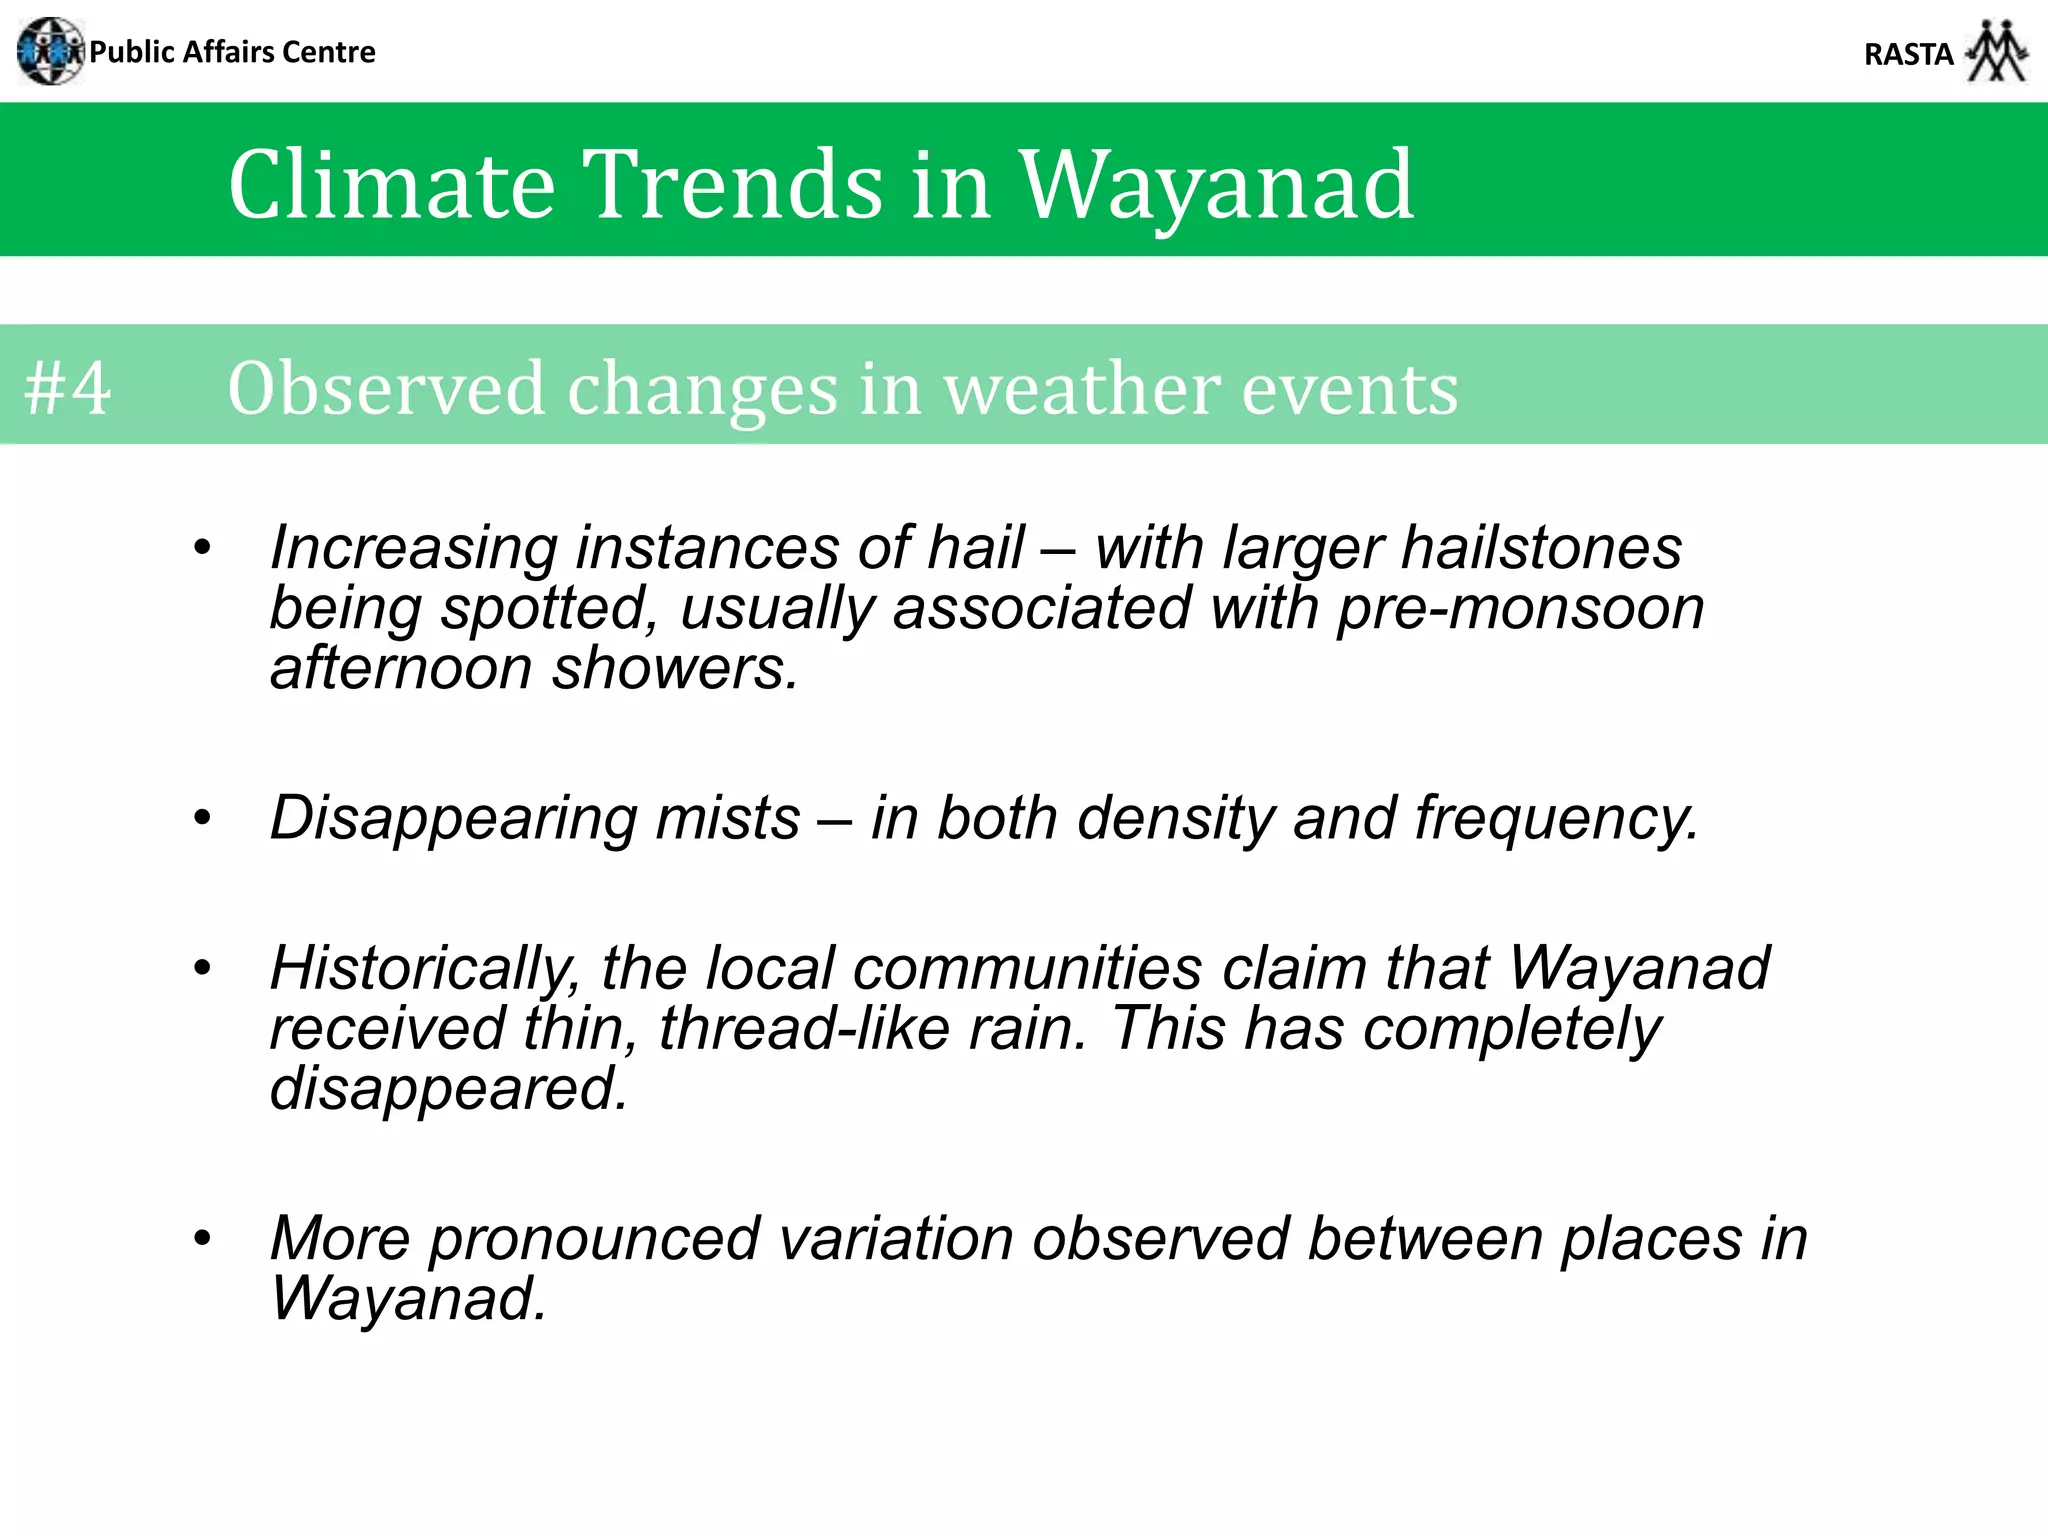
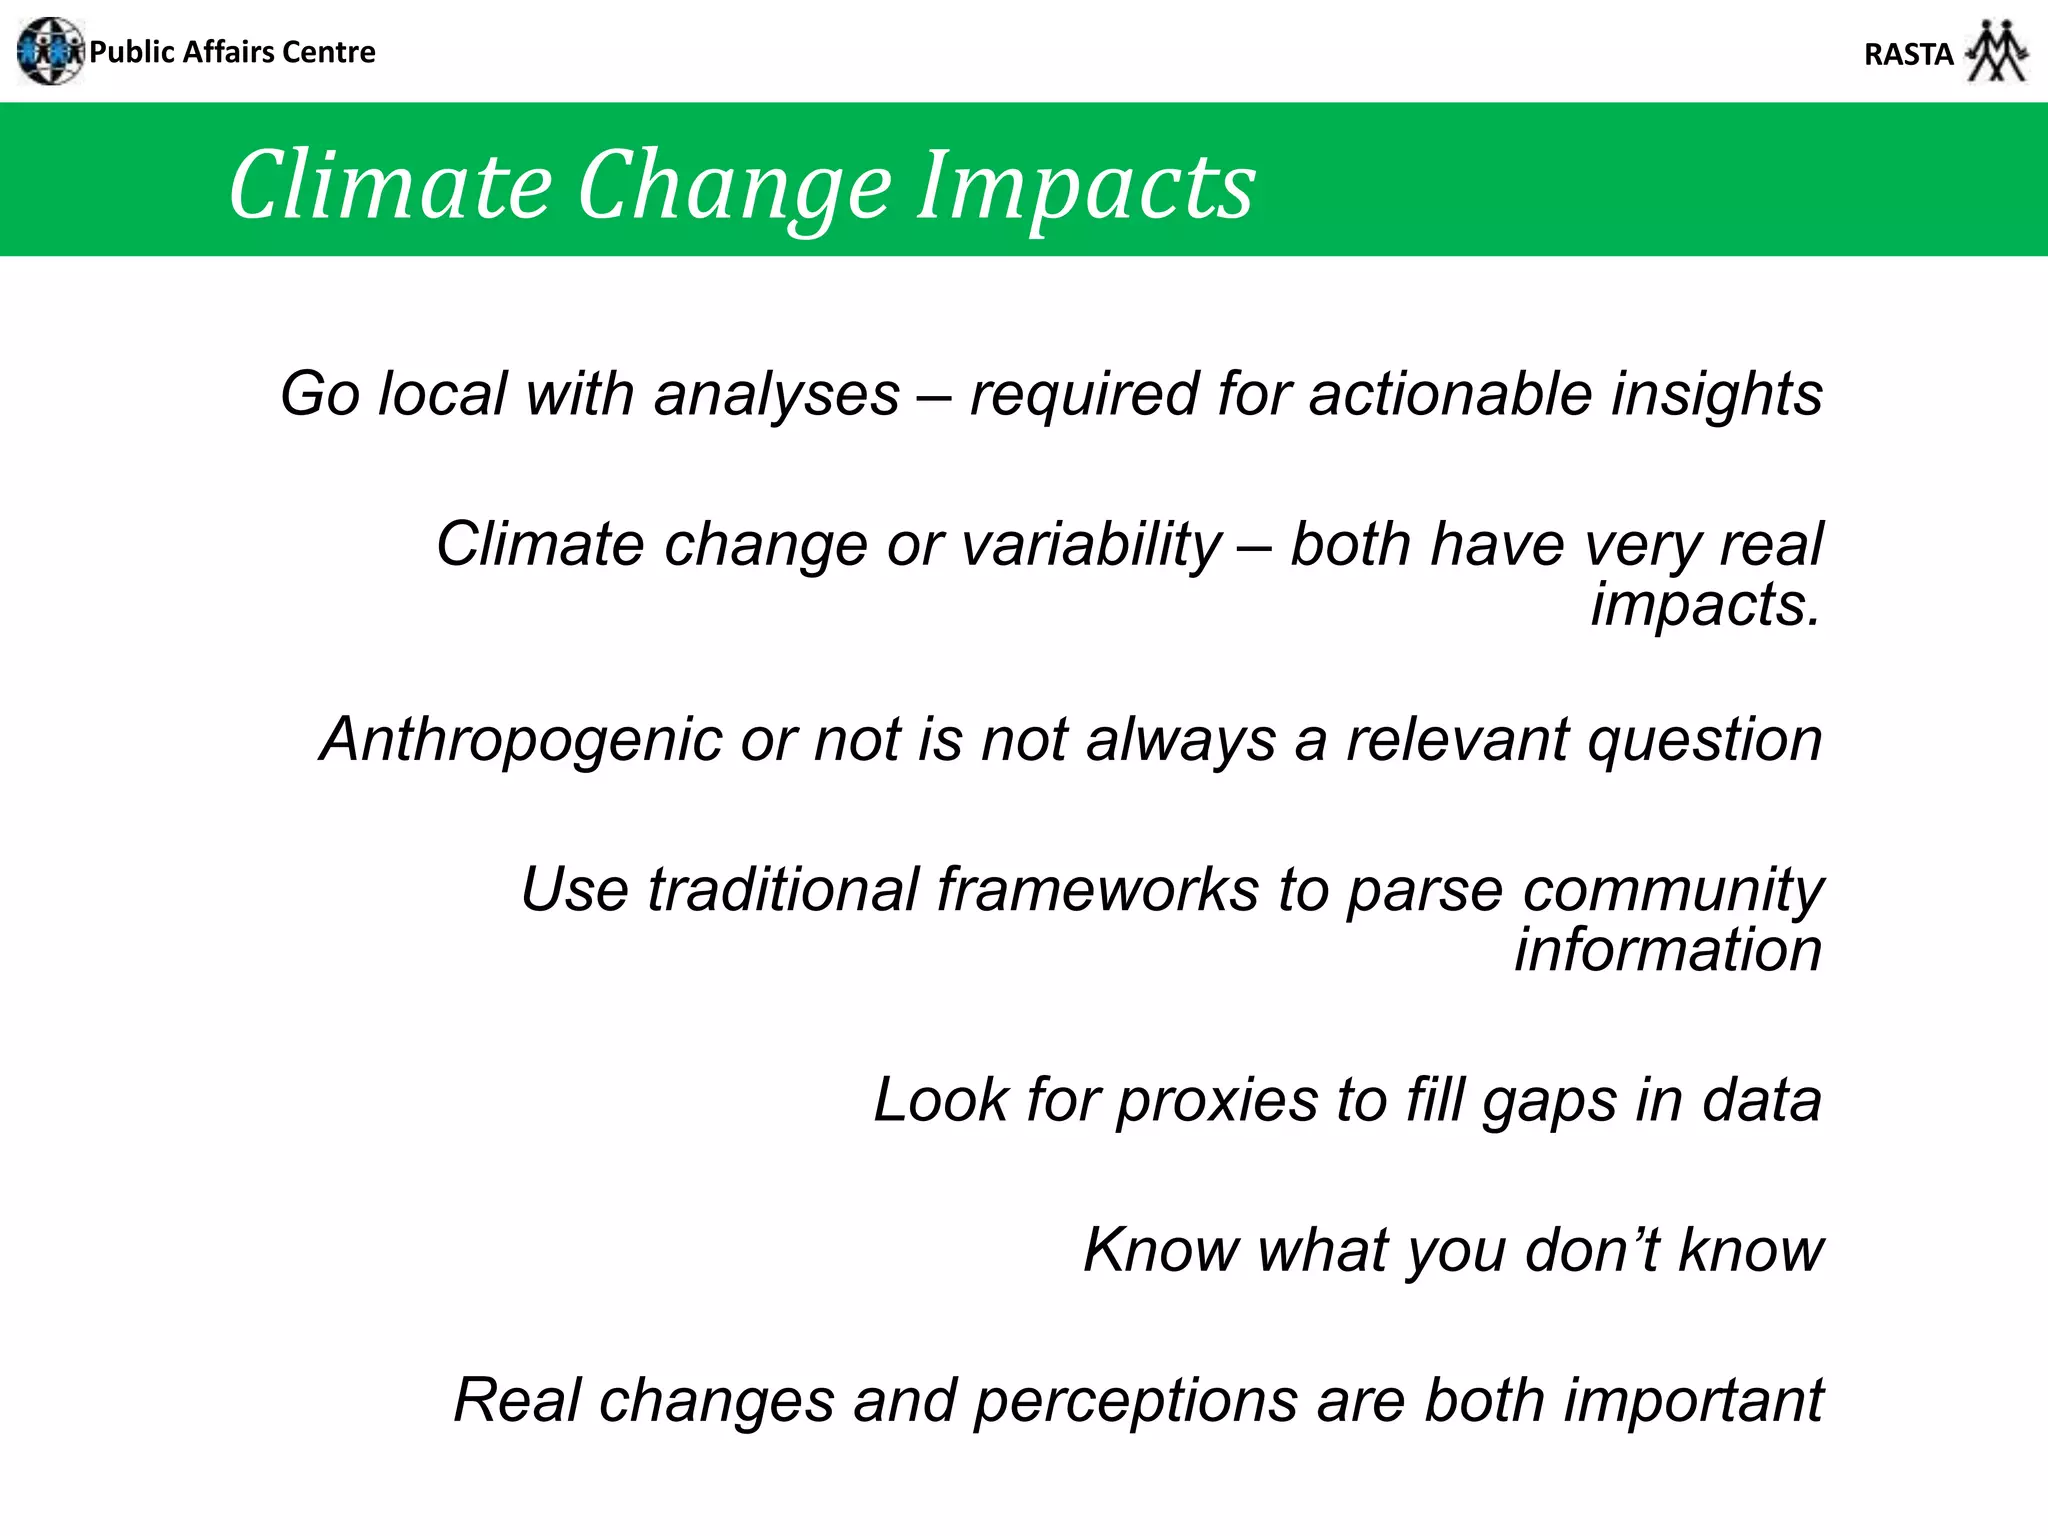
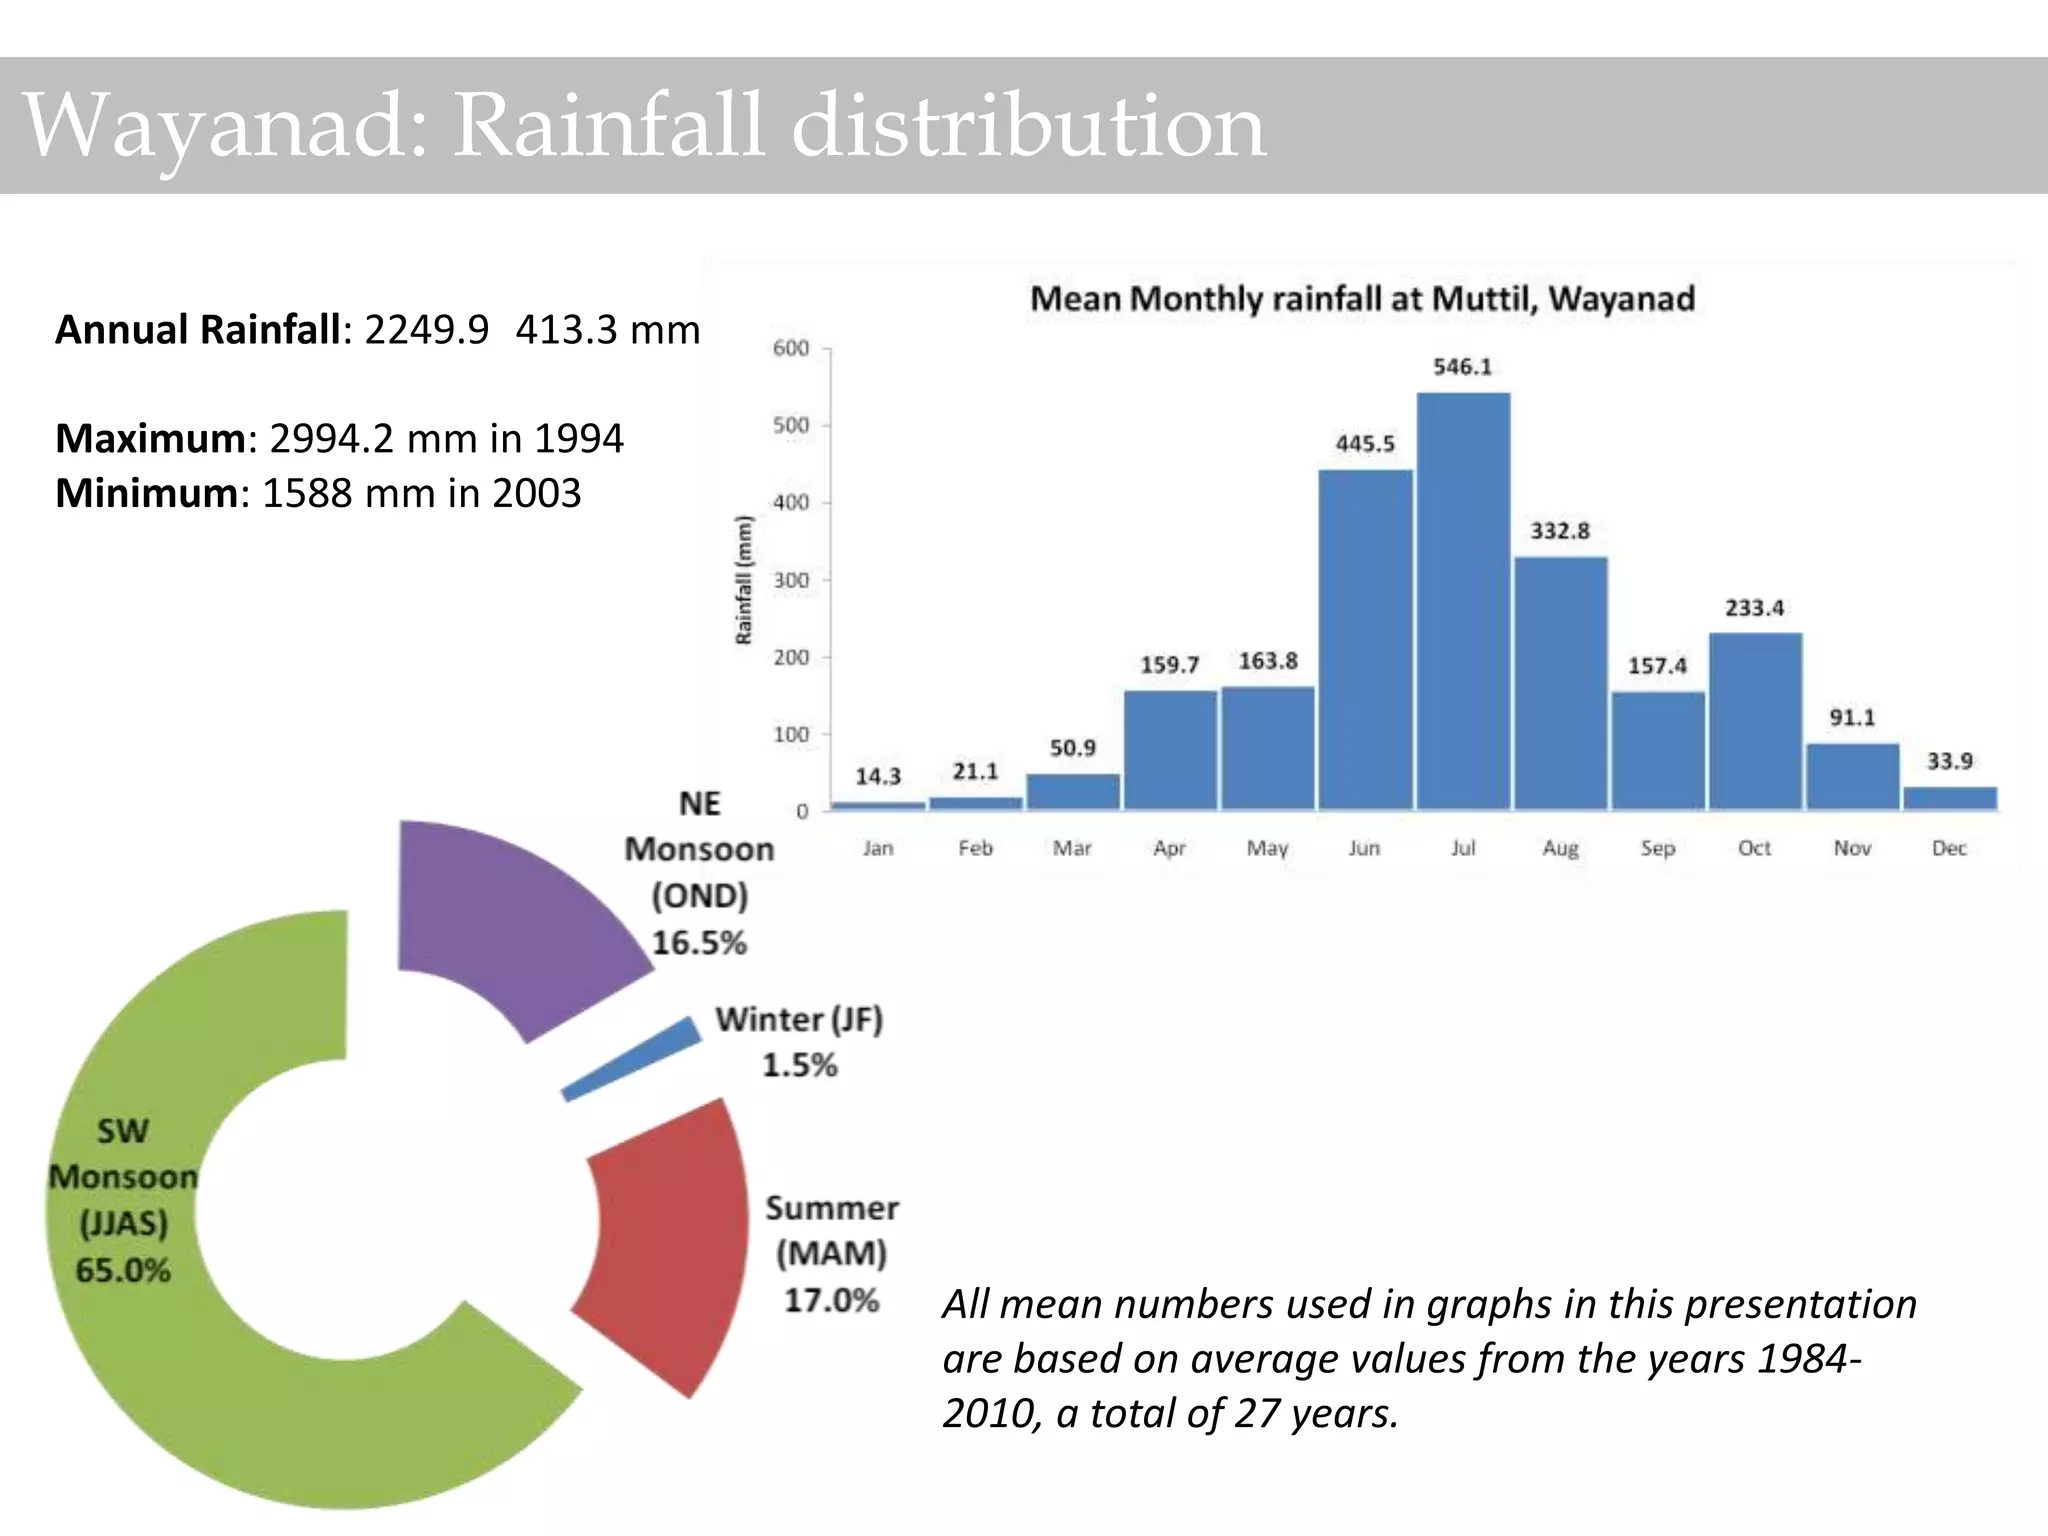
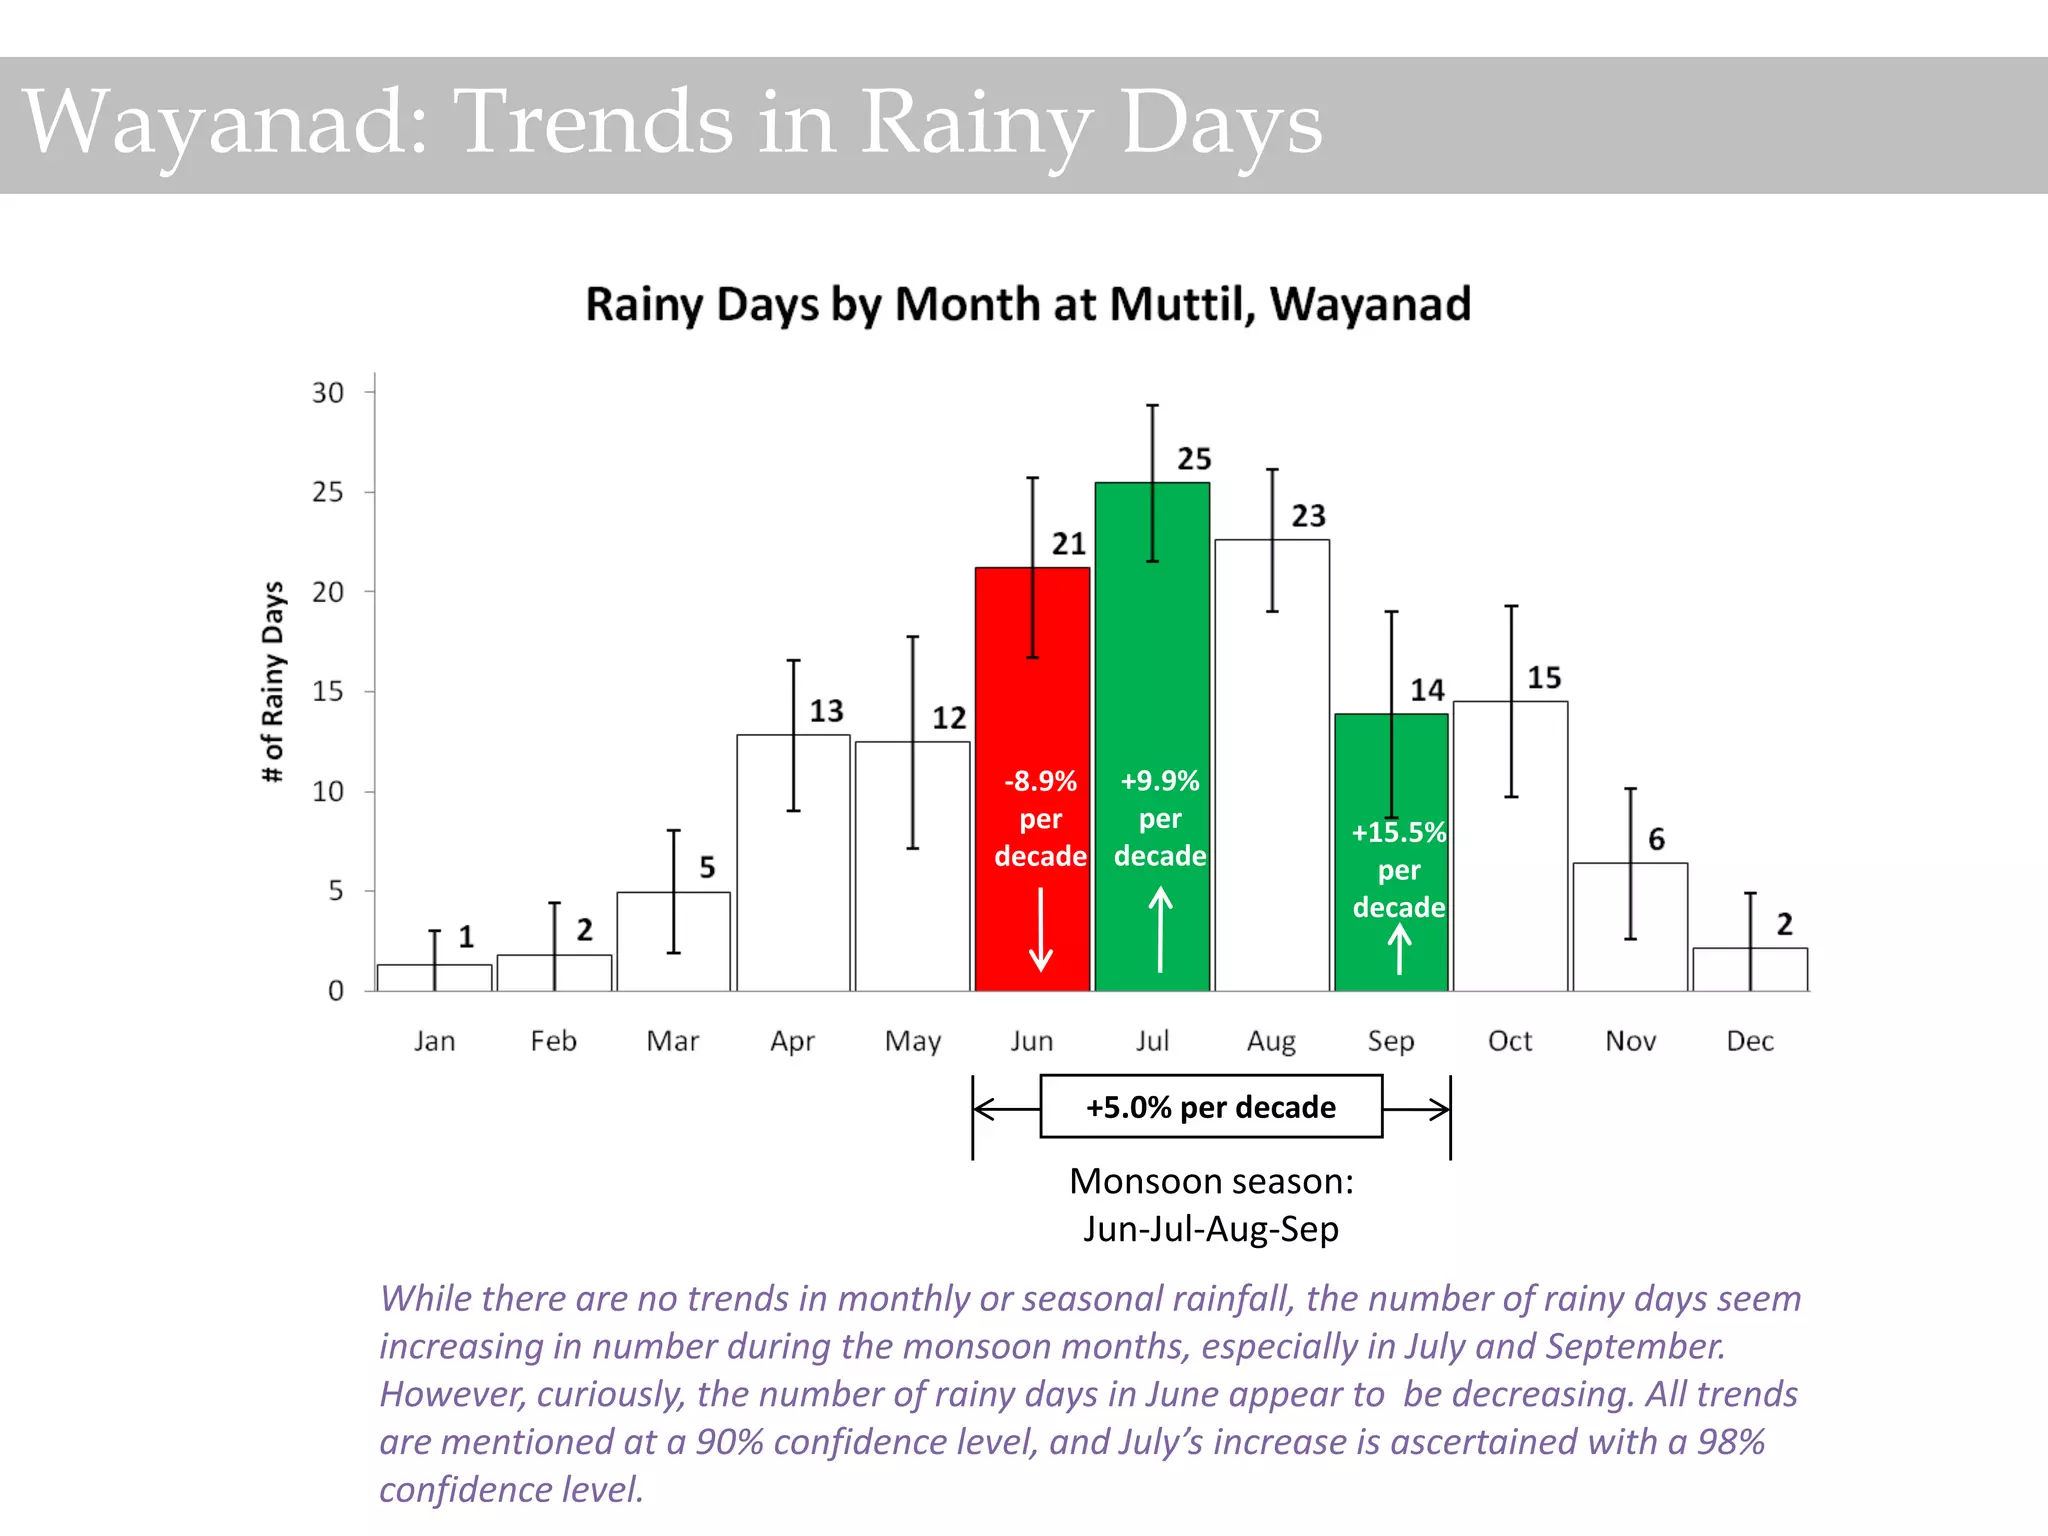
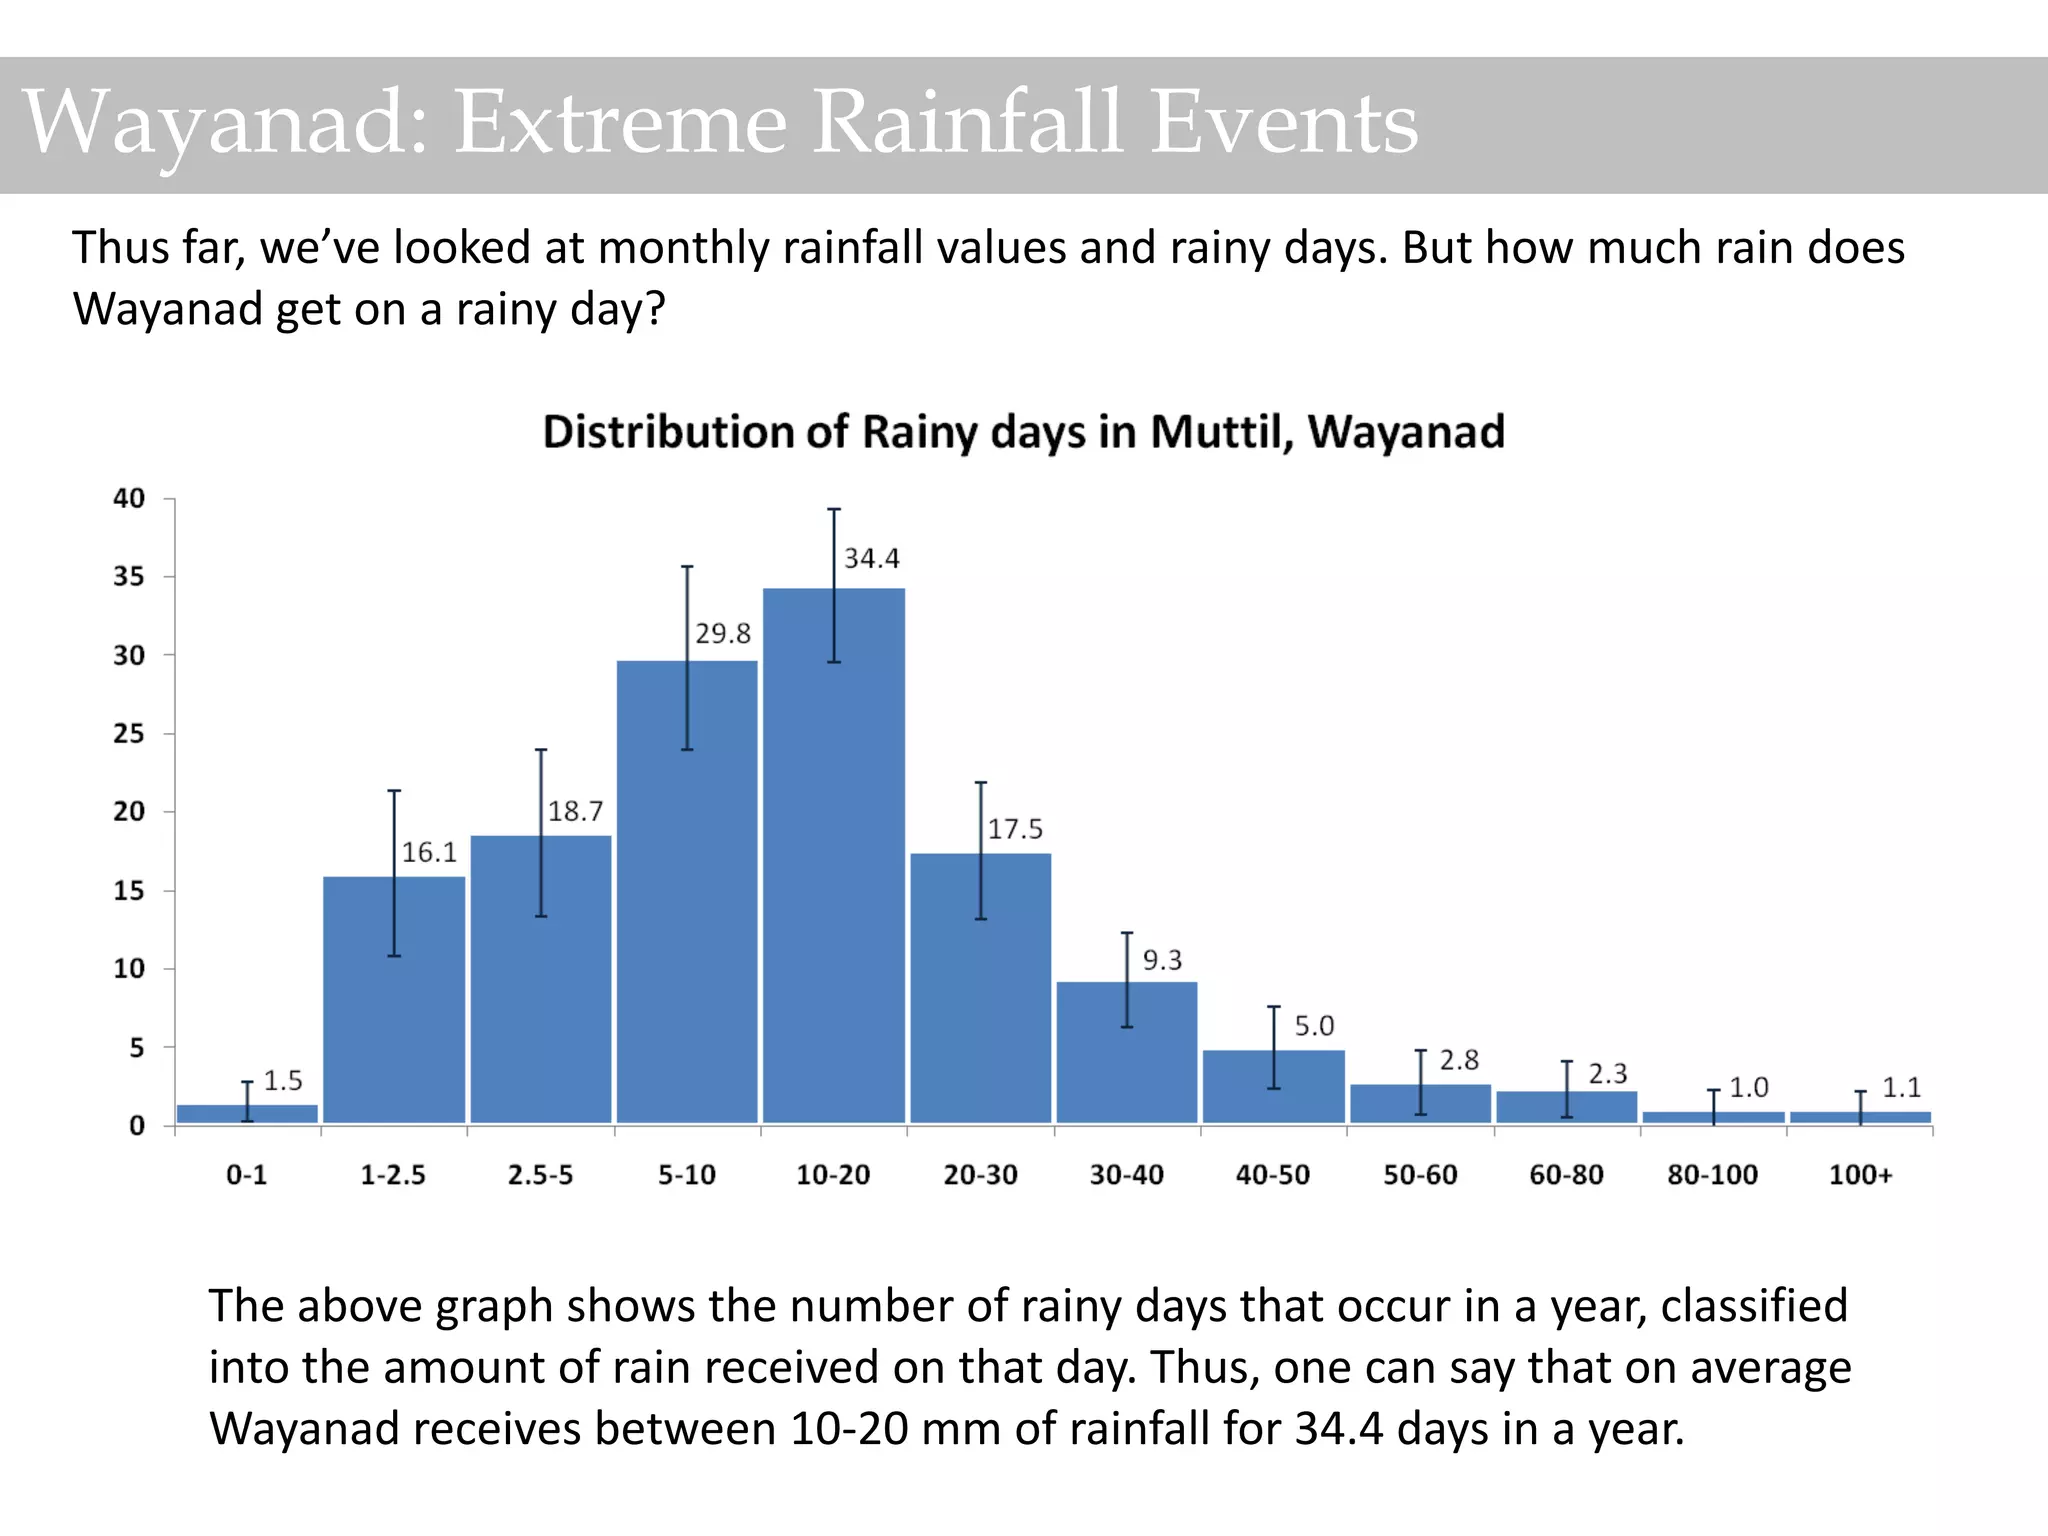
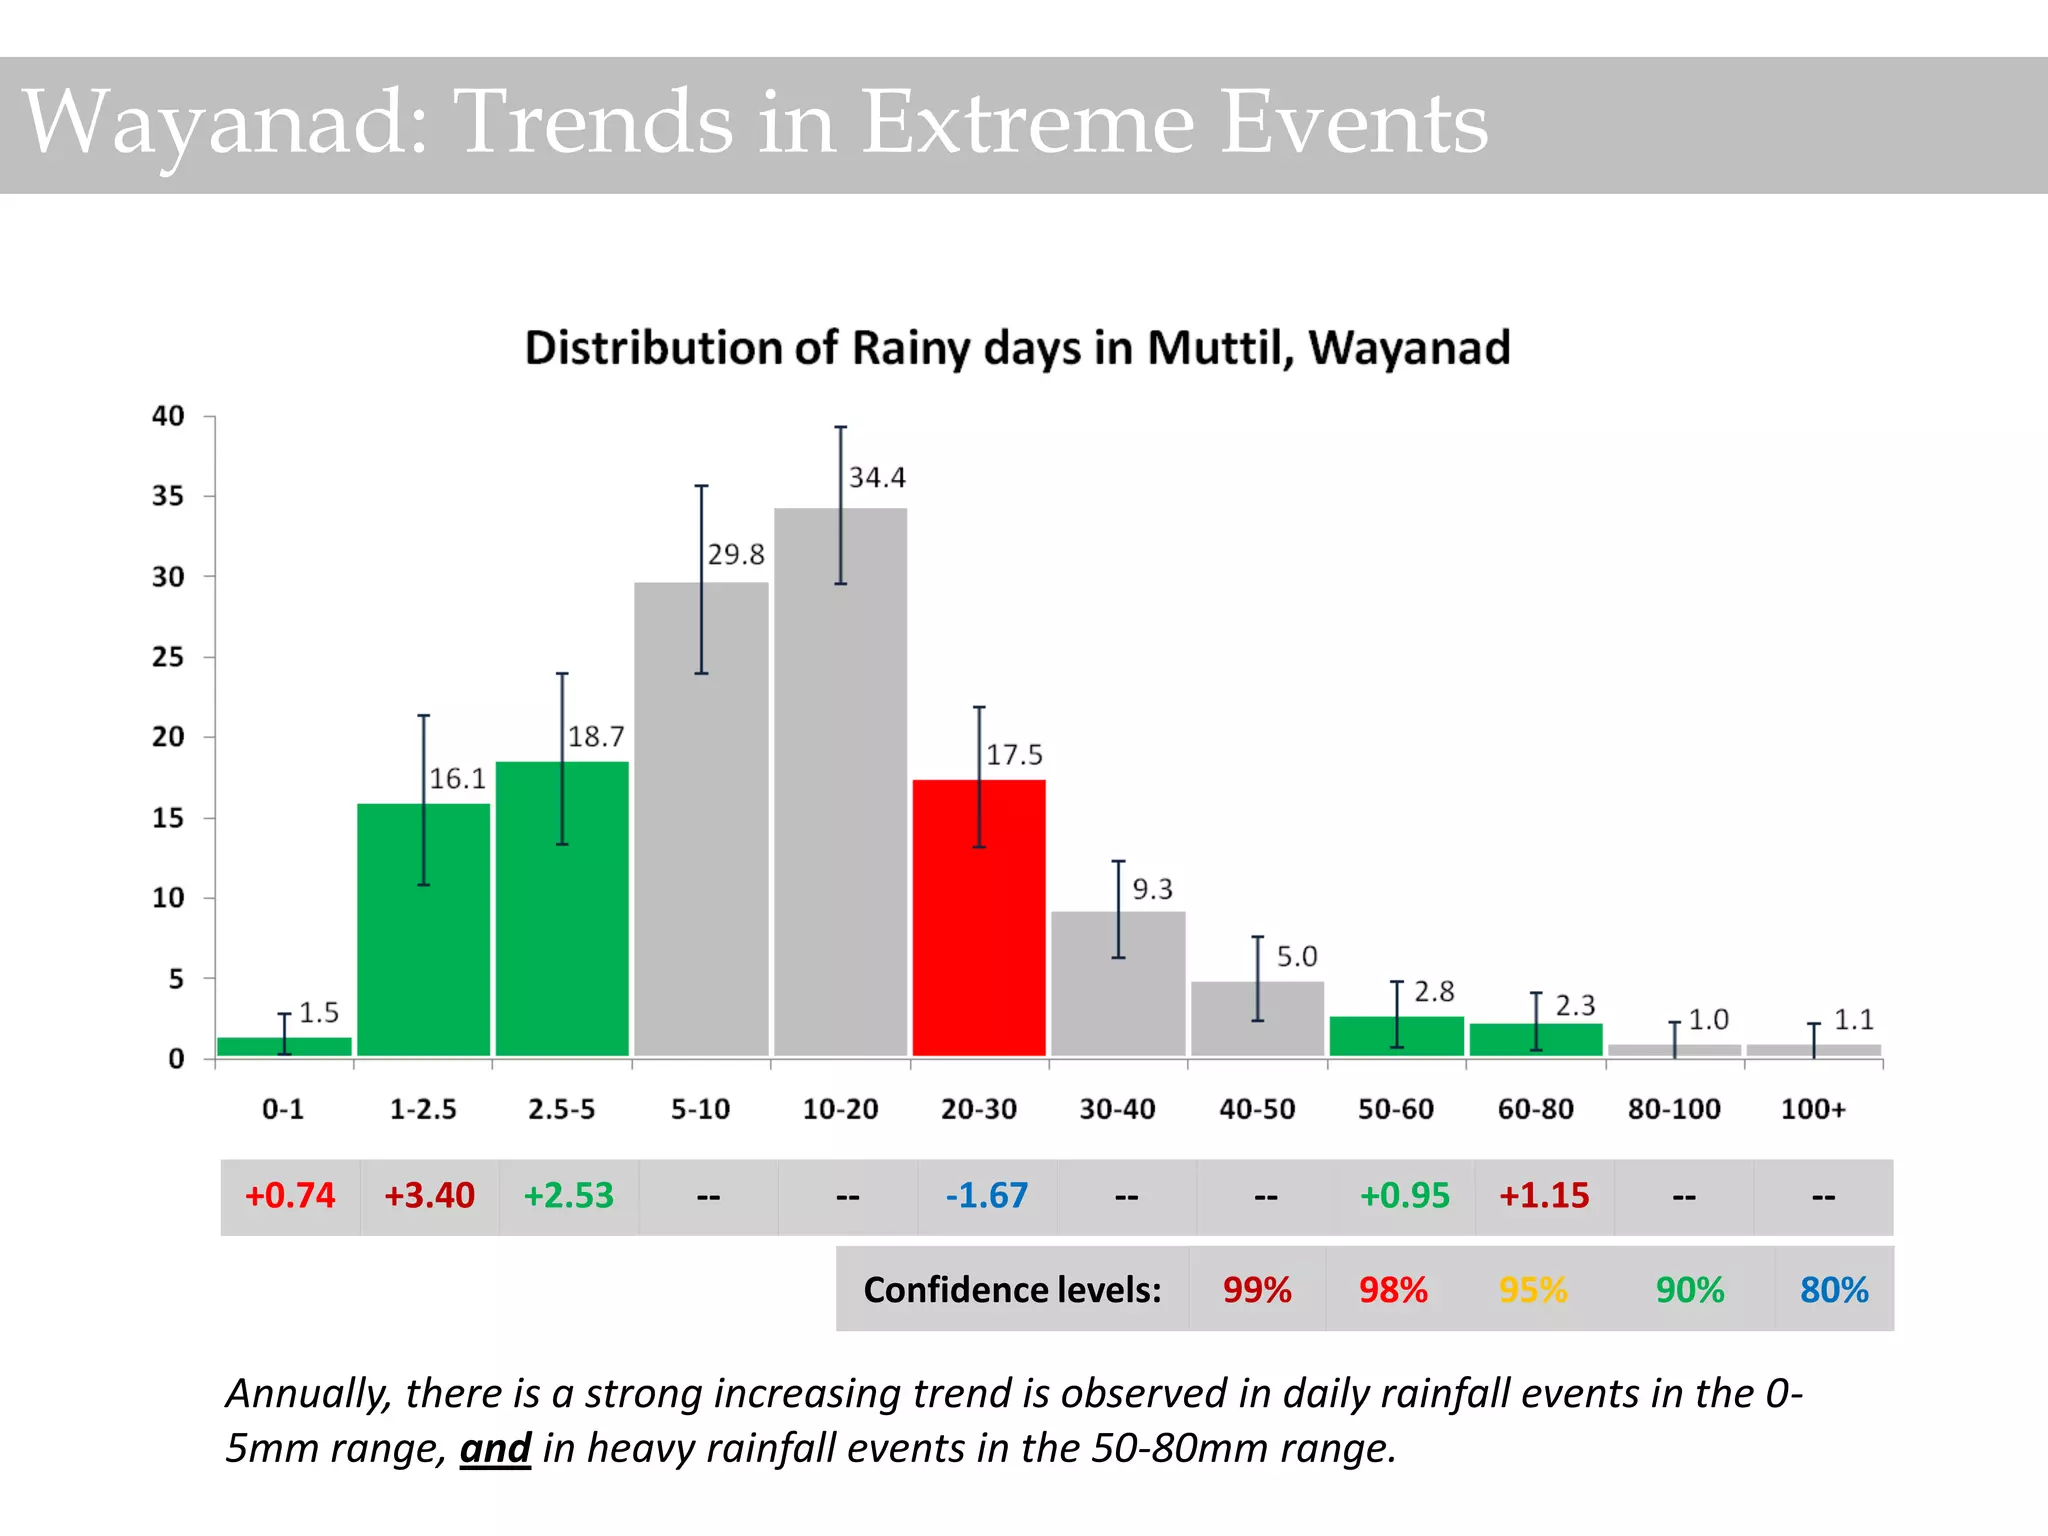
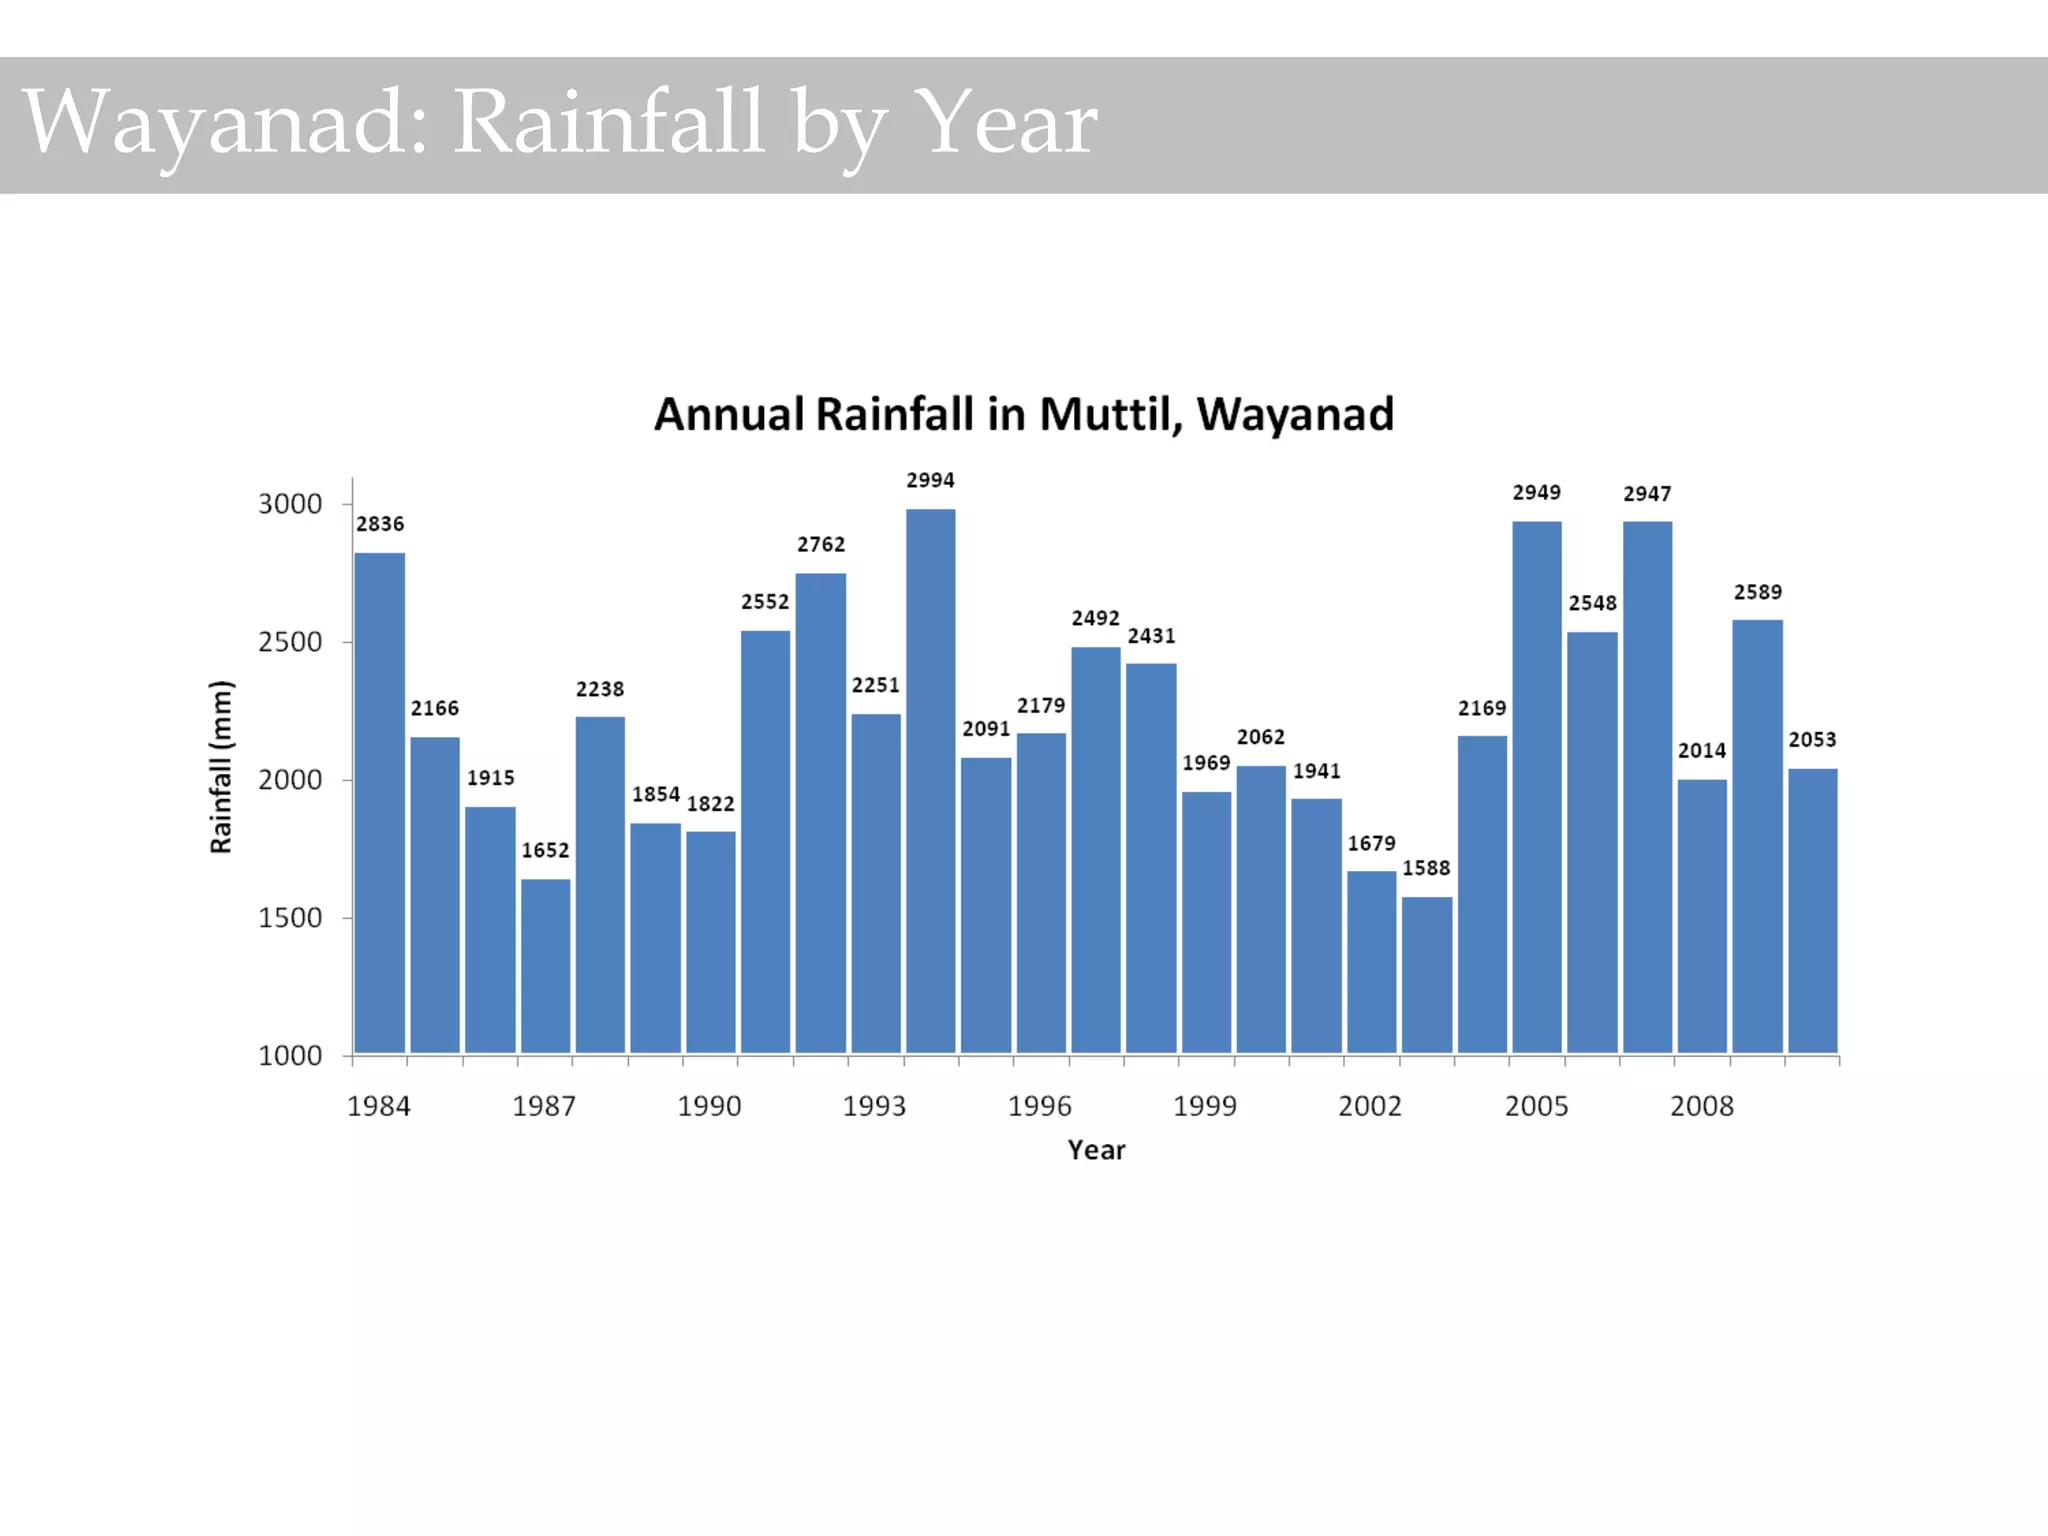
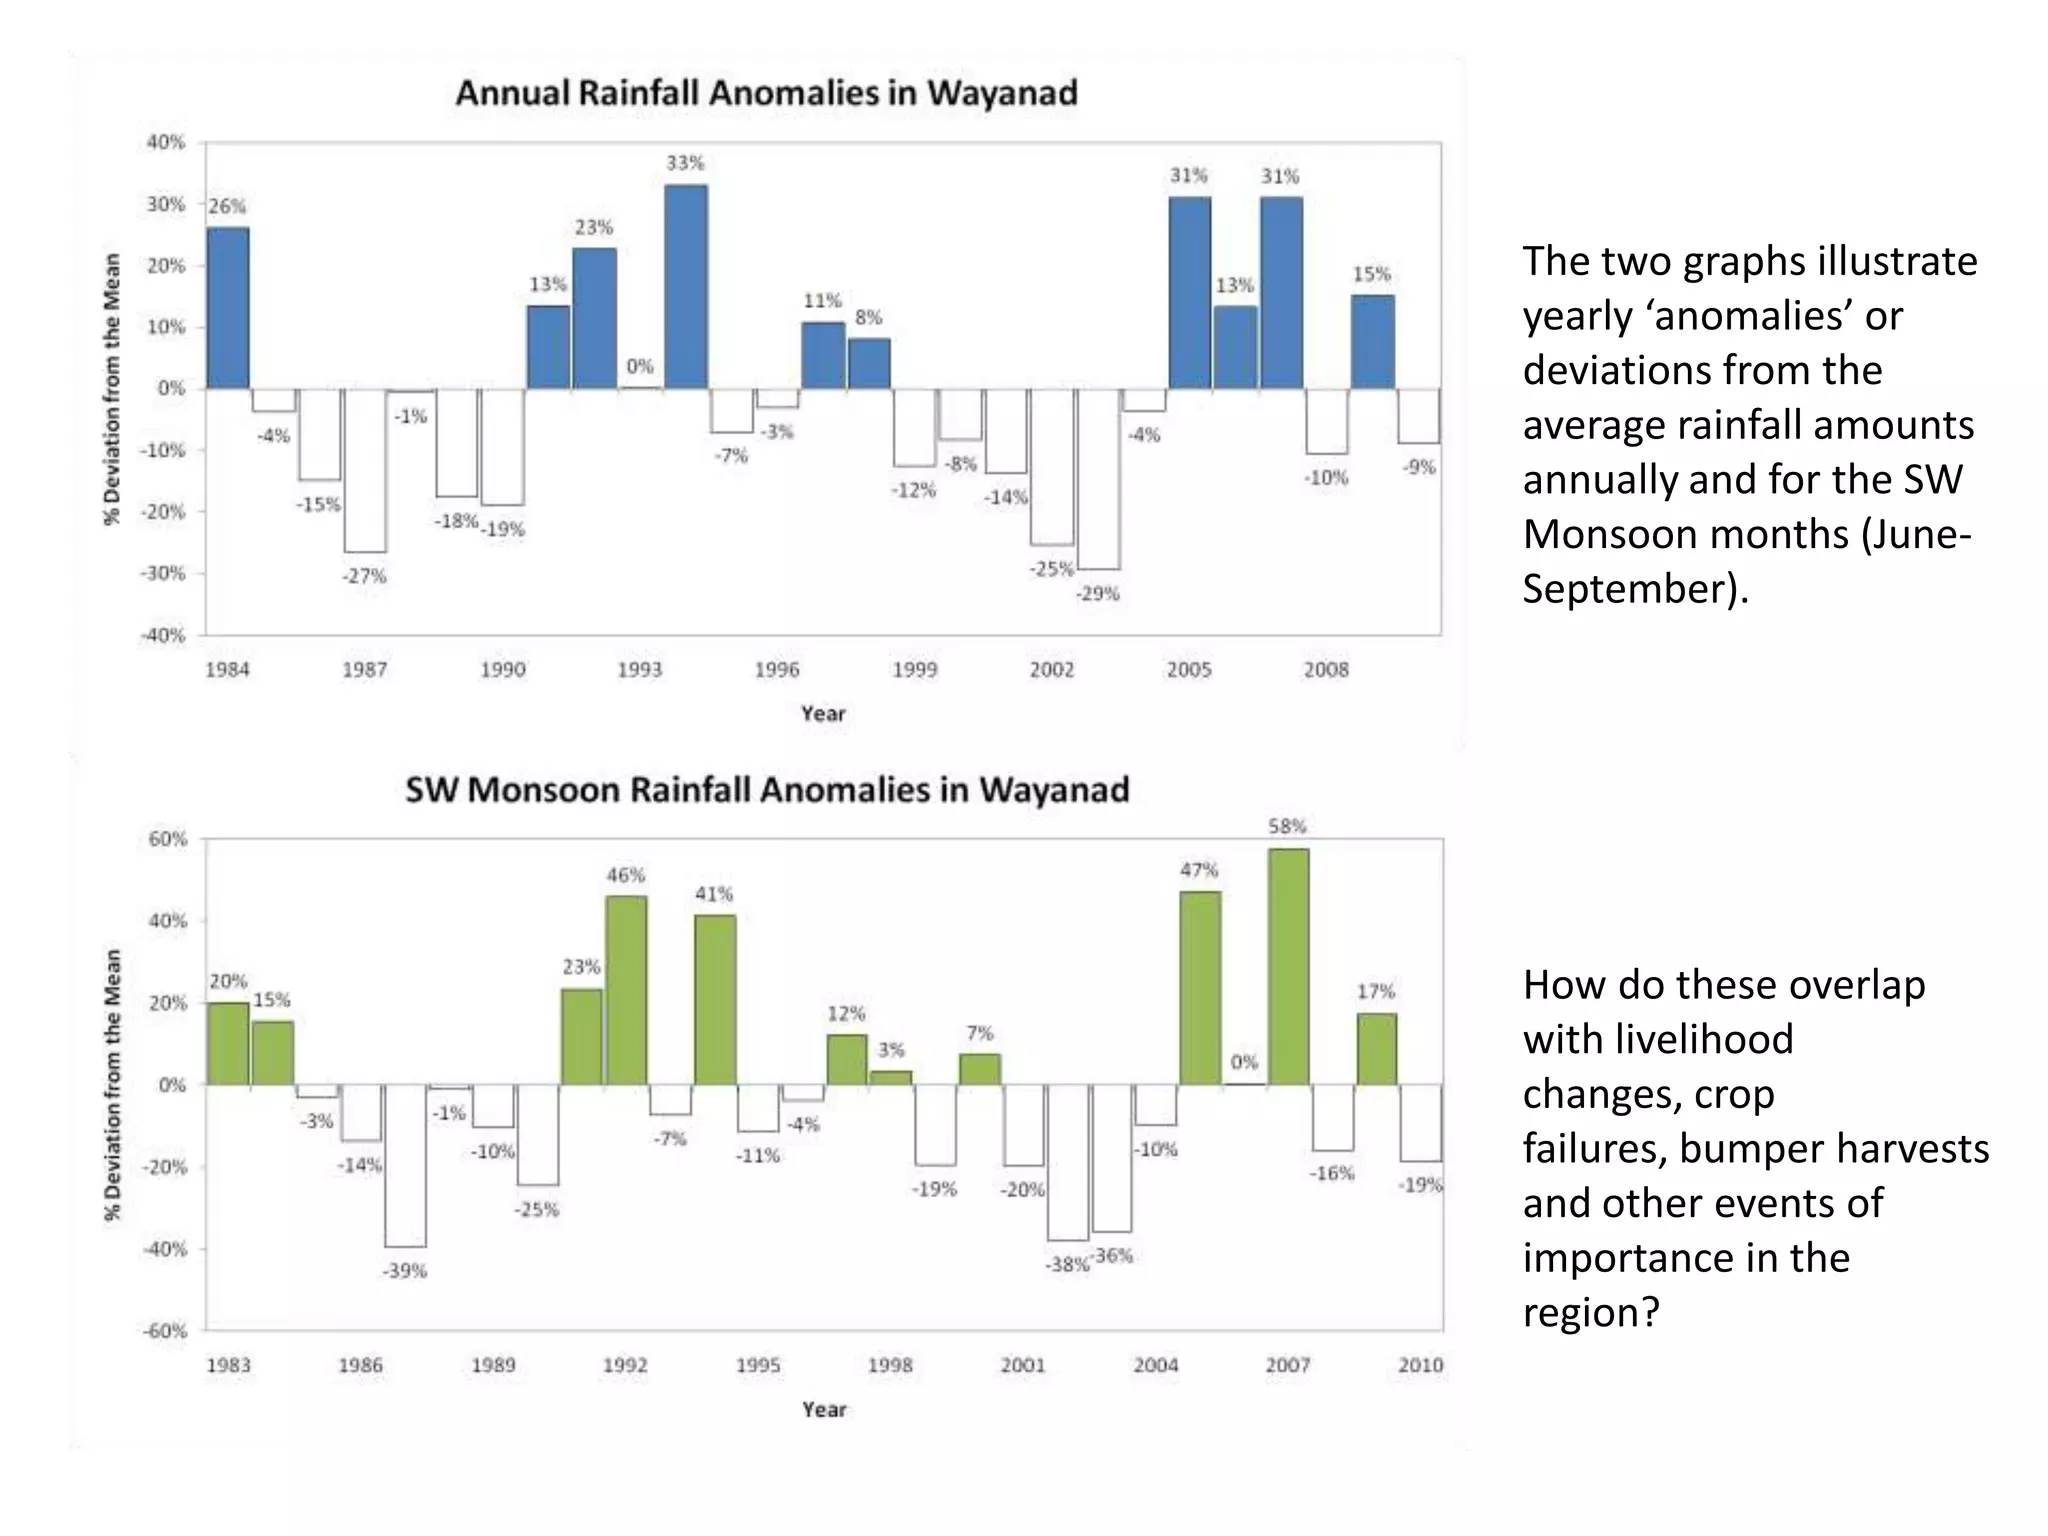
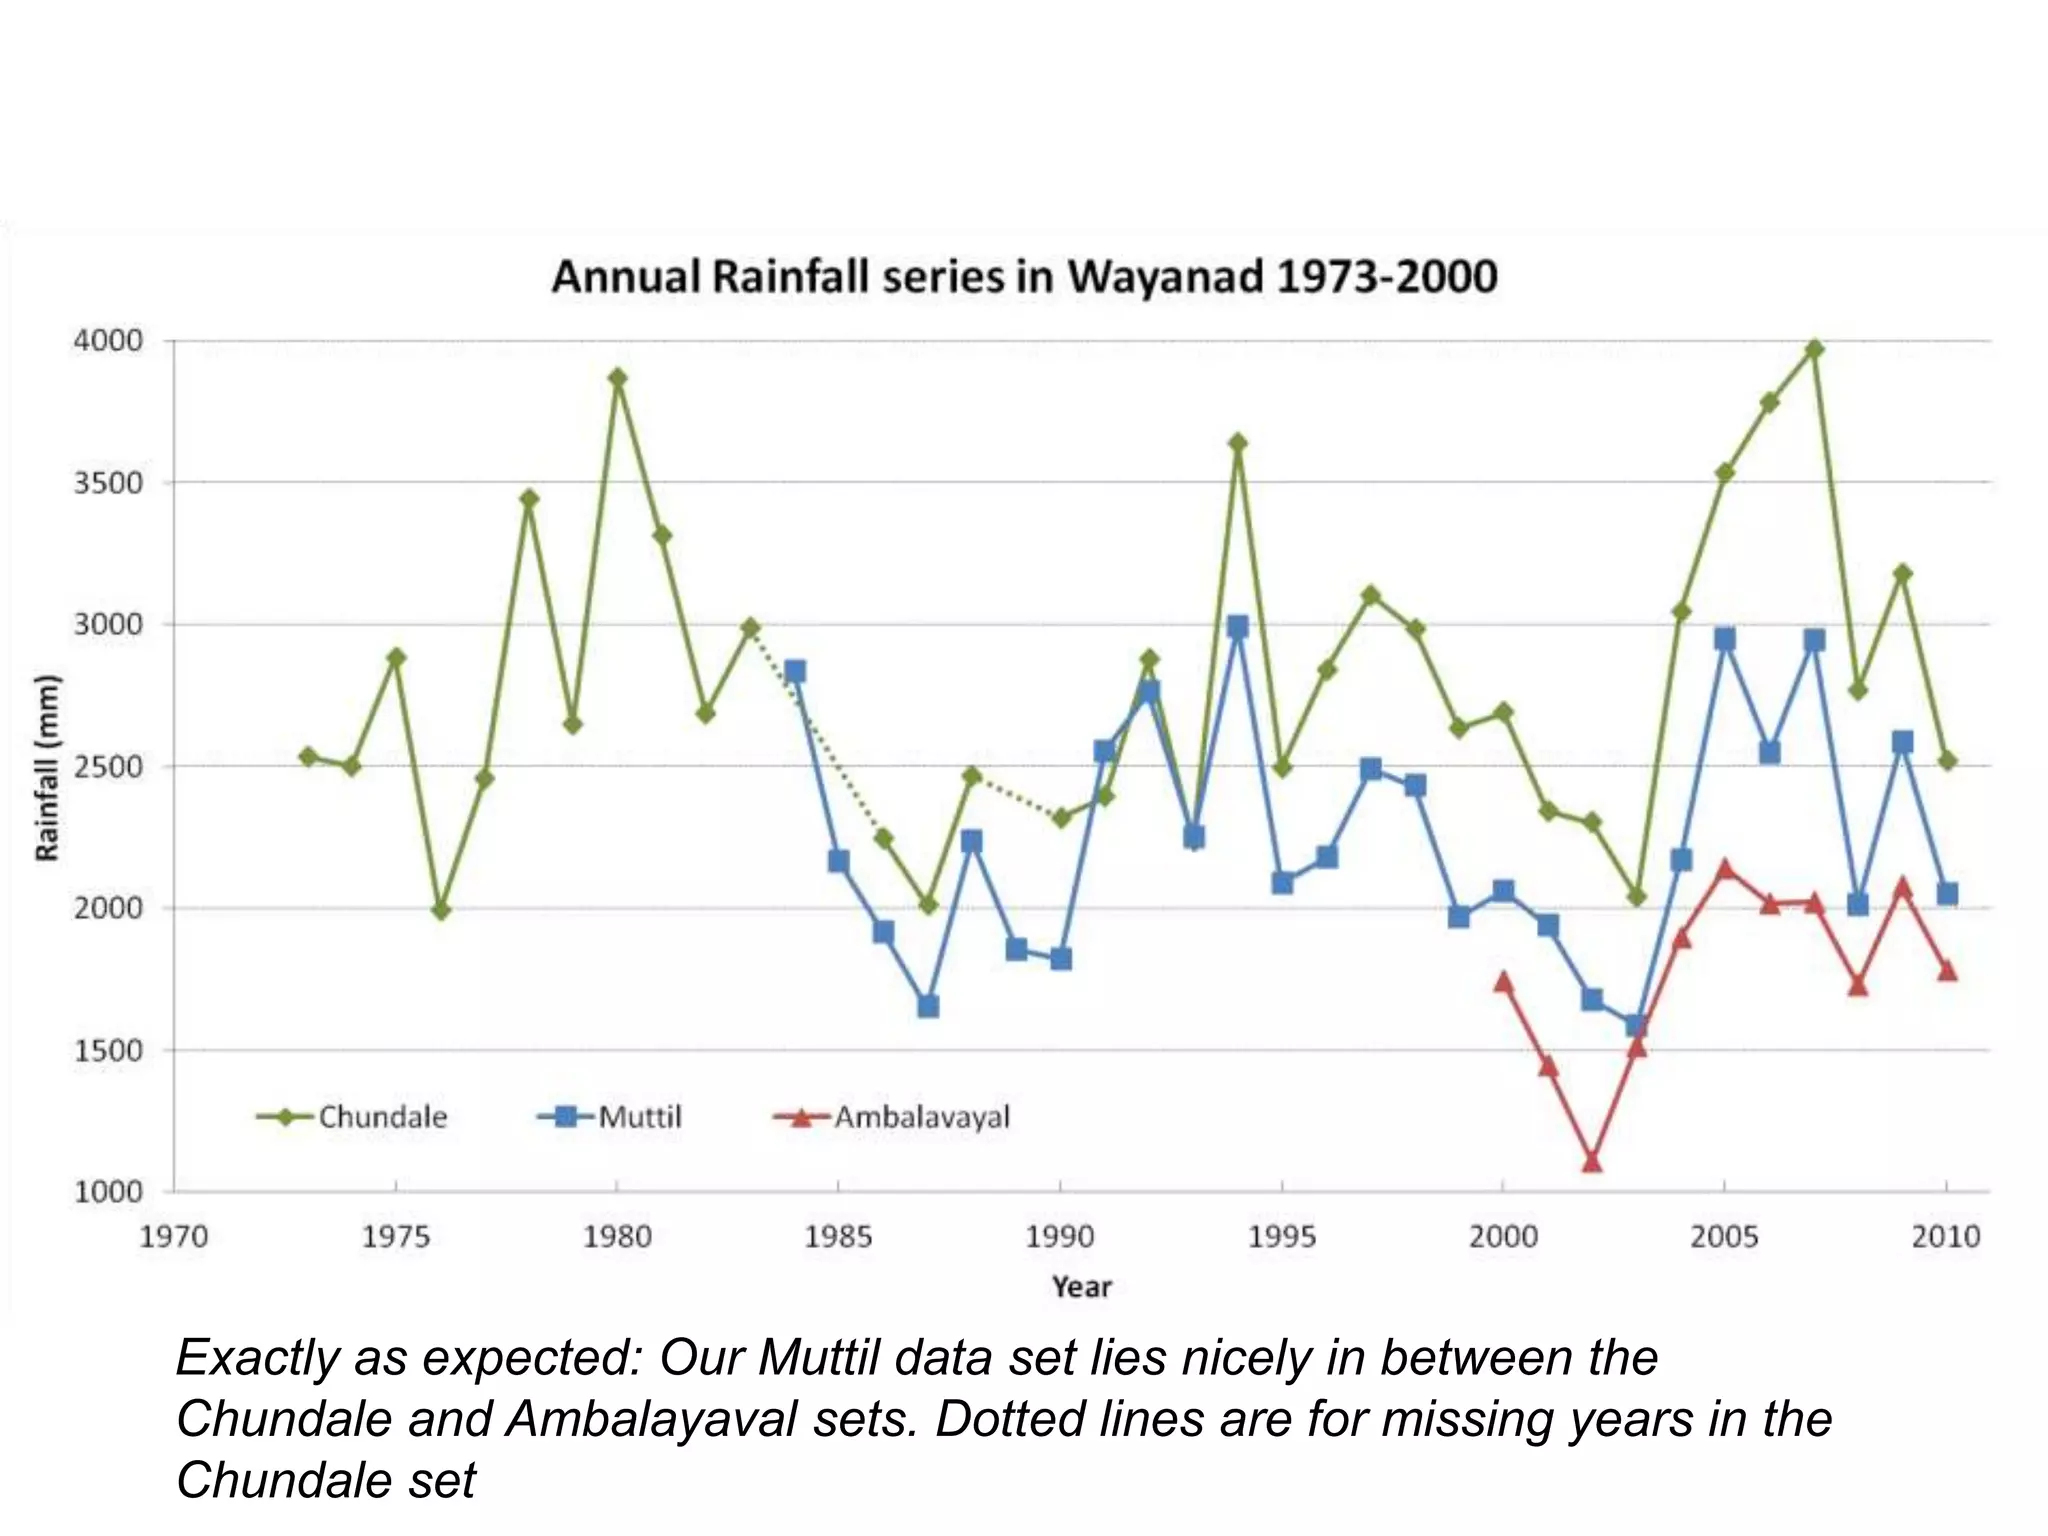
Public Affairs Centre                                                                        RASTA


               Going Local with Climate Change Impact
                            Assessments:
                        The Case of Wayanad

                         Pavan Srinath and Danesh Kumar


                                  Colloquium on
                   Citizen Voices in Environmental Governance
                        Presentation at Bangalore International Centre on 23rd August 2012
Public Affairs Centre                                          RASTA


         Can’t we go local?


                              Source: IPCC FAR 2007, Executive Summary
Public Affairs Centre                                                                                         RASTA


         Wayanad
•    Wayanad is a district in Northern
     Kerala that is nestled amidst the
     Western Ghats. The region is a high-
     altitude valley surrounded by hill
     ranges to the west and south, and by
     dense forests to the north and east.

•    Due to the unique
     geography, Wayanad enjoys a unique
     microclimate, supporting the
     cultivation of numerous food and cash
     crops.

•    We have chosen to bring together
     community knowledge and citizen
     science to understand the climate and
     climate trends of Wayanad.
                                             Map data © Google 2011 This map has been made using Google Fusion Tables.®
In April 1983, Mr. Vimal Kumar, a coffee planter from Muttil in
Wayanad, set up a rain gauge next to his house, in an effort to
understand his local climate better.

Since then, he has painstakingly recorded daily rainfall amounts for
twenty seven years now.

When we approached him, he was magnanimous in giving us access to
all of his data, allowing us to digitize and analyse this treasure trove of
information.
3000

                2600
                       2200
                        1800

                               1400
3000


 3000

                                                              1800
                                          1400
 3400
                                Muttil

                       2200
                                         1800
                2600
  3000                                          Ambalavayal

                Chundale      2600


                                                     Source data: CGWB District Report 2009
Map data © Google 2011 This map has been made using Google Fusion Tables.®
Public Affairs Centre                                                           RASTA


The Daily Mean Rainfall Profile of Muttil, Wayanad (1984-2010)


         Jan       Feb   Mar   Apr   May   Jun   Jul   Aug   Sep   Oct   Nov   Dec
Public Affairs Centre                                                           RASTA


Understanding Wayanad’s Climate using the Traditional Calendar


               Kumbha mazha


         Jan       Feb   Mar   Apr   May   Jun   Jul   Aug   Sep   Oct   Nov   Dec
                                                       Blossom & Backup showers
Public Affairs Centre                                                              RASTA


Understanding Wayanad’s Climate using the Traditional Calendar


                               Vishu
               Kumbha mazha


         Jan       Feb   Mar   Apr     May   Jun   Jul   Aug   Sep   Oct   Nov   Dec
                                                     Start of the traditional New Year
Public Affairs Centre                                                             RASTA


Understanding Wayanad’s Climate using the Traditional Calendar


                               Puthu mazha
                               Vishu
               Kumbha mazha


         Jan       Feb   Mar   Apr     May   Jun   Jul   Aug   Sep   Oct   Nov   Dec
                                                               Pre-monsoon showers
Public Affairs Centre                                                                  RASTA


Understanding Wayanad’s Climate using the Traditional Calendar


                                  Edavam paadhi


                               Puthu mazha
                               Vishu
               Kumbha mazha


         Jan       Feb   Mar    Apr    May        Jun   Jul   Aug   Sep   Oct   Nov   Dec
                                         Traditional start of the SW monsoon: Jun 4-5
Public Affairs Centre                                                                    RASTA


Understanding Wayanad’s Climate using the Traditional Calendar
                                                        Karkkidakam


                                  Edavam paadhi


                               Puthu mazha
                                Vishu
               Kumbha mazha


         Jan       Feb   Mar    Apr     May       Jun   Jul   Aug     Sep   Oct   Nov   Dec
                                The peak rainfall month, which comes with a ‘break’
Public Affairs Centre                                                                  RASTA


Understanding Wayanad’s Climate using the Traditional Calendar
                                                     Karkkidakam


                                                           Chinga masam
                                   Edavam paadhi


                               Puthu mazha
                                Vishu                          Onam
               Kumbha mazha


         Jan       Feb   Mar    Apr     May    Jun   Jul   Aug     Sep    Oct   Nov   Dec
                                                             The SW monsoon weakens
Public Affairs Centre                                                                    RASTA


Understanding Wayanad’s Climate using the Traditional Calendar
                                                     Karkkidakam


                                                           Chinga masam
                                   Edavam paadhi
                                                                          Tulavarsham
                               Puthu mazha
                                Vishu                          Onam
               Kumbha mazha


         Jan       Feb   Mar    Apr     May    Jun   Jul   Aug     Sep    Oct   Nov     Dec
                                              The NE Monsoon brings rain to Wayanad
Public Affairs Centre                                                                       RASTA


Understanding Wayanad’s Climate using the Traditional Calendar
                                                     Karkkidakam


                                                            Chinga masam
                                   Edavam paadhi
                                                                           Tulavarsham
                               Puthu mazha
                                Vishu                          Onam
               Kumbha mazha
                                                                                         Harvest


         Jan       Feb   Mar    Apr     May    Jun   Jul    Aug    Sep     Oct   Nov      Dec
                         The paddy harvest is usually completed by mid-December.
Public Affairs Centre                                                                       RASTA


Understanding Wayanad’s Climate using the Traditional Calendar
                                                     Karkkidakam


                                                            Chinga masam
                                   Edavam paadhi
                                                                           Tulavarsham
                               Puthu mazha
                                Vishu                          Onam
               Kumbha mazha
                                                                                         Harvest


         Jan       Feb   Mar    Apr     May    Jun   Jul    Aug    Sep     Oct   Nov      Dec
Public Affairs Centre                                                   RASTA


     Climate Trends and Impacts in Wayanad
#1        Weakening ‘Triggers of Growth’
 •   Traditionally, the SW
     monsoon season is supposed
     to begin during the Edavam
     paadhi, with heavy and
     continuous rains populating
     the month after it.

 •   However, communities have
     started feeling that this is
     weakening, and many have
     gone delayed the setting up
     of their paddy nurseries from
     June to July.                    Number of Rainy Days:
                                      June: 8.9% decrease per decade**
 •   While no trends were             July:  9.9% increase per decade*
     observed in the rainfall
     quantities in June & July, the
     number of rainy days in
     June are reducing and                              **At 98% confidence level
     those in July are going up.                        **At 90% confidence level
Public Affairs Centre                                                                                                          RASTA


         The ‘Polarisation’ of Daily Rainfall in Wayanad


                                                                                                   Increasing trend
                                                                                                   Decreasing trend
                                                                                                           None


                Drizzle--------------------Light rain--------------------Moderate Showers--------------------Heavy Rain

           +0.74        +3.40   +2.53     --        --       -1.67      --       --      +0.95     +1.15       --         --

                                                         Confidence levels:    99%       98%      95%        90%          80%

         Annually, there is a strong increasing trend is observed in daily rainfall events in the 0-
         5mm range, and in heavy rainfall events in the 50-80mm range.
Public Affairs Centre                                                RASTA


     Climate Trends and Impacts in Wayanad
#2        More frequent high rainfall events
        • On average, Wayanad (Muttil) receives about 140
          days of rainfall.

        • Out of these, on average about 7 days get more
          than 50mm of rainfall. These ‘high’ rainfall days will
          contribute greatly to adverse effects:
               – Chronic effect: Soil erosion
               – Acute effect:   Landslides

        • The number of high rainfall days (>=50mm) was
          observed to be increasing at the rate of 26% per
          decade!*

                                                       *At 90% confidence level
Public Affairs Centre                                 RASTA


          Climate Trends in Wayanad
#3        Hastened maturation of crops

        • In the past, coconut took ~300 days to
          mature. (Compared to 180-200 days in the
          plains.)
           – Now it has come down to ~240 days.

        • Increasing dry weight of Arecanuts.

        • The traditional harvest festival –
          mahkaram, is in mid-January. Nowadays, all
          monsoon paddy harvests are complete
          around ten days before Christmas.
Public Affairs Centre                                             RASTA


          Climate Trends in Wayanad
#4        Observed changes in weather events
        • Increasing instances of hail – with larger hailstones
          being spotted, usually associated with pre-monsoon
          afternoon showers.

        • Disappearing mists – in both density and frequency.

        • Historically, the local communities claim that Wayanad
          received thin, thread-like rain. This has completely
          disappeared.

        • More pronounced variation observed between places in
          Wayanad.
Public Affairs Centre                                                           RASTA


         Climate Change Impacts
             Go local with analyses – required for actionable insights

                        Climate change or variability – both have very real
                                                                  impacts.

                Anthropogenic or not is not always a relevant question

                           Use traditional frameworks to parse community
                                                               information

                                        Look for proxies to fill gaps in data

                                                Know what you don’t know

                        Real changes and perceptions are both important
Public Affairs Centre                                   RASTA


                        Thank You
                                     pavan.srinath@gmail.com
                         www.rastaindia.org | www.pacindia.org
Wayanad: Rainfall distribution

Annual Rainfall: 2249.9 413.3 mm

Maximum: 2994.2 mm in 1994
Minimum: 1588 mm in 2003


                                   All mean numbers used in graphs in this presentation
                                   are based on average values from the years 1984-
                                   2010, a total of 27 years.
Wayanad: Trends in Rainy Days


                                              -8.9% +9.9%
                                               per    per            +15.5%
                                             decade decade             per
                                                                     decade


                                                  +5.0% per decade

                                                 Monsoon season:
                                                 Jun-Jul-Aug-Sep
       While there are no trends in monthly or seasonal rainfall, the number of rainy days seem
       increasing in number during the monsoon months, especially in July and September.
       However, curiously, the number of rainy days in June appear to be decreasing. All trends
       are mentioned at a 90% confidence level, and July’s increase is ascertained with a 98%
       confidence level.
Wayanad: Extreme Rainfall Events
 Thus far, we’ve looked at monthly rainfall values and rainy days. But how much rain does
 Wayanad get on a rainy day?


       The above graph shows the number of rainy days that occur in a year, classified
       into the amount of rain received on that day. Thus, one can say that on average
       Wayanad receives between 10-20 mm of rainfall for 34.4 days in a year.
Wayanad: Trends in Extreme Events


                                                                                            Increasing trend
                                                                                            Decreasing trend
                                                                                                    None


         Drizzle--------------------Light rain--------------------Moderate Showers--------------------Heavy Rain

     +0.74   +3.40     +2.53       --        --       -1.67      --       --      +0.95     +1.15       --         --

                                                  Confidence levels:    99%       98%      95%        90%          80%

    Annually, there is a strong increasing trend is observed in daily rainfall events in the 0-
    5mm range, and in heavy rainfall events in the 50-80mm range.
Wayanad: Rainfall by Year
The two graphs illustrate
yearly ‘anomalies’ or
deviations from the
average rainfall amounts
annually and for the SW
Monsoon months (June-
September).


How do these overlap
with livelihood
changes, crop
failures, bumper harvests
and other events of
importance in the
region?
Map data © Google 2011 This map has been made using Google Fusion Tables.®
Exactly as expected: Our Muttil data set lies nicely in between the
Chundale and Ambalayaval sets. Dotted lines are for missing years in the
Chundale set

Going Local with Climate Change Impact Assessments: The Case of Wayanad

  • 1.
    Public Affairs Centre RASTA Going Local with Climate Change Impact Assessments: The Case of Wayanad Pavan Srinath and Danesh Kumar Colloquium on Citizen Voices in Environmental Governance Presentation at Bangalore International Centre on 23rd August 2012
  • 2.
    Public Affairs Centre RASTA Can’t we go local? Source: IPCC FAR 2007, Executive Summary
  • 3.
    Public Affairs Centre RASTA Wayanad • Wayanad is a district in Northern Kerala that is nestled amidst the Western Ghats. The region is a high- altitude valley surrounded by hill ranges to the west and south, and by dense forests to the north and east. • Due to the unique geography, Wayanad enjoys a unique microclimate, supporting the cultivation of numerous food and cash crops. • We have chosen to bring together community knowledge and citizen science to understand the climate and climate trends of Wayanad. Map data © Google 2011 This map has been made using Google Fusion Tables.®
  • 4.
    Public Affairs Centre RASTA Wayanad • Wayanad is a district in Northern Kerala that is nestled amidst the Western Ghats. The region is a high- altitude valley surrounded by hill ranges to the west and south, and by dense forests to the north and east. • Due to the unique geography, Wayanad enjoys a unique microclimate, supporting the cultivation of numerous food and cash crops. • We have chosen to bring together community knowledge and citizen science to understand the climate and climate trends of Wayanad. Map data © Google 2011 This map has been made using Google Fusion Tables.®
  • 5.
    In April 1983,Mr. Vimal Kumar, a coffee planter from Muttil in Wayanad, set up a rain gauge next to his house, in an effort to understand his local climate better. Since then, he has painstakingly recorded daily rainfall amounts for twenty seven years now. When we approached him, he was magnanimous in giving us access to all of his data, allowing us to digitize and analyse this treasure trove of information.
  • 6.
    3000 2600 2200 1800 1400 3000 3000 1800 1400 3400 Muttil 2200 1800 2600 3000 Ambalavayal Chundale 2600 Source data: CGWB District Report 2009
  • 7.
    Map data ©Google 2011 This map has been made using Google Fusion Tables.®
  • 8.
    Public Affairs Centre RASTA The Daily Mean Rainfall Profile of Muttil, Wayanad (1984-2010) Jan Feb Mar Apr May Jun Jul Aug Sep Oct Nov Dec
  • 9.
    Public Affairs Centre RASTA Understanding Wayanad’s Climate using the Traditional Calendar Kumbha mazha Jan Feb Mar Apr May Jun Jul Aug Sep Oct Nov Dec Blossom & Backup showers
  • 10.
    Public Affairs Centre RASTA Understanding Wayanad’s Climate using the Traditional Calendar Vishu Kumbha mazha Jan Feb Mar Apr May Jun Jul Aug Sep Oct Nov Dec Start of the traditional New Year
  • 11.
    Public Affairs Centre RASTA Understanding Wayanad’s Climate using the Traditional Calendar Puthu mazha Vishu Kumbha mazha Jan Feb Mar Apr May Jun Jul Aug Sep Oct Nov Dec Pre-monsoon showers
  • 12.
    Public Affairs Centre RASTA Understanding Wayanad’s Climate using the Traditional Calendar Edavam paadhi Puthu mazha Vishu Kumbha mazha Jan Feb Mar Apr May Jun Jul Aug Sep Oct Nov Dec Traditional start of the SW monsoon: Jun 4-5
  • 13.
    Public Affairs Centre RASTA Understanding Wayanad’s Climate using the Traditional Calendar Karkkidakam Edavam paadhi Puthu mazha Vishu Kumbha mazha Jan Feb Mar Apr May Jun Jul Aug Sep Oct Nov Dec The peak rainfall month, which comes with a ‘break’
  • 14.
    Public Affairs Centre RASTA Understanding Wayanad’s Climate using the Traditional Calendar Karkkidakam Chinga masam Edavam paadhi Puthu mazha Vishu Onam Kumbha mazha Jan Feb Mar Apr May Jun Jul Aug Sep Oct Nov Dec The SW monsoon weakens
  • 15.
    Public Affairs Centre RASTA Understanding Wayanad’s Climate using the Traditional Calendar Karkkidakam Chinga masam Edavam paadhi Tulavarsham Puthu mazha Vishu Onam Kumbha mazha Jan Feb Mar Apr May Jun Jul Aug Sep Oct Nov Dec The NE Monsoon brings rain to Wayanad
  • 16.
    Public Affairs Centre RASTA Understanding Wayanad’s Climate using the Traditional Calendar Karkkidakam Chinga masam Edavam paadhi Tulavarsham Puthu mazha Vishu Onam Kumbha mazha Harvest Jan Feb Mar Apr May Jun Jul Aug Sep Oct Nov Dec The paddy harvest is usually completed by mid-December.
  • 17.
    Public Affairs Centre RASTA Understanding Wayanad’s Climate using the Traditional Calendar Karkkidakam Chinga masam Edavam paadhi Tulavarsham Puthu mazha Vishu Onam Kumbha mazha Harvest Jan Feb Mar Apr May Jun Jul Aug Sep Oct Nov Dec
  • 18.
    Public Affairs Centre RASTA Climate Trends and Impacts in Wayanad #1 Weakening ‘Triggers of Growth’ • Traditionally, the SW monsoon season is supposed to begin during the Edavam paadhi, with heavy and continuous rains populating the month after it. • However, communities have started feeling that this is weakening, and many have gone delayed the setting up of their paddy nurseries from June to July. Number of Rainy Days: June: 8.9% decrease per decade** • While no trends were July: 9.9% increase per decade* observed in the rainfall quantities in June & July, the number of rainy days in June are reducing and **At 98% confidence level those in July are going up. **At 90% confidence level
  • 19.
    Public Affairs Centre RASTA The ‘Polarisation’ of Daily Rainfall in Wayanad Increasing trend Decreasing trend None Drizzle--------------------Light rain--------------------Moderate Showers--------------------Heavy Rain +0.74 +3.40 +2.53 -- -- -1.67 -- -- +0.95 +1.15 -- -- Confidence levels: 99% 98% 95% 90% 80% Annually, there is a strong increasing trend is observed in daily rainfall events in the 0- 5mm range, and in heavy rainfall events in the 50-80mm range.
  • 20.
    Public Affairs Centre RASTA Climate Trends and Impacts in Wayanad #2 More frequent high rainfall events • On average, Wayanad (Muttil) receives about 140 days of rainfall. • Out of these, on average about 7 days get more than 50mm of rainfall. These ‘high’ rainfall days will contribute greatly to adverse effects: – Chronic effect: Soil erosion – Acute effect: Landslides • The number of high rainfall days (>=50mm) was observed to be increasing at the rate of 26% per decade!* *At 90% confidence level
  • 21.
    Public Affairs Centre RASTA Climate Trends in Wayanad #3 Hastened maturation of crops • In the past, coconut took ~300 days to mature. (Compared to 180-200 days in the plains.) – Now it has come down to ~240 days. • Increasing dry weight of Arecanuts. • The traditional harvest festival – mahkaram, is in mid-January. Nowadays, all monsoon paddy harvests are complete around ten days before Christmas.
  • 22.
    Public Affairs Centre RASTA Climate Trends in Wayanad #4 Observed changes in weather events • Increasing instances of hail – with larger hailstones being spotted, usually associated with pre-monsoon afternoon showers. • Disappearing mists – in both density and frequency. • Historically, the local communities claim that Wayanad received thin, thread-like rain. This has completely disappeared. • More pronounced variation observed between places in Wayanad.
  • 23.
    Public Affairs Centre RASTA Climate Change Impacts Go local with analyses – required for actionable insights Climate change or variability – both have very real impacts. Anthropogenic or not is not always a relevant question Use traditional frameworks to parse community information Look for proxies to fill gaps in data Know what you don’t know Real changes and perceptions are both important
  • 24.
    Public Affairs Centre RASTA Thank You pavan.srinath@gmail.com www.rastaindia.org | www.pacindia.org
  • 25.
    Wayanad: Rainfall distribution AnnualRainfall: 2249.9 413.3 mm Maximum: 2994.2 mm in 1994 Minimum: 1588 mm in 2003 All mean numbers used in graphs in this presentation are based on average values from the years 1984- 2010, a total of 27 years.
  • 26.
    Wayanad: Trends inRainy Days -8.9% +9.9% per per +15.5% decade decade per decade +5.0% per decade Monsoon season: Jun-Jul-Aug-Sep While there are no trends in monthly or seasonal rainfall, the number of rainy days seem increasing in number during the monsoon months, especially in July and September. However, curiously, the number of rainy days in June appear to be decreasing. All trends are mentioned at a 90% confidence level, and July’s increase is ascertained with a 98% confidence level.
  • 27.
    Wayanad: Extreme RainfallEvents Thus far, we’ve looked at monthly rainfall values and rainy days. But how much rain does Wayanad get on a rainy day? The above graph shows the number of rainy days that occur in a year, classified into the amount of rain received on that day. Thus, one can say that on average Wayanad receives between 10-20 mm of rainfall for 34.4 days in a year.
  • 28.
    Wayanad: Trends inExtreme Events Increasing trend Decreasing trend None Drizzle--------------------Light rain--------------------Moderate Showers--------------------Heavy Rain +0.74 +3.40 +2.53 -- -- -1.67 -- -- +0.95 +1.15 -- -- Confidence levels: 99% 98% 95% 90% 80% Annually, there is a strong increasing trend is observed in daily rainfall events in the 0- 5mm range, and in heavy rainfall events in the 50-80mm range.
  • 29.
  • 30.
    The two graphsillustrate yearly ‘anomalies’ or deviations from the average rainfall amounts annually and for the SW Monsoon months (June- September). How do these overlap with livelihood changes, crop failures, bumper harvests and other events of importance in the region?
  • 31.
    Map data ©Google 2011 This map has been made using Google Fusion Tables.®
  • 32.
    Exactly as expected:Our Muttil data set lies nicely in between the Chundale and Ambalayaval sets. Dotted lines are for missing years in the Chundale set

Editor's Notes

  • #20 This I found to be really interesting: the # of heavy rain days and # of light rain days are going up: but moderate rainfall days are going down! Call it the “Polarisation of daily rainfall events”. This is analysed for the whole year: Can you think of potential impacts of something like this. The # of heavy rain events obviously has a huge effect on soil erosion.
  • #26 Notes: It’s curious how little average rainfall there is in Jan-Mar, but that is the period when some of the most critical daily-showers occur, vital for a good coffee yield. So in spite of a great deal of rain during the monsoon, an inch of rainfall in Feb can make-or-break a year. -- Thought that this might be an interesting nugget of information that we could share.
  • #27 Questions to ponder on: If the # of rainy days in the monsoon months (especially July and Sep) are going up, what kind of implications would that have? Can it mean anything for any of the crops? Positive or negative. Remember, the overal amount of rain varies, but has no significant trend.
  • #28 Check out the left-hand side of that graph. Like I said, I strongly feel that Vimal’s rain gauge underestimates rainfall values <5mm.
  • #29 This I found to be really interesting: the # of heavy rain days and # of light rain days are going up: but moderate rainfall days are going down! Call it the “Polarisation of daily rainfall events”. This is analysed for the whole year: Can you think of potential impacts of something like this. The # of heavy rain events obviously has a huge effect on soil erosion.
  • #31 It’ll be really interesting to map the whole Wayanad timeline in reference to this. One thing that I could note was that the years 2001-2004 are all consecutives deficient in rainfall: do you think that might have been a contributing factor in the farmer suicides? Note that 1984-1990 period is also quite similar: maybe we can compare and contrast the two periods and say that socio-economic factors between the two periods changed so drastically that the people of Wayanad were far LESS climate resilient in the 2000s compared to before. Bit of a stretch, I know, but I would love your thoughts on the matter.