Download to read offline

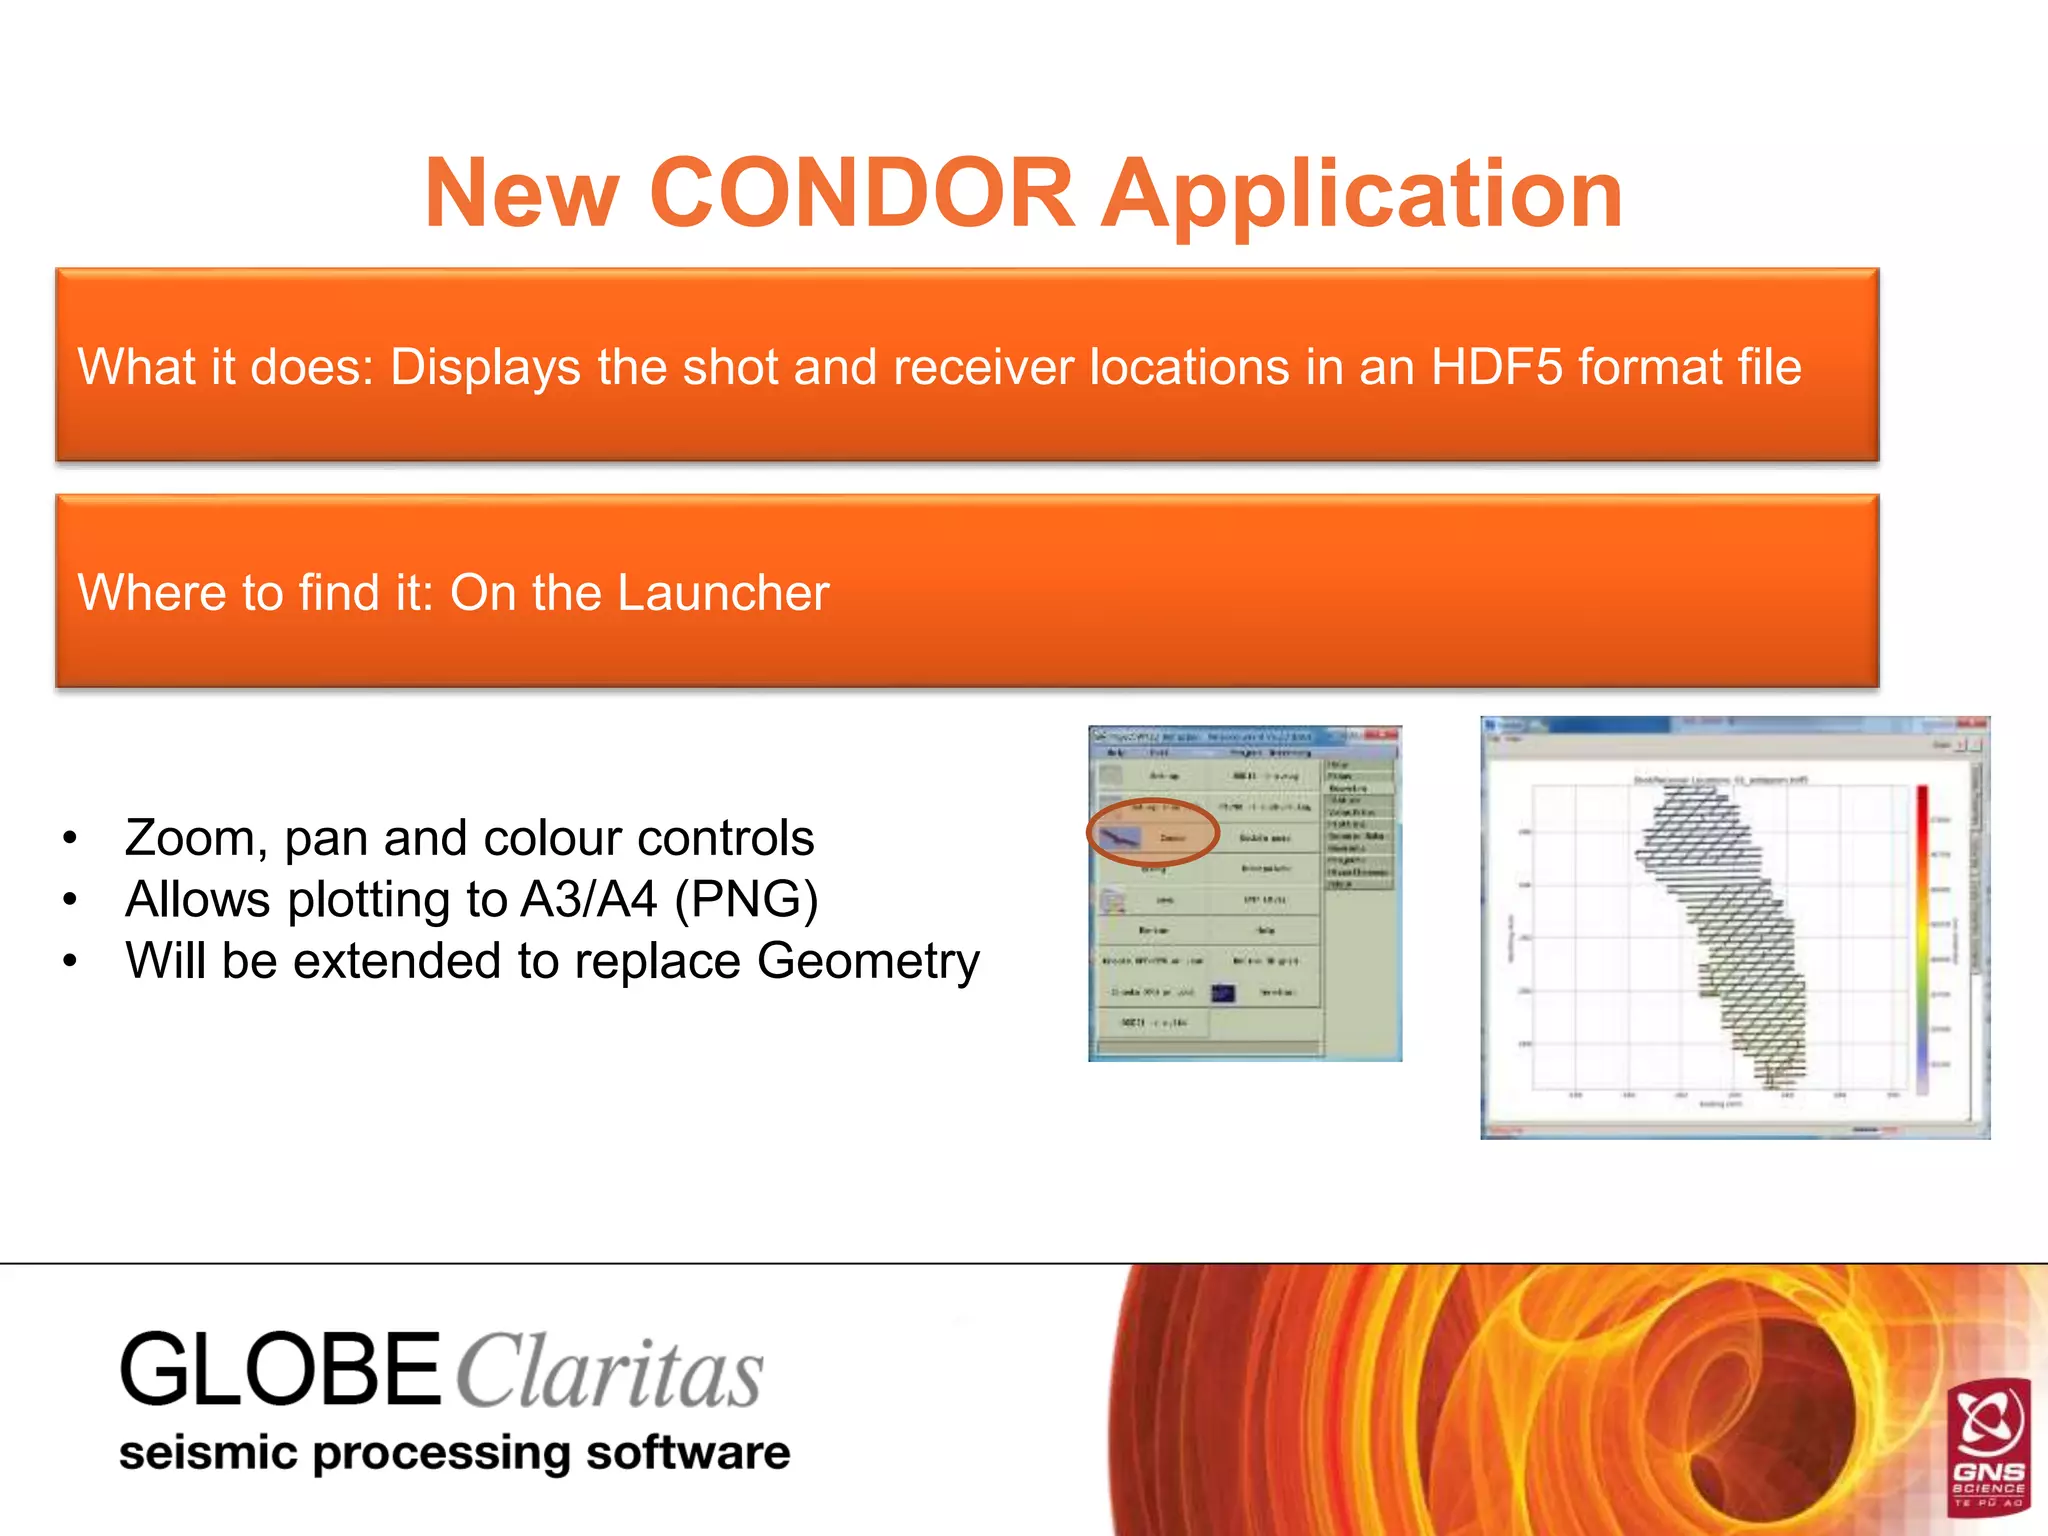


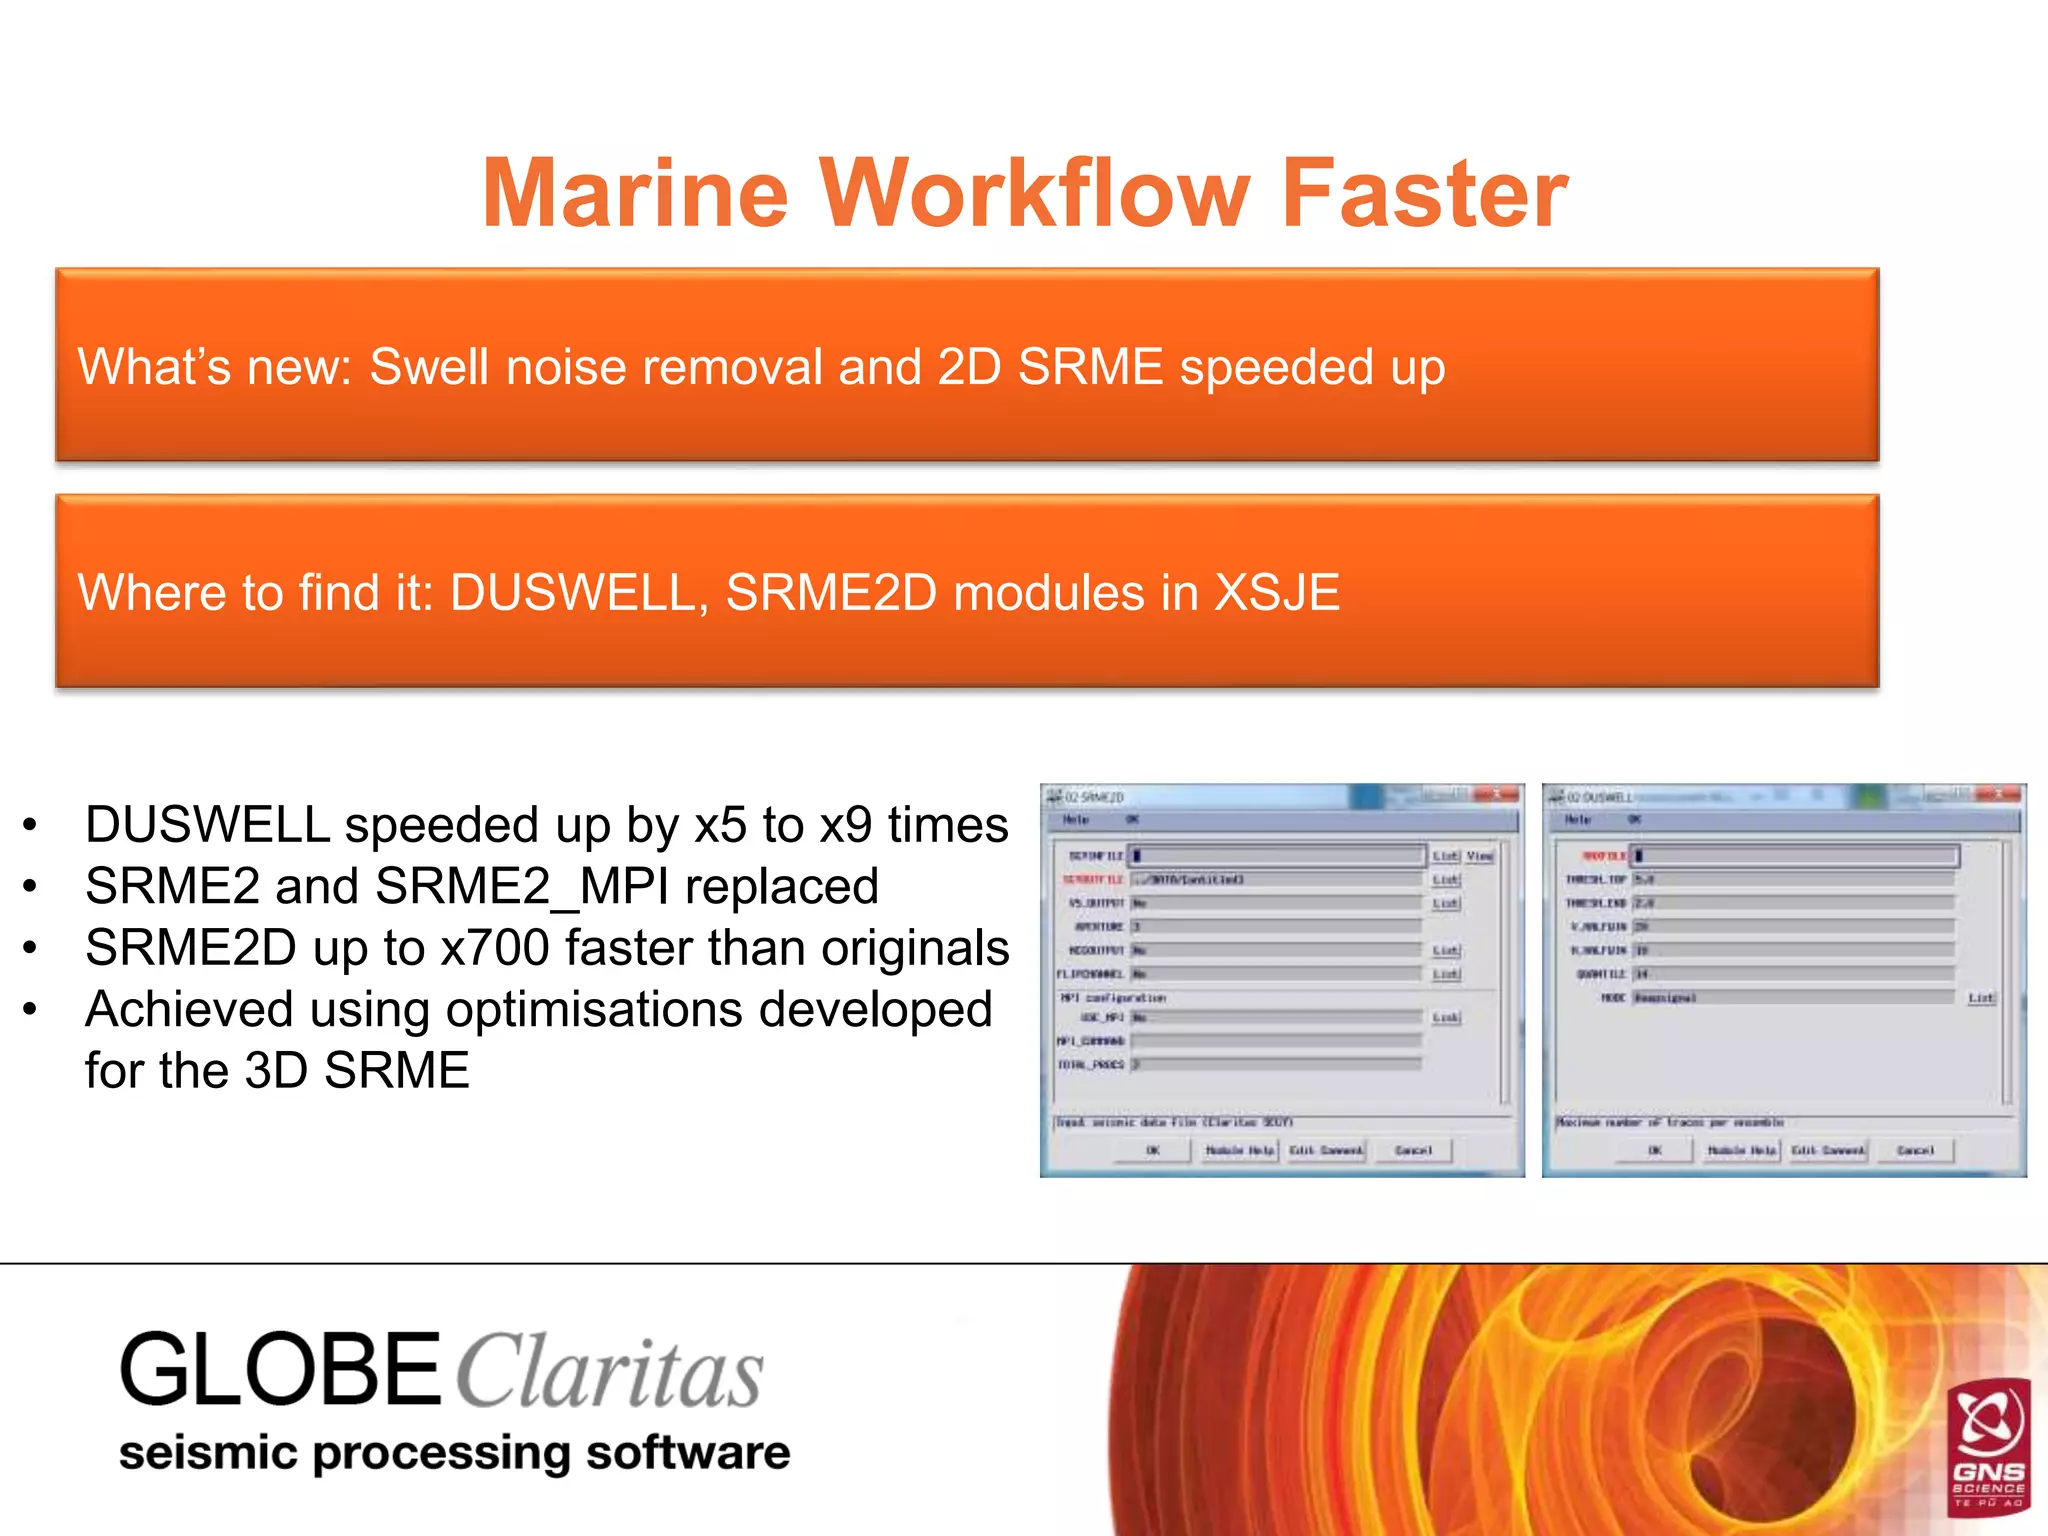

Version 6.2 introduces several new features including 3D surface-related multiple estimation, a new shot/receiver basemap plotting tool, and improved seismic display options, along with 212 bug fixes. Key enhancements include the ability to revert to original geometry after regularisation, faster workflows for swell noise removal and 2D SRME, and a new Condor application for visualizing seismic data. The updates facilitate better user control, efficiency, and accuracy in seismic data processing.


