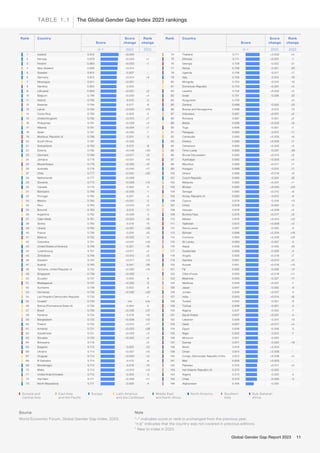
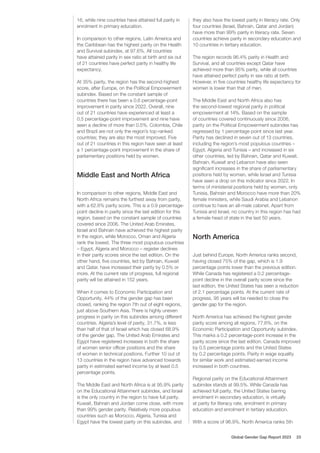
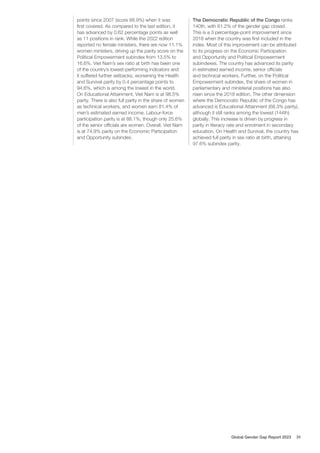
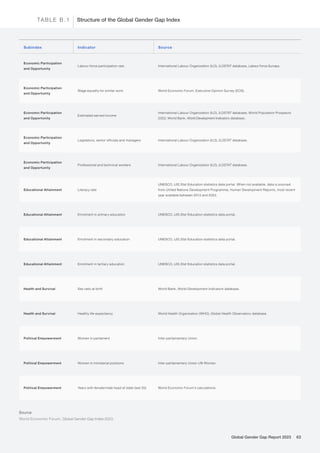
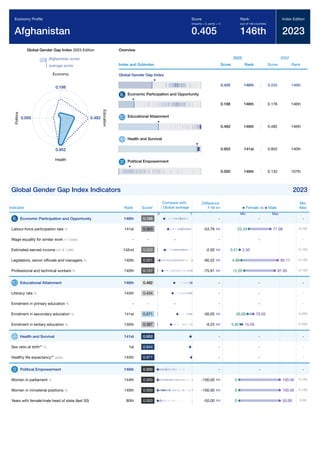
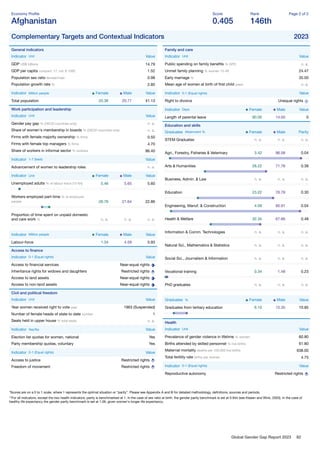
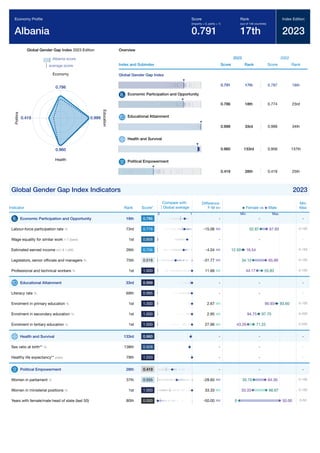
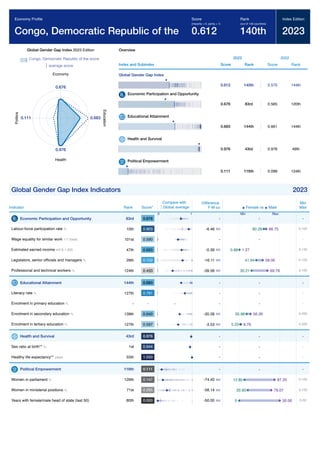
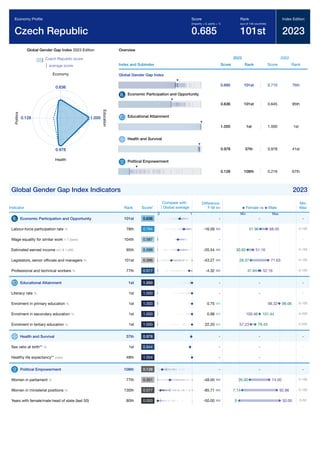
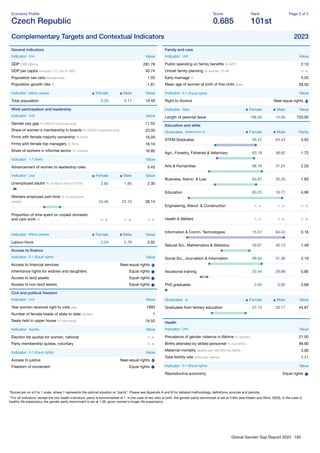
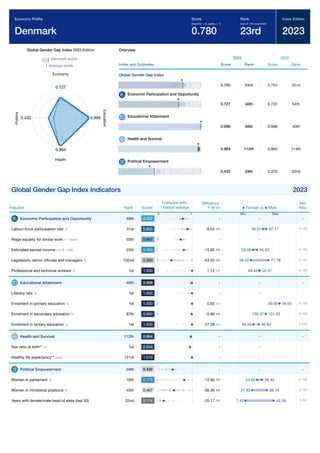
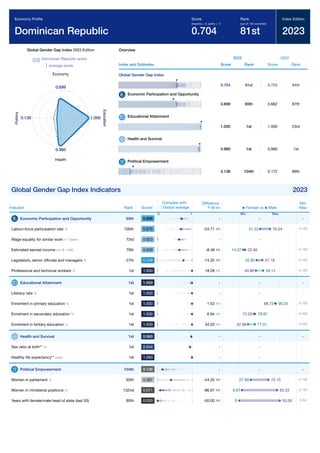
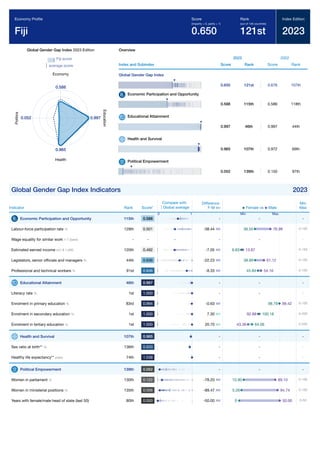
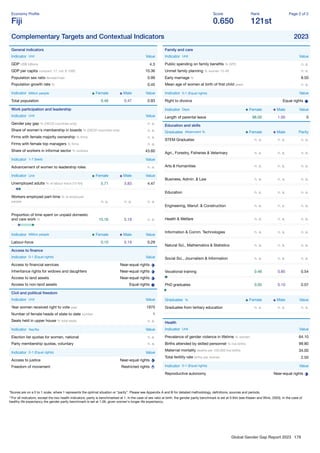
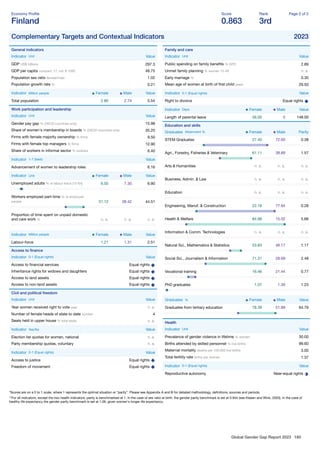
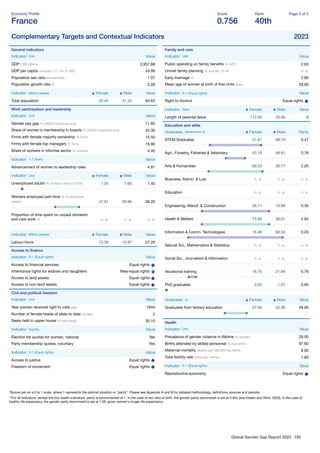
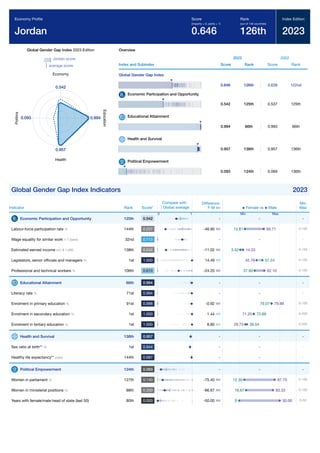
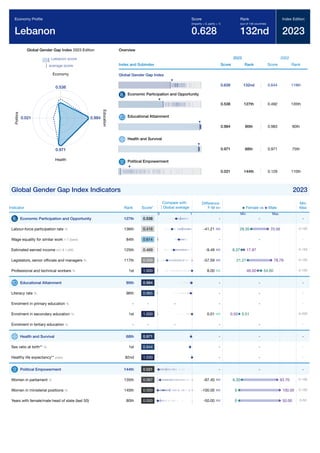
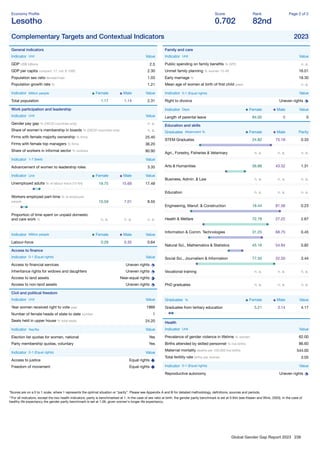
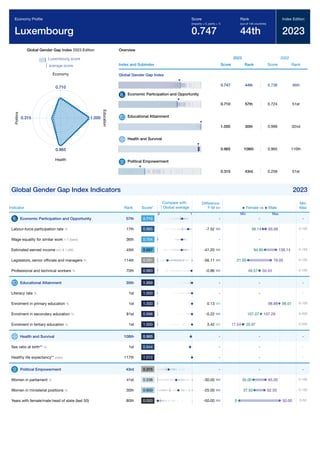
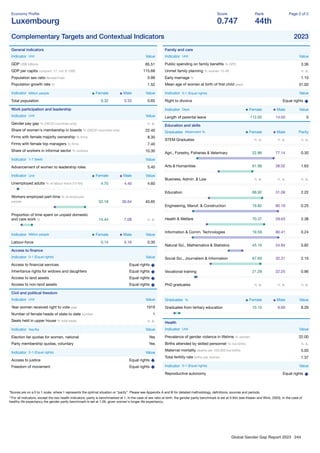
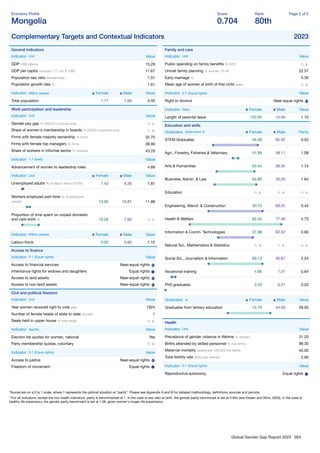
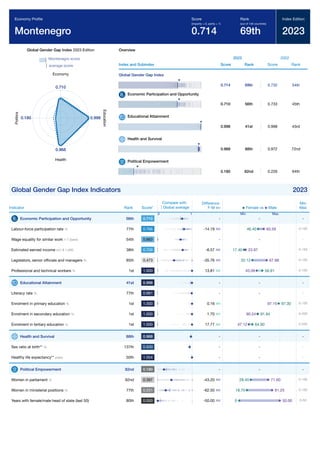
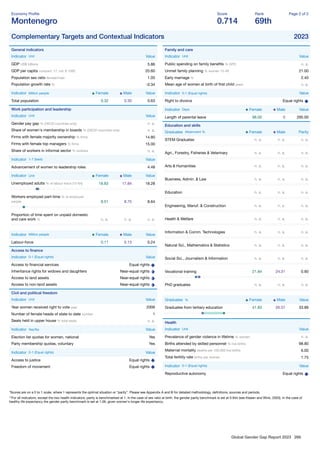
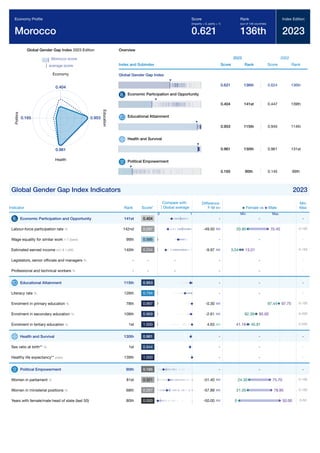
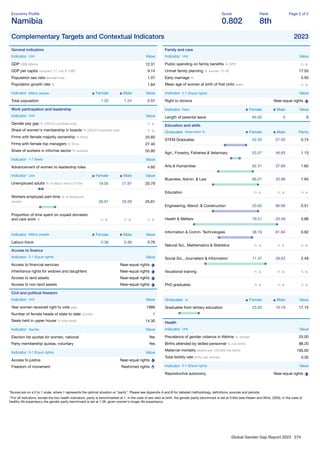
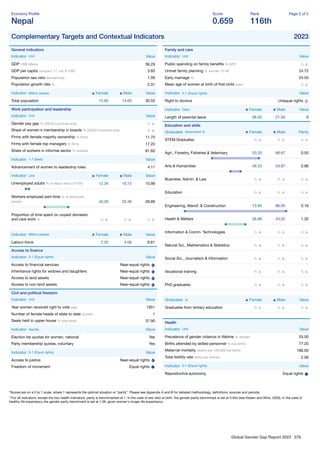
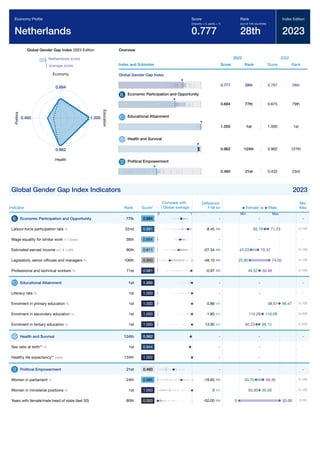
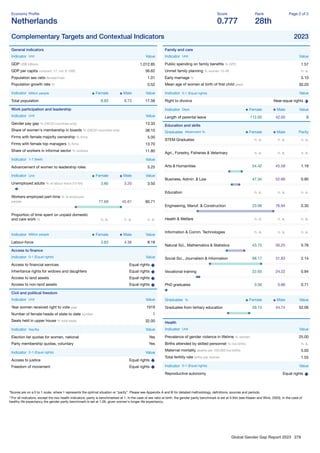
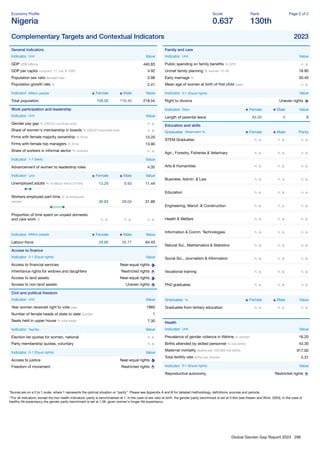
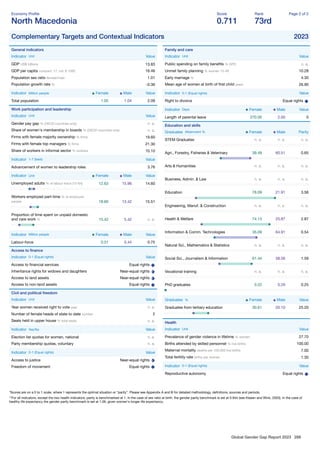
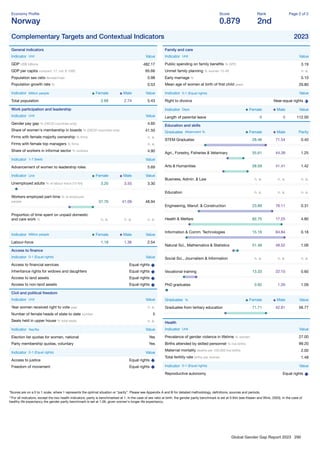
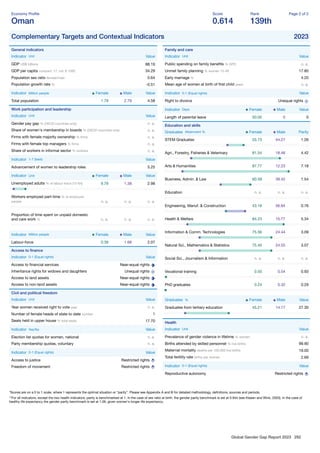
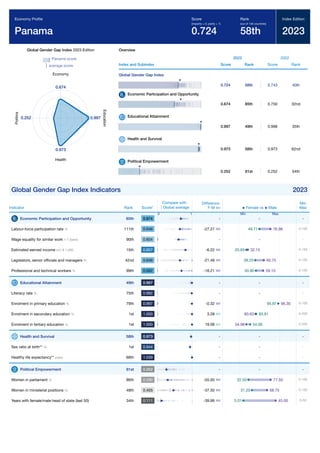
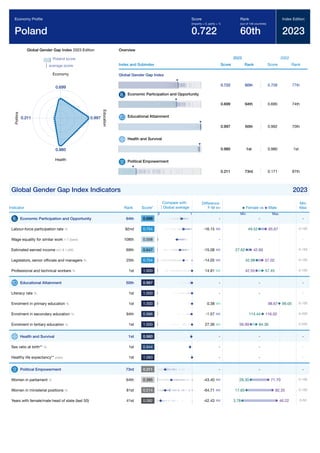
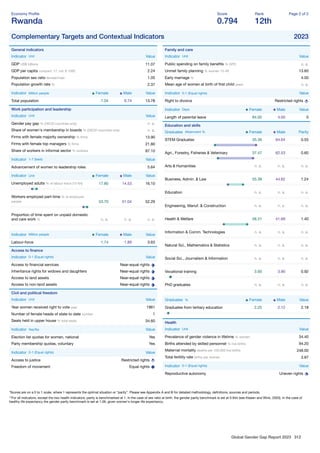
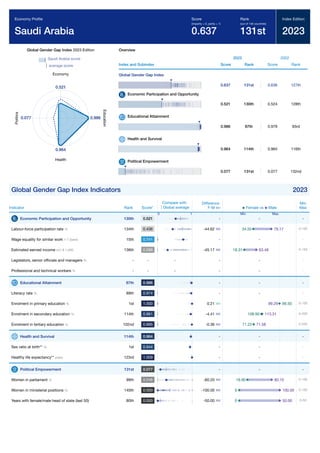
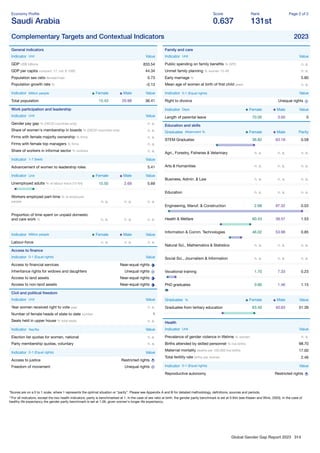
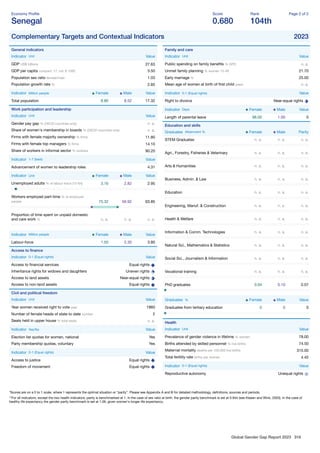
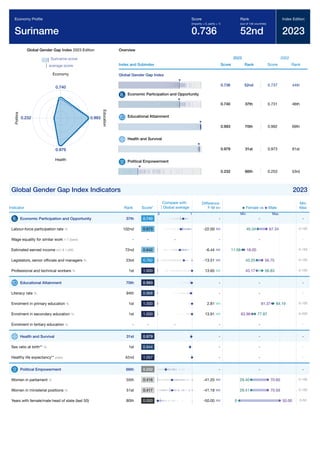
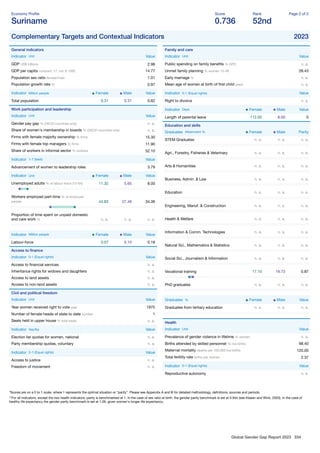
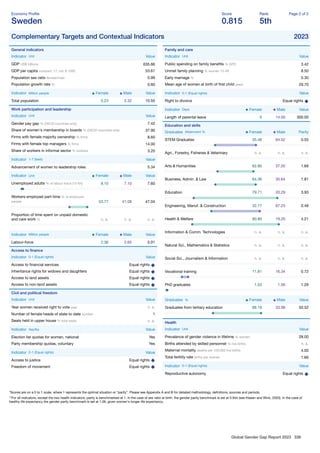
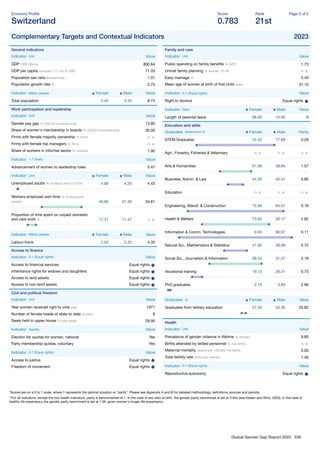
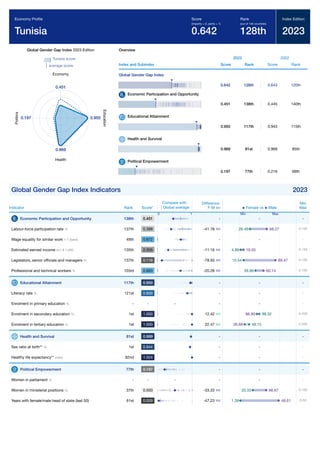
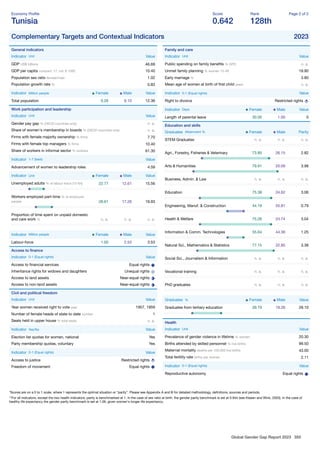
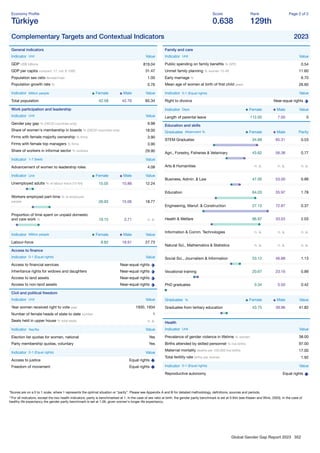
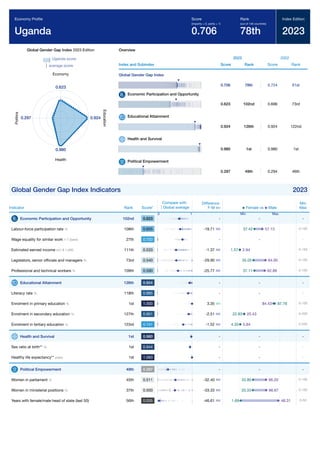
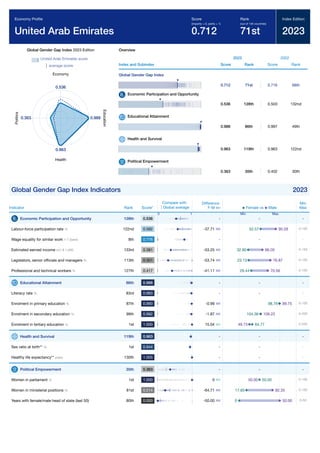
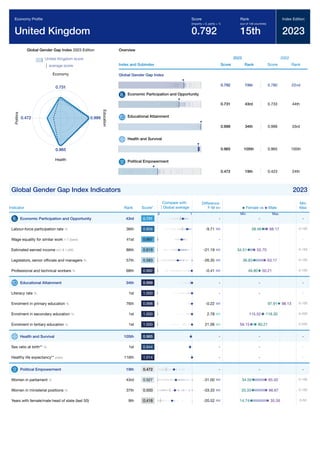
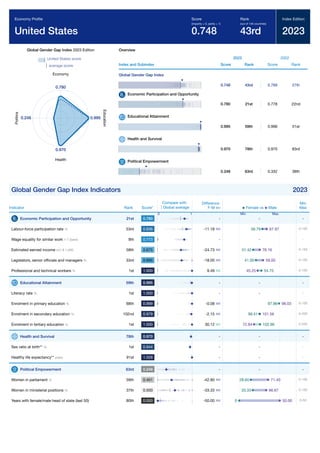
The document provides a summary of key findings from the 2023 Global Gender Gap Report. It finds that the global gender gap score has increased slightly to 68.4% closed, with no country achieving full parity. The top countries have closed over 80% of their gender gaps. Health and education gaps are nearly closed, while economic and political gaps remain much wider. At current rates, full parity will take over 100 years. Regional results vary considerably, with Europe having the highest parity score of 76.3% and the Middle East the lowest at 62.6%.

![Contents
Images: Getty Images, [Other Sources]
Preface
Key Findings
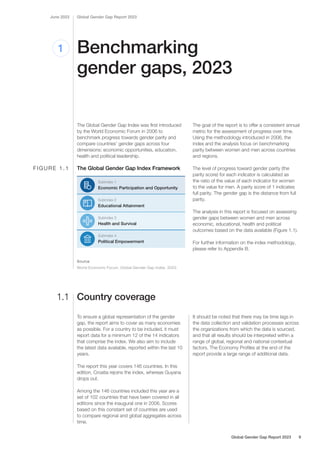
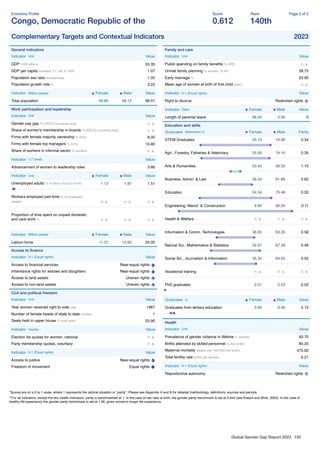
1 Benchmarking gender gaps, 2023
1.1 Country coverage
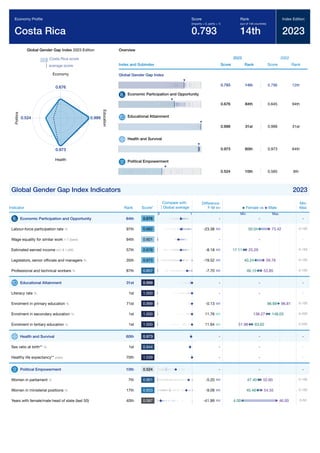
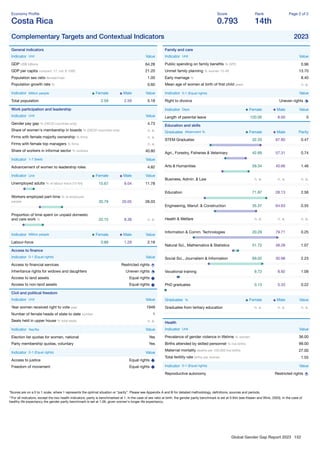
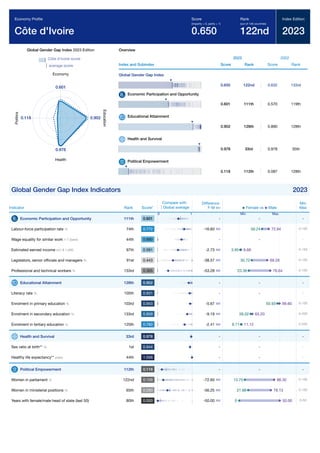
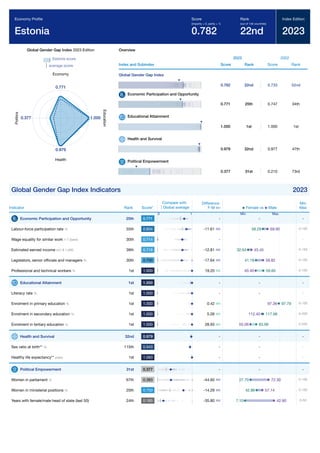
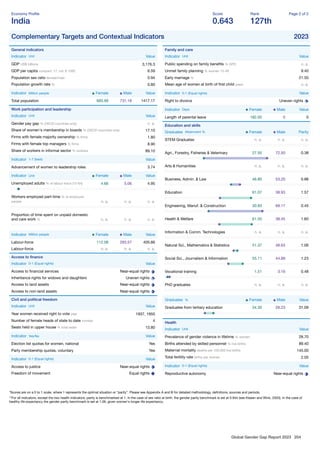
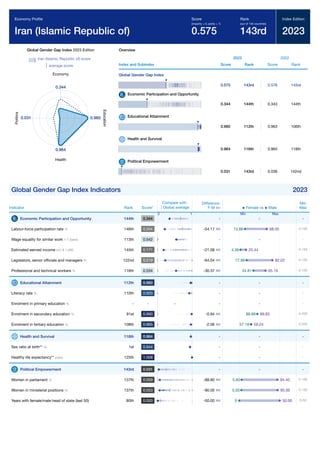
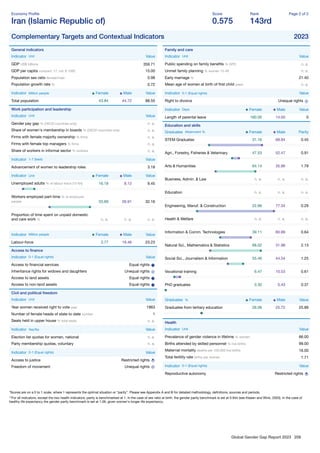
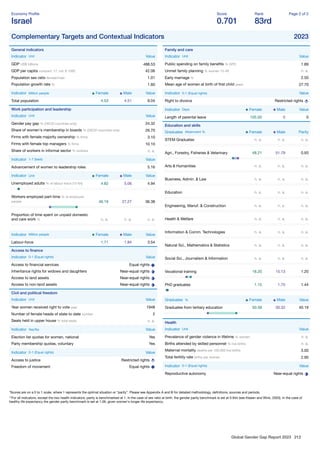
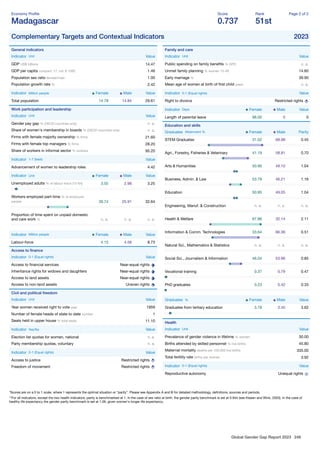
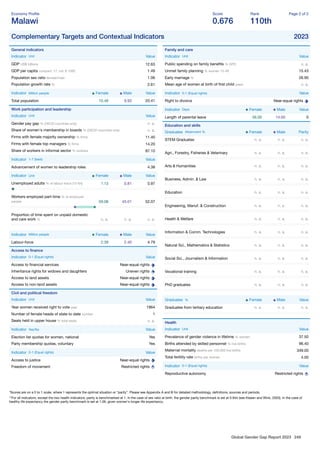
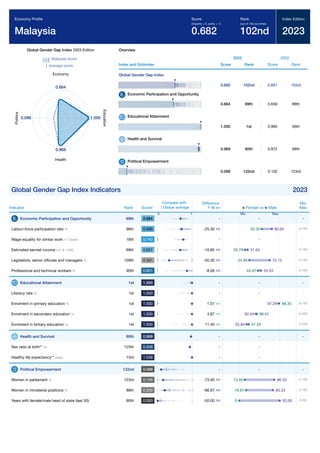
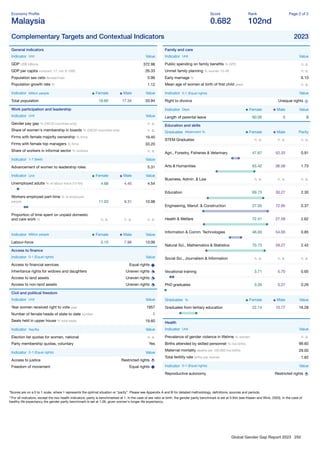
1.2 Global results
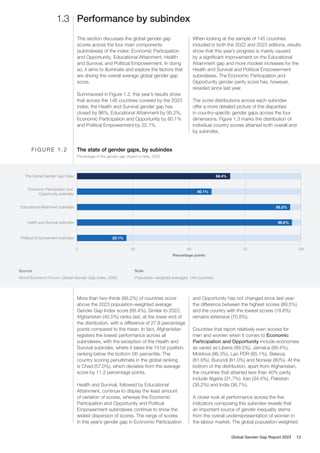
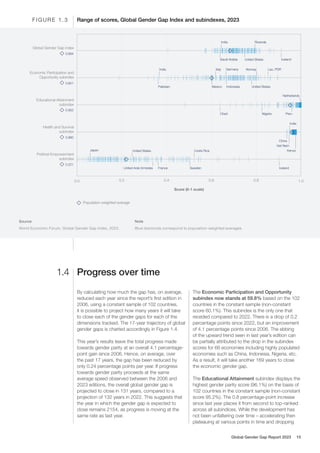
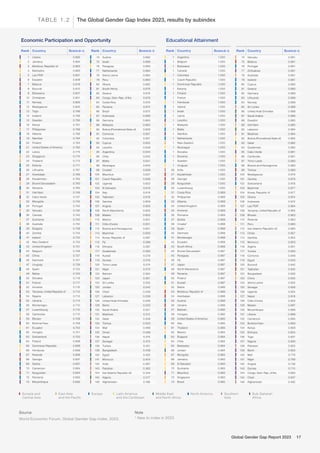
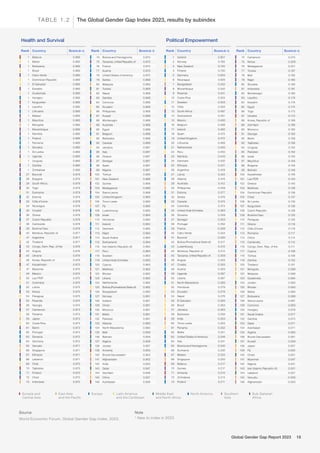
1.3 Performance by subindex
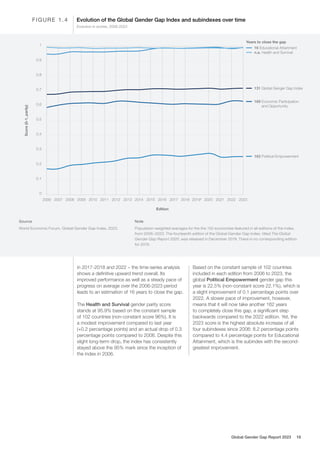
1.4 Progress over time
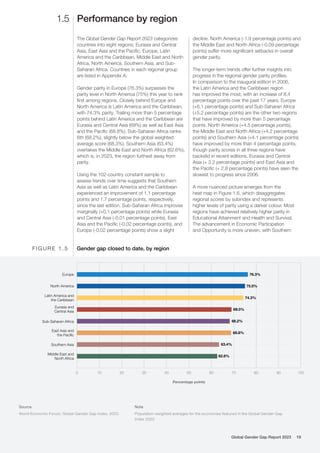
1.5 Performance by region
1.6 In-focus country performances: Top 10 and 15 most
populous
Endnotes
2 Gender gaps in the workforce
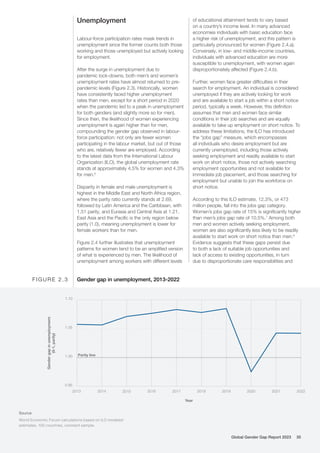
2.1 Evolving gender gaps in the global labour market
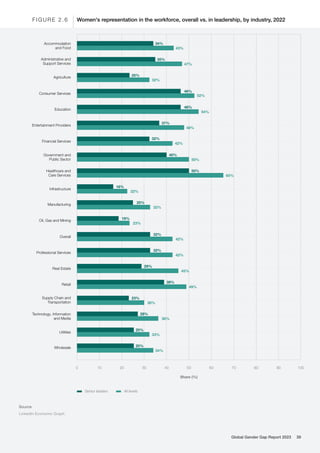
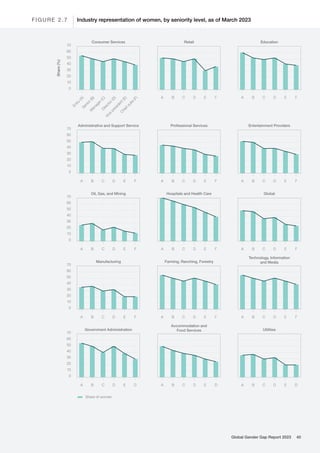
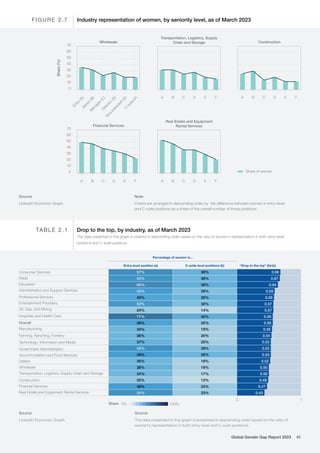
2.2 Workforce representation across industries
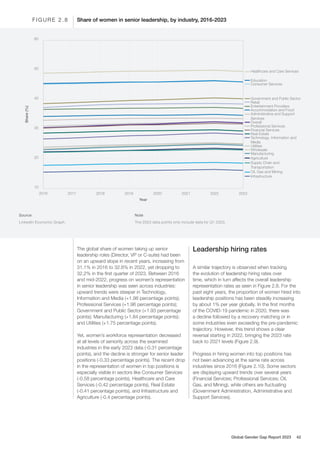
2.3 Representation of women in senior leadership
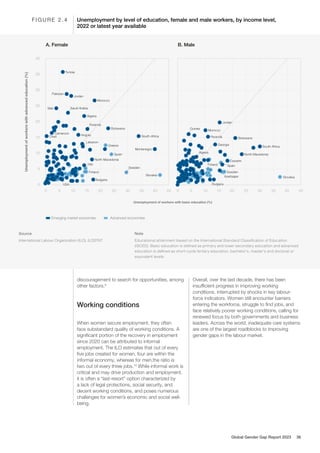
2.4 Gender gaps in the labour markets of the future
2.5 Gender gaps in the skills of the future
2.6 Gender gaps in political leadership
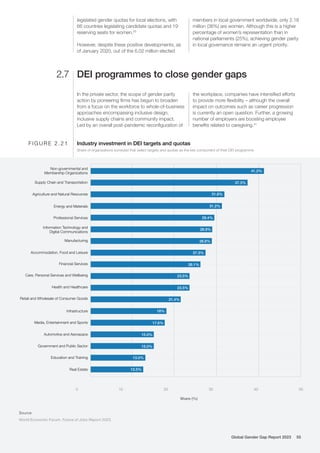
2.7 DEI programmes to close gender gaps
2.8 Putting gender parity at the heart of economic recovery and
transformation
Endnotes
References
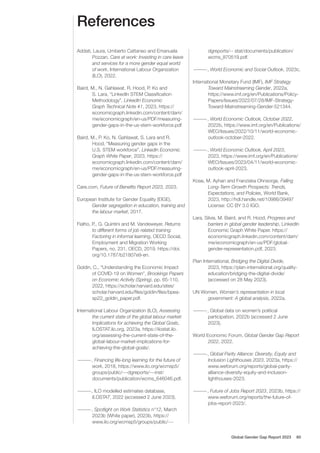
Appendix A
Appendix B
Endnotes
References
User’s Guide
Contributors and Acknowledgements
4
5
9
9
10
12
15
19
27
32
33
33
37
38
44
47
53
55
57
59
60
61
62
75
76
77
373
Global Gender Gap Report 2023 3](https://image.slidesharecdn.com/wefgggr2023-230621095619-dce8f2b8/85/Global-Gender-Gap-Report-2023-3-320.jpg)
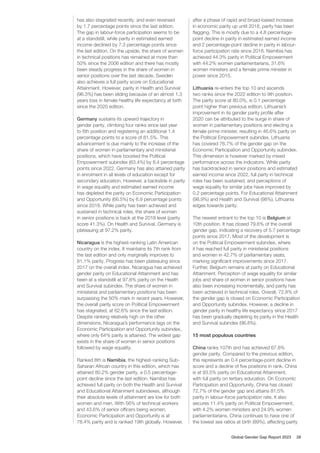
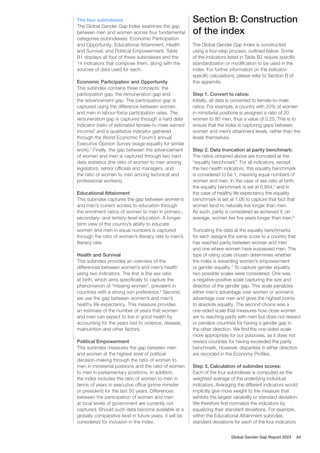
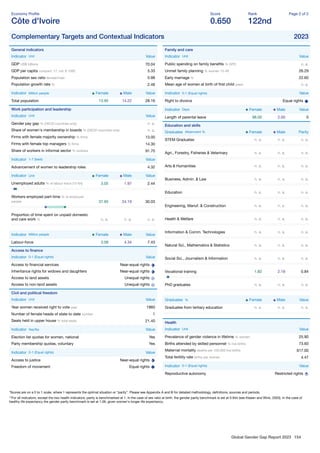
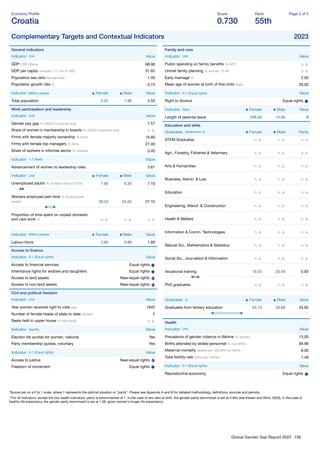
![Period: Moving average 2021-2022 or most recent
year available (no earlier than 2019-2020).
Source: World Economic Forum, Executive Opinion
Survey (EOS).
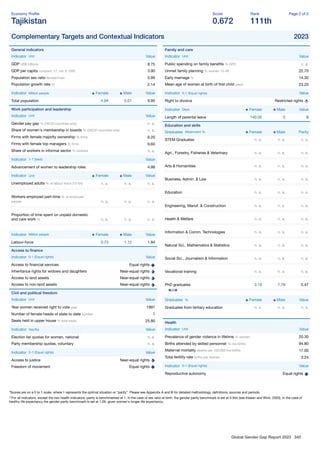
Estimated earned income, int’l $1,000s
The estimated female earned income is a proxy
for how much command women have over a
country’s economic resources. For each country,
it is computed using female and male shares of
the economically active population, the ratio of the
female to male wages (both indicators are sourced
from the ILO), gross domestic product valued
at constant 2017 international dollars (IMF), and
female and male shares of population (World Bank).
The methodology used to compute this indicator
is adapted from the methodology developed by
the United Nations Development Programme’s
Human Development Report Office for computing
the Gender Development Index (UNDP, 2021-2022,
pages 6-7).13
Female and male wage measures
used in the computation of the gender wage ratio
correspond to the mean nominal monthly earnings
of female and male employees, respectively. In
the absence of wage data, a gender wage ratio of
0.75 is used in the computation of the wage bill.
ILO’s measure of earning corresponds to the mean
of monthly earnings of all employees in nominal
terms. The earnings of employees relate to the
gross remuneration in cash and in kind paid to
employees, as a rule at regular intervals, for time
worked or work done together with remuneration
for time not worked, such as annual vacation,
other type of paid leave or holidays. Earnings
exclude employers’ contributions with respect to
employees’ social security and pension schemes
and also the benefits received by employees under
these schemes. Earnings also exclude severance
and termination pay. Statistics of earnings relate
to the gross remuneration of employees, i.e. the
total before any deductions are made by the
employer. The measurement period of this indicator
corresponds to that of the wage data. In the
Economy Profiles, values reported are the estimated
average annual earned income per capita in
constant 2017 international dollars for women and
men, respectively, and the ratio of the two values.
Period: 2021 or most recent year available.
Source: International Labour Organization (ILO),
ILOSTAT; International Monetary Fund (IMF), World
Economic Outlook; World Bank, World Development
Indicators.
Legislators, senior officials and managers, %
Ratio of women to men employed in senior roles,
defined by the ILO as those who plan, direct,
coordinate and evaluate the overall activities of
enterprises, governments and other organizations,
or of organizational units within them, and
formulate and review their policies, laws, rules and
regulations. It corresponds to Major Group 1 of the
International Standard Classification of Occupations
(ISCO-08).14
Period: 2022 or most recent year available.
Source: International Labour Organization (ILO),
ILOSTAT.
Professional and technical workers, %
Ratio of women to men employed in professional
and technical roles, defined by the ILO as those
who increase the existing stock of knowledge,
apply scientific or artistic concepts and theories
or those who perform technical and related tasks
that require advanced knowledge and skill. It
corresponds to the sum of Major Groups 2 and
3 of the International Standard Classification of
Occupations (ISCO-08).
Period: 2022 or most recent year available.
Source: International Labour Organization (ILO),
ILOSTAT.
Literacy rate, %
Percentage of the adult population (women and
men over 15 years of age) with the ability to
both read and write and make simple arithmetic
calculations. For advanced economies for which
data was unavailable in the last 10 years, the
authors assumed based on older data that the
gender gap on literacy rate is closed.
Period: 2021 or most recent year available.
Source: UNESCO, UIS.Stat education statistics
data portal; when not available, data is sourced
from the UNDP Human Development Reports, most
recent data available.
Enrolment in primary education, %
Percentage of girls and boys in the official primary
school age range (Net Enrolment rate in Primary
education) who are enrolled in primary education
(International Standard Classification of Education
[ISCED] 1).15
Period: 2021 or most recent year available.
Source: UNESCO, UIS.Stat education statistics
data portal.
Enrolment in secondary education, %
Based on Gross Enrolment Ratio (GER). Measures
the percentage of girls and boys enrolled in
secondary education, regardless of age, expressed
as a percentage of the official school-age
population corresponding to secondary education.
A high GER generally indicates a high degree of
participation, whether the pupils belong to the
official age group or not. A GER value approaching
or exceeding 100% indicates that a country is, in
Global Gender Gap Report 2023 67](https://image.slidesharecdn.com/wefgggr2023-230621095619-dce8f2b8/85/Global-Gender-Gap-Report-2023-67-320.jpg)


![[DSC Europe 25] Tali Fulman - Guild Meetings, Then What? Building Data Commun...](https://cdn.slidesharecdn.com/ss_thumbnails/fgohhi33rwmhqdowdj5k-tali-fulman-guild-meetings-then-what-building-data-communities-that-actually-ch-260120105855-528492c3-thumbnail.jpg?width=640&height=640&fit=bounds)
![[DSC Europe 25] Borko Kozomora - Optimizing business workflows with advances ...](https://cdn.slidesharecdn.com/ss_thumbnails/hbgekyb0txw0xpo4yfml-borko-kozomora-leading-ai-transformation-260122103838-cc29ee38-thumbnail.jpg?width=640&height=640&fit=bounds)


![[DSC Europe 25] Gordana Milutinovic Dumbelovic - From Insight to Oversight: A...](https://cdn.slidesharecdn.com/ss_thumbnails/t7dkjsfxqwwzceropjv4-gordana-milutinovicdumbelovic-from-insight-to-oversight-ai-driven-power-bi-moni-260119121559-9e0bf11b-thumbnail.jpg?width=640&height=640&fit=bounds)
![[DSC Europe 25] Mikhail Rozhkov - AI Product Canvas: From Business Goals to T...](https://cdn.slidesharecdn.com/ss_thumbnails/d53doddtpgfqivmzqel6-mikhail-rozhkov-ai-product-canvas-v1-260121115910-9dd517a7-thumbnail.jpg?width=640&height=640&fit=bounds)


![[DSC Europe 25] Egor Krasheninnikov - The Control Stack: Building Guardrails ...](https://cdn.slidesharecdn.com/ss_thumbnails/3lzcz7hxqmo51mtalv4u-the-control-stack-260119101520-ea90841a-thumbnail.jpg?width=640&height=640&fit=bounds)


