Download to read offline


![Part 2: Country Profiles
74 | The Global Gender Gap Report 2015
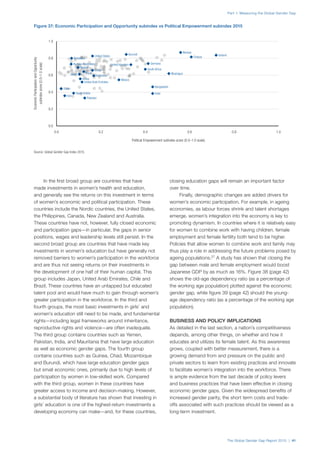
weighted by population across all 145 countries. The centre
of the chart corresponds to the lowest possible score (0),
while the outermost corners of the chart correspond to
the highest possible score (1), or equality. Please note that
the equality benchmark is 1 for all indicators, except Sex
ratio at birth (0.944) and Healthy life expectancy (1.06).
Therefore, the equality benchmark of 1 for the Health and
Survival subindex is not strictly accurate.
PERFORMANCE RELATIVE TO INCOME GROUP
The chart in the bottom right-hand side compares the
country’s index and subindex scores with its income
group maximum, minimum and average values. There are
four different income groups: low income, lower-middle
income, upper-middle income and high income. Income
classifications are taken from the World Bank. Further
details can be found in Table A2 of Appendix A.
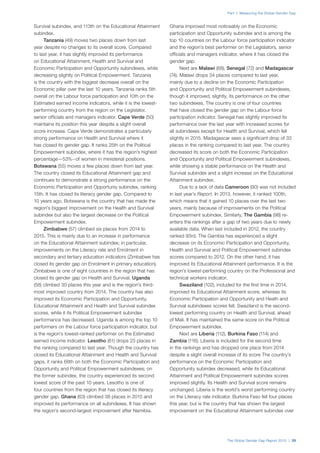
COUNTRY PROFILES: PAGE 2
The second page of each Country Profile displays each
country’s evolution on the overall index and on the
subindexes, both numerically and visually. In addition,
this page provides over 50 contextual indicators for each
country.
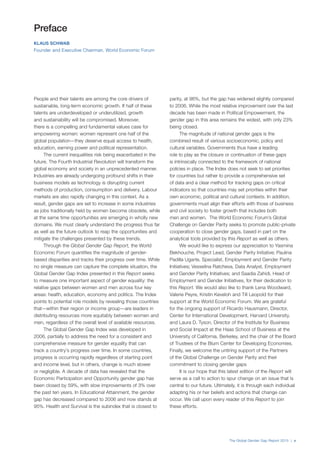
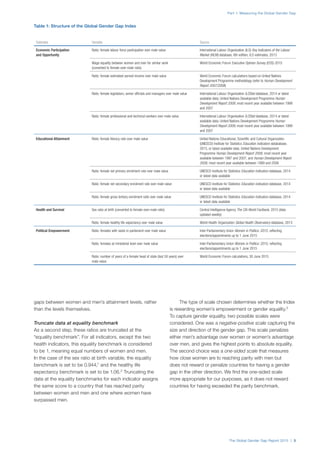
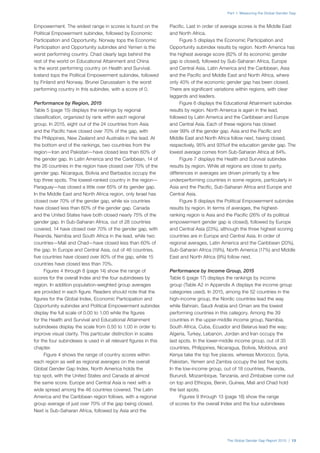
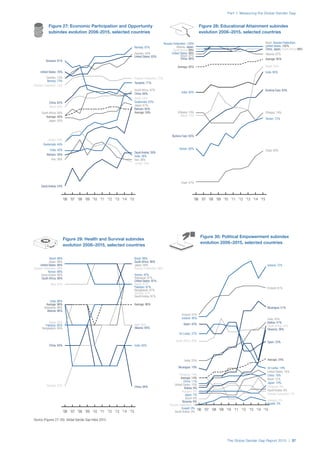
INDEX OVER THE YEARS
The first section of the second page of each Country Profile
presents the evolution of that country’s overall performance
on the Global Gender Gap Index from 2006 to 2015, and on
the four subindexes (Economic Participation and Opportunity,
Educational Attainment, Health and Survival and Political
Empowerment), measured by changes in rank and score (on
a 0-to-1 scale). The last line shows the difference in score
between 2006 and 2015 (or a shorter period if a country was
included after 2006) for the Index and the four subindexes.
The values are marked with either a downward or upward
trending arrow to represent a decrease or increase in score.
Please note that for decreasing values truncated at 0.000
there is no negative sign.
SELECTED CONTEXTUAL DATA
The final section compiles a selection of data that provide
a more comprehensive overview of the country’s gender
gap, and includes social and policy indicators. These data
were not used to calculate the Global Gender Gap Index
2015. The indicators in this section are displayed in five
broad categories: Employment and Leadership; Education
and Technology; Health; Family; and Rights and Norms.
When both data are available and relevant, female data
are displayed first, in blue, and male data are displayed
second, in black.
Employment and Leadership
• Female, male adult unemployment (as % of
female, male labour force): Source is the World
Bank’s World Development Indicators (WDI) online
database, 2013 or latest available data (accessed
July 2015). Unemployment refers to the share of the
labour force that is without work but available for and
seeking employment. Definitions of labour force and
unemployment differ by country.
• Female, male part-time employment (as % of total
female, male employment): Source is the World
Bank’s World Development Indicators (WDI) online
database, 2012 or latest available data (accessed
June 2015). Part-time employment refers to regular
employment in which working time is substantially less
than normal. Definitions of part-time employment differ
by country.
• Female, male workers in informal employment
(% of non-agricultural employment): Source is the
International Labour Organization’s Laborsta Informal
economy-cross-country online database, 2010 or
latest available data (accessed June 2015). Excludes
employment in agriculture, hunting, forestry and fishing
activities.
• Share of women in wage employment in the non-
agricultural sector (% of total non-agricultural
employment): Source is the World Bank’s World
Development Indicators (WDI) online database, 2012
or latest available data (accessed July 2015). Measures
the share of women in wage employment in the non-
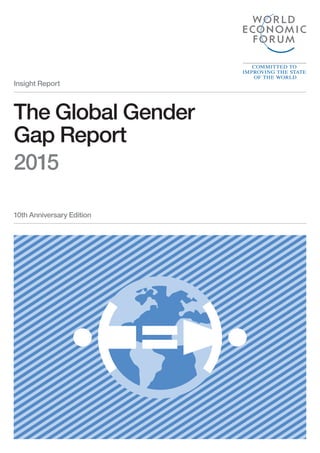
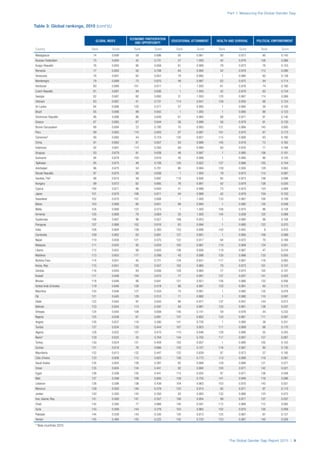
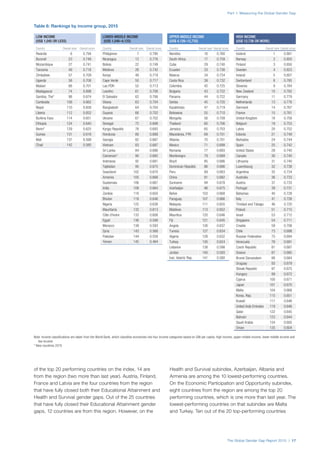
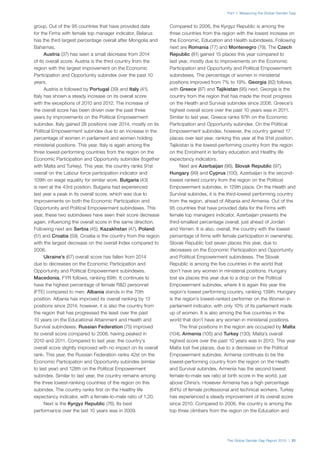
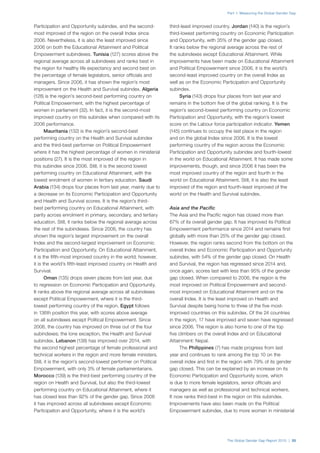
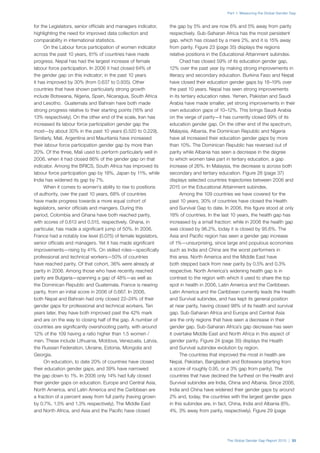
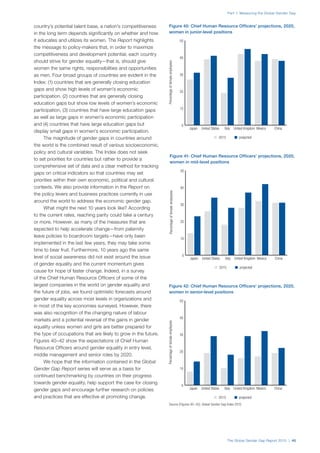
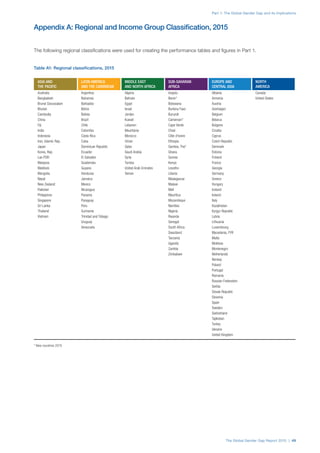
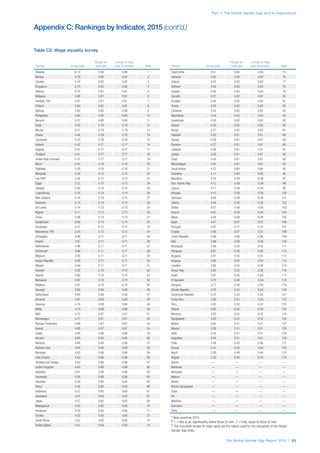
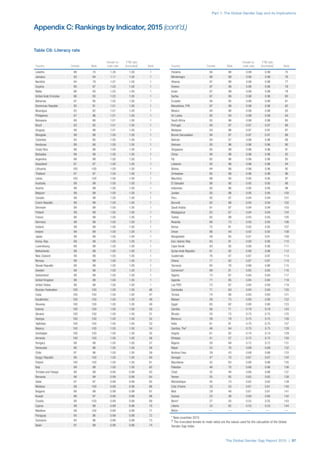
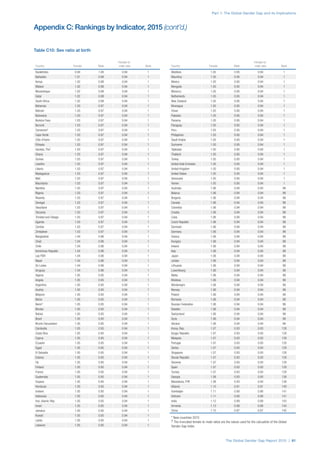
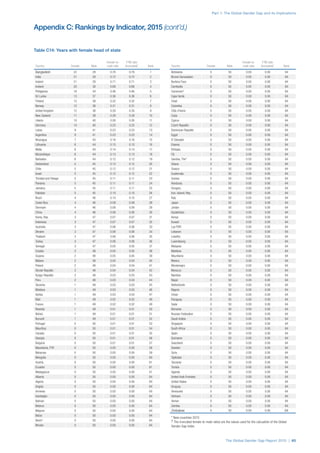
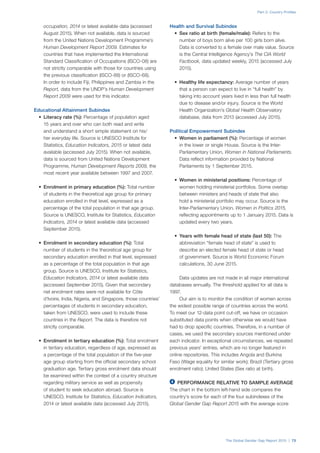
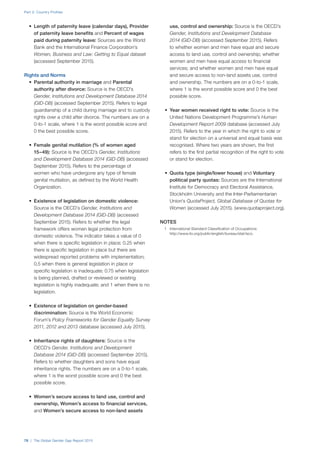
Index over the years
SAMPLE INDEX ECONOMY EDUCATION HEALTH POLITICS
Year No. of countries Rank Score Rank Score Rank Score Rank Score Rank Score
2015 145 70 0.701 69 0.671 98 0.972 142 0.947 50 0.214
2014 142 83 0.687 78 0.653 98 0.970 139 0.941 55 0.183
2013 136 108 0.641 87 0.632 92 0.976 134 0.931 130 0.026
2012 135 91 0.665 63 0.666 76 0.989 133 0.931 105 0.075
2011 135 78 0.675 38 0.713 87 0.981 135 0.927 99 0.078
2010 134 78 0.673 51 0.681 52 0.994 131 0.937 97 0.079
2009 134 91 0.660 63 0.653 73 0.991 122 0.955 125 0.041
2008 130 87 0.659 62 0.649 68 0.991 118 0.955 119 0.041
2007 128 66 0.668 36 0.689 48 0.992 116 0.955 117 0.038
2006 115 61 0.661 38 0.661 58 0.989 110 0.955 105 0.038
2006–2015 CHANGE ▲ 0.040 ▲ 0.010 ▼ –0.017 ▼ –0.009 ▲ 0.177
Part 2: Country Profiles
The Global Gender Gap Report 2015
1 Survey data, responses on a 1-to-7 scale (1 = worst score, 7 = best score)
2 Bracketed numbers show the range between the uncertainties, estimated to contain the true maternal mortality ratio with a 95% probability
3 Data on a 0-to-1 scale (1 = worst score, 0 = best score)
Albania
Selected contextual data
EMPLOYMENT AND LEADERSHIP
Female, male adult unemployment
(as % of female, male labour force).......................................................12.1, 14.5
Female, male part-time employment
(as % of total female, male employment) ..............................................50.2, 46.1
Female, male workers in informal employment
(as % of non-agricultural employment)....................................................... —, —
Share of women in wage employment in the non-agricultural sector
(% of total non-agricultural employment) ......................................................... 37
Average minutes spent per day on unpaid work (female, male).....................—, —
Percentage of women, men with an account
at a financial institution...............................................................................34, 43
Ability of women to rise to positions of leadership1 ............................................ 5.7
Firms with female top managers (% of firms)...................................................... 12
Share of women on boards of listed companies (%)............................................ —
Firms with female participation in ownership (% of firms) ................................... 13
Percentage of total R&D personnel (FTE) (female, male) .................................49, 51
EDUCATION AND TECHNOLOGY
Out-of-school children of primary school age (%) (female, male)....................59, 41
Female, male primary education attainment rate (% aged 25+) .....................94, 97
Female, male secondary education attainment rate (% aged 25+) .................85, 89
Female, male tertiary education attainment rate (% aged 25+) ......................12, 13
Percentage of tertiary-level students enrolled in STEM studies
(female, male) .............................................................................................39, 61
Percentage of tertiary-level graduates in STEM studies (female, male)...........52, 48
Percentage of PhD graduates (female, male) ..................................................55, 45
Percentage of individuals using the internet (female, male) ...........................—, —
Percentage of individuals using a
mobile cellular telephone (female, male) ....................................................—, —
HEALTH
Cardiovascular disease age-standardized deaths
per 100,000 (female, male)...............................................................417.6, 447.4
Cancer age-standardized deaths per 100,000
excl. non-melanoma skin cancer (female, male)................................105.3, 142.5
Diabetes age-standardized deaths per 100,000 (female, male) ....................7.4, 6.4
Chronic respiratory disease age-standardized deaths
per 100,000 (female, male)...................................................................27.8, 42.4
HEALTH (cont’d.)
HIV/AIDS age-standardized deaths per 100,000 (female, male) ....................0.1, 0.1
Malaria age-standardized deaths per 100,000 (female, male) ......................0.0, 0.0
Tuberculosis age-standardized deaths per 100,000 (female, male)...............0.3, 0.2
Malnutrition prev., weight for age (female, male) (% of children <5).............6.0, 6.6
Maternal mortality ratio (per 100,000 live births)2 ..................................21 [13–34]
Total fertility rate (children per women) .............................................................. 1.8
Adolescent fertility rate (births per 1,000 girls aged 15–19) ............................. 11.5
Antenatal care coverage, at least one visit (%) .................................................... 97
Births attended by skilled health personnel (%) ................................................... 99
Contraceptive prevalence, any method
(% of married or in-union women aged 15–49)................................................ 69
Existence of legislation permitting abortion
to preserve a woman’s physical health............................................................ Yes
FAMILY
Singulate mean age (years) at marriage (female, male)..................................25, 29
Early marriage (% of women aged 15–19) ............................................................ 7
Mean age of women at the birth of the first child................................................ —
Length of paid maternity leave (calendar days).................................................. 365
Provider of maternity leave benefits.......................................................Government
Percent of wages paid during maternity leave ..................................................... 65
Length of paid paternity leave (calendar days)..................................................... —
Provider of paternity leave benefits...................................................................... —
Percent of wages paid during paternity leave ...................................................... —
RIGHTS AND NORMS
Parental authority in marriage3........................................................................... 0.0
Parental authority after divorce3 ......................................................................... 0.0
Female genital mutilation (% of women aged 15–49)......................................... 0.0
Existence of legislation on domestic violence3.................................................... 0.3
Existence of legislation on gender-based discrimination..................................... Yes
Inheritance rights for daughters3........................................................................ 0.5
Women’s secure access to land use, control and ownership3............................. 0.5
Women’s access to financial services3 ............................................................... 0.0
Women’s secure access to non-land assets use, control and ownership3........... 0.5
Year women received right to vote................................................................... 1920
Quota type (single/lower house)................................... Legislated Candidate Quotas
Voluntary political party quotas............................................................................ No](https://image.slidesharecdn.com/theglobalgendergapreport2015-160119013910/85/The-Global-Gender-Gap-Report-2015-82-320.jpg)
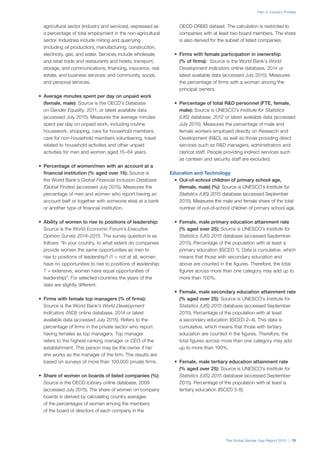


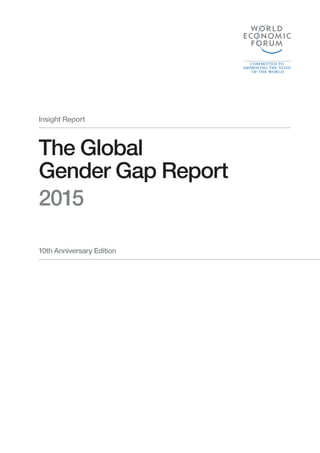
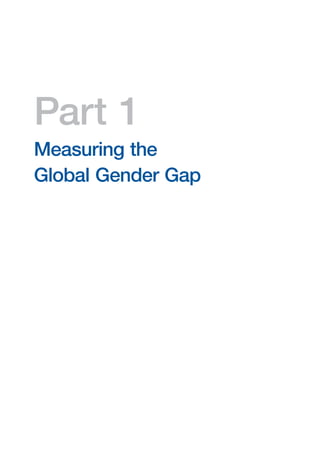
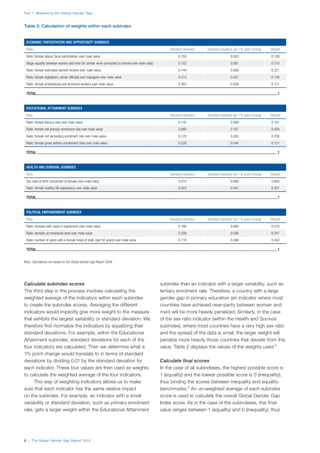
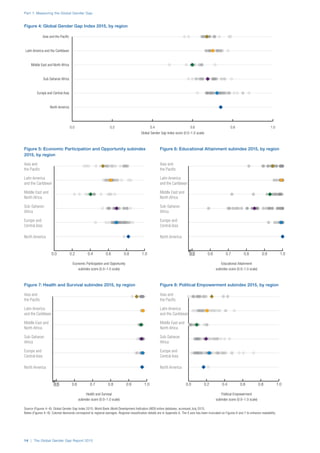
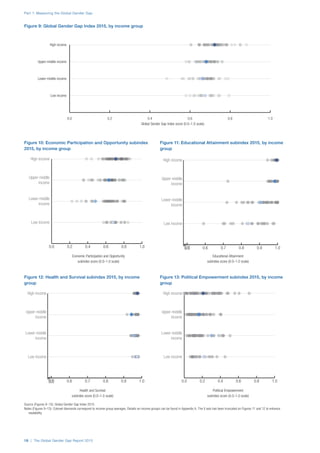
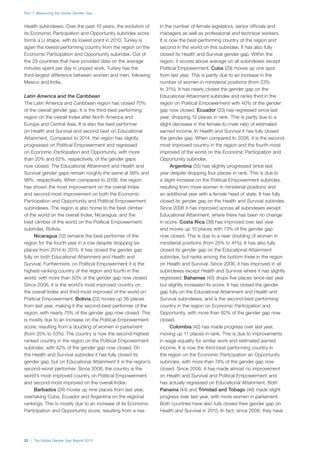
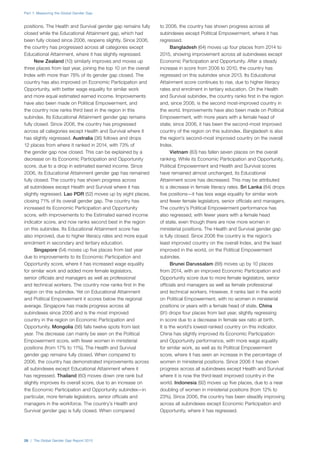
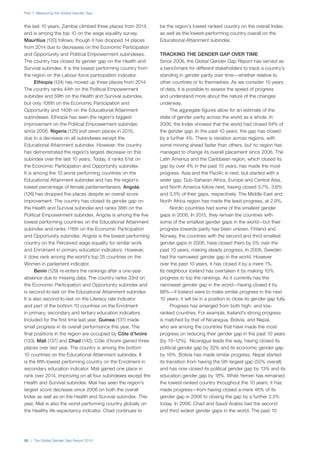
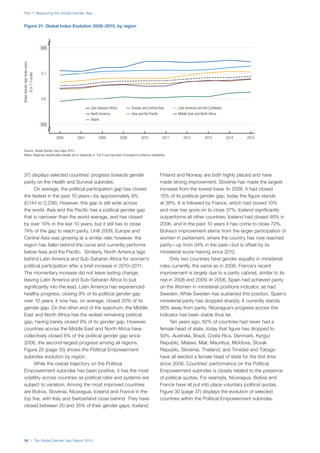
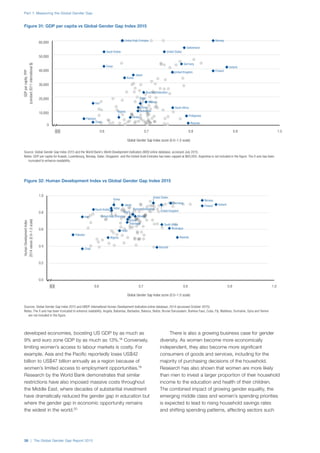
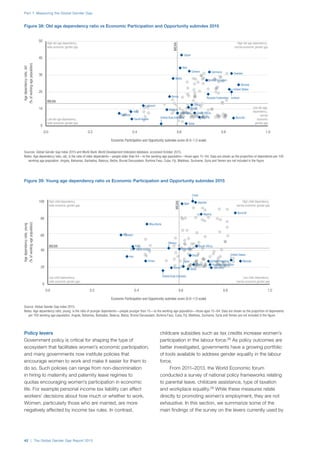
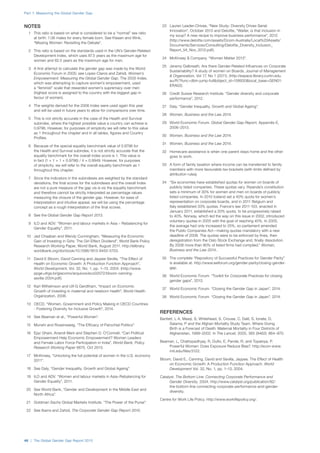
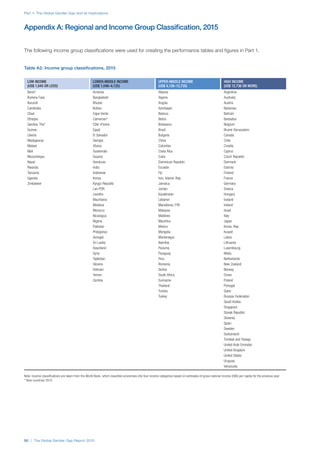
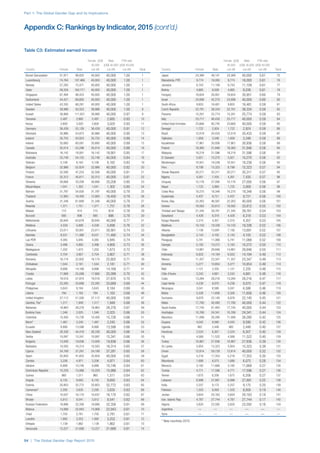
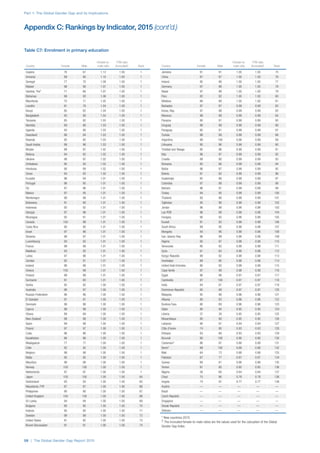
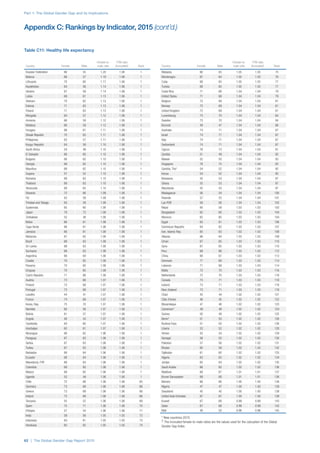
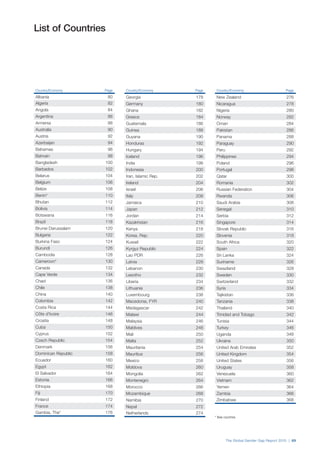
![Index over the years
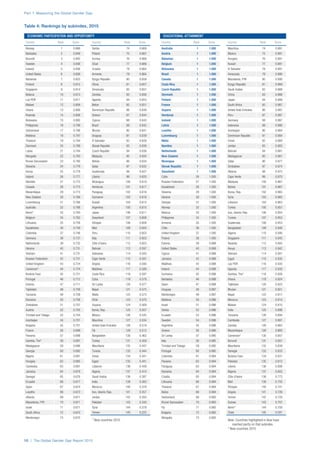
SAMPLE INDEX ECONOMY EDUCATION HEALTH POLITICS
Year No. of countries Rank Score Rank Score Rank Score Rank Score Rank Score
2015 145 70 0.701 69 0.671 98 0.972 142 0.947 50 0.214
2014 142 83 0.687 78 0.653 98 0.970 139 0.941 55 0.183
2013 136 108 0.641 87 0.632 92 0.976 134 0.931 130 0.026
2012 135 91 0.665 63 0.666 76 0.989 133 0.931 105 0.075
2011 135 78 0.675 38 0.713 87 0.981 135 0.927 99 0.078
2010 134 78 0.673 51 0.681 52 0.994 131 0.937 97 0.079
2009 134 91 0.660 63 0.653 73 0.991 122 0.955 125 0.041
2008 130 87 0.659 62 0.649 68 0.991 118 0.955 119 0.041
2007 128 66 0.668 36 0.689 48 0.992 116 0.955 117 0.038
2006 115 61 0.661 38 0.661 58 0.989 110 0.955 105 0.038
2006–2015 CHANGE s 0.040 s 0.010 t –0.017 t –0.009 s 0.177
Part 2: Country Profiles
The Global Gender Gap Report 2015 | 81
1 Survey data, responses on a 1-to-7 scale (1 = worst score, 7 = best score)
2 Bracketed numbers show the range between the uncertainties, estimated to contain the true maternal mortality ratio with a 95% probability
3 Data on a 0-to-1 scale (1 = worst score, 0 = best score)
Albania
Selected contextual data
EMPLOYMENT AND LEADERSHIP
Female, male adult unemployment
(as % of female, male labour force)........................................................12.1, 14.5
Female, male part-time employment
(as % of total female, male employment)...............................................50.2, 46.1
Female, male workers in informal employment
(as % of non-agricultural employment).......................................................—, —
Share of women in wage employment in the non-agricultural sector
(% of total non-agricultural employment).......................................................... 37
Average minutes spent per day on unpaid work (female, male)......................—, —
Percentage of women, men with an account
at a financial institution................................................................................34, 43
Ability of women to rise to positions of leadership1............................................. 5.7
Firms with female top managers (% of firms)....................................................... 12
Share of women on boards of listed companies (%)............................................. —
Firms with female participation in ownership (% of firms).................................... 13
Percentage of total R&D personnel (FTE) (female, male)..................................49, 51
EDUCATION AND TECHNOLOGY
Out-of-school children of primary school age (%) (female, male).....................59, 41
Female, male primary education attainment rate (% aged 25+)......................94, 97
Female, male secondary education attainment rate (% aged 25+)..................85, 89
Female, male tertiary education attainment rate (% aged 25+).......................12, 13
Percentage of tertiary-level students enrolled in STEM studies
(female, male)..............................................................................................39, 61
Percentage of tertiary-level graduates in STEM studies (female, male)............52, 48
Percentage of PhD graduates (female, male)...................................................55, 45
Percentage of individuals using the internet (female, male)............................—, —
Percentage of individuals using a
mobile cellular telephone (female, male).....................................................—, —
HEALTH
Cardiovascular disease age-standardized deaths
per 100,000 (female, male)................................................................417.6, 447.4
Cancer age-standardized deaths per 100,000
excl. non-melanoma skin cancer (female, male).................................105.3, 142.5
Diabetes age-standardized deaths per 100,000 (female, male).....................7.4, 6.4
Chronic respiratory disease age-standardized deaths
per 100,000 (female, male)....................................................................27.8, 42.4
HEALTH (cont’d.)
HIV/AIDS age-standardized deaths per 100,000 (female, male).....................0.1, 0.1
Malaria age-standardized deaths per 100,000 (female, male).......................0.0, 0.0
Tuberculosis age-standardized deaths per 100,000 (female, male)................0.3, 0.2
Malnutrition prev., weight for age (female, male) (% of children <5)..............6.0, 6.6
Maternal mortality ratio (per 100,000 live births)2...................................21 [13–34]
Total fertility rate (children per women)............................................................... 1.8
Adolescent fertility rate (births per 1,000 girls aged 15–19).............................. 11.5
Antenatal care coverage, at least one visit (%)..................................................... 97
Births attended by skilled health personnel (%).................................................... 99
Contraceptive prevalence, any method
(% of married or in-union women aged 15–49)................................................. 69
Existence of legislation permitting abortion
to preserve a woman’s physical health............................................................. Yes
FAMILY
Singulate mean age (years) at marriage (female, male)...................................25, 29
Early marriage (% of women aged 15–19)............................................................. 7
Mean age of women at the birth of the first child................................................. —
Length of paid maternity leave (calendar days)................................................... 365
Provider of maternity leave benefits........................................................Government
Percent of wages paid during maternity leave...................................................... 65
Length of paid paternity leave (calendar days)...................................................... —
Provider of paternity leave benefits....................................................................... —
Percent of wages paid during paternity leave....................................................... —
RIGHTS AND NORMS
Parental authority in marriage3............................................................................ 0.0
Parental authority after divorce3.......................................................................... 0.0
Female genital mutilation (% of women aged 15–49).......................................... 0.0
Existence of legislation on domestic violence3..................................................... 0.3
Existence of legislation on gender-based discrimination...................................... Yes
Inheritance rights for daughters3......................................................................... 0.5
Women’s secure access to land use, control and ownership3.............................. 0.5
Women’s access to financial services3................................................................ 0.0
Women’s secure access to non-land assets use, control and ownership3............ 0.5
Year women received right to vote.................................................................... 1920
Quota type (single/lower house).................................... Legislated Candidate Quotas
Voluntary political party quotas............................................................................. No](https://image.slidesharecdn.com/theglobalgendergapreport2015-160119013910/85/The-Global-Gender-Gap-Report-2015-89-320.jpg)

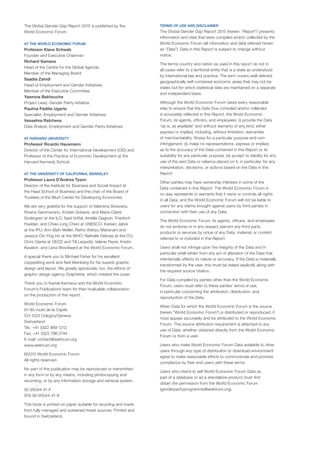
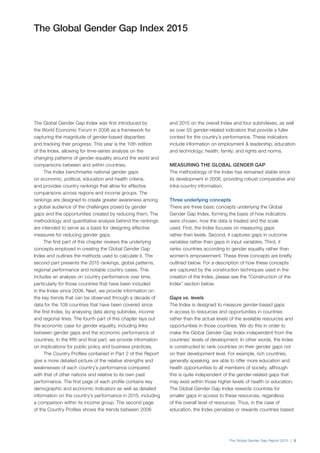
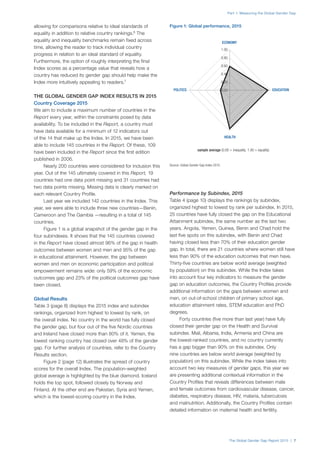
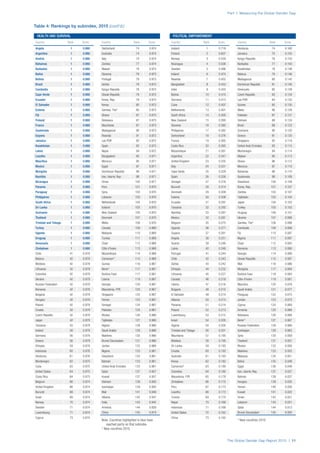
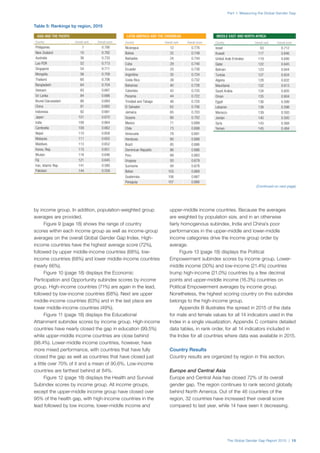
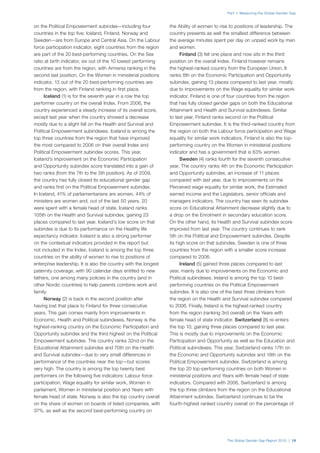
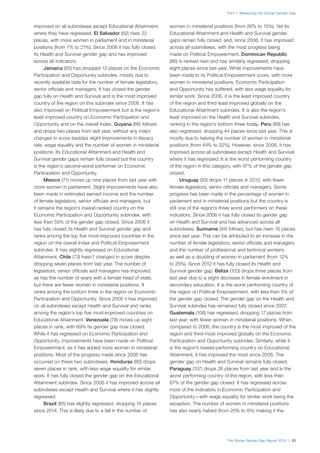
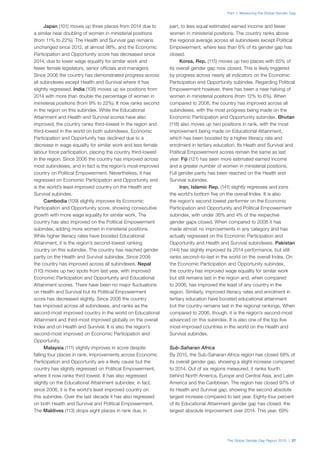
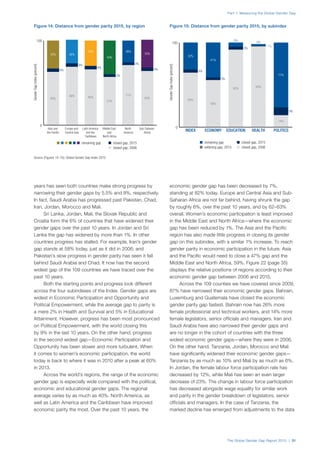
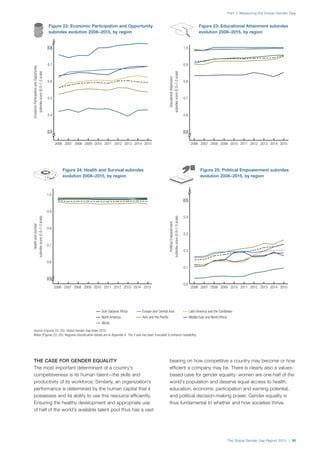
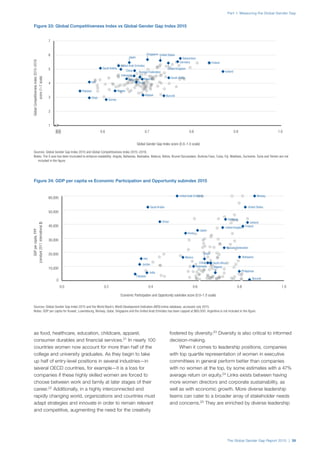
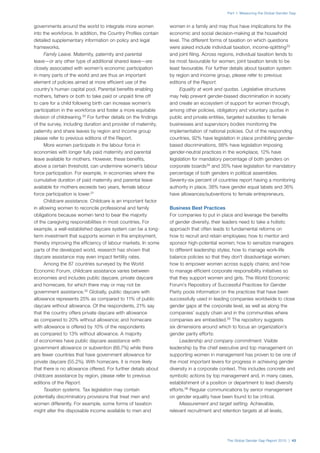
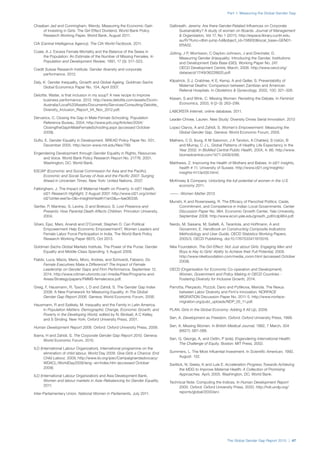
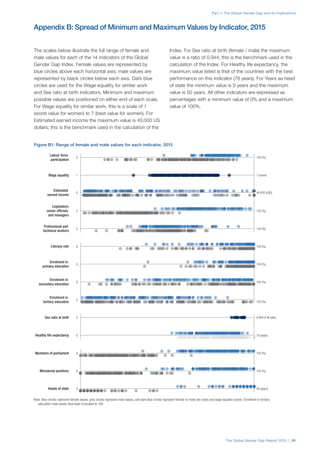
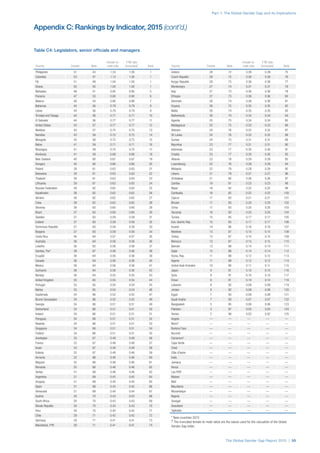
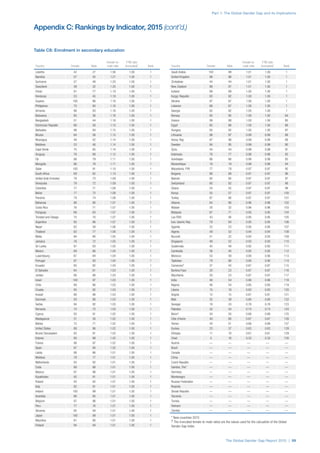
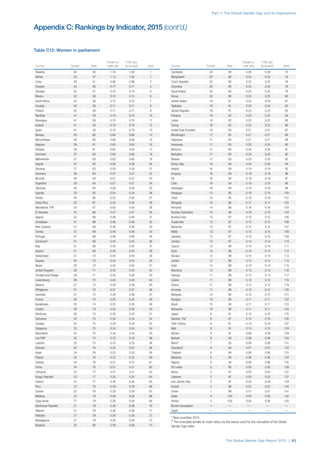
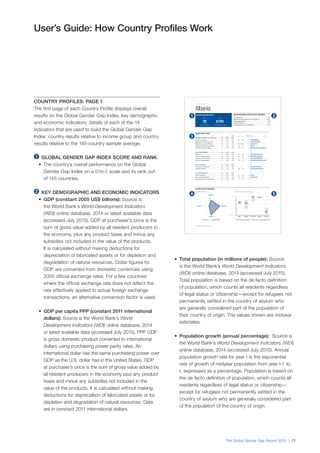
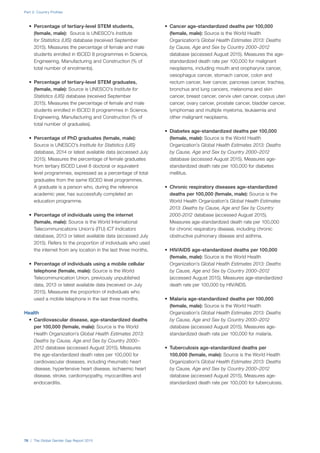
![Index over the years
SAMPLE INDEX ECONOMY EDUCATION HEALTH POLITICS
Year No. of countries Rank Score Rank Score Rank Score Rank Score Rank Score
2015 145 128 0.632 137 0.410 110 0.946 128 0.966 55 0.205
2014 142 126 0.618 136 0.393 113 0.936 124 0.966 60 0.177
2013 136 124 0.597 133 0.331 106 0.939 108 0.966 62 0.151
2012 135 120 0.611 131 0.378 103 0.950 108 0.966 57 0.151
2011 135 121 0.599 124 0.445 96 0.950 107 0.966 124 0.035
2010 134 119 0.605 119 0.467 99 0.953 106 0.966 123 0.035
2009 134 117 0.612 119 0.470 99 0.951 91 0.971 120 0.056
2008 130 111 0.611 115 0.468 96 0.949 86 0.971 115 0.056
2007 128 108 0.607 113 0.464 96 0.942 85 0.971 111 0.049
2006 115 97 0.602 103 0.443 84 0.944 78 0.971 98 0.049
2006–2015 CHANGE s 0.030 t –0.033 s 0.002 t –0.005 s 0.155
Part 2: Country Profiles
The Global Gender Gap Report 2015 | 83
1 Survey data, responses on a 1-to-7 scale (1 = worst score, 7 = best score)
2 Bracketed numbers show the range between the uncertainties, estimated to contain the true maternal mortality ratio with a 95% probability
3 Data on a 0-to-1 scale (1 = worst score, 0 = best score)
Algeria
Selected contextual data
EMPLOYMENT AND LEADERSHIP
Female, male adult unemployment
(as % of female, male labour force)..........................................................16.3, 8.3
Female, male part-time employment
(as % of total female, male employment)....................................................—, —
Female, male workers in informal employment
(as % of non-agricultural employment).......................................................—, —
Share of women in wage employment in the non-agricultural sector
(% of total non-agricultural employment).......................................................... 15
Average minutes spent per day on unpaid work (female, male)......................—, —
Percentage of women, men with an account
at a financial institution................................................................................40, 61
Ability of women to rise to positions of leadership1............................................. 4.4
Firms with female top managers (% of firms)....................................................... —
Share of women on boards of listed companies (%)............................................. —
Firms with female participation in ownership (% of firms).................................... 15
Percentage of total R&D personnel (FTE) (female, male)..................................33, 67
EDUCATION AND TECHNOLOGY
Out-of-school children of primary school age (%) (female, male).....................100, 0
Female, male primary education attainment rate (% aged 25+)......................38, 54
Female, male secondary education attainment rate (% aged 25+)..................21, 27
Female, male tertiary education attainment rate (% aged 25+)...........................0, 0
Percentage of tertiary-level students enrolled in STEM studies
(female, male)..............................................................................................45, 55
Percentage of tertiary-level graduates in STEM studies (female, male)............47, 53
Percentage of PhD graduates (female, male)..................................................—, —
Percentage of individuals using the internet (female, male)............................—, —
Percentage of individuals using a
mobile cellular telephone (female, male).....................................................—, —
HEALTH
Cardiovascular disease age-standardized deaths
per 100,000 (female, male)................................................................359.9, 434.6
Cancer age-standardized deaths per 100,000
excl. non-melanoma skin cancer (female, male).....................................78.0, 83.9
Diabetes age-standardized deaths per 100,000 (female, male).................58.7, 76.3
Chronic respiratory disease age-standardized deaths
per 100,000 (female, male)....................................................................22.9, 34.7
HEALTH (cont’d.)
HIV/AIDS age-standardized deaths per 100,000 (female, male).....................4.3, 2.0
Malaria age-standardized deaths per 100,000 (female, male).......................0.0, 0.0
Tuberculosis age-standardized deaths per 100,000 (female, male)............16.0, 25.1
Malnutrition prev., weight for age (female, male) (% of children <5)..............3.7, 3.7
Maternal mortality ratio (per 100,000 live births)2.................................89 [48–170]
Total fertility rate (children per women)............................................................... 2.8
Adolescent fertility rate (births per 1,000 girls aged 15–19)................................ 4.4
Antenatal care coverage, at least one visit (%)..................................................... 93
Births attended by skilled health personnel (%).................................................... 97
Contraceptive prevalence, any method
(% of married or in-union women aged 15–49)................................................. 56
Existence of legislation permitting abortion
to preserve a woman’s physical health............................................................. Yes
FAMILY
Singulate mean age (years) at marriage (female, male)...................................30, 33
Early marriage (% of women aged 15–19)............................................................. 2
Mean age of women at the birth of the first child................................................. —
Length of paid maternity leave (calendar days)..................................................... 98
Provider of maternity leave benefits........................................................Government
Percent of wages paid during maternity leave.................................................... 100
Length of paid paternity leave (calendar days)........................................................ 3
Provider of paternity leave benefits.............................................................Employer
Percent of wages paid during paternity leave..................................................... 100
RIGHTS AND NORMS
Parental authority in marriage3............................................................................ 1.0
Parental authority after divorce3.......................................................................... 0.5
Female genital mutilation (% of women aged 15–49).......................................... 0.0
Existence of legislation on domestic violence3..................................................... 0.8
Existence of legislation on gender-based discrimination....................................... —
Inheritance rights for daughters3......................................................................... 1.0
Women’s secure access to land use, control and ownership3.............................. 0.5
Women’s access to financial services3................................................................ 0.5
Women’s secure access to non-land assets use, control and ownership3............ 0.5
Year women received right to vote.................................................................... 1962
Quota type (single/lower house).........................................................Reserved seats
Voluntary political party quotas............................................................................. No](https://image.slidesharecdn.com/theglobalgendergapreport2015-160119013910/85/The-Global-Gender-Gap-Report-2015-91-320.jpg)

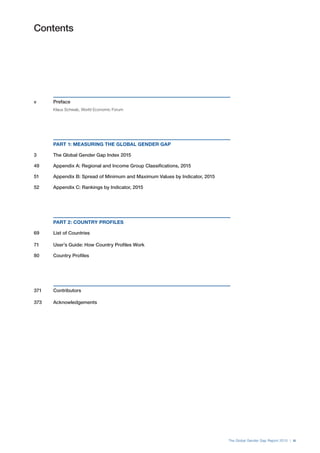
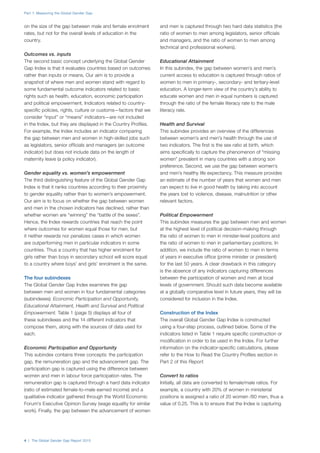
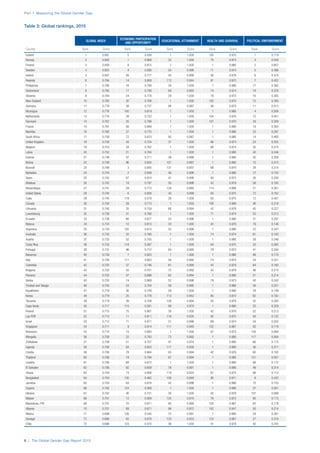
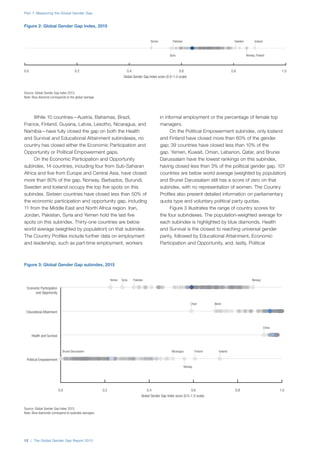
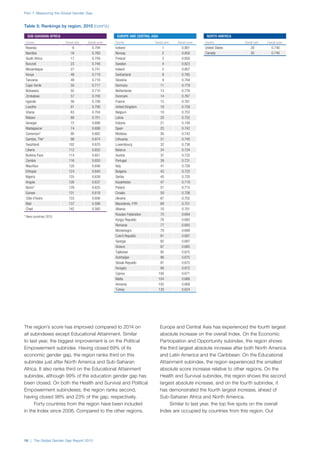
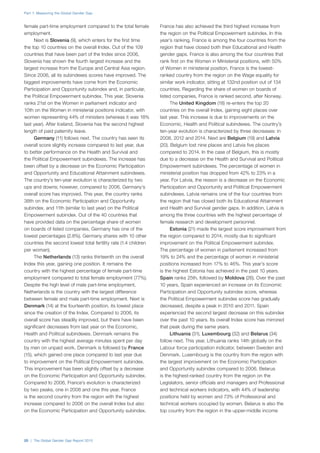
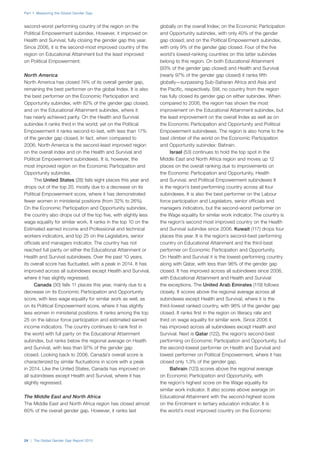
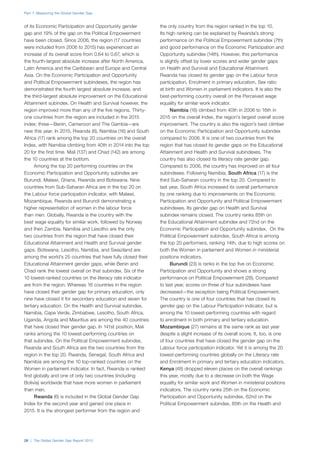
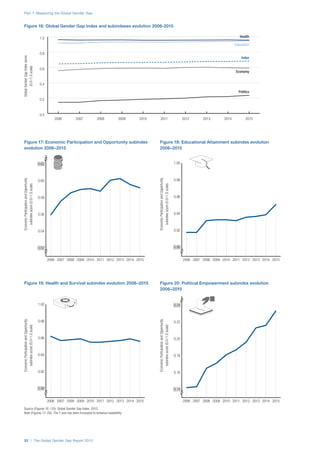
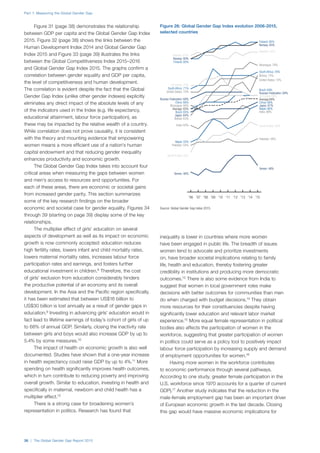
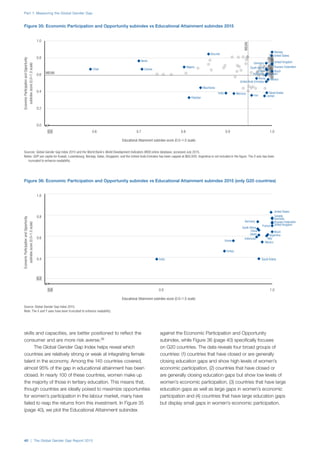
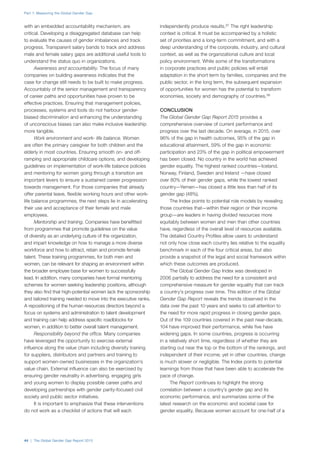
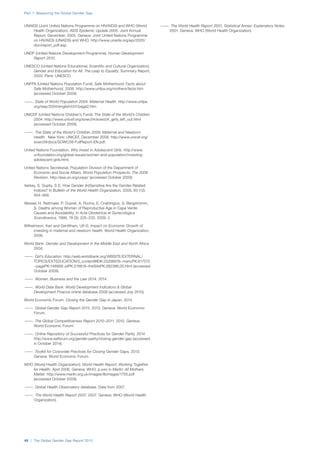
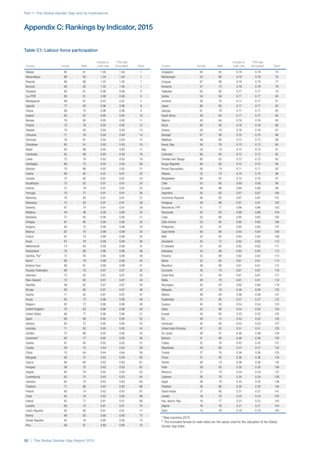
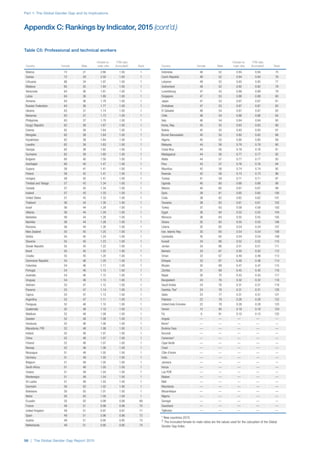
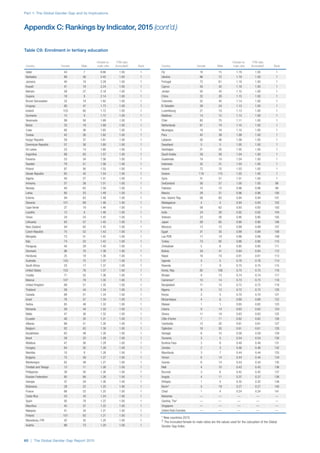
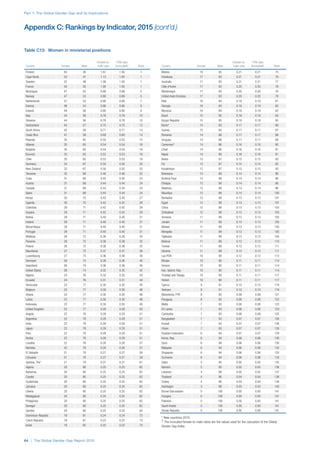
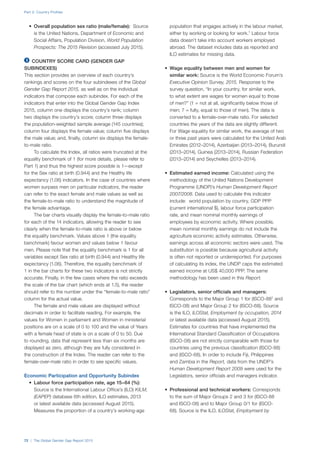
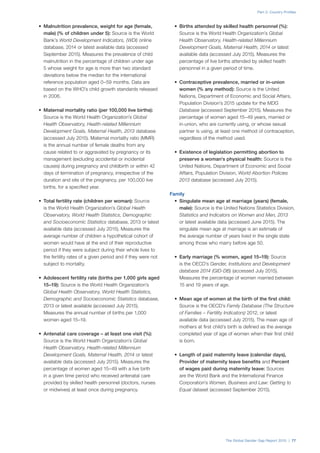
![Index over the years
SAMPLE INDEX ECONOMY EDUCATION HEALTH POLITICS
Year No. of countries Rank Score Rank Score Rank Score Rank Score Rank Score
2015 145 126 0.637 116 0.590 141 0.726 1 0.980 38 0.251
2014 142 121 0.631 111 0.588 138 0.721 61 0.975 38 0.240
2013 136 92 0.666 92 0.616 127 0.806 1 0.980 34 0.261
2012 135 — — — — — — — — — —
2011 135 87 0.662 96 0.594 126 0.786 1 0.980 24 0.290
2010 134 81 0.671 76 0.630 125 0.785 1 0.980 24 0.290
2009 134 106 0.635 96 0.583 127 0.778 1 0.980 36 0.201
2008 130 114 0.603 87 0.584 122 0.778 1 0.980 103 0.071
2007 128 110 0.603 87 0.585 119 0.779 1 0.980 92 0.070
2006 115 96 0.604 69 0.587 107 0.779 1 0.980 81 0.070
2006–2015 CHANGE s 0.033 s 0.003 t –0.054 s 0.000 s 0.182
Part 2: Country Profiles
The Global Gender Gap Report 2015 | 85
1 Survey data, responses on a 1-to-7 scale (1 = worst score, 7 = best score)
2 Bracketed numbers show the range between the uncertainties, estimated to contain the true maternal mortality ratio with a 95% probability
3 Data on a 0-to-1 scale (1 = worst score, 0 = best score)
Angola
Selected contextual data
EMPLOYMENT AND LEADERSHIP
Female, male adult unemployment
(as % of female, male labour force).............................................................—, —
Female, male part-time employment
(as % of total female, male employment)....................................................—, —
Female, male workers in informal employment
(as % of non-agricultural employment).......................................................—, —
Share of women in wage employment in the non-agricultural sector
(% of total non-agricultural employment).......................................................... 24
Average minutes spent per day on unpaid work (female, male)......................—, —
Percentage of women, men with an account
at a financial institution................................................................................22, 36
Ability of women to rise to positions of leadership1.............................................. —
Firms with female top managers (% of firms)....................................................... 14
Share of women on boards of listed companies (%)............................................. —
Firms with female participation in ownership (% of firms).................................... 57
Percentage of total R&D personnel (FTE) (female, male)..................................28, 72
EDUCATION AND TECHNOLOGY
Out-of-school children of primary school age (%) (female, male).....................89, 11
Female, male primary education attainment rate (% aged 25+).....................—, —
Female, male secondary education attainment rate (% aged 25+).................—, —
Female, male tertiary education attainment rate (% aged 25+)......................—, —
Percentage of tertiary-level students enrolled in STEM studies
(female, male)..............................................................................................26, 74
Percentage of tertiary-level graduates in STEM studies (female, male)............30, 70
Percentage of PhD graduates (female, male)..................................................—, —
Percentage of individuals using the internet (female, male)............................—, —
Percentage of individuals using a
mobile cellular telephone (female, male).....................................................—, —
HEALTH
Cardiovascular disease age-standardized deaths
per 100,000 (female, male)................................................................369.8, 376.4
Cancer age-standardized deaths per 100,000
excl. non-melanoma skin cancer (female, male).....................................86.1, 97.9
Diabetes age-standardized deaths per 100,000 (female, male).................44.4, 39.5
Chronic respiratory disease age-standardized deaths
per 100,000 (female, male)....................................................................58.6, 95.3
HEALTH (cont’d.)
HIV/AIDS age-standardized deaths per 100,000 (female, male)...............102.7, 82.8
Malaria age-standardized deaths per 100,000 (female, male)...................59.6, 55.8
Tuberculosis age-standardized deaths per 100,000 (female, male)............44.1, 85.6
Malnutrition prev., weight for age (female, male) (% of children <5)..........14.6, 16.6
Maternal mortality ratio (per 100,000 live births)2.............................460 [220–980]
Total fertility rate (children per women)............................................................... 5.9
Adolescent fertility rate (births per 1,000 girls aged 15–19)............................ 188.0
Antenatal care coverage, at least one visit (%)..................................................... 68
Births attended by skilled health personnel (%).................................................... 49
Contraceptive prevalence, any method
(% of married or in-union women aged 15–49)................................................. 18
Existence of legislation permitting abortion
to preserve a woman’s physical health.............................................................. No
FAMILY
Singulate mean age (years) at marriage (female, male)...................................19, 25
Early marriage (% of women aged 15–19)........................................................... 36
Mean age of women at the birth of the first child................................................. —
Length of paid maternity leave (calendar days)..................................................... 90
Provider of maternity leave benefits........................................................Government
Percent of wages paid during maternity leave.................................................... 100
Length of paid paternity leave (calendar days)........................................................ 0
Provider of paternity leave benefits....................................................................... —
Percent of wages paid during paternity leave....................................................... —
RIGHTS AND NORMS
Parental authority in marriage3............................................................................ 0.0
Parental authority after divorce3.......................................................................... 0.0
Female genital mutilation (% of women aged 15–49).......................................... 0.0
Existence of legislation on domestic violence3..................................................... 0.0
Existence of legislation on gender-based discrimination....................................... —
Inheritance rights for daughters3......................................................................... 0.5
Women’s secure access to land use, control and ownership3.............................. 0.5
Women’s access to financial services3................................................................ 0.5
Women’s secure access to non-land assets use, control and ownership3............ 0.5
Year women received right to vote.................................................................... 1975
Quota type (single/lower house).................................... Legislated Candidate Quotas
Voluntary political party quotas............................................................................. No](https://image.slidesharecdn.com/theglobalgendergapreport2015-160119013910/85/The-Global-Gender-Gap-Report-2015-93-320.jpg)

![Index over the years
SAMPLE INDEX ECONOMY EDUCATION HEALTH POLITICS
Year No. of countries Rank Score Rank Score Rank Score Rank Score Rank Score
2015 145 35 0.734 105 0.615 55 0.996 1 0.980 22 0.347
2014 142 31 0.732 96 0.631 50 0.996 1 0.980 21 0.320
2013 136 34 0.720 101 0.589 42 0.996 1 0.980 24 0.314
2012 135 32 0.721 92 0.607 41 0.996 1 0.980 24 0.302
2011 135 28 0.724 84 0.612 51 0.994 1 0.980 20 0.308
2010 134 29 0.719 87 0.602 47 0.995 1 0.980 20 0.298
2009 134 24 0.721 89 0.603 57 0.994 1 0.980 14 0.308
2008 130 24 0.721 80 0.607 57 0.994 1 0.980 15 0.303
2007 128 33 0.698 75 0.613 33 0.996 1 0.980 25 0.204
2006 115 41 0.683 82 0.551 29 0.997 1 0.980 23 0.204
2006–2015 CHANGE s 0.052 s 0.063 t 0.000 s 0.000 s 0.143
Part 2: Country Profiles
The Global Gender Gap Report 2015 | 87
1 Survey data, responses on a 1-to-7 scale (1 = worst score, 7 = best score)
2 Bracketed numbers show the range between the uncertainties, estimated to contain the true maternal mortality ratio with a 95% probability
3 Data on a 0-to-1 scale (1 = worst score, 0 = best score)
Argentina
Selected contextual data
EMPLOYMENT AND LEADERSHIP
Female, male adult unemployment
(as % of female, male labour force)............................................................8.7, 5.1
Female, male part-time employment
(as % of total female, male employment)...............................................38.0, 16.1
Female, male workers in informal employment
(as % of non-agricultural employment)........................................................43, 57
Share of women in wage employment in the non-agricultural sector
(% of total non-agricultural employment).......................................................... 44
Average minutes spent per day on unpaid work (female, male)......................—, —
Percentage of women, men with an account
at a financial institution................................................................................51, 49
Ability of women to rise to positions of leadership1............................................. 3.5
Firms with female top managers (% of firms)......................................................... 9
Share of women on boards of listed companies (%)............................................... 8
Firms with female participation in ownership (% of firms).................................... 38
Percentage of total R&D personnel (FTE) (female, male).................................—, —
EDUCATION AND TECHNOLOGY
Out-of-school children of primary school age (%) (female, male).....................90, 10
Female, male primary education attainment rate (% aged 25+)......................89, 90
Female, male secondary education attainment rate (% aged 25+)..................56, 56
Female, male tertiary education attainment rate (% aged 25+).......................15, 12
Percentage of tertiary-level students enrolled in STEM studies
(female, male)..............................................................................................39, 61
Percentage of tertiary-level graduates in STEM studies (female, male)............38, 62
Percentage of PhD graduates (female, male)...................................................59, 41
Percentage of individuals using the internet (female, male)............................—, —
Percentage of individuals using a
mobile cellular telephone (female, male).....................................................—, —
HEALTH
Cardiovascular disease age-standardized deaths
per 100,000 (female, male)................................................................148.4, 247.8
Cancer age-standardized deaths per 100,000
excl. non-melanoma skin cancer (female, male).................................109.1, 166.5
Diabetes age-standardized deaths per 100,000 (female, male).................14.4, 21.7
Chronic respiratory disease age-standardized deaths
per 100,000 (female, male)....................................................................24.7, 51.3
HEALTH (cont’d.)
HIV/AIDS age-standardized deaths per 100,000 (female, male)...................3.8, 14.3
Malaria age-standardized deaths per 100,000 (female, male).......................0.0, 0.0
Tuberculosis age-standardized deaths per 100,000 (female, male)................0.7, 1.7
Malnutrition prev., weight for age (female, male) (% of children <5)..............2.2, 2.4
Maternal mortality ratio (per 100,000 live births)2...................................69 [60–81]
Total fertility rate (children per women)............................................................... 2.2
Adolescent fertility rate (births per 1,000 girls aged 15–19).............................. 69.6
Antenatal care coverage, at least one visit (%)..................................................... 98
Births attended by skilled health personnel (%).................................................. 100
Contraceptive prevalence, any method
(% of married or in-union women aged 15–49)................................................. 55
Existence of legislation permitting abortion
to preserve a woman’s physical health............................................................. Yes
FAMILY
Singulate mean age (years) at marriage (female, male)...................................25, 27
Early marriage (% of women aged 15–19)........................................................... 13
Mean age of women at the birth of the first child................................................. —
Length of paid maternity leave (calendar days)..................................................... 90
Provider of maternity leave benefits........................................................Government
Percent of wages paid during maternity leave.................................................... 100
Length of paid paternity leave (calendar days)........................................................ 2
Provider of paternity leave benefits.............................................................Employer
Percent of wages paid during paternity leave..................................................... 100
RIGHTS AND NORMS
Parental authority in marriage3............................................................................ 0.0
Parental authority after divorce3.......................................................................... 0.0
Female genital mutilation (% of women aged 15–49).......................................... 0.0
Existence of legislation on domestic violence3..................................................... 0.0
Existence of legislation on gender-based discrimination....................................... —
Inheritance rights for daughters3......................................................................... 0.0
Women’s secure access to land use, control and ownership3.............................. 0.5
Women’s access to financial services3................................................................ 0.0
Women’s secure access to non-land assets use, control and ownership3............ 0.0
Year women received right to vote.................................................................... 1947
Quota type (single/lower house).................................... Legislated Candidate Quotas
Voluntary political party quotas............................................................................ Yes](https://image.slidesharecdn.com/theglobalgendergapreport2015-160119013910/85/The-Global-Gender-Gap-Report-2015-95-320.jpg)

![Index over the years
SAMPLE INDEX ECONOMY EDUCATION HEALTH POLITICS
Year No. of countries Rank Score Rank Score Rank Score Rank Score Rank Score
2015 145 105 0.668 79 0.664 35 1.000 144 0.939 125 0.068
2014 142 103 0.662 82 0.648 31 1.000 142 0.933 123 0.068
2013 136 94 0.663 82 0.638 29 1.000 131 0.950 115 0.066
2012 135 92 0.664 76 0.645 25 0.999 130 0.944 114 0.066
2011 135 84 0.665 62 0.658 27 0.999 131 0.942 108 0.062
2010 134 84 0.667 59 0.669 26 0.999 130 0.937 106 0.062
2009 134 90 0.662 56 0.671 29 0.999 133 0.933 123 0.044
2008 130 78 0.668 36 0.697 29 0.999 130 0.928 118 0.047
2007 128 71 0.665 24 0.721 24 0.999 128 0.923 125 0.017
2006 115 — — — — — — — — — —
2006–2015 CHANGE s 0.003 t –0.057 s 0.001 s 0.016 s 0.051
Part 2: Country Profiles
The Global Gender Gap Report 2015 | 89
1 Survey data, responses on a 1-to-7 scale (1 = worst score, 7 = best score)
2 Bracketed numbers show the range between the uncertainties, estimated to contain the true maternal mortality ratio with a 95% probability
3 Data on a 0-to-1 scale (1 = worst score, 0 = best score)
Armenia
Selected contextual data
EMPLOYMENT AND LEADERSHIP
Female, male adult unemployment
(as % of female, male labour force)........................................................19.6, 17.3
Female, male part-time employment
(as % of total female, male employment)...............................................30.1, 19.0
Female, male workers in informal employment
(as % of non-agricultural employment)........................................................27, 73
Share of women in wage employment in the non-agricultural sector
(% of total non-agricultural employment).......................................................... 46
Average minutes spent per day on unpaid work (female, male)......................—, —
Percentage of women, men with an account
at a financial institution................................................................................14, 21
Ability of women to rise to positions of leadership1............................................. 4.5
Firms with female top managers (% of firms)....................................................... 19
Share of women on boards of listed companies (%)............................................. —
Firms with female participation in ownership (% of firms).................................... 25
Percentage of total R&D personnel (FTE) (female, male).................................—, —
EDUCATION AND TECHNOLOGY
Out-of-school children of primary school age (%) (female, male).....................14, 86
Female, male primary education attainment rate (% aged 25+)....................99, 100
Female, male secondary education attainment rate (% aged 25+)..................96, 97
Female, male tertiary education attainment rate (% aged 25+).......................45, 42
Percentage of tertiary-level students enrolled in STEM studies
(female, male).............................................................................................—, —
Percentage of tertiary-level graduates in STEM studies (female, male)............38, 62
Percentage of PhD graduates (female, male)...................................................28, 72
Percentage of individuals using the internet (female, male)............................—, —
Percentage of individuals using a
mobile cellular telephone (female, male).....................................................—, —
HEALTH
Cardiovascular disease age-standardized deaths
per 100,000 (female, male)................................................................367.7, 606.9
Cancer age-standardized deaths per 100,000
excl. non-melanoma skin cancer (female, male).................................175.3, 277.1
Diabetes age-standardized deaths per 100,000 (female, male).................31.9, 35.7
Chronic respiratory disease age-standardized deaths
per 100,000 (female, male)....................................................................26.5, 64.7
HEALTH (cont’d.)
HIV/AIDS age-standardized deaths per 100,000 (female, male)...................1.4, 11.8
Malaria age-standardized deaths per 100,000 (female, male).......................0.0, 0.0
Tuberculosis age-standardized deaths per 100,000 (female, male)..............0.8, 10.7
Malnutrition prev., weight for age (female, male) (% of children <5)..............5.9, 4.7
Maternal mortality ratio (per 100,000 live births)2...................................29 [19–44]
Total fertility rate (children per women)............................................................... 1.7
Adolescent fertility rate (births per 1,000 girls aged 15–19).............................. 28.3
Antenatal care coverage, at least one visit (%)..................................................... 99
Births attended by skilled health personnel (%).................................................. 100
Contraceptive prevalence, any method
(% of married or in-union women aged 15–49)................................................. 55
Existence of legislation permitting abortion
to preserve a woman’s physical health............................................................. Yes
FAMILY
Singulate mean age (years) at marriage (female, male)...................................24, 28
Early marriage (% of women aged 15–19)............................................................. 8
Mean age of women at the birth of the first child................................................. —
Length of paid maternity leave (calendar days)................................................... 140
Provider of maternity leave benefits........................................................Government
Percent of wages paid during maternity leave.................................................... 100
Length of paid paternity leave (calendar days)........................................................ 0
Provider of paternity leave benefits....................................................................... —
Percent of wages paid during paternity leave....................................................... —
RIGHTS AND NORMS
Parental authority in marriage3............................................................................ 0.0
Parental authority after divorce3.......................................................................... 0.0
Female genital mutilation (% of women aged 15–49).......................................... 0.0
Existence of legislation on domestic violence3..................................................... 1.0
Existence of legislation on gender-based discrimination...................................... Yes
Inheritance rights for daughters3......................................................................... 0.0
Women’s secure access to land use, control and ownership3.............................. 0.5
Women’s access to financial services3................................................................ 0.0
Women’s secure access to non-land assets use, control and ownership3............ 0.0
Year women received right to vote.................................................................... 1918
Quota type (single/lower house).................................... Legislated Candidate Quotas
Voluntary political party quotas............................................................................. No](https://image.slidesharecdn.com/theglobalgendergapreport2015-160119013910/85/The-Global-Gender-Gap-Report-2015-97-320.jpg)

![Index over the years
SAMPLE INDEX ECONOMY EDUCATION HEALTH POLITICS
Year No. of countries Rank Score Rank Score Rank Score Rank Score Rank Score
2015 145 36 0.733 32 0.766 1 1.000 74 0.974 61 0.193
2014 142 24 0.741 14 0.801 1 1.000 70 0.974 53 0.189
2013 136 24 0.739 13 0.788 1 1.000 69 0.974 43 0.194
2012 135 25 0.729 22 0.759 1 1.000 73 0.974 42 0.185
2011 135 23 0.729 18 0.756 1 1.000 74 0.974 38 0.186
2010 134 23 0.727 24 0.743 1 1.000 73 0.974 39 0.192
2009 134 20 0.728 19 0.748 1 1.000 78 0.974 39 0.191
2008 130 21 0.724 22 0.731 1 1.000 73 0.974 37 0.191
2007 128 17 0.720 12 0.744 1 1.000 71 0.974 35 0.163
2006 115 15 0.716 12 0.726 1 1.000 57 0.976 32 0.163
2006–2015 CHANGE s 0.017 s 0.040 t 0.000 t –0.002 s 0.029
Part 2: Country Profiles
The Global Gender Gap Report 2015 | 91
1 Survey data, responses on a 1-to-7 scale (1 = worst score, 7 = best score)
2 Bracketed numbers show the range between the uncertainties, estimated to contain the true maternal mortality ratio with a 95% probability
3 Data on a 0-to-1 scale (1 = worst score, 0 = best score)
Australia
Selected contextual data
EMPLOYMENT AND LEADERSHIP
Female, male adult unemployment
(as % of female, male labour force)............................................................5.3, 5.1
Female, male part-time employment
(as % of total female, male employment)...............................................38.3, 13.1
Female, male workers in informal employment
(as % of non-agricultural employment).......................................................—, —
Share of women in wage employment in the non-agricultural sector
(% of total non-agricultural employment).......................................................... 47
Average minutes spent per day on unpaid work (female, male)...................311, 172
Percentage of women, men with an account
at a financial institution................................................................................99, 99
Ability of women to rise to positions of leadership1............................................. 5.1
Firms with female top managers (% of firms)....................................................... —
Share of women on boards of listed companies (%)............................................... 7
Firms with female participation in ownership (% of firms).................................... —
Percentage of total R&D personnel (FTE) (female, male).................................—, —
EDUCATION AND TECHNOLOGY
Out-of-school children of primary school age (%) (female, male).....................44, 56
Female, male primary education attainment rate (% aged 25+)..................100, 100
Female, male secondary education attainment rate (% aged 25+)..................91, 91
Female, male tertiary education attainment rate (% aged 25+).......................41, 33
Percentage of tertiary-level students enrolled in STEM studies
(female, male)..............................................................................................28, 72
Percentage of tertiary-level graduates in STEM studies (female, male)............29, 71
Percentage of PhD graduates (female, male)...................................................50, 50
Percentage of individuals using the internet (female, male).............................83, 84
Percentage of individuals using a
mobile cellular telephone (female, male).....................................................—, —
HEALTH
Cardiovascular disease age-standardized deaths
per 100,000 (female, male)..................................................................75.6, 110.6
Cancer age-standardized deaths per 100,000
excl. non-melanoma skin cancer (female, male)...................................90.6, 135.9
Diabetes age-standardized deaths per 100,000 (female, male)...................7.7, 11.6
Chronic respiratory disease age-standardized deaths
per 100,000 (female, male)....................................................................18.0, 27.8
HEALTH (cont’d.)
HIV/AIDS age-standardized deaths per 100,000 (female, male).....................0.0, 0.5
Malaria age-standardized deaths per 100,000 (female, male).......................0.0, 0.0
Tuberculosis age-standardized deaths per 100,000 (female, male)................0.1, 0.2
Malnutrition prev., weight for age (female, male) (% of children <5)...............—, —
Maternal mortality ratio (per 100,000 live births)2.......................................6 [4–10]
Total fertility rate (children per women)............................................................... 1.9
Adolescent fertility rate (births per 1,000 girls aged 15–19).............................. 15.3
Antenatal care coverage, at least one visit (%)..................................................... 96
Births attended by skilled health personnel (%).................................................... 99
Contraceptive prevalence, any method
(% of married or in-union women aged 15–49)................................................. 72
Existence of legislation permitting abortion
to preserve a woman’s physical health............................................................. Yes
FAMILY
Singulate mean age (years) at marriage (female, male)...................................30, 32
Early marriage (% of women aged 15–19)............................................................. 1
Mean age of women at the birth of the first child................................................. 29
Length of paid maternity leave (calendar days)..................................................... —
Provider of maternity leave benefits...................................................................... —
Percent of wages paid during maternity leave...................................................... —
Length of paid paternity leave (calendar days)...................................................... —
Provider of paternity leave benefits....................................................................... —
Percent of wages paid during paternity leave....................................................... —
RIGHTS AND NORMS
Parental authority in marriage3............................................................................ 0.0
Parental authority after divorce3.......................................................................... 0.0
Female genital mutilation (% of women aged 15–49).......................................... 0.0
Existence of legislation on domestic violence3..................................................... 0.3
Existence of legislation on gender-based discrimination...................................... Yes
Inheritance rights for daughters3......................................................................... 0.0
Women’s secure access to land use, control and ownership3.............................. 0.0
Women’s access to financial services3................................................................ 0.0
Women’s secure access to non-land assets use, control and ownership3............ 0.0
Year women received right to vote...........................................................1902, 1962
Quota type (single/lower house)............................................................................ —
Voluntary political party quotas............................................................................. —](https://image.slidesharecdn.com/theglobalgendergapreport2015-160119013910/85/The-Global-Gender-Gap-Report-2015-99-320.jpg)

![Index over the years
SAMPLE INDEX ECONOMY EDUCATION HEALTH POLITICS
Year No. of countries Rank Score Rank Score Rank Score Rank Score Rank Score
2015 145 37 0.733 52 0.705 1 1.000 1 0.980 39 0.246
2014 142 36 0.727 68 0.670 1 1.000 52 0.979 36 0.257
2013 136 19 0.744 69 0.664 1 1.000 47 0.979 19 0.332
2012 135 20 0.739 70 0.652 49 0.995 50 0.979 18 0.332
2011 135 34 0.717 77 0.624 76 0.989 46 0.979 27 0.274
2010 134 37 0.709 92 0.595 75 0.989 44 0.979 26 0.274
2009 134 42 0.703 102 0.570 78 0.989 1 0.980 23 0.274
2008 130 29 0.715 84 0.587 76 0.989 1 0.980 14 0.306
2007 128 27 0.706 89 0.582 77 0.980 1 0.980 15 0.282
2006 115 27 0.699 81 0.553 68 0.980 1 0.980 14 0.282
2006–2015 CHANGE s 0.034 s 0.153 s 0.020 s 0.000 t –0.036
Part 2: Country Profiles
The Global Gender Gap Report 2015 | 93
1 Survey data, responses on a 1-to-7 scale (1 = worst score, 7 = best score)
2 Bracketed numbers show the range between the uncertainties, estimated to contain the true maternal mortality ratio with a 95% probability
3 Data on a 0-to-1 scale (1 = worst score, 0 = best score)
Austria
Selected contextual data
EMPLOYMENT AND LEADERSHIP
Female, male adult unemployment
(as % of female, male labour force)............................................................4.9, 4.9
Female, male part-time employment
(as % of total female, male employment).................................................33.2, 6.9
Female, male workers in informal employment
(as % of non-agricultural employment).......................................................—, —
Share of women in wage employment in the non-agricultural sector
(% of total non-agricultural employment).......................................................... 48
Average minutes spent per day on unpaid work (female, male)...................269, 135
Percentage of women, men with an account
at a financial institution................................................................................97, 96
Ability of women to rise to positions of leadership1............................................. 4.6
Firms with female top managers (% of firms)....................................................... —
Share of women on boards of listed companies (%)............................................... 0
Firms with female participation in ownership (% of firms).................................... —
Percentage of total R&D personnel (FTE) (female, male)..................................25, 75
EDUCATION AND TECHNOLOGY
Out-of-school children of primary school age (%) (female, male)....................—, —
Female, male primary education attainment rate (% aged 25+)..................100, 100
Female, male secondary education attainment rate (% aged 25+)..............100, 100
Female, male tertiary education attainment rate (% aged 25+).......................16, 22
Percentage of tertiary-level students enrolled in STEM studies
(female, male)..............................................................................................28, 72
Percentage of tertiary-level graduates in STEM studies (female, male)............25, 75
Percentage of PhD graduates (female, male)...................................................44, 56
Percentage of individuals using the internet (female, male).............................77, 84
Percentage of individuals using a
mobile cellular telephone (female, male).....................................................—, —
HEALTH
Cardiovascular disease age-standardized deaths
per 100,000 (female, male)................................................................119.0, 177.8
Cancer age-standardized deaths per 100,000
excl. non-melanoma skin cancer (female, male)...................................99.7, 152.3
Diabetes age-standardized deaths per 100,000 (female, male).................10.8, 16.7
Chronic respiratory disease age-standardized deaths
per 100,000 (female, male)....................................................................10.6, 21.9
HEALTH (cont’d.)
HIV/AIDS age-standardized deaths per 100,000 (female, male).....................0.2, 0.6
Malaria age-standardized deaths per 100,000 (female, male).......................0.0, 0.0
Tuberculosis age-standardized deaths per 100,000 (female, male)................0.2, 0.4
Malnutrition prev., weight for age (female, male) (% of children <5)...............—, —
Maternal mortality ratio (per 100,000 live births)2.......................................4 [1–10]
Total fertility rate (children per women)............................................................... 1.5
Adolescent fertility rate (births per 1,000 girls aged 15–19)................................ 8.9
Antenatal care coverage, at least one visit (%)..................................................... —
Births attended by skilled health personnel (%).................................................... 99
Contraceptive prevalence, any method
(% of married or in-union women aged 15–49)................................................. 70
Existence of legislation permitting abortion
to preserve a woman’s physical health............................................................. Yes
FAMILY
Singulate mean age (years) at marriage (female, male)...................................31, 34
Early marriage (% of women aged 15–19)............................................................. 0
Mean age of women at the birth of the first child................................................. 29
Length of paid maternity leave (calendar days)................................................... 112
Provider of maternity leave benefits........................................................Government
Percent of wages paid during maternity leave.................................................... 100
Length of paid paternity leave (calendar days)...................................................... —
Provider of paternity leave benefits....................................................................... —
Percent of wages paid during paternity leave....................................................... —
RIGHTS AND NORMS
Parental authority in marriage3............................................................................ 0.0
Parental authority after divorce3.......................................................................... 0.0
Female genital mutilation (% of women aged 15–49).......................................... 0.0
Existence of legislation on domestic violence3..................................................... 0.0
Existence of legislation on gender-based discrimination...................................... Yes
Inheritance rights for daughters3......................................................................... 0.0
Women’s secure access to land use, control and ownership3.............................. 0.0
Women’s access to financial services3................................................................ 0.0
Women’s secure access to non-land assets use, control and ownership3............ 0.0
Year women received right to vote.................................................................... 1918
Quota type (single/lower house)............................................................................ —
Voluntary political party quotas............................................................................. —](https://image.slidesharecdn.com/theglobalgendergapreport2015-160119013910/85/The-Global-Gender-Gap-Report-2015-101-320.jpg)

![Index over the years
SAMPLE INDEX ECONOMY EDUCATION HEALTH POLITICS
Year No. of countries Rank Score Rank Score Rank Score Rank Score Rank Score
2015 145 96 0.675 54 0.701 90 0.984 139 0.950 129 0.063
2014 142 94 0.675 52 0.709 92 0.984 137 0.944 127 0.064
2013 136 99 0.658 72 0.659 85 0.982 136 0.925 114 0.066
2012 135 99 0.655 74 0.649 84 0.983 135 0.920 113 0.066
2011 135 91 0.658 70 0.642 73 0.989 132 0.933 103 0.066
2010 134 100 0.645 73 0.635 93 0.967 134 0.929 113 0.047
2009 134 89 0.663 47 0.686 94 0.970 132 0.937 119 0.058
2008 130 61 0.686 4 0.786 91 0.967 129 0.931 114 0.058
2007 128 59 0.678 19 0.732 82 0.971 127 0.926 85 0.083
2006 115 — — — — — — — — — —
2006–2015 CHANGE t –0.003 t –0.030 s 0.013 s 0.024 t –0.020
Part 2: Country Profiles
The Global Gender Gap Report 2015 | 95
1 Survey data, responses on a 1-to-7 scale (1 = worst score, 7 = best score)
2 Bracketed numbers show the range between the uncertainties, estimated to contain the true maternal mortality ratio with a 95% probability
3 Data on a 0-to-1 scale (1 = worst score, 0 = best score)
Azerbaijan
Selected contextual data
EMPLOYMENT AND LEADERSHIP
Female, male adult unemployment
(as % of female, male labour force)............................................................5.9, 4.0
Female, male part-time employment
(as % of total female, male employment)...............................................24.3, 13.3
Female, male workers in informal employment
(as % of non-agricultural employment).......................................................—, —
Share of women in wage employment in the non-agricultural sector
(% of total non-agricultural employment).......................................................... 43
Average minutes spent per day on unpaid work (female, male)......................—, —
Percentage of women, men with an account
at a financial institution................................................................................26, 33
Ability of women to rise to positions of leadership1............................................. 5.1
Firms with female top managers (% of firms)......................................................... 2
Share of women on boards of listed companies (%)............................................. —
Firms with female participation in ownership (% of firms)...................................... 4
Percentage of total R&D personnel (FTE) (female, male).................................—, —
EDUCATION AND TECHNOLOGY
Out-of-school children of primary school age (%) (female, male).....................52, 48
Female, male primary education attainment rate (% aged 25+)......................98, 99
Female, male secondary education attainment rate (% aged 25+)..................94, 97
Female, male tertiary education attainment rate (% aged 25+).......................24, 27
Percentage of tertiary-level students enrolled in STEM studies
(female, male)..............................................................................................42, 58
Percentage of tertiary-level graduates in STEM studies (female, male)............42, 58
Percentage of PhD graduates (female, male)...................................................31, 69
Percentage of individuals using the internet (female, male)............................—, —
Percentage of individuals using a
mobile cellular telephone (female, male)......................................................91, 83
HEALTH
Cardiovascular disease age-standardized deaths
per 100,000 (female, male)................................................................377.6, 523.5
Cancer age-standardized deaths per 100,000
excl. non-melanoma skin cancer (female, male)...................................88.5, 145.0
Diabetes age-standardized deaths per 100,000 (female, male).................14.9, 13.9
Chronic respiratory disease age-standardized deaths
per 100,000 (female, male)....................................................................16.5, 30.1
HEALTH (cont’d.)
HIV/AIDS age-standardized deaths per 100,000 (female, male)...................1.0, 11.5
Malaria age-standardized deaths per 100,000 (female, male).......................0.0, 0.0
Tuberculosis age-standardized deaths per 100,000 (female, male)................1.8, 7.8
Malnutrition prev., weight for age (female, male) (% of children <5)..............8.0, 8.7
Maternal mortality ratio (per 100,000 live births)2...................................26 [17–40]
Total fertility rate (children per women)............................................................... 1.9
Adolescent fertility rate (births per 1,000 girls aged 15–19).............................. 47.0
Antenatal care coverage, at least one visit (%)..................................................... 77
Births attended by skilled health personnel (%).................................................. 100
Contraceptive prevalence, any method
(% of married or in-union women aged 15–49)................................................. 51
Existence of legislation permitting abortion
to preserve a woman’s physical health............................................................. Yes
FAMILY
Singulate mean age (years) at marriage (female, male)...................................24, 28
Early marriage (% of women aged 15–19)............................................................. 8
Mean age of women at the birth of the first child................................................. —
Length of paid maternity leave (calendar days)................................................... 126
Provider of maternity leave benefits........................................................Government
Percent of wages paid during maternity leave.................................................... 100
Length of paid paternity leave (calendar days)........................................................ 0
Provider of paternity leave benefits....................................................................... —
Percent of wages paid during paternity leave....................................................... —
RIGHTS AND NORMS
Parental authority in marriage3............................................................................ 0.0
Parental authority after divorce3.......................................................................... 0.0
Female genital mutilation (% of women aged 15–49).......................................... 0.0
Existence of legislation on domestic violence3..................................................... 0.3
Existence of legislation on gender-based discrimination...................................... Yes
Inheritance rights for daughters3......................................................................... 0.0
Women’s secure access to land use, control and ownership3.............................. 0.0
Women’s access to financial services3................................................................ 0.5
Women’s secure access to non-land assets use, control and ownership3............ 0.0
Year women received right to vote.................................................................... 1918
Quota type (single/lower house)............................................................................ —
Voluntary political party quotas............................................................................. —](https://image.slidesharecdn.com/theglobalgendergapreport2015-160119013910/85/The-Global-Gender-Gap-Report-2015-103-320.jpg)

![Index over the years
SAMPLE INDEX ECONOMY EDUCATION HEALTH POLITICS
Year No. of countries Rank Score Rank Score Rank Score Rank Score Rank Score
2015 145 40 0.728 7 0.823 1 1.000 1 0.980 98 0.110
2014 142 35 0.727 5 0.822 1 1.000 1 0.980 101 0.106
2013 136 40 0.713 5 0.824 1 1.000 1 0.980 124 0.047
2012 135 37 0.716 2 0.836 1 1.000 1 0.980 122 0.047
2011 135 22 0.734 1 0.914 1 1.000 1 0.980 117 0.043
2010 134 36 0.713 4 0.829 1 1.000 1 0.980 115 0.043
2009 134 28 0.718 2 0.826 1 1.000 1 0.980 109 0.066
2008 130 — — — — — — — — — —
2007 128 — — — — — — — — — —
2006 115 — — — — — — — — — —
2006–2015 CHANGE s 0.010 t –0.004 t 0.000 t 0.000 s 0.044
Part 2: Country Profiles
The Global Gender Gap Report 2015 | 97
1 Survey data, responses on a 1-to-7 scale (1 = worst score, 7 = best score)
2 Bracketed numbers show the range between the uncertainties, estimated to contain the true maternal mortality ratio with a 95% probability
3 Data on a 0-to-1 scale (1 = worst score, 0 = best score)
Bahamas
Selected contextual data
EMPLOYMENT AND LEADERSHIP
Female, male adult unemployment
(as % of female, male labour force)........................................................16.3, 16.1
Female, male part-time employment
(as % of total female, male employment).................................................11.9, 9.6
Female, male workers in informal employment
(as % of non-agricultural employment).......................................................—, —
Share of women in wage employment in the non-agricultural sector
(% of total non-agricultural employment).......................................................... 52
Average minutes spent per day on unpaid work (female, male)......................—, —
Percentage of women, men with an account
at a financial institution...............................................................................—, —
Ability of women to rise to positions of leadership1.............................................. —
Firms with female top managers (% of firms)....................................................... 33
Share of women on boards of listed companies (%)............................................. —
Firms with female participation in ownership (% of firms).................................... 58
Percentage of total R&D personnel (FTE) (female, male).................................—, —
EDUCATION AND TECHNOLOGY
Out-of-school children of primary school age (%) (female, male).....................13, 87
Female, male primary education attainment rate (% aged 25+)......................95, 93
Female, male secondary education attainment rate (% aged 25+)..................88, 88
Female, male tertiary education attainment rate (% aged 25+).......................27, 18
Percentage of tertiary-level students enrolled in STEM studies
(female, male).............................................................................................—, —
Percentage of tertiary-level graduates in STEM studies (female, male)...........—, —
Percentage of PhD graduates (female, male)..................................................—, —
Percentage of individuals using the internet (female, male).............................67, 62
Percentage of individuals using a
mobile cellular telephone (female, male).....................................................—, —
HEALTH
Cardiovascular disease age-standardized deaths
per 100,000 (female, male)................................................................169.6, 292.5
Cancer age-standardized deaths per 100,000
excl. non-melanoma skin cancer (female, male)...................................88.1, 131.8
Diabetes age-standardized deaths per 100,000 (female, male).................38.9, 45.4
Chronic respiratory disease age-standardized deaths
per 100,000 (female, male)......................................................................4.4, 12.1
HEALTH (cont’d.)
HIV/AIDS age-standardized deaths per 100,000 (female, male).................66.4, 79.5
Malaria age-standardized deaths per 100,000 (female, male).......................0.0, 0.0
Tuberculosis age-standardized deaths per 100,000 (female, male)................0.2, 0.5
Malnutrition prev., weight for age (female, male) (% of children <5)...............—, —
Maternal mortality ratio (per 100,000 live births)2...................................37 [24–55]
Total fertility rate (children per women)............................................................... 1.9
Adolescent fertility rate (births per 1,000 girls aged 15–19).............................. 39.5
Antenatal care coverage, at least one visit (%)..................................................... 86
Births attended by skilled health personnel (%).................................................... 99
Contraceptive prevalence, any method
(% of married or in-union women aged 15–49)................................................. —
Existence of legislation permitting abortion
to preserve a woman’s physical health............................................................. Yes
FAMILY
Singulate mean age (years) at marriage (female, male)...................................27, 30
Early marriage (% of women aged 15–19)........................................................... —
Mean age of women at the birth of the first child................................................. —
Length of paid maternity leave (calendar days)..................................................... 91
Provider of maternity leave benefits................................. Employer and Government
Percent of wages paid during maternity leave.................................................... 100
Length of paid paternity leave (calendar days)........................................................ 0
Provider of paternity leave benefits....................................................................... —
Percent of wages paid during paternity leave....................................................... —
RIGHTS AND NORMS
Parental authority in marriage3............................................................................. —
Parental authority after divorce3........................................................................... —
Female genital mutilation (% of women aged 15–49)........................................... —
Existence of legislation on domestic violence3...................................................... —
Existence of legislation on gender-based discrimination...................................... Yes
Inheritance rights for daughters3.......................................................................... —
Women’s secure access to land use, control and ownership3............................... —
Women’s access to financial services3................................................................. —
Women’s secure access to non-land assets use, control and ownership3............. —
Year women received right to vote...........................................................1961, 1964
Quota type (single/lower house)............................................................................ —
Voluntary political party quotas............................................................................. —](https://image.slidesharecdn.com/theglobalgendergapreport2015-160119013910/85/The-Global-Gender-Gap-Report-2015-105-320.jpg)

![Index over the years
SAMPLE INDEX ECONOMY EDUCATION HEALTH POLITICS
Year No. of countries Rank Score Rank Score Rank Score Rank Score Rank Score
2015 145 123 0.644 113 0.597 94 0.981 133 0.961 138 0.037
2014 142 124 0.626 126 0.480 90 0.986 132 0.961 116 0.077
2013 136 112 0.633 117 0.515 71 0.991 112 0.961 113 0.067
2012 135 111 0.630 118 0.497 47 0.995 111 0.961 112 0.067
2011 135 110 0.623 115 0.508 81 0.986 111 0.961 122 0.038
2010 134 110 0.622 115 0.497 60 0.991 110 0.961 120 0.038
2009 134 116 0.614 118 0.483 69 0.991 116 0.961 131 0.019
2008 130 121 0.593 126 0.399 66 0.992 112 0.961 127 0.019
2007 128 115 0.593 124 0.390 59 0.989 110 0.961 121 0.031
2006 115 102 0.589 111 0.383 54 0.989 104 0.962 110 0.024
2006–2015 CHANGE s 0.055 s 0.214 t –0.008 t –0.001 s 0.013
Part 2: Country Profiles
The Global Gender Gap Report 2015 | 99
1 Survey data, responses on a 1-to-7 scale (1 = worst score, 7 = best score)
2 Bracketed numbers show the range between the uncertainties, estimated to contain the true maternal mortality ratio with a 95% probability
3 Data on a 0-to-1 scale (1 = worst score, 0 = best score)
Bahrain
Selected contextual data
EMPLOYMENT AND LEADERSHIP
Female, male adult unemployment
(as % of female, male labour force)............................................................3.9, 0.5
Female, male part-time employment
(as % of total female, male employment)...................................................2.8, 2.2
Female, male workers in informal employment
(as % of non-agricultural employment).......................................................—, —
Share of women in wage employment in the non-agricultural sector
(% of total non-agricultural employment).......................................................... 21
Average minutes spent per day on unpaid work (female, male)......................—, —
Percentage of women, men with an account
at a financial institution................................................................................67, 90
Ability of women to rise to positions of leadership1............................................. 5.5
Firms with female top managers (% of firms)....................................................... —
Share of women on boards of listed companies (%)............................................. —
Firms with female participation in ownership (% of firms).................................... —
Percentage of total R&D personnel (FTE) (female, male).................................—, —
EDUCATION AND TECHNOLOGY
Out-of-school children of primary school age (%) (female, male).....................86, 14
Female, male primary education attainment rate (% aged 25+)......................64, 70
Female, male secondary education attainment rate (% aged 25+)..................57, 54
Female, male tertiary education attainment rate (% aged 25+).......................22, 18
Percentage of tertiary-level students enrolled in STEM studies
(female, male)..............................................................................................42, 58
Percentage of tertiary-level graduates in STEM studies (female, male)............43, 57
Percentage of PhD graduates (female, male)...................................................31, 69
Percentage of individuals using the internet (female, male)...........................105, 82
Percentage of individuals using a
mobile cellular telephone (female, male)......................................................98, 97
HEALTH
Cardiovascular disease age-standardized deaths
per 100,000 (female, male)................................................................176.1, 195.9
Cancer age-standardized deaths per 100,000
excl. non-melanoma skin cancer (female, male).....................................65.4, 80.4
Diabetes age-standardized deaths per 100,000 (female, male).................84.3, 96.9
Chronic respiratory disease age-standardized deaths
per 100,000 (female, male)....................................................................36.5, 49.3
HEALTH (cont’d.)
HIV/AIDS age-standardized deaths per 100,000 (female, male).....................0.6, 0.6
Malaria age-standardized deaths per 100,000 (female, male).......................0.0, 0.0
Tuberculosis age-standardized deaths per 100,000 (female, male)................0.5, 1.6
Malnutrition prev., weight for age (female, male) (% of children <5)...............—, —
Maternal mortality ratio (per 100,000 live births)2...................................22 [14–35]
Total fertility rate (children per women)............................................................... 2.1
Adolescent fertility rate (births per 1,000 girls aged 15–19).............................. 14.2
Antenatal care coverage, at least one visit (%)................................................... 100
Births attended by skilled health personnel (%).................................................. 100
Contraceptive prevalence, any method
(% of married or in-union women aged 15–49)................................................. 62
Existence of legislation permitting abortion
to preserve a woman’s physical health............................................................. Yes
FAMILY
Singulate mean age (years) at marriage (female, male)...................................26, 30
Early marriage (% of women aged 15–19)............................................................. 4
Mean age of women at the birth of the first child................................................. —
Length of paid maternity leave (calendar days)..................................................... 60
Provider of maternity leave benefits........................................................Government
Percent of wages paid during maternity leave.................................................... 100
Length of paid paternity leave (calendar days)........................................................ 1
Provider of paternity leave benefits.............................................................Employer
Percent of wages paid during paternity leave..................................................... 100
RIGHTS AND NORMS
Parental authority in marriage3............................................................................ 1.0
Parental authority after divorce3.......................................................................... 1.0
Female genital mutilation (% of women aged 15–49).......................................... 0.0
Existence of legislation on domestic violence3..................................................... 0.8
Existence of legislation on gender-based discrimination....................................... —
Inheritance rights for daughters3......................................................................... 1.0
Women’s secure access to land use, control and ownership3.............................. 0.0
Women’s access to financial services3................................................................ 0.5
Women’s secure access to non-land assets use, control and ownership3............ 0.0
Year women received right to vote...........................................................1973, 2002
Quota type (single/lower house)............................................................................ —
Voluntary political party quotas............................................................................. —](https://image.slidesharecdn.com/theglobalgendergapreport2015-160119013910/85/The-Global-Gender-Gap-Report-2015-107-320.jpg)

![Index over the years
SAMPLE INDEX ECONOMY EDUCATION HEALTH POLITICS
Year No. of countries Rank Score Rank Score Rank Score Rank Score Rank Score
2015 145 64 0.704 130 0.462 109 0.948 95 0.971 8 0.433
2014 142 68 0.697 127 0.477 111 0.940 122 0.966 10 0.406
2013 136 75 0.685 121 0.495 115 0.885 124 0.956 7 0.404
2012 135 86 0.668 121 0.480 118 0.858 123 0.956 8 0.380
2011 135 69 0.681 118 0.493 108 0.917 123 0.956 11 0.359
2010 134 82 0.670 117 0.473 108 0.914 122 0.956 12 0.338
2009 134 93 0.653 121 0.455 105 0.911 127 0.950 17 0.294
2008 130 90 0.653 119 0.444 104 0.909 124 0.950 13 0.310
2007 128 100 0.631 116 0.437 105 0.871 122 0.950 17 0.267
2006 115 91 0.627 107 0.423 95 0.868 113 0.950 17 0.267
2006–2015 CHANGE s 0.077 s 0.039 s 0.080 s 0.022 s 0.166
Part 2: Country Profiles
The Global Gender Gap Report 2015 | 101
1 Survey data, responses on a 1-to-7 scale (1 = worst score, 7 = best score)
2 Bracketed numbers show the range between the uncertainties, estimated to contain the true maternal mortality ratio with a 95% probability
3 Data on a 0-to-1 scale (1 = worst score, 0 = best score)
Bangladesh
Selected contextual data
EMPLOYMENT AND LEADERSHIP
Female, male adult unemployment
(as % of female, male labour force)............................................................5.7, 4.0
Female, male part-time employment
(as % of total female, male employment)....................................................—, —
Female, male workers in informal employment
(as % of non-agricultural employment).......................................................—, —
Share of women in wage employment in the non-agricultural sector
(% of total non-agricultural employment).......................................................... 18
Average minutes spent per day on unpaid work (female, male)......................—, —
Percentage of women, men with an account
at a financial institution................................................................................25, 33
Ability of women to rise to positions of leadership1............................................. 3.8
Firms with female top managers (% of firms)......................................................... 5
Share of women on boards of listed companies (%)............................................. —
Firms with female participation in ownership (% of firms).................................... 13
Percentage of total R&D personnel (FTE) (female, male).................................—, —
EDUCATION AND TECHNOLOGY
Out-of-school children of primary school age (%) (female, male).....................20, 80
Female, male primary education attainment rate (% aged 25+)......................42, 53
Female, male secondary education attainment rate (% aged 25+)..................22, 31
Female, male tertiary education attainment rate (% aged 25+)...........................3, 5
Percentage of tertiary-level students enrolled in STEM studies
(female, male)..............................................................................................27, 73
Percentage of tertiary-level graduates in STEM studies (female, male)............36, 64
Percentage of PhD graduates (female, male)...................................................38, 62
Percentage of individuals using the internet (female, male).................................5, 8
Percentage of individuals using a
mobile cellular telephone (female, male)......................................................83, 79
HEALTH
Cardiovascular disease age-standardized deaths
per 100,000 (female, male)................................................................152.6, 178.7
Cancer age-standardized deaths per 100,000
excl. non-melanoma skin cancer (female, male).....................................79.9, 94.9
Diabetes age-standardized deaths per 100,000 (female, male).................28.7, 30.8
Chronic respiratory disease age-standardized deaths
per 100,000 (female, male)..................................................................92.7, 119.6
HEALTH (cont’d.)
HIV/AIDS age-standardized deaths per 100,000 (female, male).....................0.2, 0.3
Malaria age-standardized deaths per 100,000 (female, male).......................0.3, 1.9
Tuberculosis age-standardized deaths per 100,000 (female, male)............31.9, 98.7
Malnutrition prev., weight for age (female, male) (% of children <5)..........38.8, 34.8
Maternal mortality ratio (per 100,000 live births)2...............................170 [94–300]
Total fertility rate (children per women)............................................................... 2.2
Adolescent fertility rate (births per 1,000 girls aged 15–19)............................ 128.0
Antenatal care coverage, at least one visit (%)..................................................... 59
Births attended by skilled health personnel (%).................................................... 44
Contraceptive prevalence, any method
(% of married or in-union women aged 15–49)................................................. 62
Existence of legislation permitting abortion
to preserve a woman’s physical health.............................................................. No
FAMILY
Singulate mean age (years) at marriage (female, male)...................................19, 25
Early marriage (% of women aged 15–19)........................................................... 46
Mean age of women at the birth of the first child................................................. —
Length of paid maternity leave (calendar days)................................................... 112
Provider of maternity leave benefits............................................................Employer
Percent of wages paid during maternity leave.................................................... 100
Length of paid paternity leave (calendar days)...................................................... —
Provider of paternity leave benefits....................................................................... —
Percent of wages paid during paternity leave....................................................... —
RIGHTS AND NORMS
Parental authority in marriage3............................................................................ 1.0
Parental authority after divorce3.......................................................................... 1.0
Female genital mutilation (% of women aged 15–49).......................................... 0.0
Existence of legislation on domestic violence3..................................................... 0.3
Existence of legislation on gender-based discrimination....................................... —
Inheritance rights for daughters3......................................................................... 1.0
Women’s secure access to land use, control and ownership3.............................. 0.5
Women’s access to financial services3................................................................ 0.5
Women’s secure access to non-land assets use, control and ownership3............ 0.5
Year women received right to vote...........................................................1935, 1972
Quota type (single/lower house).........................................................Reserved seats
Voluntary political party quotas............................................................................. No](https://image.slidesharecdn.com/theglobalgendergapreport2015-160119013910/85/The-Global-Gender-Gap-Report-2015-109-320.jpg)

![Index over the years
SAMPLE INDEX ECONOMY EDUCATION HEALTH POLITICS
Year No. of countries Rank Score Rank Score Rank Score Rank Score Rank Score
2015 145 24 0.744 2 0.848 46 0.998 1 0.980 77 0.150
2014 142 33 0.729 20 0.788 42 0.998 1 0.980 73 0.150
2013 136 29 0.730 10 0.791 1 1.000 1 0.980 63 0.150
2012 135 27 0.723 11 0.791 1 1.000 1 0.980 79 0.123
2011 135 33 0.717 8 0.784 1 1.000 1 0.980 82 0.104
2010 134 31 0.718 7 0.787 1 1.000 1 0.980 80 0.104
2009 134 21 0.724 5 0.785 1 1.000 1 0.980 67 0.129
2008 130 26 0.719 9 0.771 44 0.996 1 0.980 62 0.129
2007 128 — — — — — — — — — —
2006 115 — — — — — — — — — —
2006–2015 CHANGE s 0.025 s 0.078 s 0.002 t 0.000 s 0.021
Part 2: Country Profiles
The Global Gender Gap Report 2015 | 103
1 Survey data, responses on a 1-to-7 scale (1 = worst score, 7 = best score)
2 Bracketed numbers show the range between the uncertainties, estimated to contain the true maternal mortality ratio with a 95% probability
3 Data on a 0-to-1 scale (1 = worst score, 0 = best score)
Barbados
Selected contextual data
EMPLOYMENT AND LEADERSHIP
Female, male adult unemployment
(as % of female, male labour force)........................................................12.2, 10.9
Female, male part-time employment
(as % of total female, male employment)....................................................—, —
Female, male workers in informal employment
(as % of non-agricultural employment).......................................................—, —
Share of women in wage employment in the non-agricultural sector
(% of total non-agricultural employment).......................................................... 51
Average minutes spent per day on unpaid work (female, male)......................—, —
Percentage of women, men with an account
at a financial institution...............................................................................—, —
Ability of women to rise to positions of leadership1.............................................. —
Firms with female top managers (% of firms)....................................................... 25
Share of women on boards of listed companies (%)............................................. —
Firms with female participation in ownership (% of firms).................................... 44
Percentage of total R&D personnel (FTE) (female, male).................................—, —
EDUCATION AND TECHNOLOGY
Out-of-school children of primary school age (%) (female, male).....................54, 46
Female, male primary education attainment rate (% aged 25+)......................86, 86
Female, male secondary education attainment rate (% aged 25+)..................79, 77
Female, male tertiary education attainment rate (% aged 25+)...........................1, 1
Percentage of tertiary-level students enrolled in STEM studies
(female, male)..............................................................................................51, 49
Percentage of tertiary-level graduates in STEM studies (female, male)............41, 59
Percentage of PhD graduates (female, male)...................................................89, 11
Percentage of individuals using the internet (female, male)............................—, —
Percentage of individuals using a
mobile cellular telephone (female, male).....................................................—, —
HEALTH
Cardiovascular disease age-standardized deaths
per 100,000 (female, male)................................................................102.6, 159.8
Cancer age-standardized deaths per 100,000
excl. non-melanoma skin cancer (female, male).................................117.7, 179.3
Diabetes age-standardized deaths per 100,000 (female, male).................41.2, 43.3
Chronic respiratory disease age-standardized deaths
per 100,000 (female, male)......................................................................5.3, 13.9
HEALTH (cont’d.)
HIV/AIDS age-standardized deaths per 100,000 (female, male)...................1.7, 20.7
Malaria age-standardized deaths per 100,000 (female, male).......................0.0, 0.0
Tuberculosis age-standardized deaths per 100,000 (female, male)................0.4, 0.7
Malnutrition prev., weight for age (female, male) (% of children <5)..............4.7, 2.5
Maternal mortality ratio (per 100,000 live births)2...................................52 [33–83]
Total fertility rate (children per women)............................................................... 1.8
Adolescent fertility rate (births per 1,000 girls aged 15–19).............................. 48.9
Antenatal care coverage, at least one visit (%)..................................................... 93
Births attended by skilled health personnel (%).................................................... 99
Contraceptive prevalence, any method
(% of married or in-union women aged 15–49)................................................. 59
Existence of legislation permitting abortion
to preserve a woman’s physical health............................................................. Yes
FAMILY
Singulate mean age (years) at marriage (female, male)...................................32, 34
Early marriage (% of women aged 15–19)........................................................... —
Mean age of women at the birth of the first child................................................. —
Length of paid maternity leave (calendar days)..................................................... 84
Provider of maternity leave benefits........................................................Government
Percent of wages paid during maternity leave.................................................... 100
Length of paid paternity leave (calendar days)...................................................... —
Provider of paternity leave benefits....................................................................... —
Percent of wages paid during paternity leave....................................................... —
RIGHTS AND NORMS
Parental authority in marriage3............................................................................. —
Parental authority after divorce3........................................................................... —
Female genital mutilation (% of women aged 15–49)........................................... —
Existence of legislation on domestic violence3...................................................... —
Existence of legislation on gender-based discrimination...................................... Yes
Inheritance rights for daughters3.......................................................................... —
Women’s secure access to land use, control and ownership3............................... —
Women’s access to financial services3................................................................. —
Women’s secure access to non-land assets use, control and ownership3............. —
Year women received right to vote.................................................................... 1950
Quota type (single/lower house)............................................................................ —
Voluntary political party quotas............................................................................. —](https://image.slidesharecdn.com/theglobalgendergapreport2015-160119013910/85/The-Global-Gender-Gap-Report-2015-111-320.jpg)

![Index over the years
SAMPLE INDEX ECONOMY EDUCATION HEALTH POLITICS
Year No. of countries Rank Score Rank Score Rank Score Rank Score Rank Score
2015 145 34 0.734 10 0.813 33 1.000 42 0.979 79 0.146
2014 142 32 0.730 6 0.820 35 0.999 37 0.979 89 0.121
2013 136 — — — — — — — — — —
2012 135 — — — — — — — — — —
2011 135 — — — — — — — — — —
2010 134 — — — — — — — — — —
2009 134 34 0.714 29 0.726 75 0.990 41 0.979 46 0.161
2008 130 33 0.710 26 0.726 72 0.990 38 0.979 52 0.144
2007 128 23 0.711 20 0.728 74 0.983 37 0.979 39 0.155
2006 115 — — — — — — — — — —
2006–2015 CHANGE s 0.023 s 0.085 s 0.016 s 0.000 t –0.009
Part 2: Country Profiles
The Global Gender Gap Report 2015 | 105
1 Survey data, responses on a 1-to-7 scale (1 = worst score, 7 = best score)
2 Bracketed numbers show the range between the uncertainties, estimated to contain the true maternal mortality ratio with a 95% probability
3 Data on a 0-to-1 scale (1 = worst score, 0 = best score)
Belarus
Selected contextual data
EMPLOYMENT AND LEADERSHIP
Female, male adult unemployment
(as % of female, male labour force)............................................................4.6, 7.5
Female, male part-time employment
(as % of total female, male employment)....................................................—, —
Female, male workers in informal employment
(as % of non-agricultural employment).......................................................—, —
Share of women in wage employment in the non-agricultural sector
(% of total non-agricultural employment).......................................................... 52
Average minutes spent per day on unpaid work (female, male)......................—, —
Percentage of women, men with an account
at a financial institution................................................................................72, 72
Ability of women to rise to positions of leadership1.............................................. —
Firms with female top managers (% of firms)....................................................... 33
Share of women on boards of listed companies (%)............................................. —
Firms with female participation in ownership (% of firms).................................... 44
Percentage of total R&D personnel (FTE) (female, male).................................—, —
EDUCATION AND TECHNOLOGY
Out-of-school children of primary school age (%) (female, male).....................42, 58
Female, male primary education attainment rate (% aged 25+)......................96, 97
Female, male secondary education attainment rate (% aged 25+)..................87, 92
Female, male tertiary education attainment rate (% aged 25+).......................53, 47
Percentage of tertiary-level students enrolled in STEM studies
(female, male)..............................................................................................29, 71
Percentage of tertiary-level graduates in STEM studies (female, male)............32, 68
Percentage of PhD graduates (female, male)...................................................55, 45
Percentage of individuals using the internet (female, male).............................52, 58
Percentage of individuals using a
mobile cellular telephone (female, male)......................................................91, 90
HEALTH
Cardiovascular disease age-standardized deaths
per 100,000 (female, male)................................................................339.6, 674.4
Cancer age-standardized deaths per 100,000
excl. non-melanoma skin cancer (female, male)...................................79.0, 182.2
Diabetes age-standardized deaths per 100,000 (female, male).....................1.7, 2.0
Chronic respiratory disease age-standardized deaths
per 100,000 (female, male)......................................................................5.2, 37.1
HEALTH (cont’d.)
HIV/AIDS age-standardized deaths per 100,000 (female, male)...................5.9, 13.8
Malaria age-standardized deaths per 100,000 (female, male).......................0.0, 0.0
Tuberculosis age-standardized deaths per 100,000 (female, male)................1.2, 7.9
Malnutrition prev., weight for age (female, male) (% of children <5)..............1.0, 1.5
Maternal mortality ratio (per 100,000 live births)2.........................................1 [1–2]
Total fertility rate (children per women)............................................................... 1.5
Adolescent fertility rate (births per 1,000 girls aged 15–19).............................. 20.7
Antenatal care coverage, at least one visit (%)................................................... 100
Births attended by skilled health personnel (%).................................................. 100
Contraceptive prevalence, any method
(% of married or in-union women aged 15–49)................................................. 63
Existence of legislation permitting abortion
to preserve a woman’s physical health............................................................. Yes
FAMILY
Singulate mean age (years) at marriage (female, male)...................................25, 27
Early marriage (% of women aged 15–19)............................................................. 4
Mean age of women at the birth of the first child................................................. —
Length of paid maternity leave (calendar days)................................................... 126
Provider of maternity leave benefits........................................................Government
Percent of wages paid during maternity leave.................................................... 100
Length of paid paternity leave (calendar days)...................................................... —
Provider of paternity leave benefits....................................................................... —
Percent of wages paid during paternity leave....................................................... —
RIGHTS AND NORMS
Parental authority in marriage3............................................................................ 0.0
Parental authority after divorce3.......................................................................... 0.0
Female genital mutilation (% of women aged 15–49).......................................... 0.0
Existence of legislation on domestic violence3..................................................... 0.3
Existence of legislation on gender-based discrimination....................................... —
Inheritance rights for daughters3......................................................................... 0.0
Women’s secure access to land use, control and ownership3.............................. 0.0
Women’s access to financial services3................................................................ 0.0
Women’s secure access to non-land assets use, control and ownership3............ 0.0
Year women received right to vote.................................................................... 1918
Quota type (single/lower house)............................................................................ —
Voluntary political party quotas............................................................................. —](https://image.slidesharecdn.com/theglobalgendergapreport2015-160119013910/85/The-Global-Gender-Gap-Report-2015-113-320.jpg)

![Index over the years
SAMPLE INDEX ECONOMY EDUCATION HEALTH POLITICS
Year No. of countries Rank Score Rank Score Rank Score Rank Score Rank Score
2015 145 19 0.753 34 0.762 1 1.000 66 0.974 35 0.275
2014 142 10 0.781 27 0.758 73 0.992 52 0.979 13 0.395
2013 136 11 0.768 34 0.737 67 0.992 47 0.979 14 0.366
2012 135 12 0.765 36 0.724 67 0.992 50 0.979 10 0.366
2011 135 13 0.753 36 0.719 63 0.991 46 0.979 17 0.324
2010 134 14 0.751 39 0.710 62 0.991 44 0.979 16 0.324
2009 134 33 0.717 64 0.653 71 0.991 55 0.979 29 0.243
2008 130 28 0.716 60 0.652 67 0.991 52 0.979 27 0.243
2007 128 19 0.720 46 0.668 1 1.000 50 0.979 20 0.232
2006 115 20 0.708 54 0.620 1 1.000 1 0.980 19 0.232
2006–2015 CHANGE s 0.045 s 0.142 t 0.000 t –0.005 s 0.043
Part 2: Country Profiles
The Global Gender Gap Report 2015 | 107
1 Survey data, responses on a 1-to-7 scale (1 = worst score, 7 = best score)
2 Bracketed numbers show the range between the uncertainties, estimated to contain the true maternal mortality ratio with a 95% probability
3 Data on a 0-to-1 scale (1 = worst score, 0 = best score)
Belgium
Selected contextual data
EMPLOYMENT AND LEADERSHIP
Female, male adult unemployment
(as % of female, male labour force)............................................................8.2, 8.6
Female, male part-time employment
(as % of total female, male employment).................................................29.9, 6.3
Female, male workers in informal employment
(as % of non-agricultural employment).......................................................—, —
Share of women in wage employment in the non-agricultural sector
(% of total non-agricultural employment).......................................................... 48
Average minutes spent per day on unpaid work (female, male)...................245, 151
Percentage of women, men with an account
at a financial institution..............................................................................100, 97
Ability of women to rise to positions of leadership1............................................. 5.4
Firms with female top managers (% of firms)....................................................... —
Share of women on boards of listed companies (%)............................................. 10
Firms with female participation in ownership (% of firms).................................... —
Percentage of total R&D personnel (FTE) (female, male)..................................34, 66
EDUCATION AND TECHNOLOGY
Out-of-school children of primary school age (%) (female, male).....................46, 54
Female, male primary education attainment rate (% aged 25+)......................92, 94
Female, male secondary education attainment rate (% aged 25+)..................79, 84
Female, male tertiary education attainment rate (% aged 25+).......................31, 30
Percentage of tertiary-level students enrolled in STEM studies
(female, male)..............................................................................................22, 78
Percentage of tertiary-level graduates in STEM studies (female, male)............24, 76
Percentage of PhD graduates (female, male)...................................................44, 56
Percentage of individuals using the internet (female, male).............................80, 84
Percentage of individuals using a
mobile cellular telephone (female, male).....................................................—, —
HEALTH
Cardiovascular disease age-standardized deaths
per 100,000 (female, male)..................................................................86.9, 140.3
Cancer age-standardized deaths per 100,000
excl. non-melanoma skin cancer (female, male).................................102.0, 167.5
Diabetes age-standardized deaths per 100,000 (female, male).....................5.7, 7.7
Chronic respiratory disease age-standardized deaths
per 100,000 (female, male)....................................................................16.6, 38.9
HEALTH (cont’d.)
HIV/AIDS age-standardized deaths per 100,000 (female, male).....................0.2, 0.4
Malaria age-standardized deaths per 100,000 (female, male).......................0.0, 0.0
Tuberculosis age-standardized deaths per 100,000 (female, male)................0.2, 0.5
Malnutrition prev., weight for age (female, male) (% of children <5)...............—, —
Maternal mortality ratio (per 100,000 live births)2.......................................6 [4–10]
Total fertility rate (children per women)............................................................... 1.9
Adolescent fertility rate (births per 1,000 girls aged 15–19)................................ 9.0
Antenatal care coverage, at least one visit (%)..................................................... —
Births attended by skilled health personnel (%).................................................... —
Contraceptive prevalence, any method
(% of married or in-union women aged 15–49)................................................. 70
Existence of legislation permitting abortion
to preserve a woman’s physical health............................................................. Yes
FAMILY
Singulate mean age (years) at marriage (female, male)...................................31, 33
Early marriage (% of women aged 15–19)............................................................. 1
Mean age of women at the birth of the first child................................................. 28
Length of paid maternity leave (calendar days)................................................... 105
Provider of maternity leave benefits........................................................Government
Percent of wages paid during maternity leave...................................................... 86
Length of paid paternity leave (calendar days)...................................................... 10
Provider of paternity leave benefits.................................. Employer and Government
Percent of wages paid during paternity leave....................................................... 80
RIGHTS AND NORMS
Parental authority in marriage3............................................................................ 0.0
Parental authority after divorce3.......................................................................... 0.0
Female genital mutilation (% of women aged 15–49).......................................... 0.0
Existence of legislation on domestic violence3..................................................... 0.0
Existence of legislation on gender-based discrimination...................................... Yes
Inheritance rights for daughters3......................................................................... 0.0
Women’s secure access to land use, control and ownership3.............................. 0.0
Women’s access to financial services3................................................................ 0.0
Women’s secure access to non-land assets use, control and ownership3............ 0.0
Year women received right to vote...........................................................1919, 1948
Quota type (single/lower house).................................... Legislated Candidate Quotas
Voluntary political party quotas............................................................................. No](https://image.slidesharecdn.com/theglobalgendergapreport2015-160119013910/85/The-Global-Gender-Gap-Report-2015-115-320.jpg)
![Index over the years
SAMPLE INDEX ECONOMY EDUCATION HEALTH POLITICS
Year No. of countries Rank Score Rank Score Rank Score Rank Score Rank Score
2015 145 103 0.668 85 0.651 68 0.994 1 0.980 135 0.048
2014 142 100 0.670 79 0.653 1 1.000 1 0.980 133 0.048
2013 136 107 0.645 80 0.646 103 0.944 1 0.980 133 0.010
2012 135 102 0.646 77 0.641 100 0.955 1 0.980 131 0.010
2011 135 100 0.649 81 0.616 1 1.000 1 0.980 132 0.000
2010 134 93 0.654 72 0.636 32 0.999 1 0.980 131 0.000
2009 134 87 0.664 79 0.622 35 0.998 1 0.980 121 0.055
2008 130 86 0.661 79 0.609 1 1.000 1 0.980 116 0.055
2007 128 94 0.643 96 0.552 1 1.000 1 0.980 114 0.039
2006 115 — — — — — — — — — —
2006–2015 CHANGE s 0.025 s 0.099 t –0.006 t 0.000 s 0.009
Part 2: Country Profiles
The Global Gender Gap Report 2015 | 109
1 Survey data, responses on a 1-to-7 scale (1 = worst score, 7 = best score)
2 Bracketed numbers show the range between the uncertainties, estimated to contain the true maternal mortality ratio with a 95% probability
3 Data on a 0-to-1 scale (1 = worst score, 0 = best score)
Belize
Selected contextual data
EMPLOYMENT AND LEADERSHIP
Female, male adult unemployment
(as % of female, male labour force)..........................................................22.3, 9.1
Female, male part-time employment
(as % of total female, male employment)...............................................25.5, 12.0
Female, male workers in informal employment
(as % of non-agricultural employment).......................................................—, —
Share of women in wage employment in the non-agricultural sector
(% of total non-agricultural employment).......................................................... 38
Average minutes spent per day on unpaid work (female, male)......................—, —
Percentage of women, men with an account
at a financial institution................................................................................52, 44
Ability of women to rise to positions of leadership1.............................................. —
Firms with female top managers (% of firms)....................................................... 26
Share of women on boards of listed companies (%)............................................. —
Firms with female participation in ownership (% of firms).................................... 30
Percentage of total R&D personnel (FTE) (female, male).................................—, —
EDUCATION AND TECHNOLOGY
Out-of-school children of primary school age (%) (female, male).....................45, 55
Female, male primary education attainment rate (% aged 25+)......................91, 90
Female, male secondary education attainment rate (% aged 25+)..................76, 76
Female, male tertiary education attainment rate (% aged 25+)...........................5, 5
Percentage of tertiary-level students enrolled in STEM studies
(female, male).............................................................................................—, —
Percentage of tertiary-level graduates in STEM studies (female, male)...........—, —
Percentage of PhD graduates (female, male)..................................................—, —
Percentage of individuals using the internet (female, male)............................—, —
Percentage of individuals using a
mobile cellular telephone (female, male).....................................................—, —
HEALTH
Cardiovascular disease age-standardized deaths
per 100,000 (female, male)................................................................180.8, 201.6
Cancer age-standardized deaths per 100,000
excl. non-melanoma skin cancer (female, male)...................................57.3, 114.4
Diabetes age-standardized deaths per 100,000 (female, male).................73.4, 63.1
Chronic respiratory disease age-standardized deaths
per 100,000 (female, male)......................................................................8.9, 46.4
HEALTH (cont’d.)
HIV/AIDS age-standardized deaths per 100,000 (female, male).................16.8, 40.1
Malaria age-standardized deaths per 100,000 (female, male).......................0.0, 0.0
Tuberculosis age-standardized deaths per 100,000 (female, male)..............2.2, 10.7
Malnutrition prev., weight for age (female, male) (% of children <5)..............6.6, 5.7
Maternal mortality ratio (per 100,000 live births)2...................................45 [30–68]
Total fertility rate (children per women)............................................................... 2.7
Adolescent fertility rate (births per 1,000 girls aged 15–19).............................. 93.1
Antenatal care coverage, at least one visit (%)..................................................... 96
Births attended by skilled health personnel (%).................................................... 95
Contraceptive prevalence, any method
(% of married or in-union women aged 15–49)................................................. 55
Existence of legislation permitting abortion
to preserve a woman’s physical health............................................................. Yes
FAMILY
Singulate mean age (years) at marriage (female, male)...................................21, 24
Early marriage (% of women aged 15–19)........................................................... —
Mean age of women at the birth of the first child................................................. —
Length of paid maternity leave (calendar days)..................................................... 98
Provider of maternity leave benefits........................................................Government
Percent of wages paid during maternity leave...................................................... 80
Length of paid paternity leave (calendar days)...................................................... —
Provider of paternity leave benefits....................................................................... —
Percent of wages paid during paternity leave....................................................... —
RIGHTS AND NORMS
Parental authority in marriage3............................................................................. —
Parental authority after divorce3........................................................................... —
Female genital mutilation (% of women aged 15–49)........................................... —
Existence of legislation on domestic violence3...................................................... —
Existence of legislation on gender-based discrimination....................................... —
Inheritance rights for daughters3.......................................................................... —
Women’s secure access to land use, control and ownership3............................... —
Women’s access to financial services3................................................................. —
Women’s secure access to non-land assets use, control and ownership3............. —
Year women received right to vote.................................................................... 1954
Quota type (single/lower house)............................................................................ —
Voluntary political party quotas............................................................................. —](https://image.slidesharecdn.com/theglobalgendergapreport2015-160119013910/85/The-Global-Gender-Gap-Report-2015-117-320.jpg)

![Index over the years
SAMPLE INDEX ECONOMY EDUCATION HEALTH POLITICS
Year No. of countries Rank Score Rank Score Rank Score Rank Score Rank Score
2015 145 129 0.625 33 0.764 144 0.700 117 0.967 127 0.067
2014 142 — — — — — — — — — —
2013 136 126 0.589 31 0.742 136 0.513 112 0.961 72 0.138
2012 135 117 0.626 23 0.759 134 0.645 111 0.961 69 0.138
2011 135 128 0.583 67 0.649 133 0.656 111 0.961 104 0.066
2010 134 128 0.572 85 0.605 133 0.646 110 0.961 100 0.076
2009 134 131 0.564 110 0.546 132 0.627 70 0.975 79 0.108
2008 130 126 0.558 105 0.516 128 0.633 67 0.975 75 0.108
2007 128 123 0.566 102 0.543 125 0.658 65 0.975 81 0.086
2006 115 110 0.578 55 0.618 113 0.643 86 0.969 76 0.082
2006–2015 CHANGE s 0.047 s 0.146 s 0.056 t –0.002 t –0.015
Part 2: Country Profiles
The Global Gender Gap Report 2015 | 111
1 Survey data, responses on a 1-to-7 scale (1 = worst score, 7 = best score)
2 Bracketed numbers show the range between the uncertainties, estimated to contain the true maternal mortality ratio with a 95% probability
3 Data on a 0-to-1 scale (1 = worst score, 0 = best score)
Benin
Selected contextual data
EMPLOYMENT AND LEADERSHIP
Female, male adult unemployment
(as % of female, male labour force)............................................................1.1, 0.9
Female, male part-time employment
(as % of total female, male employment)....................................................—, —
Female, male workers in informal employment
(as % of non-agricultural employment).......................................................—, —
Share of women in wage employment in the non-agricultural sector
(% of total non-agricultural employment).......................................................... 26
Average minutes spent per day on unpaid work (female, male)......................—, —
Percentage of women, men with an account
at a financial institution................................................................................13, 19
Ability of women to rise to positions of leadership1............................................. 4.5
Firms with female top managers (% of firms)....................................................... 27
Share of women on boards of listed companies (%)............................................. —
Firms with female participation in ownership (% of firms).................................... 45
Percentage of total R&D personnel (FTE) (female, male).................................—, —
EDUCATION AND TECHNOLOGY
Out-of-school children of primary school age (%) (female, male).......................99, 1
Female, male primary education attainment rate (% aged 25+)......................20, 43
Female, male secondary education attainment rate (% aged 25+)....................8, 21
Female, male tertiary education attainment rate (% aged 25+)...........................1, 4
Percentage of tertiary-level students enrolled in STEM studies
(female, male)..............................................................................................12, 88
Percentage of tertiary-level graduates in STEM studies (female, male)............19, 81
Percentage of PhD graduates (female, male)..................................................—, —
Percentage of individuals using the internet (female, male)............................—, —
Percentage of individuals using a
mobile cellular telephone (female, male).....................................................—, —
HEALTH
Cardiovascular disease age-standardized deaths
per 100,000 (female, male)................................................................371.1, 367.4
Cancer age-standardized deaths per 100,000
excl. non-melanoma skin cancer (female, male)...................................82.6, 104.8
Diabetes age-standardized deaths per 100,000 (female, male).................48.1, 47.3
Chronic respiratory disease age-standardized deaths
per 100,000 (female, male)....................................................................31.6, 58.2
HEALTH (cont’d.)
HIV/AIDS age-standardized deaths per 100,000 (female, male).................42.9, 35.3
Malaria age-standardized deaths per 100,000 (female, male)...................54.0, 60.8
Tuberculosis age-standardized deaths per 100,000 (female, male)..............9.8, 22.1
Malnutrition prev., weight for age (female, male) (% of children <5)..........17.6, 22.7
Maternal mortality ratio (per 100,000 live births)2.............................340 [200–580]
Total fertility rate (children per women)............................................................... 4.8
Adolescent fertility rate (births per 1,000 girls aged 15–19).............................. 98.0
Antenatal care coverage, at least one visit (%)..................................................... 84
Births attended by skilled health personnel (%).................................................... 81
Contraceptive prevalence, any method
(% of married or in-union women aged 15–49)................................................. 13
Existence of legislation permitting abortion
to preserve a woman’s physical health............................................................. Yes
FAMILY
Singulate mean age (years) at marriage (female, male)...................................21, 25
Early marriage (% of women aged 15–19)........................................................... 22
Mean age of women at the birth of the first child................................................. —
Length of paid maternity leave (calendar days)..................................................... 98
Provider of maternity leave benefits................................. Employer and Government
Percent of wages paid during maternity leave.................................................... 100
Length of paid paternity leave (calendar days)........................................................ 3
Provider of paternity leave benefits.............................................................Employer
Percent of wages paid during paternity leave..................................................... 100
RIGHTS AND NORMS
Parental authority in marriage3............................................................................ 0.0
Parental authority after divorce3.......................................................................... 0.0
Female genital mutilation (% of women aged 15–49).......................................... 0.1
Existence of legislation on domestic violence3..................................................... 0.3
Existence of legislation on gender-based discrimination....................................... —
Inheritance rights for daughters3......................................................................... 0.5
Women’s secure access to land use, control and ownership3.............................. 0.5
Women’s access to financial services3................................................................ 0.5
Women’s secure access to non-land assets use, control and ownership3............ 0.5
Year women received right to vote.................................................................... 1956
Quota type (single/lower house)............................................................................ —
Voluntary political party quotas............................................................................. —](https://image.slidesharecdn.com/theglobalgendergapreport2015-160119013910/85/The-Global-Gender-Gap-Report-2015-119-320.jpg)

![Index over the years
SAMPLE INDEX ECONOMY EDUCATION HEALTH POLITICS
Year No. of countries Rank Score Rank Score Rank Score Rank Score Rank Score
2015 145 118 0.646 90 0.641 121 0.921 126 0.966 132 0.056
2014 142 120 0.636 93 0.637 123 0.886 120 0.966 130 0.056
2013 136 93 0.665 27 0.753 116 0.884 82 0.973 122 0.051
2012 135 — — — — — — — — — —
2011 135 — — — — — — — — — —
2010 134 — — — — — — — — — —
2009 134 — — — — — — — — — —
2008 130 — — — — — — — — — —
2007 128 — — — — — — — — — —
2006 115 — — — — — — — — — —
2006–2015 CHANGE t –0.019 t –0.112 s 0.037 t –0.006 s 0.005
Part 2: Country Profiles
The Global Gender Gap Report 2015 | 113
1 Survey data, responses on a 1-to-7 scale (1 = worst score, 7 = best score)
2 Bracketed numbers show the range between the uncertainties, estimated to contain the true maternal mortality ratio with a 95% probability
3 Data on a 0-to-1 scale (1 = worst score, 0 = best score)
Bhutan
Selected contextual data
EMPLOYMENT AND LEADERSHIP
Female, male adult unemployment
(as % of female, male labour force)............................................................2.2, 1.9
Female, male part-time employment
(as % of total female, male employment).................................................13.3, 1.4
Female, male workers in informal employment
(as % of non-agricultural employment).......................................................—, —
Share of women in wage employment in the non-agricultural sector
(% of total non-agricultural employment).......................................................... 26
Average minutes spent per day on unpaid work (female, male)......................—, —
Percentage of women, men with an account
at a financial institution................................................................................28, 39
Ability of women to rise to positions of leadership1............................................. 5.3
Firms with female top managers (% of firms)....................................................... —
Share of women on boards of listed companies (%)............................................. —
Firms with female participation in ownership (% of firms).................................... 31
Percentage of total R&D personnel (FTE) (female, male).................................—, —
EDUCATION AND TECHNOLOGY
Out-of-school children of primary school age (%) (female, male).....................42, 58
Female, male primary education attainment rate (% aged 25+)......................49, 47
Female, male secondary education attainment rate (% aged 25+)..................34, 35
Female, male tertiary education attainment rate (% aged 25+)...........................8, 9
Percentage of tertiary-level students enrolled in STEM studies
(female, male)..............................................................................................30, 70
Percentage of tertiary-level graduates in STEM studies (female, male)............25, 75
Percentage of PhD graduates (female, male)..................................................—, —
Percentage of individuals using the internet (female, male)............................—, —
Percentage of individuals using a
mobile cellular telephone (female, male).....................................................—, —
HEALTH
Cardiovascular disease age-standardized deaths
per 100,000 (female, male)................................................................203.4, 187.1
Cancer age-standardized deaths per 100,000
excl. non-melanoma skin cancer (female, male).....................................79.8, 80.8
Diabetes age-standardized deaths per 100,000 (female, male).................36.0, 32.2
Chronic respiratory disease age-standardized deaths
per 100,000 (female, male)..................................................................84.9, 120.5
HEALTH (cont’d.)
HIV/AIDS age-standardized deaths per 100,000 (female, male)...................4.7, 12.1
Malaria age-standardized deaths per 100,000 (female, male).......................0.0, 0.0
Tuberculosis age-standardized deaths per 100,000 (female, male)............14.6, 25.0
Malnutrition prev., weight for age (female, male) (% of children <5)..........12.3, 13.4
Maternal mortality ratio (per 100,000 live births)2...............................120 [74–190]
Total fertility rate (children per women)............................................................... 2.2
Adolescent fertility rate (births per 1,000 girls aged 15–19).............................. 59.0
Antenatal care coverage, at least one visit (%)..................................................... 74
Births attended by skilled health personnel (%).................................................... 58
Contraceptive prevalence, any method
(% of married or in-union women aged 15–49)................................................. 66
Existence of legislation permitting abortion
to preserve a woman’s physical health.............................................................. No
FAMILY
Singulate mean age (years) at marriage (female, male)...................................23, 25
Early marriage (% of women aged 15–19)........................................................... 14
Mean age of women at the birth of the first child................................................. —
Length of paid maternity leave (calendar days)..................................................... 56
Provider of maternity leave benefits............................................................Employer
Percent of wages paid during maternity leave.................................................... 100
Length of paid paternity leave (calendar days)........................................................ 5
Provider of paternity leave benefits.............................................................Employer
Percent of wages paid during paternity leave..................................................... 100
RIGHTS AND NORMS
Parental authority in marriage3..................................................................................
Parental authority after divorce3.......................................................................... 0.0
Female genital mutilation (% of women aged 15–49).......................................... 0.0
Existence of legislation on domestic violence3..................................................... 0.0
Existence of legislation on gender-based discrimination....................................... —
Inheritance rights for daughters3......................................................................... 0.5
Women’s secure access to land use, control and ownership3.............................. 0.0
Women’s access to financial services3................................................................ 0.0
Women’s secure access to non-land assets use, control and ownership3............ 0.0
Year women received right to vote.................................................................... 1953
Quota type (single/lower house)............................................................................ —
Voluntary political party quotas............................................................................. —](https://image.slidesharecdn.com/theglobalgendergapreport2015-160119013910/85/The-Global-Gender-Gap-Report-2015-121-320.jpg)

![Index over the years
SAMPLE INDEX ECONOMY EDUCATION HEALTH POLITICS
Year No. of countries Rank Score Rank Score Rank Score Rank Score Rank Score
2015 145 22 0.749 96 0.634 101 0.967 1 0.980 10 0.415
2014 142 58 0.705 92 0.638 99 0.970 56 0.977 40 0.235
2013 136 27 0.734 57 0.684 99 0.962 84 0.972 23 0.317
2012 135 30 0.722 79 0.637 98 0.963 84 0.972 20 0.317
2011 135 62 0.686 72 0.635 95 0.965 84 0.972 45 0.173
2010 134 76 0.675 91 0.596 97 0.959 82 0.972 46 0.173
2009 134 82 0.669 94 0.591 91 0.975 112 0.967 56 0.145
2008 130 80 0.667 88 0.584 90 0.971 108 0.967 51 0.145
2007 128 80 0.657 77 0.607 85 0.968 107 0.967 79 0.087
2006 115 87 0.634 77 0.559 89 0.917 79 0.970 71 0.087
2006–2015 CHANGE s 0.115 s 0.074 s 0.050 s 0.009 s 0.327
Part 2: Country Profiles
The Global Gender Gap Report 2015 | 115
1 Survey data, responses on a 1-to-7 scale (1 = worst score, 7 = best score)
2 Bracketed numbers show the range between the uncertainties, estimated to contain the true maternal mortality ratio with a 95% probability
3 Data on a 0-to-1 scale (1 = worst score, 0 = best score)
Bolivia
Selected contextual data
EMPLOYMENT AND LEADERSHIP
Female, male adult unemployment
(as % of female, male labour force)............................................................3.3, 2.2
Female, male part-time employment
(as % of total female, male employment)...............................................30.7, 17.3
Female, male workers in informal employment
(as % of non-agricultural employment)........................................................47, 53
Share of women in wage employment in the non-agricultural sector
(% of total non-agricultural employment).......................................................... 37
Average minutes spent per day on unpaid work (female, male)......................—, —
Percentage of women, men with an account
at a financial institution................................................................................38, 44
Ability of women to rise to positions of leadership1............................................. 3.3
Firms with female top managers (% of firms)....................................................... 22
Share of women on boards of listed companies (%)............................................. —
Firms with female participation in ownership (% of firms).................................... 41
Percentage of total R&D personnel (FTE) (female, male).................................—, —
EDUCATION AND TECHNOLOGY
Out-of-school children of primary school age (%) (female, male).....................50, 50
Female, male primary education attainment rate (% aged 25+)......................51, 62
Female, male secondary education attainment rate (% aged 25+)..................46, 55
Female, male tertiary education attainment rate (% aged 25+).......................22, 25
Percentage of tertiary-level students enrolled in STEM studies
(female, male).............................................................................................—, —
Percentage of tertiary-level graduates in STEM studies (female, male)...........—, —
Percentage of PhD graduates (female, male)..................................................—, —
Percentage of individuals using the internet (female, male).............................34, 40
Percentage of individuals using a
mobile cellular telephone (female, male)......................................................71, 70
HEALTH
Cardiovascular disease age-standardized deaths
per 100,000 (female, male)................................................................236.9, 308.7
Cancer age-standardized deaths per 100,000
excl. non-melanoma skin cancer (female, male).................................109.9, 106.0
Diabetes age-standardized deaths per 100,000 (female, male).................48.5, 40.4
Chronic respiratory disease age-standardized deaths
per 100,000 (female, male)....................................................................33.9, 46.7
HEALTH (cont’d.)
HIV/AIDS age-standardized deaths per 100,000 (female, male)...................8.3, 21.8
Malaria age-standardized deaths per 100,000 (female, male).......................0.0, 0.0
Tuberculosis age-standardized deaths per 100,000 (female, male)............20.8, 40.9
Malnutrition prev., weight for age (female, male) (% of children <5)..............4.0, 4.9
Maternal mortality ratio (per 100,000 live births)2.............................200 [130–310]
Total fertility rate (children per women)............................................................... 3.2
Adolescent fertility rate (births per 1,000 girls aged 15–19).............................. 89.0
Antenatal care coverage, at least one visit (%)..................................................... 86
Births attended by skilled health personnel (%).................................................... 84
Contraceptive prevalence, any method
(% of married or in-union women aged 15–49)................................................. 61
Existence of legislation permitting abortion
to preserve a woman’s physical health............................................................. Yes
FAMILY
Singulate mean age (years) at marriage (female, male)...................................23, 25
Early marriage (% of women aged 15–19)........................................................... 15
Mean age of women at the birth of the first child................................................. —
Length of paid maternity leave (calendar days)..................................................... 90
Provider of maternity leave benefits................................. Employer and Government
Percent of wages paid during maternity leave.................................................... 100
Length of paid paternity leave (calendar days)........................................................ 3
Provider of paternity leave benefits.............................................................Employer
Percent of wages paid during paternity leave..................................................... 100
RIGHTS AND NORMS
Parental authority in marriage3............................................................................ 0.0
Parental authority after divorce3.......................................................................... 0.0
Female genital mutilation (% of women aged 15–49).......................................... 0.0
Existence of legislation on domestic violence3..................................................... 0.0
Existence of legislation on gender-based discrimination....................................... —
Inheritance rights for daughters3......................................................................... 0.5
Women’s secure access to land use, control and ownership3.............................. 0.5
Women’s access to financial services3................................................................ 0.0
Women’s secure access to non-land assets use, control and ownership3............ 0.0
Year women received right to vote...........................................................1938, 1952
Quota type (single/lower house).................................... Legislated Candidate Quotas
Voluntary political party quotas............................................................................ Yes](https://image.slidesharecdn.com/theglobalgendergapreport2015-160119013910/85/The-Global-Gender-Gap-Report-2015-123-320.jpg)

![Index over the years
SAMPLE INDEX ECONOMY EDUCATION HEALTH POLITICS
Year No. of countries Rank Score Rank Score Rank Score Rank Score Rank Score
2015 145 55 0.710 15 0.800 1 1.000 87 0.973 126 0.068
2014 142 51 0.713 8 0.817 1 1.000 112 0.967 124 0.068
2013 136 85 0.675 48 0.711 1 1.000 127 0.955 127 0.035
2012 135 77 0.674 45 0.708 1 1.000 125 0.955 124 0.035
2011 135 66 0.683 37 0.719 1 1.000 126 0.955 111 0.060
2010 134 62 0.688 29 0.736 1 1.000 125 0.955 108 0.060
2009 134 39 0.707 22 0.742 27 1.000 124 0.953 66 0.134
2008 130 63 0.684 61 0.649 26 1.000 120 0.953 61 0.134
2007 128 53 0.680 63 0.640 30 0.998 118 0.953 53 0.129
2006 115 34 0.690 23 0.693 67 0.981 109 0.956 47 0.129
2006–2015 CHANGE s 0.020 s 0.107 s 0.019 s 0.017 t –0.061
Part 2: Country Profiles
The Global Gender Gap Report 2015 | 117
1 Survey data, responses on a 1-to-7 scale (1 = worst score, 7 = best score)
2 Bracketed numbers show the range between the uncertainties, estimated to contain the true maternal mortality ratio with a 95% probability
3 Data on a 0-to-1 scale (1 = worst score, 0 = best score)
Botswana
Selected contextual data
EMPLOYMENT AND LEADERSHIP
Female, male adult unemployment
(as % of female, male labour force)........................................................21.4, 14.6
Female, male part-time employment
(as % of total female, male employment)...............................................15.4, 11.7
Female, male workers in informal employment
(as % of non-agricultural employment).......................................................—, —
Share of women in wage employment in the non-agricultural sector
(% of total non-agricultural employment).......................................................... 41
Average minutes spent per day on unpaid work (female, male)......................—, —
Percentage of women, men with an account
at a financial institution................................................................................46, 53
Ability of women to rise to positions of leadership1............................................. 4.4
Firms with female top managers (% of firms)....................................................... 16
Share of women on boards of listed companies (%)............................................. —
Firms with female participation in ownership (% of firms).................................... 55
Percentage of total R&D personnel (FTE) (female, male).................................—, —
EDUCATION AND TECHNOLOGY
Out-of-school children of primary school age (%) (female, male).....................46, 54
Female, male primary education attainment rate (% aged 25+).....................—, —
Female, male secondary education attainment rate (% aged 25+).................—, —
Female, male tertiary education attainment rate (% aged 25+)......................—, —
Percentage of tertiary-level students enrolled in STEM studies
(female, male)..............................................................................................39, 61
Percentage of tertiary-level graduates in STEM studies (female, male)...........—, —
Percentage of PhD graduates (female, male)..................................................—, —
Percentage of individuals using the internet (female, male)............................—, —
Percentage of individuals using a
mobile cellular telephone (female, male).....................................................—, —
HEALTH
Cardiovascular disease age-standardized deaths
per 100,000 (female, male)................................................................349.5, 277.5
Cancer age-standardized deaths per 100,000
excl. non-melanoma skin cancer (female, male)...................................70.6, 110.5
Diabetes age-standardized deaths per 100,000 (female, male).................73.0, 40.6
Chronic respiratory disease age-standardized deaths
per 100,000 (female, male)....................................................................24.2, 40.5
HEALTH (cont’d.)
HIV/AIDS age-standardized deaths per 100,000 (female, male).............367.3, 390.6
Malaria age-standardized deaths per 100,000 (female, male).......................0.2, 0.1
Tuberculosis age-standardized deaths per 100,000 (female, male)............16.1, 60.5
Malnutrition prev., weight for age (female, male) (% of children <5)..........10.2, 12.1
Maternal mortality ratio (per 100,000 live births)2.............................170 [110–280]
Total fertility rate (children per women)............................................................... 2.6
Adolescent fertility rate (births per 1,000 girls aged 15–19).............................. 51.0
Antenatal care coverage, at least one visit (%)..................................................... 94
Births attended by skilled health personnel (%).................................................... 99
Contraceptive prevalence, any method
(% of married or in-union women aged 15–49)................................................. 53
Existence of legislation permitting abortion
to preserve a woman’s physical health............................................................. Yes
FAMILY
Singulate mean age (years) at marriage (female, male)...................................26, 31
Early marriage (% of women aged 15–19)............................................................. 5
Mean age of women at the birth of the first child................................................. —
Length of paid maternity leave (calendar days)..................................................... 84
Provider of maternity leave benefits............................................................Employer
Percent of wages paid during maternity leave...................................................... 50
Length of paid paternity leave (calendar days)...................................................... —
Provider of paternity leave benefits....................................................................... —
Percent of wages paid during paternity leave....................................................... —
RIGHTS AND NORMS
Parental authority in marriage3............................................................................ 0.5
Parental authority after divorce3.......................................................................... 0.5
Female genital mutilation (% of women aged 15–49).......................................... 0.0
Existence of legislation on domestic violence3..................................................... 0.3
Existence of legislation on gender-based discrimination...................................... Yes
Inheritance rights for daughters3......................................................................... 0.5
Women’s secure access to land use, control and ownership3.............................. 0.5
Women’s access to financial services3................................................................ 0.5
Women’s secure access to non-land assets use, control and ownership3............ 0.5
Year women received right to vote.................................................................... 1965
Quota type (single/lower house)............................................................................ —
Voluntary political party quotas............................................................................. —](https://image.slidesharecdn.com/theglobalgendergapreport2015-160119013910/85/The-Global-Gender-Gap-Report-2015-125-320.jpg)

![Index over the years
SAMPLE INDEX ECONOMY EDUCATION HEALTH POLITICS
Year No. of countries Rank Score Rank Score Rank Score Rank Score Rank Score
2015 145 85 0.686 89 0.642 1 1.000 1 0.980 89 0.123
2014 142 71 0.694 81 0.649 1 1.000 1 0.980 74 0.148
2013 136 62 0.695 74 0.656 1 1.000 1 0.980 68 0.144
2012 135 62 0.691 73 0.650 1 1.000 1 0.980 72 0.134
2011 135 82 0.668 68 0.649 66 0.990 1 0.980 114 0.053
2010 134 85 0.665 66 0.643 63 0.990 1 0.980 112 0.049
2009 134 81 0.670 75 0.637 32 0.999 1 0.980 114 0.063
2008 130 73 0.674 59 0.653 1 1.000 1 0.980 110 0.063
2007 128 74 0.664 62 0.645 84 0.969 1 0.980 96 0.062
2006 115 67 0.654 63 0.604 74 0.972 1 0.980 86 0.061
2006–2015 CHANGE s 0.032 s 0.038 s 0.028 s 0.000 s 0.062
Part 2: Country Profiles
The Global Gender Gap Report 2015 | 119
1 Survey data, responses on a 1-to-7 scale (1 = worst score, 7 = best score)
2 Bracketed numbers show the range between the uncertainties, estimated to contain the true maternal mortality ratio with a 95% probability
3 Data on a 0-to-1 scale (1 = worst score, 0 = best score)
Brazil
Selected contextual data
EMPLOYMENT AND LEADERSHIP
Female, male adult unemployment
(as % of female, male labour force)............................................................9.1, 4.9
Female, male part-time employment
(as % of total female, male employment)...............................................28.1, 10.1
Female, male workers in informal employment
(as % of non-agricultural employment)........................................................49, 51
Share of women in wage employment in the non-agricultural sector
(% of total non-agricultural employment).......................................................... 47
Average minutes spent per day on unpaid work (female, male)......................—, —
Percentage of women, men with an account
at a financial institution................................................................................65, 72
Ability of women to rise to positions of leadership1............................................. 3.3
Firms with female top managers (% of firms)....................................................... 19
Share of women on boards of listed companies (%)............................................... 9
Firms with female participation in ownership (% of firms).................................... 50
Percentage of total R&D personnel (FTE) (female, male).................................—, —
EDUCATION AND TECHNOLOGY
Out-of-school children of primary school age (%) (female, male)....................—, —
Female, male primary education attainment rate (% aged 25+)......................78, 77
Female, male secondary education attainment rate (% aged 25+)..................56, 53
Female, male tertiary education attainment rate (% aged 25+).......................13, 11
Percentage of tertiary-level students enrolled in STEM studies
(female, male)..............................................................................................31, 69
Percentage of tertiary-level graduates in STEM studies (female, male)............31, 69
Percentage of PhD graduates (female, male)...................................................51, 49
Percentage of individuals using the internet (female, male).............................53, 49
Percentage of individuals using a
mobile cellular telephone (female, male)......................................................84, 85
HEALTH
Cardiovascular disease age-standardized deaths
per 100,000 (female, male)................................................................177.7, 258.9
Cancer age-standardized deaths per 100,000
excl. non-melanoma skin cancer (female, male).................................100.2, 142.9
Diabetes age-standardized deaths per 100,000 (female, male).................38.9, 39.0
Chronic respiratory disease age-standardized deaths
per 100,000 (female, male)....................................................................29.9, 49.2
HEALTH (cont’d.)
HIV/AIDS age-standardized deaths per 100,000 (female, male)...................5.1, 10.1
Malaria age-standardized deaths per 100,000 (female, male).......................0.0, 0.1
Tuberculosis age-standardized deaths per 100,000 (female, male)................1.5, 4.9
Malnutrition prev., weight for age (female, male) (% of children <5)..............2.1, 2.2
Maternal mortality ratio (per 100,000 live births)2.................................69 [44–110]
Total fertility rate (children per women)............................................................... 1.8
Adolescent fertility rate (births per 1,000 girls aged 15–19).............................. 64.8
Antenatal care coverage, at least one visit (%)..................................................... 96
Births attended by skilled health personnel (%).................................................... 99
Contraceptive prevalence, any method
(% of married or in-union women aged 15–49)................................................. 80
Existence of legislation permitting abortion
to preserve a woman’s physical health.............................................................. No
FAMILY
Singulate mean age (years) at marriage (female, male)...................................30, 32
Early marriage (% of women aged 15–19)............................................................. 4
Mean age of women at the birth of the first child................................................. —
Length of paid maternity leave (calendar days)................................................... 120
Provider of maternity leave benefits........................................................Government
Percent of wages paid during maternity leave.................................................... 100
Length of paid paternity leave (calendar days)........................................................ 5
Provider of paternity leave benefits.............................................................Employer
Percent of wages paid during paternity leave..................................................... 100
RIGHTS AND NORMS
Parental authority in marriage3............................................................................ 0.0
Parental authority after divorce3.......................................................................... 0.0
Female genital mutilation (% of women aged 15–49).......................................... 0.0
Existence of legislation on domestic violence3..................................................... 0.3
Existence of legislation on gender-based discrimination...................................... Yes
Inheritance rights for daughters3......................................................................... 0.5
Women’s secure access to land use, control and ownership3.............................. 0.0
Women’s access to financial services3................................................................ 0.5
Women’s secure access to non-land assets use, control and ownership3............ 0.0
Year women received right to vote.................................................................... 1932
Quota type (single/lower house).................................... Legislated Candidate Quotas
Voluntary political party quotas............................................................................. No](https://image.slidesharecdn.com/theglobalgendergapreport2015-160119013910/85/The-Global-Gender-Gap-Report-2015-127-320.jpg)

![Index over the years
SAMPLE INDEX ECONOMY EDUCATION HEALTH POLITICS
Year No. of countries Rank Score Rank Score Rank Score Rank Score Rank Score
2015 145 88 0.684 23 0.780 70 0.993 131 0.966 145 0.000
2014 142 98 0.672 36 0.736 88 0.986 126 0.966 142 0.000
2013 136 88 0.673 33 0.737 76 0.989 109 0.966 135 0.000
2012 135 75 0.675 30 0.740 56 0.994 109 0.966 133 0.000
2011 135 76 0.679 20 0.755 52 0.994 108 0.966 132 0.000
2010 134 77 0.675 26 0.740 56 0.993 107 0.966 131 0.000
2009 134 94 0.652 78 0.624 65 0.992 113 0.966 127 0.028
2008 130 99 0.639 91 0.570 62 0.993 109 0.966 122 0.028
2007 128 — — — — — — — — — —
2006 115 — — — — — — — — — —
2006–2015 CHANGE s 0.045 s 0.210 t –0.001 t 0.000 t –0.028
Part 2: Country Profiles
The Global Gender Gap Report 2015 | 121
1 Survey data, responses on a 1-to-7 scale (1 = worst score, 7 = best score)
2 Bracketed numbers show the range between the uncertainties, estimated to contain the true maternal mortality ratio with a 95% probability
3 Data on a 0-to-1 scale (1 = worst score, 0 = best score)
Brunei Darussalam
Selected contextual data
EMPLOYMENT AND LEADERSHIP
Female, male adult unemployment
(as % of female, male labour force)............................................................2.4, 1.3
Female, male part-time employment
(as % of total female, male employment)....................................................—, —
Female, male workers in informal employment
(as % of non-agricultural employment).......................................................—, —
Share of women in wage employment in the non-agricultural sector
(% of total non-agricultural employment).......................................................... 30
Average minutes spent per day on unpaid work (female, male)......................—, —
Percentage of women, men with an account
at a financial institution...............................................................................—, —
Ability of women to rise to positions of leadership1.............................................. —
Firms with female top managers (% of firms)....................................................... —
Share of women on boards of listed companies (%)............................................. —
Firms with female participation in ownership (% of firms).................................... —
Percentage of total R&D personnel (FTE) (female, male).................................—, —
EDUCATION AND TECHNOLOGY
Out-of-school children of primary school age (%) (female, male).....................47, 53
Female, male primary education attainment rate (% aged 25+).....................—, —
Female, male secondary education attainment rate (% aged 25+).................—, —
Female, male tertiary education attainment rate (% aged 25+)......................—, —
Percentage of tertiary-level students enrolled in STEM studies
(female, male)..............................................................................................53, 47
Percentage of tertiary-level graduates in STEM studies (female, male)............53, 47
Percentage of PhD graduates (female, male)...................................................100, 0
Percentage of individuals using the internet (female, male)............................—, —
Percentage of individuals using a
mobile cellular telephone (female, male).....................................................—, —
HEALTH
Cardiovascular disease age-standardized deaths
per 100,000 (female, male)................................................................189.8, 232.8
Cancer age-standardized deaths per 100,000
excl. non-melanoma skin cancer (female, male).....................................80.3, 94.1
Diabetes age-standardized deaths per 100,000 (female, male).................65.9, 59.7
Chronic respiratory disease age-standardized deaths
per 100,000 (female, male)....................................................................36.5, 62.9
HEALTH (cont’d.)
HIV/AIDS age-standardized deaths per 100,000 (female, male).....................0.9, 1.4
Malaria age-standardized deaths per 100,000 (female, male).......................0.0, 0.0
Tuberculosis age-standardized deaths per 100,000 (female, male)................4.1, 7.2
Malnutrition prev., weight for age (female, male) (% of children <5)...............—, —
Maternal mortality ratio (per 100,000 live births)2...................................27 [16–43]
Total fertility rate (children per women)............................................................... 2.0
Adolescent fertility rate (births per 1,000 girls aged 15–19).............................. 16.8
Antenatal care coverage, at least one visit (%)..................................................... 93
Births attended by skilled health personnel (%).................................................. 100
Contraceptive prevalence, any method
(% of married or in-union women aged 15–49)................................................. —
Existence of legislation permitting abortion
to preserve a woman’s physical health.............................................................. No
FAMILY
Singulate mean age (years) at marriage (female, male)...................................25, 28
Early marriage (% of women aged 15–19)........................................................... —
Mean age of women at the birth of the first child................................................. —
Length of paid maternity leave (calendar days)..................................................... 91
Provider of maternity leave benefits............................................................Employer
Percent of wages paid during maternity leave.................................................... 100
Length of paid paternity leave (calendar days)...................................................... —
Provider of paternity leave benefits....................................................................... —
Percent of wages paid during paternity leave....................................................... —
RIGHTS AND NORMS
Parental authority in marriage3............................................................................. —
Parental authority after divorce3........................................................................... —
Female genital mutilation (% of women aged 15–49)........................................... —
Existence of legislation on domestic violence3...................................................... —
Existence of legislation on gender-based discrimination....................................... No
Inheritance rights for daughters3.......................................................................... —
Women’s secure access to land use, control and ownership3............................... —
Women’s access to financial services3................................................................. —
Women’s secure access to non-land assets use, control and ownership3............. —
Year women received right to vote........................................................................ —
Quota type (single/lower house)............................................................................ —
Voluntary political party quotas............................................................................. —](https://image.slidesharecdn.com/theglobalgendergapreport2015-160119013910/85/The-Global-Gender-Gap-Report-2015-129-320.jpg)

![Index over the years
SAMPLE INDEX ECONOMY EDUCATION HEALTH POLITICS
Year No. of countries Rank Score Rank Score Rank Score Rank Score Rank Score
2015 145 43 0.722 55 0.701 72 0.992 42 0.979 48 0.215
2014 142 22 0.744 39 0.729 66 0.993 37 0.979 31 0.276
2013 136 43 0.710 49 0.707 64 0.992 34 0.979 58 0.161
2012 135 52 0.702 50 0.696 64 0.992 34 0.979 67 0.141
2011 135 51 0.699 48 0.687 58 0.992 41 0.979 67 0.137
2010 134 50 0.698 50 0.684 58 0.993 40 0.979 64 0.137
2009 134 38 0.707 40 0.693 66 0.992 41 0.979 42 0.164
2008 130 36 0.708 35 0.698 73 0.990 38 0.979 43 0.164
2007 128 25 0.708 30 0.699 62 0.989 37 0.979 32 0.167
2006 115 37 0.687 58 0.613 56 0.989 36 0.979 30 0.167
2006–2015 CHANGE s 0.035 s 0.088 s 0.003 s 0.000 s 0.048
Part 2: Country Profiles
The Global Gender Gap Report 2015 | 123
1 Survey data, responses on a 1-to-7 scale (1 = worst score, 7 = best score)
2 Bracketed numbers show the range between the uncertainties, estimated to contain the true maternal mortality ratio with a 95% probability
3 Data on a 0-to-1 scale (1 = worst score, 0 = best score)
Bulgaria
Selected contextual data
EMPLOYMENT AND LEADERSHIP
Female, male adult unemployment
(as % of female, male labour force)........................................................11.8, 13.9
Female, male part-time employment
(as % of total female, male employment)...................................................2.7, 2.1
Female, male workers in informal employment
(as % of non-agricultural employment).......................................................—, —
Share of women in wage employment in the non-agricultural sector
(% of total non-agricultural employment).......................................................... 50
Average minutes spent per day on unpaid work (female, male)......................—, —
Percentage of women, men with an account
at a financial institution................................................................................63, 63
Ability of women to rise to positions of leadership1............................................. 4.2
Firms with female top managers (% of firms)....................................................... 24
Share of women on boards of listed companies (%)............................................. 15
Firms with female participation in ownership (% of firms).................................... 39
Percentage of total R&D personnel (FTE) (female, male)..................................53, 47
EDUCATION AND TECHNOLOGY
Out-of-school children of primary school age (%) (female, male).....................48, 52
Female, male primary education attainment rate (% aged 25+)..................100, 100
Female, male secondary education attainment rate (% aged 25+)..................93, 96
Female, male tertiary education attainment rate (% aged 25+).......................26, 19
Percentage of tertiary-level students enrolled in STEM studies
(female, male)..............................................................................................33, 67
Percentage of tertiary-level graduates in STEM studies (female, male)............38, 62
Percentage of PhD graduates (female, male)...................................................52, 48
Percentage of individuals using the internet (female, male).............................52, 54
Percentage of individuals using a
mobile cellular telephone (female, male).....................................................—, —
HEALTH
Cardiovascular disease age-standardized deaths
per 100,000 (female, male)................................................................331.8, 498.6
Cancer age-standardized deaths per 100,000
excl. non-melanoma skin cancer (female, male)...................................99.2, 175.7
Diabetes age-standardized deaths per 100,000 (female, male).................11.5, 14.2
Chronic respiratory disease age-standardized deaths
per 100,000 (female, male)....................................................................20.5, 48.0
HEALTH (cont’d.)
HIV/AIDS age-standardized deaths per 100,000 (female, male).....................1.4, 5.8
Malaria age-standardized deaths per 100,000 (female, male).......................0.0, 0.0
Tuberculosis age-standardized deaths per 100,000 (female, male)................0.7, 2.3
Malnutrition prev., weight for age (female, male) (% of children <5)..............1.9, 1.3
Maternal mortality ratio (per 100,000 live births)2.........................................5 [3–8]
Total fertility rate (children per women)............................................................... 1.5
Adolescent fertility rate (births per 1,000 girls aged 15–19).............................. 42.0
Antenatal care coverage, at least one visit (%)..................................................... —
Births attended by skilled health personnel (%).................................................. 100
Contraceptive prevalence, any method
(% of married or in-union women aged 15–49)................................................. 64
Existence of legislation permitting abortion
to preserve a woman’s physical health............................................................. Yes
FAMILY
Singulate mean age (years) at marriage (female, male)...................................26, 30
Early marriage (% of women aged 15–19)............................................................. 9
Mean age of women at the birth of the first child................................................. 26
Length of paid maternity leave (calendar days)................................................... 410
Provider of maternity leave benefits........................................................Government
Percent of wages paid during maternity leave...................................................... 90
Length of paid paternity leave (calendar days)...................................................... 15
Provider of paternity leave benefits.........................................................Government
Percent of wages paid during paternity leave....................................................... 90
RIGHTS AND NORMS
Parental authority in marriage3............................................................................ 0.0
Parental authority after divorce3.......................................................................... 0.0
Female genital mutilation (% of women aged 15–49).......................................... 0.0
Existence of legislation on domestic violence3..................................................... 0.3
Existence of legislation on gender-based discrimination...................................... Yes
Inheritance rights for daughters3......................................................................... 0.0
Women’s secure access to land use, control and ownership3.............................. 0.0
Women’s access to financial services3................................................................ 0.0
Women’s secure access to non-land assets use, control and ownership3............ 0.0
Year women received right to vote...........................................................1937, 1945
Quota type (single/lower house)............................................................................ —
Voluntary political party quotas............................................................................. —](https://image.slidesharecdn.com/theglobalgendergapreport2015-160119013910/85/The-Global-Gender-Gap-Report-2015-131-320.jpg)

![Index over the years
SAMPLE INDEX ECONOMY EDUCATION HEALTH POLITICS
Year No. of countries Rank Score Rank Score Rank Score Rank Score Rank Score
2015 145 114 0.651 45 0.721 134 0.831 117 0.967 118 0.083
2014 142 110 0.650 43 0.722 133 0.799 110 0.967 92 0.112
2013 136 103 0.651 28 0.747 128 0.799 99 0.968 98 0.091
2012 135 104 0.646 32 0.738 125 0.786 100 0.968 94 0.090
2011 135 115 0.615 76 0.627 129 0.756 98 0.968 77 0.110
2010 134 111 0.616 69 0.638 128 0.748 98 0.968 77 0.110
2009 134 120 0.608 72 0.639 129 0.726 98 0.970 88 0.097
2008 130 115 0.603 67 0.638 125 0.707 93 0.970 82 0.097
2007 128 117 0.591 67 0.631 124 0.680 92 0.970 84 0.084
2006 115 104 0.585 49 0.639 112 0.646 68 0.973 74 0.084
2006–2015 CHANGE s 0.065 s 0.083 s 0.186 t –0.006 t –0.001
Part 2: Country Profiles
The Global Gender Gap Report 2015 | 125
1 Survey data, responses on a 1-to-7 scale (1 = worst score, 7 = best score)
2 Bracketed numbers show the range between the uncertainties, estimated to contain the true maternal mortality ratio with a 95% probability
3 Data on a 0-to-1 scale (1 = worst score, 0 = best score)
Burkina Faso
Selected contextual data
EMPLOYMENT AND LEADERSHIP
Female, male adult unemployment
(as % of female, male labour force)............................................................1.7, 2.9
Female, male part-time employment
(as % of total female, male employment)....................................................—, —
Female, male workers in informal employment
(as % of non-agricultural employment).......................................................—, —
Share of women in wage employment in the non-agricultural sector
(% of total non-agricultural employment).......................................................... 27
Average minutes spent per day on unpaid work (female, male)......................—, —
Percentage of women, men with an account
at a financial institution................................................................................12, 15
Ability of women to rise to positions of leadership1.............................................. —
Firms with female top managers (% of firms)....................................................... 11
Share of women on boards of listed companies (%)............................................. —
Firms with female participation in ownership (% of firms).................................... 19
Percentage of total R&D personnel (FTE) (female, male)..................................26, 74
EDUCATION AND TECHNOLOGY
Out-of-school children of primary school age (%) (female, male).....................51, 49
Female, male primary education attainment rate (% aged 25+)..........................3, 8
Female, male secondary education attainment rate (% aged 25+)......................1, 3
Female, male tertiary education attainment rate (% aged 25+)...........................0, 0
Percentage of tertiary-level students enrolled in STEM studies
(female, male)..............................................................................................15, 85
Percentage of tertiary-level graduates in STEM studies (female, male)............20, 80
Percentage of PhD graduates (female, male)...................................................21, 79
Percentage of individuals using the internet (female, male)............................—, —
Percentage of individuals using a
mobile cellular telephone (female, male).....................................................—, —
HEALTH
Cardiovascular disease age-standardized deaths
per 100,000 (female, male)................................................................355.6, 395.6
Cancer age-standardized deaths per 100,000
excl. non-melanoma skin cancer (female, male).....................................92.4, 95.7
Diabetes age-standardized deaths per 100,000 (female, male).................69.7, 44.7
Chronic respiratory disease age-standardized deaths
per 100,000 (female, male)....................................................................40.5, 60.2
HEALTH (cont’d.)
HIV/AIDS age-standardized deaths per 100,000 (female, male).................39.1, 32.6
Malaria age-standardized deaths per 100,000 (female, male)...................62.2, 64.6
Tuberculosis age-standardized deaths per 100,000 (female, male)............11.7, 18.0
Malnutrition prev., weight for age (female, male) (% of children <5)..........24.7, 27.7
Maternal mortality ratio (per 100,000 live births)2.............................400 [240–680]
Total fertility rate (children per women)............................................................... 5.6
Adolescent fertility rate (births per 1,000 girls aged 15–19)............................ 136.0
Antenatal care coverage, at least one visit (%)..................................................... 95
Births attended by skilled health personnel (%).................................................... 66
Contraceptive prevalence, any method
(% of married or in-union women aged 15–49)................................................. 17
Existence of legislation permitting abortion
to preserve a woman’s physical health............................................................. Yes
FAMILY
Singulate mean age (years) at marriage (female, male)...................................20, 25
Early marriage (% of women aged 15–19)........................................................... 32
Mean age of women at the birth of the first child................................................. —
Length of paid maternity leave (calendar days)..................................................... 98
Provider of maternity leave benefits................................. Employer and Government
Percent of wages paid during maternity leave.................................................... 100
Length of paid paternity leave (calendar days)........................................................ 3
Provider of paternity leave benefits.............................................................Employer
Percent of wages paid during paternity leave..................................................... 100
RIGHTS AND NORMS
Parental authority in marriage3............................................................................ 0.0
Parental authority after divorce3.......................................................................... 0.0
Female genital mutilation (% of women aged 15–49).......................................... 0.8
Existence of legislation on domestic violence3..................................................... 1.0
Existence of legislation on gender-based discrimination....................................... —
Inheritance rights for daughters3......................................................................... 0.5
Women’s secure access to land use, control and ownership3.............................. 0.5
Women’s access to financial services3................................................................ 0.5
Women’s secure access to non-land assets use, control and ownership3............ 0.5
Year women received right to vote.................................................................... 1958
Quota type (single/lower house).................................... Legislated Candidate Quotas
Voluntary political party quotas............................................................................. No](https://image.slidesharecdn.com/theglobalgendergapreport2015-160119013910/85/The-Global-Gender-Gap-Report-2015-133-320.jpg)
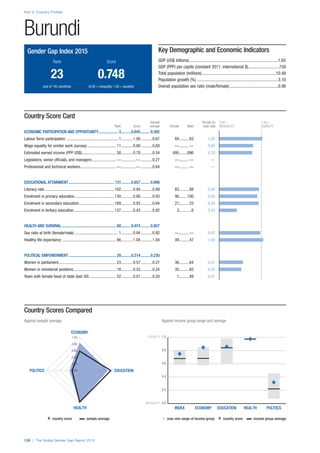
![Index over the years
SAMPLE INDEX ECONOMY EDUCATION HEALTH POLITICS
Year No. of countries Rank Score Rank Score Rank Score Rank Score Rank Score
2015 145 23 0.748 3 0.845 131 0.857 68 0.974 28 0.314
2014 142 17 0.757 1 0.863 120 0.901 1 0.980 30 0.282
2013 136 22 0.740 3 0.831 114 0.890 99 0.968 31 0.270
2012 135 24 0.734 3 0.832 117 0.864 100 0.968 30 0.270
2011 135 24 0.727 4 0.836 119 0.857 98 0.968 32 0.248
2010 134 — — — — — — — — — —
2009 134 — — — — — — — — — —
2008 130 — — — — — — — — — —
2007 128 — — — — — — — — — —
2006 115 — — — — — — — — — —
2006–2015 CHANGE s 0.021 s 0.010 s 0.000 s 0.006 s 0.066
Part 2: Country Profiles
The Global Gender Gap Report 2015 | 127
1 Survey data, responses on a 1-to-7 scale (1 = worst score, 7 = best score)
2 Bracketed numbers show the range between the uncertainties, estimated to contain the true maternal mortality ratio with a 95% probability
3 Data on a 0-to-1 scale (1 = worst score, 0 = best score)
Burundi
Selected contextual data
EMPLOYMENT AND LEADERSHIP
Female, male adult unemployment
(as % of female, male labour force)............................................................0.3, 0.7
Female, male part-time employment
(as % of total female, male employment)....................................................—, —
Female, male workers in informal employment
(as % of non-agricultural employment).......................................................—, —
Share of women in wage employment in the non-agricultural sector
(% of total non-agricultural employment).......................................................... 14
Average minutes spent per day on unpaid work (female, male)......................—, —
Percentage of women, men with an account
at a financial institution....................................................................................7, 7
Ability of women to rise to positions of leadership1............................................. 4.9
Firms with female top managers (% of firms)....................................................... 16
Share of women on boards of listed companies (%)............................................. —
Firms with female participation in ownership (% of firms).................................... 44
Percentage of total R&D personnel (FTE) (female, male).................................—, —
EDUCATION AND TECHNOLOGY
Out-of-school children of primary school age (%) (female, male).....................100, 0
Female, male primary education attainment rate (% aged 25+).....................—, —
Female, male secondary education attainment rate (% aged 25+).................—, —
Female, male tertiary education attainment rate (% aged 25+)......................—, —
Percentage of tertiary-level students enrolled in STEM studies
(female, male)................................................................................................9, 91
Percentage of tertiary-level graduates in STEM studies (female, male)............34, 67
Percentage of PhD graduates (female, male)...................................................21, 79
Percentage of individuals using the internet (female, male)............................—, —
Percentage of individuals using a
mobile cellular telephone (female, male).....................................................—, —
HEALTH
Cardiovascular disease age-standardized deaths
per 100,000 (female, male)................................................................292.1, 329.0
Cancer age-standardized deaths per 100,000
excl. non-melanoma skin cancer (female, male).................................142.4, 130.2
Diabetes age-standardized deaths per 100,000 (female, male).................35.1, 42.8
Chronic respiratory disease age-standardized deaths
per 100,000 (female, male)....................................................................38.8, 52.2
HEALTH (cont’d.)
HIV/AIDS age-standardized deaths per 100,000 (female, male).................69.4, 58.7
Malaria age-standardized deaths per 100,000 (female, male)...................22.8, 24.6
Tuberculosis age-standardized deaths per 100,000 (female, male)............25.6, 51.9
Malnutrition prev., weight for age (female, male) (% of children <5)..........26.1, 32.0
Maternal mortality ratio (per 100,000 live births)2...........................740 [390–1400]
Total fertility rate (children per women)............................................................... 6.0
Adolescent fertility rate (births per 1,000 girls aged 15–19).............................. 65.0
Antenatal care coverage, at least one visit (%)..................................................... 99
Births attended by skilled health personnel (%).................................................... 60
Contraceptive prevalence, any method
(% of married or in-union women aged 15–49)................................................. 22
Existence of legislation permitting abortion
to preserve a woman’s physical health............................................................. Yes
FAMILY
Singulate mean age (years) at marriage (female, male)...................................22, 25
Early marriage (% of women aged 15–19)........................................................... 10
Mean age of women at the birth of the first child................................................. —
Length of paid maternity leave (calendar days)..................................................... 84
Provider of maternity leave benefits................................. Employer and Government
Percent of wages paid during maternity leave.................................................... 100
Length of paid paternity leave (calendar days)........................................................ 4
Provider of paternity leave benefits.............................................................Employer
Percent of wages paid during paternity leave..................................................... 100
RIGHTS AND NORMS
Parental authority in marriage3............................................................................ 0.5
Parental authority after divorce3.......................................................................... 0.0
Female genital mutilation (% of women aged 15–49).......................................... 0.0
Existence of legislation on domestic violence3..................................................... 0.3
Existence of legislation on gender-based discrimination....................................... —
Inheritance rights for daughters3......................................................................... 1.0
Women’s secure access to land use, control and ownership3.............................. 0.5
Women’s access to financial services3................................................................ 0.0
Women’s secure access to non-land assets use, control and ownership3............ 0.5
Year women received right to vote.................................................................... 1961
Quota type (single/lower house).........................................................Reserved seats
Voluntary political party quotas............................................................................. No](https://image.slidesharecdn.com/theglobalgendergapreport2015-160119013910/85/The-Global-Gender-Gap-Report-2015-135-320.jpg)

![Index over the years
SAMPLE INDEX ECONOMY EDUCATION HEALTH POLITICS
Year No. of countries Rank Score Rank Score Rank Score Rank Score Rank Score
2015 145 109 0.662 63 0.681 127 0.891 1 0.980 109 0.098
2014 142 108 0.652 77 0.654 124 0.883 1 0.980 110 0.091
2013 136 104 0.651 77 0.651 117 0.881 1 0.980 96 0.092
2012 135 103 0.646 78 0.640 116 0.871 1 0.980 91 0.092
2011 135 102 0.646 75 0.632 116 0.865 1 0.980 78 0.109
2010 134 97 0.648 68 0.638 115 0.866 1 0.980 78 0.110
2009 134 104 0.641 65 0.649 117 0.857 1 0.980 98 0.079
2008 130 94 0.647 56 0.659 114 0.856 1 0.980 87 0.093
2007 128 98 0.635 52 0.664 112 0.845 1 0.980 105 0.053
2006 115 89 0.629 29 0.675 105 0.809 1 0.980 94 0.053
2006–2015 CHANGE s 0.033 s 0.005 s 0.082 s 0.000 s 0.045
Part 2: Country Profiles
The Global Gender Gap Report 2015 | 129
1 Survey data, responses on a 1-to-7 scale (1 = worst score, 7 = best score)
2 Bracketed numbers show the range between the uncertainties, estimated to contain the true maternal mortality ratio with a 95% probability
3 Data on a 0-to-1 scale (1 = worst score, 0 = best score)
Cambodia
Selected contextual data
EMPLOYMENT AND LEADERSHIP
Female, male adult unemployment
(as % of female, male labour force)............................................................0.3, 0.3
Female, male part-time employment
(as % of total female, male employment)....................................................—, —
Female, male workers in informal employment
(as % of non-agricultural employment).......................................................—, —
Share of women in wage employment in the non-agricultural sector
(% of total non-agricultural employment).......................................................... 41
Average minutes spent per day on unpaid work (female, male)......................—, —
Percentage of women, men with an account
at a financial institution................................................................................11, 15
Ability of women to rise to positions of leadership1............................................. 4.6
Firms with female top managers (% of firms)....................................................... —
Share of women on boards of listed companies (%)............................................. —
Firms with female participation in ownership (% of firms).................................... —
Percentage of total R&D personnel (FTE) (female, male)..................................23, 77
EDUCATION AND TECHNOLOGY
Out-of-school children of primary school age (%) (female, male).....................90, 10
Female, male primary education attainment rate (% aged 25+)......................25, 48
Female, male secondary education attainment rate (% aged 25+)..................10, 22
Female, male tertiary education attainment rate (% aged 25+)...........................0, 0
Percentage of tertiary-level students enrolled in STEM studies
(female, male)..............................................................................................13, 87
Percentage of tertiary-level graduates in STEM studies (female, male)............10, 90
Percentage of PhD graduates (female, male)...................................................30, 70
Percentage of individuals using the internet (female, male)............................—, —
Percentage of individuals using a
mobile cellular telephone (female, male).....................................................—, —
HEALTH
Cardiovascular disease age-standardized deaths
per 100,000 (female, male)................................................................170.4, 202.5
Cancer age-standardized deaths per 100,000
excl. non-melanoma skin cancer (female, male)...................................92.7, 111.7
Diabetes age-standardized deaths per 100,000 (female, male).................15.6, 11.9
Chronic respiratory disease age-standardized deaths
per 100,000 (female, male).......................................................................29.1, 40
HEALTH (cont’d.)
HIV/AIDS age-standardized deaths per 100,000 (female, male).................18.5, 21.7
Malaria age-standardized deaths per 100,000 (female, male).......................1.6, 2.0
Tuberculosis age-standardized deaths per 100,000 (female, male)............56.4, 94.8
Malnutrition prev., weight for age (female, male) (% of children <5)..........29.1, 28.8
Maternal mortality ratio (per 100,000 live births)2.............................170 [110–280]
Total fertility rate (children per women)............................................................... 2.9
Adolescent fertility rate (births per 1,000 girls aged 15–19).............................. 30.0
Antenatal care coverage, at least one visit (%)..................................................... 89
Births attended by skilled health personnel (%).................................................... 71
Contraceptive prevalence, any method
(% of married or in-union women aged 15–49)................................................. 56
Existence of legislation permitting abortion
to preserve a woman’s physical health............................................................. Yes
FAMILY
Singulate mean age (years) at marriage (female, male)...................................22, 25
Early marriage (% of women aged 15–19)........................................................... 11
Mean age of women at the birth of the first child................................................. —
Length of paid maternity leave (calendar days)..................................................... 90
Provider of maternity leave benefits............................................................Employer
Percent of wages paid during maternity leave...................................................... 50
Length of paid paternity leave (calendar days)...................................................... —
Provider of paternity leave benefits....................................................................... —
Percent of wages paid during paternity leave....................................................... —
RIGHTS AND NORMS
Parental authority in marriage3............................................................................ 0.0
Parental authority after divorce3.......................................................................... 0.0
Female genital mutilation (% of women aged 15–49).......................................... 0.0
Existence of legislation on domestic violence3..................................................... 0.3
Existence of legislation on gender-based discrimination....................................... —
Inheritance rights for daughters3......................................................................... 0.0
Women’s secure access to land use, control and ownership3.............................. 0.0
Women’s access to financial services3................................................................ 0.0
Women’s secure access to non-land assets use, control and ownership3............ 0.5
Year women received right to vote.................................................................... 1955
Quota type (single/lower house)............................................................................ —
Voluntary political party quotas............................................................................. —](https://image.slidesharecdn.com/theglobalgendergapreport2015-160119013910/85/The-Global-Gender-Gap-Report-2015-137-320.jpg)

![Index over the years
SAMPLE INDEX ECONOMY EDUCATION HEALTH POLITICS
Year No. of countries Rank Score Rank Score Rank Score Rank Score Rank Score
2015 145 90 0.682 44 0.724 130 0.857 115 0.968 63 0.180
2014 142 — — — — — — — — — —
2013 136 100 0.656 40 0.726 122 0.847 112 0.961 99 0.090
2012 135 112 0.629 52 0.683 126 0.782 111 0.961 92 0.090
2011 135 119 0.607 112 0.525 118 0.860 111 0.961 96 0.083
2010 134 114 0.611 105 0.541 117 0.859 110 0.961 93 0.083
2009 134 118 0.611 107 0.550 122 0.842 106 0.969 95 0.083
2008 130 117 0.602 104 0.521 119 0.834 101 0.969 97 0.083
2007 128 116 0.592 107 0.511 115 0.826 100 0.969 97 0.061
2006 115 103 0.587 94 0.495 101 0.824 97 0.966 85 0.061
2006–2015 CHANGE s 0.096 s 0.229 s 0.033 s 0.002 s 0.119
Part 2: Country Profiles
The Global Gender Gap Report 2015 | 131
1 Survey data, responses on a 1-to-7 scale (1 = worst score, 7 = best score)
2 Bracketed numbers show the range between the uncertainties, estimated to contain the true maternal mortality ratio with a 95% probability
3 Data on a 0-to-1 scale (1 = worst score, 0 = best score)
Cameroon
Selected contextual data
EMPLOYMENT AND LEADERSHIP
Female, male adult unemployment
(as % of female, male labour force)............................................................4.5, 3.1
Female, male part-time employment
(as % of total female, male employment)....................................................—, —
Female, male workers in informal employment
(as % of non-agricultural employment).......................................................—, —
Share of women in wage employment in the non-agricultural sector
(% of total non-agricultural employment).......................................................... 26
Average minutes spent per day on unpaid work (female, male)......................—, —
Percentage of women, men with an account
at a financial institution..................................................................................9, 14
Ability of women to rise to positions of leadership1............................................. 4.1
Firms with female top managers (% of firms)....................................................... 10
Share of women on boards of listed companies (%)............................................. —
Firms with female participation in ownership (% of firms).................................... 16
Percentage of total R&D personnel (FTE) (female, male).................................—, —
EDUCATION AND TECHNOLOGY
Out-of-school children of primary school age (%) (female, male).......................96, 4
Female, male primary education attainment rate (% aged 25+).....................—, —
Female, male secondary education attainment rate (% aged 25+).................—, —
Female, male tertiary education attainment rate (% aged 25+)......................—, —
Percentage of tertiary-level students enrolled in STEM studies
(female, male)..............................................................................................28, 72
Percentage of tertiary-level graduates in STEM studies (female, male)...........—, —
Percentage of PhD graduates (female, male)..................................................—, —
Percentage of individuals using the internet (female, male)............................—, —
Percentage of individuals using a
mobile cellular telephone (female, male).....................................................—, —
HEALTH
Cardiovascular disease age-standardized deaths
per 100,000 (female, male)................................................................284.8, 283.9
Cancer age-standardized deaths per 100,000
excl. non-melanoma skin cancer (female, male).....................................73.9, 75.2
Diabetes age-standardized deaths per 100,000 (female, male).................55.5, 48.1
Chronic respiratory disease age-standardized deaths
per 100,000 (female, male)....................................................................29.9, 46.8
HEALTH (cont’d.)
HIV/AIDS age-standardized deaths per 100,000 (female, male).............221.8, 191.3
Malaria age-standardized deaths per 100,000 (female, male)...................40.5, 42.7
Tuberculosis age-standardized deaths per 100,000 (female, male)............34.6, 65.7
Malnutrition prev., weight for age (female, male) (% of children <5)..........14.5, 15.8
Maternal mortality ratio (per 100,000 live births)2...........................590 [350–1000]
Total fertility rate (children per women)............................................................... 4.8
Adolescent fertility rate (births per 1,000 girls aged 15–19)............................ 128.0
Antenatal care coverage, at least one visit (%)..................................................... 85
Births attended by skilled health personnel (%).................................................... 64
Contraceptive prevalence, any method
(% of married or in-union women aged 15–49)................................................. 23
Existence of legislation permitting abortion
to preserve a woman’s physical health............................................................. Yes
FAMILY
Singulate mean age (years) at marriage (female, male)...................................21, 27
Early marriage (% of women aged 15–19)........................................................... 26
Mean age of women at the birth of the first child................................................. —
Length of paid maternity leave (calendar days)..................................................... 98
Provider of maternity leave benefits........................................................Government
Percent of wages paid during maternity leave.................................................... 100
Length of paid paternity leave (calendar days)........................................................ 3
Provider of paternity leave benefits.............................................................Employer
Percent of wages paid during paternity leave..................................................... 100
RIGHTS AND NORMS
Parental authority in marriage3............................................................................ 0.0
Parental authority after divorce3........................................................................... —
Female genital mutilation (% of women aged 15–49).......................................... 0.0
Existence of legislation on domestic violence3..................................................... 1.0
Existence of legislation on gender-based discrimination....................................... —
Inheritance rights for daughters3......................................................................... 0.5
Women’s secure access to land use, control and ownership3.............................. 0.5
Women’s access to financial services3................................................................ 0.5
Women’s secure access to non-land assets use, control and ownership3............ 1.0
Year women received right to vote.................................................................... 1946
Quota type (single/lower house)............................................................................ —
Voluntary political party quotas............................................................................. —](https://image.slidesharecdn.com/theglobalgendergapreport2015-160119013910/85/The-Global-Gender-Gap-Report-2015-139-320.jpg)

![Index over the years
SAMPLE INDEX ECONOMY EDUCATION HEALTH POLITICS
Year No. of countries Rank Score Rank Score Rank Score Rank Score Rank Score
2015 145 30 0.740 28 0.773 1 1.000 109 0.969 46 0.218
2014 142 19 0.746 17 0.793 1 1.000 100 0.969 42 0.223
2013 136 20 0.742 9 0.796 1 1.000 49 0.978 42 0.196
2012 135 21 0.738 12 0.788 70 0.991 52 0.978 38 0.196
2011 135 18 0.741 10 0.776 31 0.999 49 0.978 36 0.210
2010 134 20 0.737 8 0.777 35 0.998 47 0.978 36 0.196
2009 134 25 0.720 10 0.764 38 0.998 60 0.978 62 0.138
2008 130 31 0.714 15 0.744 37 0.998 57 0.978 60 0.134
2007 128 18 0.720 13 0.743 26 0.999 51 0.979 36 0.159
2006 115 14 0.716 10 0.730 21 0.999 51 0.978 33 0.159
2006–2015 CHANGE s 0.024 s 0.043 s 0.001 t –0.009 s 0.059
Part 2: Country Profiles
The Global Gender Gap Report 2015 | 133
1 Survey data, responses on a 1-to-7 scale (1 = worst score, 7 = best score)
2 Bracketed numbers show the range between the uncertainties, estimated to contain the true maternal mortality ratio with a 95% probability
3 Data on a 0-to-1 scale (1 = worst score, 0 = best score)
Canada
Selected contextual data
EMPLOYMENT AND LEADERSHIP
Female, male adult unemployment
(as % of female, male labour force)............................................................6.8, 7.7
Female, male part-time employment
(as % of total female, male employment)...............................................26.5, 11.8
Female, male workers in informal employment
(as % of non-agricultural employment).......................................................—, —
Share of women in wage employment in the non-agricultural sector
(% of total non-agricultural employment).......................................................... 50
Average minutes spent per day on unpaid work (female, male)...................254, 160
Percentage of women, men with an account
at a financial institution................................................................................99, 99
Ability of women to rise to positions of leadership1............................................. 4.9
Firms with female top managers (% of firms)....................................................... —
Share of women on boards of listed companies (%)............................................... 6
Firms with female participation in ownership (% of firms).................................... —
Percentage of total R&D personnel (FTE) (female, male).................................—, —
EDUCATION AND TECHNOLOGY
Out-of-school children of primary school age (%) (female, male).....................22, 78
Female, male primary education attainment rate (% aged 25+)..................100, 100
Female, male secondary education attainment rate (% aged 25+)..............100, 100
Female, male tertiary education attainment rate (% aged 25+).......................51, 45
Percentage of tertiary-level students enrolled in STEM studies
(female, male)..............................................................................................29, 71
Percentage of tertiary-level graduates in STEM studies (female, male)............32, 68
Percentage of PhD graduates (female, male)...................................................44, 56
Percentage of individuals using the internet (female, male).............................79, 82
Percentage of individuals using a
mobile cellular telephone (female, male).....................................................—, —
HEALTH
Cardiovascular disease age-standardized deaths
per 100,000 (female, male)..................................................................68.1, 112.2
Cancer age-standardized deaths per 100,000
excl. non-melanoma skin cancer (female, male).................................104.0, 138.9
Diabetes age-standardized deaths per 100,000 (female, male)...................7.5, 12.3
Chronic respiratory disease age-standardized deaths
per 100,000 (female, male)....................................................................18.6, 28.0
HEALTH (cont’d.)
HIV/AIDS age-standardized deaths per 100,000 (female, male).....................0.4, 1.3
Malaria age-standardized deaths per 100,000 (female, male).......................0.0, 0.0
Tuberculosis age-standardized deaths per 100,000 (female, male)................0.1, 0.2
Malnutrition prev., weight for age (female, male) (% of children <5)..............1.7, 1.8
Maternal mortality ratio (per 100,000 live births)2.....................................11 [7–18]
Total fertility rate (children per women)............................................................... 1.7
Adolescent fertility rate (births per 1,000 girls aged 15–19).............................. 14.2
Antenatal care coverage, at least one visit (%)................................................... 100
Births attended by skilled health personnel (%).................................................... 98
Contraceptive prevalence, any method
(% of married or in-union women aged 15–49)................................................. 74
Existence of legislation permitting abortion
to preserve a woman’s physical health............................................................. Yes
FAMILY
Singulate mean age (years) at marriage (female, male)...................................27, 29
Early marriage (% of women aged 15–19)............................................................. 3
Mean age of women at the birth of the first child................................................. 28
Length of paid maternity leave (calendar days)................................................... 105
Provider of maternity leave benefits........................................................Government
Percent of wages paid during maternity leave...................................................... 34
Length of paid paternity leave (calendar days)...................................................... —
Provider of paternity leave benefits....................................................................... —
Percent of wages paid during paternity leave....................................................... —
RIGHTS AND NORMS
Parental authority in marriage3............................................................................ 0.0
Parental authority after divorce3.......................................................................... 0.0
Female genital mutilation (% of women aged 15–49).......................................... 0.0
Existence of legislation on domestic violence3..................................................... 0.0
Existence of legislation on gender-based discrimination...................................... Yes
Inheritance rights for daughters3......................................................................... 0.0
Women’s secure access to land use, control and ownership3.............................. 0.0
Women’s access to financial services3................................................................ 0.0
Women’s secure access to non-land assets use, control and ownership3............ 0.0
Year women received right to vote...........................................................1917, 1960
Quota type (single/lower house)............................................................................ —
Voluntary political party quotas............................................................................. No](https://image.slidesharecdn.com/theglobalgendergapreport2015-160119013910/85/The-Global-Gender-Gap-Report-2015-141-320.jpg)
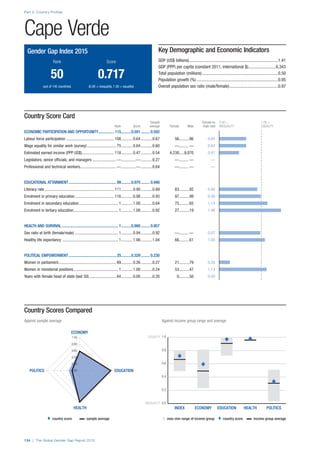
![Index over the years
SAMPLE INDEX ECONOMY EDUCATION HEALTH POLITICS
Year No. of countries Rank Score Rank Score Rank Score Rank Score Rank Score
2015 145 50 0.717 115 0.591 99 0.970 1 0.980 25 0.329
2014 142 50 0.713 107 0.608 102 0.965 1 0.980 26 0.301
2013 136 41 0.712 96 0.602 97 0.966 1 0.980 25 0.301
2012 135 35 0.718 84 0.623 97 0.968 1 0.980 25 0.301
2011 135 — — — — — — — — — —
2010 134 — — — — — — — — — —
2009 134 — — — — — — — — — —
2008 130 — — — — — — — — — —
2007 128 — — — — — — — — — —
2006 115 — — — — — — — — — —
2006–2015 CHANGE t –0.001 t –0.032 s 0.002 t 0.000 s 0.028
Part 2: Country Profiles
The Global Gender Gap Report 2015 | 135
1 Survey data, responses on a 1-to-7 scale (1 = worst score, 7 = best score)
2 Bracketed numbers show the range between the uncertainties, estimated to contain the true maternal mortality ratio with a 95% probability
3 Data on a 0-to-1 scale (1 = worst score, 0 = best score)
Cape Verde
Selected contextual data
EMPLOYMENT AND LEADERSHIP
Female, male adult unemployment
(as % of female, male labour force)........................................................22.6, 23.3
Female, male part-time employment
(as % of total female, male employment)....................................................—, —
Female, male workers in informal employment
(as % of non-agricultural employment).......................................................—, —
Share of women in wage employment in the non-agricultural sector
(% of total non-agricultural employment).......................................................... 39
Average minutes spent per day on unpaid work (female, male)......................—, —
Percentage of women, men with an account
at a financial institution...............................................................................—, —
Ability of women to rise to positions of leadership1............................................. 4.4
Firms with female top managers (% of firms)....................................................... 17
Share of women on boards of listed companies (%)............................................. —
Firms with female participation in ownership (% of firms).................................... 33
Percentage of total R&D personnel (FTE) (female, male)..................................43, 57
EDUCATION AND TECHNOLOGY
Out-of-school children of primary school age (%) (female, male).....................83, 17
Female, male primary education attainment rate (% aged 25+).....................—, —
Female, male secondary education attainment rate (% aged 25+).................—, —
Female, male tertiary education attainment rate (% aged 25+)......................—, —
Percentage of tertiary-level students enrolled in STEM studies
(female, male)..............................................................................................37, 63
Percentage of tertiary-level graduates in STEM studies (female, male)...........—, —
Percentage of PhD graduates (female, male)..................................................—, —
Percentage of individuals using the internet (female, male)............................—, —
Percentage of individuals using a
mobile cellular telephone (female, male).....................................................—, —
HEALTH
Cardiovascular disease age-standardized deaths
per 100,000 (female, male)................................................................195.2, 330.4
Cancer age-standardized deaths per 100,000
excl. non-melanoma skin cancer (female, male).....................................62.0, 68.2
Diabetes age-standardized deaths per 100,000 (female, male).................19.9, 26.8
Chronic respiratory disease age-standardized deaths
per 100,000 (female, male)....................................................................26.3, 85.9
HEALTH (cont’d.)
HIV/AIDS age-standardized deaths per 100,000 (female, male).....................3.0, 3.6
Malaria age-standardized deaths per 100,000 (female, male).......................0.1, 0.1
Tuberculosis age-standardized deaths per 100,000 (female, male)............11.8, 51.0
Malnutrition prev., weight for age (female, male) (% of children <5)...............—, —
Maternal mortality ratio (per 100,000 live births)2.................................53 [25–110]
Total fertility rate (children per women)............................................................... 2.3
Adolescent fertility rate (births per 1,000 girls aged 15–19).............................. 92.0
Antenatal care coverage, at least one visit (%)..................................................... 91
Births attended by skilled health personnel (%).................................................... 99
Contraceptive prevalence, any method
(% of married or in-union women aged 15–49)................................................. 61
Existence of legislation permitting abortion
to preserve a woman’s physical health............................................................. Yes
FAMILY
Singulate mean age (years) at marriage (female, male)...................................23, 28
Early marriage (% of women aged 15–19)........................................................... —
Mean age of women at the birth of the first child................................................. —
Length of paid maternity leave (calendar days)..................................................... —
Provider of maternity leave benefits...................................................................... —
Percent of wages paid during maternity leave...................................................... —
Length of paid paternity leave (calendar days)...................................................... —
Provider of paternity leave benefits....................................................................... —
Percent of wages paid during paternity leave....................................................... —
RIGHTS AND NORMS
Parental authority in marriage3............................................................................. —
Parental authority after divorce3........................................................................... —
Female genital mutilation (% of women aged 15–49)........................................... —
Existence of legislation on domestic violence3...................................................... —
Existence of legislation on gender-based discrimination....................................... —
Inheritance rights for daughters3.......................................................................... —
Women’s secure access to land use, control and ownership3............................... —
Women’s access to financial services3................................................................. —
Women’s secure access to non-land assets use, control and ownership3............. —
Year women received right to vote.................................................................... 1975
Quota type (single/lower house).................................... Legislated Candidate Quotas
Voluntary political party quotas............................................................................. —](https://image.slidesharecdn.com/theglobalgendergapreport2015-160119013910/85/The-Global-Gender-Gap-Report-2015-143-320.jpg)

![Index over the years
SAMPLE INDEX ECONOMY EDUCATION HEALTH POLITICS
Year No. of countries Rank Score Rank Score Rank Score Rank Score Rank Score
2015 145 142 0.580 77 0.666 145 0.591 112 0.968 112 0.093
2014 142 140 0.576 70 0.664 142 0.574 103 0.968 106 0.098
2013 136 134 0.559 75 0.655 135 0.531 112 0.961 102 0.088
2012 135 133 0.559 56 0.677 135 0.520 111 0.961 102 0.080
2011 135 134 0.533 98 0.593 135 0.516 111 0.961 107 0.064
2010 134 133 0.533 77 0.627 134 0.509 110 0.961 122 0.035
2009 134 133 0.542 66 0.647 134 0.474 65 0.976 106 0.068
2008 130 129 0.529 81 0.603 130 0.468 62 0.976 105 0.068
2007 128 127 0.538 58 0.652 128 0.470 60 0.976 102 0.054
2006 115 113 0.525 65 0.601 115 0.468 56 0.976 91 0.054
2006–2015 CHANGE s 0.055 s 0.065 s 0.123 t –0.008 s 0.040
Part 2: Country Profiles
The Global Gender Gap Report 2015 | 137
1 Survey data, responses on a 1-to-7 scale (1 = worst score, 7 = best score)
2 Bracketed numbers show the range between the uncertainties, estimated to contain the true maternal mortality ratio with a 95% probability
3 Data on a 0-to-1 scale (1 = worst score, 0 = best score)
Chad
Selected contextual data
EMPLOYMENT AND LEADERSHIP
Female, male adult unemployment
(as % of female, male labour force)............................................................0.3, 1.1
Female, male part-time employment
(as % of total female, male employment)....................................................—, —
Female, male workers in informal employment
(as % of non-agricultural employment).......................................................—, —
Share of women in wage employment in the non-agricultural sector
(% of total non-agricultural employment)............................................................ 6
Average minutes spent per day on unpaid work (female, male)......................—, —
Percentage of women, men with an account
at a financial institution..................................................................................4, 12
Ability of women to rise to positions of leadership1............................................. 3.4
Firms with female top managers (% of firms)......................................................... 7
Share of women on boards of listed companies (%)............................................. —
Firms with female participation in ownership (% of firms).................................... 40
Percentage of total R&D personnel (FTE) (female, male).................................—, —
EDUCATION AND TECHNOLOGY
Out-of-school children of primary school age (%) (female, male).....................87, 13
Female, male primary education attainment rate (% aged 25+)........................3, 14
Female, male secondary education attainment rate (% aged 25+)....................2, 10
Female, male tertiary education attainment rate (% aged 25+)...........................1, 6
Percentage of tertiary-level students enrolled in STEM studies
(female, male).............................................................................................—, —
Percentage of tertiary-level graduates in STEM studies (female, male)...........—, —
Percentage of PhD graduates (female, male)..................................................—, —
Percentage of individuals using the internet (female, male)............................—, —
Percentage of individuals using a
mobile cellular telephone (female, male).....................................................—, —
HEALTH
Cardiovascular disease age-standardized deaths
per 100,000 (female, male)................................................................300.4, 310.2
Cancer age-standardized deaths per 100,000
excl. non-melanoma skin cancer (female, male).....................................88.6, 90.5
Diabetes age-standardized deaths per 100,000 (female, male).................43.7, 45.6
Chronic respiratory disease age-standardized deaths
per 100,000 (female, male)....................................................................48.4, 54.0
HEALTH (cont’d.)
HIV/AIDS age-standardized deaths per 100,000 (female, male).............165.2, 145.9
Malaria age-standardized deaths per 100,000 (female, male)...................76.3, 74.4
Tuberculosis age-standardized deaths per 100,000 (female, male)............19.2, 42.2
Malnutrition prev., weight for age (female, male) (% of children <5)..........28.2, 32.5
Maternal mortality ratio (per 100,000 live births)2...........................980 [550–1800]
Total fertility rate (children per women)............................................................... 6.3
Adolescent fertility rate (births per 1,000 girls aged 15–19)............................ 203.4
Antenatal care coverage, at least one visit (%)..................................................... 43
Births attended by skilled health personnel (%).................................................... 14
Contraceptive prevalence, any method
(% of married or in-union women aged 15–49)................................................... 5
Existence of legislation permitting abortion
to preserve a woman’s physical health............................................................. Yes
FAMILY
Singulate mean age (years) at marriage (female, male)...................................18, 25
Early marriage (% of women aged 15–19)........................................................... 45
Mean age of women at the birth of the first child................................................. —
Length of paid maternity leave (calendar days)..................................................... 98
Provider of maternity leave benefits........................................................Government
Percent of wages paid during maternity leave...................................................... 50
Length of paid paternity leave (calendar days)........................................................ 1
Provider of paternity leave benefits.............................................................Employer
Percent of wages paid during paternity leave..................................................... 100
RIGHTS AND NORMS
Parental authority in marriage3............................................................................ 1.0
Parental authority after divorce3.......................................................................... 1.0
Female genital mutilation (% of women aged 15–49).......................................... 0.4
Existence of legislation on domestic violence3..................................................... 1.0
Existence of legislation on gender-based discrimination....................................... —
Inheritance rights for daughters3......................................................................... 1.0
Women’s secure access to land use, control and ownership3.............................. 0.5
Women’s access to financial services3................................................................ 0.5
Women’s secure access to non-land assets use, control and ownership3............ 0.5
Year women received right to vote.................................................................... 1958
Quota type (single/lower house)............................................................................ —
Voluntary political party quotas............................................................................. —](https://image.slidesharecdn.com/theglobalgendergapreport2015-160119013910/85/The-Global-Gender-Gap-Report-2015-145-320.jpg)

![Index over the years
SAMPLE INDEX ECONOMY EDUCATION HEALTH POLITICS
Year No. of countries Rank Score Rank Score Rank Score Rank Score Rank Score
2015 145 73 0.698 123 0.570 36 1.000 41 0.979 42 0.243
2014 142 66 0.698 119 0.552 30 1.000 36 0.979 35 0.259
2013 136 91 0.667 112 0.545 32 0.999 1 0.980 67 0.145
2012 135 87 0.668 110 0.547 32 0.999 1 0.980 64 0.145
2011 135 46 0.703 106 0.541 40 0.996 1 0.980 22 0.296
2010 134 48 0.701 108 0.534 42 0.996 1 0.980 21 0.296
2009 134 64 0.688 112 0.521 44 0.996 1 0.980 26 0.257
2008 130 65 0.682 106 0.515 81 0.986 1 0.980 26 0.247
2007 128 86 0.648 105 0.517 78 0.980 1 0.980 58 0.116
2006 115 78 0.645 90 0.514 69 0.980 1 0.980 56 0.109
2006–2015 CHANGE s 0.052 s 0.056 s 0.020 t 0.000 s 0.134
Part 2: Country Profiles
The Global Gender Gap Report 2015 | 139
1 Survey data, responses on a 1-to-7 scale (1 = worst score, 7 = best score)
2 Bracketed numbers show the range between the uncertainties, estimated to contain the true maternal mortality ratio with a 95% probability
3 Data on a 0-to-1 scale (1 = worst score, 0 = best score)
Chile
Selected contextual data
EMPLOYMENT AND LEADERSHIP
Female, male adult unemployment
(as % of female, male labour force)............................................................7.9, 5.4
Female, male part-time employment
(as % of total female, male employment)...............................................24.6, 11.3
Female, male workers in informal employment
(as % of non-agricultural employment).......................................................—, —
Share of women in wage employment in the non-agricultural sector
(% of total non-agricultural employment).......................................................... 39
Average minutes spent per day on unpaid work (female, male)......................—, —
Percentage of women, men with an account
at a financial institution................................................................................59, 68
Ability of women to rise to positions of leadership1............................................. 3.6
Firms with female top managers (% of firms)......................................................... 5
Share of women on boards of listed companies (%)............................................... 5
Firms with female participation in ownership (% of firms).................................... 30
Percentage of total R&D personnel (FTE) (female, male)..................................37, 63
EDUCATION AND TECHNOLOGY
Out-of-school children of primary school age (%) (female, male).....................49, 51
Female, male primary education attainment rate (% aged 25+)......................79, 82
Female, male secondary education attainment rate (% aged 25+)..................71, 75
Female, male tertiary education attainment rate (% aged 25+).......................15, 16
Percentage of tertiary-level students enrolled in STEM studies
(female, male)..............................................................................................20, 80
Percentage of tertiary-level graduates in STEM studies (female, male)............19, 81
Percentage of PhD graduates (female, male)...................................................39, 61
Percentage of individuals using the internet (female, male).............................37, 41
Percentage of individuals using a
mobile cellular telephone (female, male)......................................................60, 65
HEALTH
Cardiovascular disease age-standardized deaths
per 100,000 (female, male)..................................................................90.4, 145.2
Cancer age-standardized deaths per 100,000
excl. non-melanoma skin cancer (female, male)...................................99.0, 139.3
Diabetes age-standardized deaths per 100,000 (female, male).................12.5, 18.3
Chronic respiratory disease age-standardized deaths
per 100,000 (female, male)....................................................................19.8, 34.5
HEALTH (cont’d.)
HIV/AIDS age-standardized deaths per 100,000 (female, male).....................0.9, 3.7
Malaria age-standardized deaths per 100,000 (female, male).......................0.0, 0.0
Tuberculosis age-standardized deaths per 100,000 (female, male)................1.1, 2.6
Malnutrition prev., weight for age (female, male) (% of children <5)..............0.4, 0.6
Maternal mortality ratio (per 100,000 live births)2...................................22 [14–35]
Total fertility rate (children per women)............................................................... 1.8
Adolescent fertility rate (births per 1,000 girls aged 15–19).............................. 51.9
Antenatal care coverage, at least one visit (%)..................................................... —
Births attended by skilled health personnel (%).................................................. 100
Contraceptive prevalence, any method
(% of married or in-union women aged 15–49)................................................. 64
Existence of legislation permitting abortion
to preserve a woman’s physical health.............................................................. No
FAMILY
Singulate mean age (years) at marriage (female, male)...................................27, 29
Early marriage (% of women aged 15–19)............................................................. 6
Mean age of women at the birth of the first child................................................. 24
Length of paid maternity leave (calendar days)................................................... 126
Provider of maternity leave benefits........................................................Government
Percent of wages paid during maternity leave.................................................... 100
Length of paid paternity leave (calendar days)........................................................ 5
Provider of paternity leave benefits.............................................................Employer
Percent of wages paid during paternity leave..................................................... 100
RIGHTS AND NORMS
Parental authority in marriage3............................................................................ 1.0
Parental authority after divorce3.......................................................................... 1.0
Female genital mutilation (% of women aged 15–49).......................................... 0.0
Existence of legislation on domestic violence3..................................................... 0.0
Existence of legislation on gender-based discrimination...................................... Yes
Inheritance rights for daughters3......................................................................... 0.5
Women’s secure access to land use, control and ownership3.............................. 0.0
Women’s access to financial services3................................................................ 0.0
Women’s secure access to non-land assets use, control and ownership3............ 0.0
Year women received right to vote.................................................................... 1949
Quota type (single/lower house)............................................................................ —
Voluntary political party quotas............................................................................. —](https://image.slidesharecdn.com/theglobalgendergapreport2015-160119013910/85/The-Global-Gender-Gap-Report-2015-147-320.jpg)

![Index over the years
SAMPLE INDEX ECONOMY EDUCATION HEALTH POLITICS
Year No. of countries Rank Score Rank Score Rank Score Rank Score Rank Score
2015 145 91 0.682 81 0.657 83 0.988 145 0.919 73 0.162
2014 142 87 0.683 76 0.656 89 0.986 140 0.940 72 0.151
2013 136 69 0.691 62 0.675 81 0.988 133 0.940 59 0.160
2012 135 69 0.685 58 0.675 85 0.982 132 0.934 58 0.150
2011 135 61 0.687 50 0.683 85 0.981 133 0.933 57 0.150
2010 134 61 0.688 46 0.693 88 0.981 133 0.929 56 0.150
2009 134 60 0.691 38 0.696 87 0.980 130 0.947 60 0.141
2008 130 57 0.688 43 0.692 87 0.978 126 0.941 54 0.141
2007 128 73 0.664 60 0.648 91 0.957 124 0.941 59 0.111
2006 115 63 0.656 53 0.621 78 0.957 114 0.936 52 0.111
2006–2015 CHANGE s 0.025 s 0.037 s 0.031 t –0.017 s 0.051
Part 2: Country Profiles
The Global Gender Gap Report 2015 | 141
1 Survey data, responses on a 1-to-7 scale (1 = worst score, 7 = best score)
2 Bracketed numbers show the range between the uncertainties, estimated to contain the true maternal mortality ratio with a 95% probability
3 Data on a 0-to-1 scale (1 = worst score, 0 = best score)
China
Selected contextual data
EMPLOYMENT AND LEADERSHIP
Female, male adult unemployment
(as % of female, male labour force)............................................................3.2, 2.6
Female, male part-time employment
(as % of total female, male employment)....................................................—, —
Female, male workers in informal employment
(as % of non-agricultural employment).......................................................—, —
Share of women in wage employment in the non-agricultural sector
(% of total non-agricultural employment).......................................................... 39
Average minutes spent per day on unpaid work (female, male).....................234, 91
Percentage of women, men with an account
at a financial institution................................................................................76, 81
Ability of women to rise to positions of leadership1............................................. 4.5
Firms with female top managers (% of firms)....................................................... 18
Share of women on boards of listed companies (%)............................................. —
Firms with female participation in ownership (% of firms).................................... 64
Percentage of total R&D personnel (FTE) (female, male).................................—, —
EDUCATION AND TECHNOLOGY
Out-of-school children of primary school age (%) (female, male)....................—, —
Female, male primary education attainment rate (% aged 25+)......................90, 97
Female, male secondary education attainment rate (% aged 25+)..................59, 72
Female, male tertiary education attainment rate (% aged 25+).........................8, 10
Percentage of tertiary-level students enrolled in STEM studies
(female, male).............................................................................................—, —
Percentage of tertiary-level graduates in STEM studies (female, male)...........—, —
Percentage of PhD graduates (female, male)...................................................37, 63
Percentage of individuals using the internet (female, male)............................—, —
Percentage of individuals using a
mobile cellular telephone (female, male).....................................................—, —
HEALTH
Cardiovascular disease age-standardized deaths
per 100,000 (female, male)................................................................286.1, 313.8
Cancer age-standardized deaths per 100,000
excl. non-melanoma skin cancer (female, male)...................................98.0, 193.3
Diabetes age-standardized deaths per 100,000 (female, male).................17.7, 11.9
Chronic respiratory disease age-standardized deaths
per 100,000 (female, male)....................................................................66.7, 89.6
HEALTH (cont’d.)
HIV/AIDS age-standardized deaths per 100,000 (female, male).....................1.4, 3.4
Malaria age-standardized deaths per 100,000 (female, male).......................0.0, 0.0
Tuberculosis age-standardized deaths per 100,000 (female, male)................1.8, 3.8
Malnutrition prev., weight for age (female, male) (% of children <5)..............3.3, 3.5
Maternal mortality ratio (per 100,000 live births)2...................................32 [20–53]
Total fertility rate (children per women)............................................................... 1.7
Adolescent fertility rate (births per 1,000 girls aged 15–19)................................ 6.2
Antenatal care coverage, at least one visit (%)..................................................... 95
Births attended by skilled health personnel (%).................................................. 100
Contraceptive prevalence, any method
(% of married or in-union women aged 15–49)................................................. 85
Existence of legislation permitting abortion
to preserve a woman’s physical health............................................................. Yes
FAMILY
Singulate mean age (years) at marriage (female, male)...................................25, 27
Early marriage (% of women aged 15–19)............................................................. 2
Mean age of women at the birth of the first child................................................. —
Length of paid maternity leave (calendar days)................................................... 128
Provider of maternity leave benefits................................. Employer and Government
Percent of wages paid during maternity leave.................................................... 100
Length of paid paternity leave (calendar days)........................................................ 3
Provider of paternity leave benefits.............................................................Employer
Percent of wages paid during paternity leave..................................................... 100
RIGHTS AND NORMS
Parental authority in marriage3............................................................................ 0.0
Parental authority after divorce3.......................................................................... 0.0
Female genital mutilation (% of women aged 15–49).......................................... 0.0
Existence of legislation on domestic violence3..................................................... 0.5
Existence of legislation on gender-based discrimination....................................... —
Inheritance rights for daughters3......................................................................... 0.5
Women’s secure access to land use, control and ownership3.............................. 0.5
Women’s access to financial services3................................................................ 0.0
Women’s secure access to non-land assets use, control and ownership3............ 0.5
Year women received right to vote.................................................................... 1949
Quota type (single/lower house).........................................................Reserved seats
Voluntary political party quotas............................................................................. —](https://image.slidesharecdn.com/theglobalgendergapreport2015-160119013910/85/The-Global-Gender-Gap-Report-2015-149-320.jpg)

![Index over the years
SAMPLE INDEX ECONOMY EDUCATION HEALTH POLITICS
Year No. of countries Rank Score Rank Score Rank Score Rank Score Rank Score
2015 145 42 0.725 37 0.746 61 0.994 42 0.979 64 0.180
2014 142 53 0.712 50 0.711 51 0.996 37 0.979 67 0.163
2013 136 35 0.717 39 0.728 45 0.995 34 0.979 55 0.166
2012 135 63 0.690 86 0.621 51 0.994 34 0.979 51 0.166
2011 135 80 0.671 89 0.598 42 0.996 41 0.979 74 0.112
2010 134 55 0.693 45 0.694 44 0.996 40 0.979 83 0.102
2009 134 56 0.694 39 0.694 28 1.000 1 0.980 84 0.103
2008 130 50 0.694 37 0.697 32 0.999 1 0.980 79 0.103
2007 128 24 0.709 35 0.691 16 1.000 1 0.980 33 0.166
2006 115 22 0.705 39 0.661 14 1.000 1 0.980 27 0.180
2006–2015 CHANGE s 0.020 s 0.085 t –0.005 t 0.000 t 0.000
Part 2: Country Profiles
The Global Gender Gap Report 2015 | 143
1 Survey data, responses on a 1-to-7 scale (1 = worst score, 7 = best score)
2 Bracketed numbers show the range between the uncertainties, estimated to contain the true maternal mortality ratio with a 95% probability
3 Data on a 0-to-1 scale (1 = worst score, 0 = best score)
Colombia
Selected contextual data
EMPLOYMENT AND LEADERSHIP
Female, male adult unemployment
(as % of female, male labour force)..........................................................11.5, 7.0
Female, male part-time employment
(as % of total female, male employment)...............................................31.0, 14.1
Female, male workers in informal employment
(as % of non-agricultural employment)........................................................49, 51
Share of women in wage employment in the non-agricultural sector
(% of total non-agricultural employment).......................................................... 46
Average minutes spent per day on unpaid work (female, male)......................—, —
Percentage of women, men with an account
at a financial institution................................................................................34, 43
Ability of women to rise to positions of leadership1............................................. 4.2
Firms with female top managers (% of firms)....................................................... 12
Share of women on boards of listed companies (%)............................................. —
Firms with female participation in ownership (% of firms).................................... 35
Percentage of total R&D personnel (FTE) (female, male).................................—, —
EDUCATION AND TECHNOLOGY
Out-of-school children of primary school age (%) (female, male).....................50, 50
Female, male primary education attainment rate (% aged 25+)......................74, 75
Female, male secondary education attainment rate (% aged 25+)..................58, 60
Female, male tertiary education attainment rate (% aged 25+).......................21, 23
Percentage of tertiary-level students enrolled in STEM studies
(female, male)..............................................................................................33, 67
Percentage of tertiary-level graduates in STEM studies (female, male)............34, 66
Percentage of PhD graduates (female, male)...................................................40, 60
Percentage of individuals using the internet (female, male).............................51, 52
Percentage of individuals using a
mobile cellular telephone (female, male)......................................................85, 86
HEALTH
Cardiovascular disease age-standardized deaths
per 100,000 (female, male)................................................................128.0, 178.2
Cancer age-standardized deaths per 100,000
excl. non-melanoma skin cancer (female, male)...................................85.0, 100.2
Diabetes age-standardized deaths per 100,000 (female, male).................16.8, 16.0
Chronic respiratory disease age-standardized deaths
per 100,000 (female, male)....................................................................29.1, 45.9
HEALTH (cont’d.)
HIV/AIDS age-standardized deaths per 100,000 (female, male).....................2.9, 9.5
Malaria age-standardized deaths per 100,000 (female, male).......................0.1, 0.2
Tuberculosis age-standardized deaths per 100,000 (female, male)................1.6, 4.2
Malnutrition prev., weight for age (female, male) (% of children <5)..............3.3, 3.5
Maternal mortality ratio (per 100,000 live births)2.................................83 [56–130]
Total fertility rate (children per women)............................................................... 2.3
Adolescent fertility rate (births per 1,000 girls aged 15–19).............................. 85.0
Antenatal care coverage, at least one visit (%)..................................................... 97
Births attended by skilled health personnel (%).................................................... 99
Contraceptive prevalence, any method
(% of married or in-union women aged 15–49)................................................. 79
Existence of legislation permitting abortion
to preserve a woman’s physical health............................................................. Yes
FAMILY
Singulate mean age (years) at marriage (female, male).................................. 22, —
Early marriage (% of women aged 15–19)........................................................... 17
Mean age of women at the birth of the first child................................................. —
Length of paid maternity leave (calendar days)..................................................... 98
Provider of maternity leave benefits........................................................Government
Percent of wages paid during maternity leave.................................................... 100
Length of paid paternity leave (calendar days)...................................................... 10
Provider of paternity leave benefits.........................................................Government
Percent of wages paid during paternity leave..................................................... 100
RIGHTS AND NORMS
Parental authority in marriage3............................................................................ 0.0
Parental authority after divorce3.......................................................................... 0.0
Female genital mutilation (% of women aged 15–49).......................................... 0.0
Existence of legislation on domestic violence3..................................................... 0.0
Existence of legislation on gender-based discrimination...................................... Yes
Inheritance rights for daughters3......................................................................... 0.0
Women’s secure access to land use, control and ownership3.............................. 0.0
Women’s access to financial services3................................................................ 0.0
Women’s secure access to non-land assets use, control and ownership3............ 0.0
Year women received right to vote.................................................................... 1954
Quota type (single/lower house).................................... Legislated Candidate Quotas
Voluntary political party quotas............................................................................. No](https://image.slidesharecdn.com/theglobalgendergapreport2015-160119013910/85/The-Global-Gender-Gap-Report-2015-151-320.jpg)

![Index over the years
SAMPLE INDEX ECONOMY EDUCATION HEALTH POLITICS
Year No. of countries Rank Score Rank Score Rank Score Rank Score Rank Score
2015 145 38 0.732 118 0.587 1 1.000 64 0.975 20 0.365
2014 142 48 0.717 105 0.616 1 1.000 62 0.975 32 0.276
2013 136 31 0.724 98 0.595 1 1.000 62 0.975 21 0.326
2012 135 29 0.722 99 0.599 1 1.000 65 0.975 21 0.316
2011 135 25 0.727 97 0.594 1 1.000 66 0.975 14 0.338
2010 134 28 0.719 98 0.579 46 0.995 66 0.975 14 0.329
2009 134 27 0.718 84 0.614 48 0.995 1 0.980 20 0.283
2008 130 32 0.711 86 0.586 51 0.995 1 0.980 20 0.283
2007 128 28 0.701 95 0.554 36 0.995 1 0.980 16 0.277
2006 115 30 0.694 89 0.522 32 0.995 1 0.980 15 0.277
2006–2015 CHANGE s 0.038 s 0.065 s 0.005 t –0.005 s 0.087
Part 2: Country Profiles
The Global Gender Gap Report 2015 | 145
1 Survey data, responses on a 1-to-7 scale (1 = worst score, 7 = best score)
2 Bracketed numbers show the range between the uncertainties, estimated to contain the true maternal mortality ratio with a 95% probability
3 Data on a 0-to-1 scale (1 = worst score, 0 = best score)
Costa Rica
Selected contextual data
EMPLOYMENT AND LEADERSHIP
Female, male adult unemployment
(as % of female, male labour force)..........................................................10.8, 7.0
Female, male part-time employment
(as % of total female, male employment)...............................................27.2, 13.6
Female, male workers in informal employment
(as % of non-agricultural employment)........................................................43, 57
Share of women in wage employment in the non-agricultural sector
(% of total non-agricultural employment).......................................................... 43
Average minutes spent per day on unpaid work (female, male)......................—, —
Percentage of women, men with an account
at a financial institution................................................................................60, 69
Ability of women to rise to positions of leadership1............................................. 4.2
Firms with female top managers (% of firms)....................................................... 15
Share of women on boards of listed companies (%)............................................. —
Firms with female participation in ownership (% of firms).................................... 44
Percentage of total R&D personnel (FTE) (female, male).................................—, —
EDUCATION AND TECHNOLOGY
Out-of-school children of primary school age (%) (female, male).....................46, 54
Female, male primary education attainment rate (% aged 25+)......................80, 80
Female, male secondary education attainment rate (% aged 25+)..................51, 50
Female, male tertiary education attainment rate (% aged 25+).......................21, 21
Percentage of tertiary-level students enrolled in STEM studies
(female, male)..............................................................................................31, 69
Percentage of tertiary-level graduates in STEM studies (female, male)............32, 68
Percentage of PhD graduates (female, male)...................................................44, 56
Percentage of individuals using the internet (female, male).............................47, 49
Percentage of individuals using a
mobile cellular telephone (female, male)......................................................73, 73
HEALTH
Cardiovascular disease age-standardized deaths
per 100,000 (female, male)................................................................118.4, 163.0
Cancer age-standardized deaths per 100,000
excl. non-melanoma skin cancer (female, male)...................................97.3, 127.4
Diabetes age-standardized deaths per 100,000 (female, male).................19.5, 18.6
Chronic respiratory disease age-standardized deaths
per 100,000 (female, male)....................................................................25.9, 31.1
HEALTH (cont’d.)
HIV/AIDS age-standardized deaths per 100,000 (female, male).....................1.1, 4.7
Malaria age-standardized deaths per 100,000 (female, male).......................0.0, 0.0
Tuberculosis age-standardized deaths per 100,000 (female, male)................0.6, 2.2
Malnutrition prev., weight for age (female, male) (% of children <5)..............1.8, 0.6
Maternal mortality ratio (per 100,000 live births)2...................................38 [25–57]
Total fertility rate (children per women)............................................................... 1.8
Adolescent fertility rate (births per 1,000 girls aged 15–19).............................. 67.2
Antenatal care coverage, at least one visit (%)..................................................... 95
Births attended by skilled health personnel (%).................................................... 99
Contraceptive prevalence, any method
(% of married or in-union women aged 15–49)................................................. 76
Existence of legislation permitting abortion
to preserve a woman’s physical health............................................................. Yes
FAMILY
Singulate mean age (years) at marriage (female, male)...................................24, 27
Early marriage (% of women aged 15–19)........................................................... 13
Mean age of women at the birth of the first child................................................. —
Length of paid maternity leave (calendar days)................................................... 120
Provider of maternity leave benefits................................. Employer and Government
Percent of wages paid during maternity leave.................................................... 100
Length of paid paternity leave (calendar days)...................................................... —
Provider of paternity leave benefits....................................................................... —
Percent of wages paid during paternity leave....................................................... —
RIGHTS AND NORMS
Parental authority in marriage3............................................................................ 0.5
Parental authority after divorce3.......................................................................... 0.0
Female genital mutilation (% of women aged 15–49).......................................... 0.0
Existence of legislation on domestic violence3..................................................... 0.0
Existence of legislation on gender-based discrimination...................................... Yes
Inheritance rights for daughters3......................................................................... 0.0
Women’s secure access to land use, control and ownership3.............................. 0.5
Women’s access to financial services3................................................................ 0.0
Women’s secure access to non-land assets use, control and ownership3............ 0.5
Year women received right to vote.................................................................... 1949
Quota type (single/lower house).................................... Legislated Candidate Quotas
Voluntary political party quotas............................................................................ Yes](https://image.slidesharecdn.com/theglobalgendergapreport2015-160119013910/85/The-Global-Gender-Gap-Report-2015-153-320.jpg)

![Index over the years
SAMPLE INDEX ECONOMY EDUCATION HEALTH POLITICS
Year No. of countries Rank Score Rank Score Rank Score Rank Score Rank Score
2015 145 133 0.606 112 0.603 138 0.773 113 0.968 119 0.081
2014 142 136 0.587 112 0.582 137 0.722 104 0.968 115 0.078
2013 136 131 0.581 110 0.556 133 0.714 1 0.980 107 0.076
2012 135 130 0.578 111 0.547 131 0.709 1 0.980 104 0.078
2011 135 130 0.577 103 0.557 130 0.707 1 0.980 105 0.066
2010 134 130 0.569 106 0.539 130 0.692 1 0.980 104 0.065
2009 134 — — — — — — — — — —
2008 130 — — — — — — — — — —
2007 128 — — — — — — — — — —
2006 115 — — — — — — — — — —
2006–2015 CHANGE s 0.037 s 0.064 s 0.080 t –0.012 s 0.015
Part 2: Country Profiles
The Global Gender Gap Report 2015 | 147
1 Survey data, responses on a 1-to-7 scale (1 = worst score, 7 = best score)
2 Bracketed numbers show the range between the uncertainties, estimated to contain the true maternal mortality ratio with a 95% probability
3 Data on a 0-to-1 scale (1 = worst score, 0 = best score)
Côte d’Ivoire
Selected contextual data
EMPLOYMENT AND LEADERSHIP
Female, male adult unemployment
(as % of female, male labour force)..........................................................11.9, 7.4
Female, male part-time employment
(as % of total female, male employment)....................................................—, —
Female, male workers in informal employment
(as % of non-agricultural employment).......................................................—, —
Share of women in wage employment in the non-agricultural sector
(% of total non-agricultural employment).......................................................... 21
Average minutes spent per day on unpaid work (female, male)......................—, —
Percentage of women, men with an account
at a financial institution................................................................................12, 18
Ability of women to rise to positions of leadership1............................................. 4.2
Firms with female top managers (% of firms)....................................................... —
Share of women on boards of listed companies (%)............................................. —
Firms with female participation in ownership (% of firms).................................... 62
Percentage of total R&D personnel (FTE) (female, male).................................—, —
EDUCATION AND TECHNOLOGY
Out-of-school children of primary school age (%) (female, male).....................57, 43
Female, male primary education attainment rate (% aged 25+).....................—, —
Female, male secondary education attainment rate (% aged 25+).................—, —
Female, male tertiary education attainment rate (% aged 25+)......................—, —
Percentage of tertiary-level students enrolled in STEM studies
(female, male)..............................................................................................16, 84
Percentage of tertiary-level graduates in STEM studies (female, male)...........—, —
Percentage of PhD graduates (female, male)..................................................—, —
Percentage of individuals using the internet (female, male)............................—, —
Percentage of individuals using a
mobile cellular telephone (female, male).....................................................—, —
HEALTH
Cardiovascular disease age-standardized deaths
per 100,000 (female, male)................................................................338.8, 332.3
Cancer age-standardized deaths per 100,000
excl. non-melanoma skin cancer (female, male).................................100.5, 123.1
Diabetes age-standardized deaths per 100,000 (female, male).................59.0, 49.0
Chronic respiratory disease age-standardized deaths
per 100,000 (female, male)....................................................................36.5, 55.4
HEALTH (cont’d.)
HIV/AIDS age-standardized deaths per 100,000 (female, male).............233.2, 191.3
Malaria age-standardized deaths per 100,000 (female, male)...................46.4, 51.6
Tuberculosis age-standardized deaths per 100,000 (female, male)............24.8, 44.7
Malnutrition prev., weight for age (female, male) (% of children <5)..........12.8, 18.8
Maternal mortality ratio (per 100,000 live births)2...........................720 [440–1200]
Total fertility rate (children per women)............................................................... 4.9
Adolescent fertility rate (births per 1,000 girls aged 15–19)............................ 125.0
Antenatal care coverage, at least one visit (%)..................................................... 89
Births attended by skilled health personnel (%).................................................... 57
Contraceptive prevalence, any method
(% of married or in-union women aged 15–49)................................................. 18
Existence of legislation permitting abortion
to preserve a woman’s physical health.............................................................. No
FAMILY
Singulate mean age (years) at marriage (female, male)...................................22, 28
Early marriage (% of women aged 15–19)........................................................... 25
Mean age of women at the birth of the first child................................................. —
Length of paid maternity leave (calendar days)..................................................... 98
Provider of maternity leave benefits........................................................Government
Percent of wages paid during maternity leave.................................................... 100
Length of paid paternity leave (calendar days)........................................................ 2
Provider of paternity leave benefits.............................................................Employer
Percent of wages paid during paternity leave..................................................... 100
RIGHTS AND NORMS
Parental authority in marriage3............................................................................ 0.0
Parental authority after divorce3.......................................................................... 0.0
Female genital mutilation (% of women aged 15–49).......................................... 0.4
Existence of legislation on domestic violence3..................................................... 1.0
Existence of legislation on gender-based discrimination....................................... —
Inheritance rights for daughters3......................................................................... 0.5
Women’s secure access to land use, control and ownership3.............................. 0.5
Women’s access to financial services3................................................................ 0.5
Women’s secure access to non-land assets use, control and ownership3............ 0.5
Year women received right to vote.................................................................... 1952
Quota type (single/lower house)............................................................................ —
Voluntary political party quotas............................................................................. —](https://image.slidesharecdn.com/theglobalgendergapreport2015-160119013910/85/The-Global-Gender-Gap-Report-2015-155-320.jpg)

![Index over the years
SAMPLE INDEX ECONOMY EDUCATION HEALTH POLITICS
Year No. of countries Rank Score Rank Score Rank Score Rank Score Rank Score
2015 145 59 0.708 78 0.664 65 0.994 42 0.979 60 0.193
2014 142 55 0.707 65 0.675 65 0.994 37 0.979 56 0.182
2013 136 49 0.707 61 0.675 47 0.995 34 0.979 50 0.178
2012 135 49 0.705 61 0.669 46 0.995 34 0.979 47 0.178
2011 135 50 0.701 56 0.668 44 0.995 1 0.980 53 0.160
2010 134 53 0.694 61 0.661 53 0.994 1 0.980 57 0.142
2009 134 54 0.694 69 0.646 55 0.995 41 0.979 49 0.158
2008 130 46 0.697 57 0.655 56 0.994 38 0.979 47 0.158
2007 128 16 0.721 40 0.678 61 0.989 37 0.979 18 0.238
2006 115 16 0.714 42 0.651 51 0.990 36 0.979 18 0.238
2006–2015 CHANGE t –0.007 s 0.014 s 0.004 s 0.000 t –0.045
Part 2: Country Profiles
The Global Gender Gap Report 2015 | 149
1 Survey data, responses on a 1-to-7 scale (1 = worst score, 7 = best score)
2 Bracketed numbers show the range between the uncertainties, estimated to contain the true maternal mortality ratio with a 95% probability
3 Data on a 0-to-1 scale (1 = worst score, 0 = best score)
Croatia
Selected contextual data
EMPLOYMENT AND LEADERSHIP
Female, male adult unemployment
(as % of female, male labour force)........................................................16.8, 17.7
Female, male part-time employment
(as % of total female, male employment)...................................................9.3, 6.5
Female, male workers in informal employment
(as % of non-agricultural employment).......................................................—, —
Share of women in wage employment in the non-agricultural sector
(% of total non-agricultural employment).......................................................... 47
Average minutes spent per day on unpaid work (female, male)......................—, —
Percentage of women, men with an account
at a financial institution................................................................................88, 84
Ability of women to rise to positions of leadership1............................................. 3.9
Firms with female top managers (% of firms)....................................................... 19
Share of women on boards of listed companies (%)............................................. —
Firms with female participation in ownership (% of firms).................................... 32
Percentage of total R&D personnel (FTE) (female, male)..................................51, 49
EDUCATION AND TECHNOLOGY
Out-of-school children of primary school age (%) (female, male).....................11, 89
Female, male primary education attainment rate (% aged 25+)......................95, 99
Female, male secondary education attainment rate (% aged 25+)..................85, 94
Female, male tertiary education attainment rate (% aged 25+).......................18, 18
Percentage of tertiary-level students enrolled in STEM studies
(female, male)..............................................................................................33, 67
Percentage of tertiary-level graduates in STEM studies (female, male)............35, 65
Percentage of PhD graduates (female, male)...................................................55, 45
Percentage of individuals using the internet (female, male).............................60, 74
Percentage of individuals using a
mobile cellular telephone (female, male).....................................................—, —
HEALTH
Cardiovascular disease age-standardized deaths
per 100,000 (female, male)................................................................193.6, 291.7
Cancer age-standardized deaths per 100,000
excl. non-melanoma skin cancer (female, male).................................112.8, 222.8
Diabetes age-standardized deaths per 100,000 (female, male).................10.8, 16.7
Chronic respiratory disease age-standardized deaths
per 100,000 (female, male)......................................................................9.8, 29.4
HEALTH (cont’d.)
HIV/AIDS age-standardized deaths per 100,000 (female, male).....................0.0, 0.3
Malaria age-standardized deaths per 100,000 (female, male).......................0.0, 0.0
Tuberculosis age-standardized deaths per 100,000 (female, male)................0.5, 1.2
Malnutrition prev., weight for age (female, male) (% of children <5)...............—, —
Maternal mortality ratio (per 100,000 live births)2.....................................13 [6–27]
Total fertility rate (children per women)............................................................... 1.5
Adolescent fertility rate (births per 1,000 girls aged 15–19).............................. 11.9
Antenatal care coverage, at least one visit (%)..................................................... 94
Births attended by skilled health personnel (%).................................................. 100
Contraceptive prevalence, any method
(% of married or in-union women aged 15–49)................................................. —
Existence of legislation permitting abortion
to preserve a woman’s physical health............................................................. Yes
FAMILY
Singulate mean age (years) at marriage (female, male)...................................26, 30
Early marriage (% of women aged 15–19)............................................................. 2
Mean age of women at the birth of the first child................................................. 28
Length of paid maternity leave (calendar days)................................................... 208
Provider of maternity leave benefits........................................................Government
Percent of wages paid during maternity leave.................................................... 100
Length of paid paternity leave (calendar days)...................................................... —
Provider of paternity leave benefits....................................................................... —
Percent of wages paid during paternity leave....................................................... —
RIGHTS AND NORMS
Parental authority in marriage3............................................................................ 0.0
Parental authority after divorce3.......................................................................... 0.0
Female genital mutilation (% of women aged 15–49).......................................... 0.0
Existence of legislation on domestic violence3..................................................... 0.3
Existence of legislation on gender-based discrimination...................................... Yes
Inheritance rights for daughters3......................................................................... 0.0
Women’s secure access to land use, control and ownership3.............................. 0.0
Women’s access to financial services3................................................................ 0.0
Women’s secure access to non-land assets use, control and ownership3............ 0.0
Year women received right to vote.................................................................... 1945
Quota type (single/lower house).................................... Legislated Candidate Quotas
Voluntary political party quotas............................................................................ Yes](https://image.slidesharecdn.com/theglobalgendergapreport2015-160119013910/85/The-Global-Gender-Gap-Report-2015-157-320.jpg)

![Index over the years
SAMPLE INDEX ECONOMY EDUCATION HEALTH POLITICS
Year No. of countries Rank Score Rank Score Rank Score Rank Score Rank Score
2015 145 29 0.740 119 0.579 26 1.000 63 0.975 12 0.407
2014 142 30 0.732 113 0.580 26 1.000 37 0.979 18 0.368
2013 136 15 0.754 65 0.674 30 1.000 63 0.974 13 0.368
2012 135 19 0.742 64 0.666 24 1.000 66 0.974 19 0.328
2011 135 20 0.739 57 0.666 23 1.000 69 0.974 18 0.318
2010 134 24 0.725 84 0.609 1 1.000 69 0.974 18 0.318
2009 134 29 0.718 88 0.603 1 1.000 74 0.974 18 0.293
2008 130 25 0.720 77 0.611 25 1.000 71 0.974 19 0.293
2007 128 22 0.717 39 0.681 55 0.990 69 0.974 23 0.222
2006 115 — — — — — — — — — —
2006–2015 CHANGE s 0.023 t –0.102 s 0.010 s 0.000 s 0.185
Part 2: Country Profiles
The Global Gender Gap Report 2015 | 151
1 Survey data, responses on a 1-to-7 scale (1 = worst score, 7 = best score)
2 Bracketed numbers show the range between the uncertainties, estimated to contain the true maternal mortality ratio with a 95% probability
3 Data on a 0-to-1 scale (1 = worst score, 0 = best score)
Cuba
Selected contextual data
EMPLOYMENT AND LEADERSHIP
Female, male adult unemployment
(as % of female, male labour force)............................................................3.5, 3.0
Female, male part-time employment
(as % of total female, male employment)....................................................—, —
Female, male workers in informal employment
(as % of non-agricultural employment).......................................................—, —
Share of women in wage employment in the non-agricultural sector
(% of total non-agricultural employment).......................................................... 45
Average minutes spent per day on unpaid work (female, male)......................—, —
Percentage of women, men with an account
at a financial institution...............................................................................—, —
Ability of women to rise to positions of leadership1.............................................. —
Firms with female top managers (% of firms)....................................................... —
Share of women on boards of listed companies (%)............................................. —
Firms with female participation in ownership (% of firms).................................... —
Percentage of total R&D personnel (FTE) (female, male).................................—, —
EDUCATION AND TECHNOLOGY
Out-of-school children of primary school age (%) (female, male).....................46, 54
Female, male primary education attainment rate (% aged 25+)......................90, 92
Female, male secondary education attainment rate (% aged 25+)..................79, 83
Female, male tertiary education attainment rate (% aged 25+).......................17, 13
Percentage of tertiary-level students enrolled in STEM studies
(female, male)..............................................................................................41, 59
Percentage of tertiary-level graduates in STEM studies (female, male)............39, 61
Percentage of PhD graduates (female, male)...................................................40, 60
Percentage of individuals using the internet (female, male).............................30, 25
Percentage of individuals using a
mobile cellular telephone (female, male)......................................................12, 11
HEALTH
Cardiovascular disease age-standardized deaths
per 100,000 (female, male)................................................................157.2, 214.4
Cancer age-standardized deaths per 100,000
excl. non-melanoma skin cancer (female, male).................................109.1, 161.4
Diabetes age-standardized deaths per 100,000 (female, male).................17.7, 13.7
Chronic respiratory disease age-standardized deaths
per 100,000 (female, male)....................................................................15.3, 22.4
HEALTH (cont’d.)
HIV/AIDS age-standardized deaths per 100,000 (female, male).....................0.5, 4.0
Malaria age-standardized deaths per 100,000 (female, male).......................0.0, 0.0
Tuberculosis age-standardized deaths per 100,000 (female, male)................0.1, 0.4
Malnutrition prev., weight for age (female, male) (% of children <5)...............—, —
Maternal mortality ratio (per 100,000 live births)2.................................80 [50–130]
Total fertility rate (children per women)............................................................... 1.4
Adolescent fertility rate (births per 1,000 girls aged 15–19).............................. 54.2
Antenatal care coverage, at least one visit (%)................................................... 100
Births attended by skilled health personnel (%).................................................. 100
Contraceptive prevalence, any method
(% of married or in-union women aged 15–49)................................................. 74
Existence of legislation permitting abortion
to preserve a woman’s physical health............................................................. Yes
FAMILY
Singulate mean age (years) at marriage (female, male)...................................21, 25
Early marriage (% of women aged 15–19)........................................................... 23
Mean age of women at the birth of the first child................................................. —
Length of paid maternity leave (calendar days)..................................................... —
Provider of maternity leave benefits...................................................................... —
Percent of wages paid during maternity leave...................................................... —
Length of paid paternity leave (calendar days)...................................................... —
Provider of paternity leave benefits....................................................................... —
Percent of wages paid during paternity leave....................................................... —
RIGHTS AND NORMS
Parental authority in marriage3............................................................................ 0.0
Parental authority after divorce3.......................................................................... 0.0
Female genital mutilation (% of women aged 15–49).......................................... 0.0
Existence of legislation on domestic violence3..................................................... 0.5
Existence of legislation on gender-based discrimination....................................... —
Inheritance rights for daughters3......................................................................... 0.0
Women’s secure access to land use, control and ownership3.............................. 0.0
Women’s access to financial services3................................................................ 0.0
Women’s secure access to non-land assets use, control and ownership3............ 0.0
Year women received right to vote.................................................................... 1934
Quota type (single/lower house)............................................................................ —
Voluntary political party quotas............................................................................. —](https://image.slidesharecdn.com/theglobalgendergapreport2015-160119013910/85/The-Global-Gender-Gap-Report-2015-159-320.jpg)

![Index over the years
SAMPLE INDEX ECONOMY EDUCATION HEALTH POLITICS
Year No. of countries Rank Score Rank Score Rank Score Rank Score Rank Score
2015 145 100 0.671 88 0.643 41 0.998 73 0.974 124 0.069
2014 142 95 0.674 75 0.656 41 0.998 69 0.974 122 0.069
2013 136 79 0.680 85 0.635 83 0.985 91 0.970 76 0.130
2012 135 79 0.673 87 0.615 90 0.978 92 0.970 74 0.130
2011 135 93 0.657 80 0.617 89 0.978 90 0.970 109 0.062
2010 134 86 0.664 75 0.630 77 0.988 88 0.970 102 0.069
2009 134 79 0.671 82 0.617 61 0.993 114 0.966 80 0.107
2008 130 76 0.669 78 0.610 50 0.995 110 0.966 76 0.107
2007 128 82 0.652 81 0.602 60 0.989 108 0.966 107 0.052
2006 115 83 0.643 75 0.562 55 0.989 84 0.969 95 0.052
2006–2015 CHANGE s 0.028 s 0.082 s 0.009 s 0.004 s 0.017
Part 2: Country Profiles
The Global Gender Gap Report 2015 | 153
1 Survey data, responses on a 1-to-7 scale (1 = worst score, 7 = best score)
2 Bracketed numbers show the range between the uncertainties, estimated to contain the true maternal mortality ratio with a 95% probability
3 Data on a 0-to-1 scale (1 = worst score, 0 = best score)
Cyprus
Selected contextual data
EMPLOYMENT AND LEADERSHIP
Female, male adult unemployment
(as % of female, male labour force)........................................................15.2, 16.5
Female, male part-time employment
(as % of total female, male employment).................................................13.6, 7.6
Female, male workers in informal employment
(as % of non-agricultural employment).......................................................—, —
Share of women in wage employment in the non-agricultural sector
(% of total non-agricultural employment).......................................................... 51
Average minutes spent per day on unpaid work (female, male)......................—, —
Percentage of women, men with an account
at a financial institution................................................................................90, 90
Ability of women to rise to positions of leadership1............................................. 4.2
Firms with female top managers (% of firms)....................................................... —
Share of women on boards of listed companies (%)............................................. —
Firms with female participation in ownership (% of firms).................................... —
Percentage of total R&D personnel (FTE) (female, male)..................................41, 59
EDUCATION AND TECHNOLOGY
Out-of-school children of primary school age (%) (female, male).....................44, 56
Female, male primary education attainment rate (% aged 25+)......................92, 97
Female, male secondary education attainment rate (% aged 25+)..................77, 83
Female, male tertiary education attainment rate (% aged 25+).......................35, 34
Percentage of tertiary-level students enrolled in STEM studies
(female, male)..............................................................................................35, 65
Percentage of tertiary-level graduates in STEM studies (female, male)............49, 51
Percentage of PhD graduates (female, male)...................................................50, 50
Percentage of individuals using the internet (female, male).............................64, 67
Percentage of individuals using a
mobile cellular telephone (female, male).....................................................—, —
HEALTH
Cardiovascular disease age-standardized deaths
per 100,000 (female, male)................................................................117.9, 155.2
Cancer age-standardized deaths per 100,000
excl. non-melanoma skin cancer (female, male)...................................74.7, 115.8
Diabetes age-standardized deaths per 100,000 (female, male).................21.1, 24.8
Chronic respiratory disease age-standardized deaths
per 100,000 (female, male)....................................................................14.5, 25.4
HEALTH (cont’d.)
HIV/AIDS age-standardized deaths per 100,000 (female, male).....................0.2, 0.2
Malaria age-standardized deaths per 100,000 (female, male).......................0.0, 0.0
Tuberculosis age-standardized deaths per 100,000 (female, male)................0.0, 0.1
Malnutrition prev., weight for age (female, male) (% of children <5)...............—, —
Maternal mortality ratio (per 100,000 live births)2.....................................10 [5–20]
Total fertility rate (children per women)............................................................... 1.5
Adolescent fertility rate (births per 1,000 girls aged 15–19)................................ 4.2
Antenatal care coverage, at least one visit (%)..................................................... 99
Births attended by skilled health personnel (%).................................................... 99
Contraceptive prevalence, any method
(% of married or in-union women aged 15–49)................................................. —
Existence of legislation permitting abortion
to preserve a woman’s physical health............................................................. Yes
FAMILY
Singulate mean age (years) at marriage (female, male)...................................28, 31
Early marriage (% of women aged 15–19)............................................................. 2
Mean age of women at the birth of the first child................................................. 29
Length of paid maternity leave (calendar days)..................................................... —
Provider of maternity leave benefits...................................................................... —
Percent of wages paid during maternity leave...................................................... —
Length of paid paternity leave (calendar days)...................................................... —
Provider of paternity leave benefits....................................................................... —
Percent of wages paid during paternity leave....................................................... —
RIGHTS AND NORMS
Parental authority in marriage3............................................................................ 0.0
Parental authority after divorce3.......................................................................... 0.0
Female genital mutilation (% of women aged 15–49).......................................... 0.0
Existence of legislation on domestic violence3..................................................... 0.5
Existence of legislation on gender-based discrimination...................................... Yes
Inheritance rights for daughters3......................................................................... 0.0
Women’s secure access to land use, control and ownership3.............................. 0.0
Women’s access to financial services3................................................................ 0.0
Women’s secure access to non-land assets use, control and ownership3............ 0.0
Year women received right to vote.................................................................... 1960
Quota type (single/lower house)............................................................................ —
Voluntary political party quotas............................................................................. —](https://image.slidesharecdn.com/theglobalgendergapreport2015-160119013910/85/The-Global-Gender-Gap-Report-2015-161-320.jpg)

![Index over the years
SAMPLE INDEX ECONOMY EDUCATION HEALTH POLITICS
Year No. of countries Rank Score Rank Score Rank Score Rank Score Rank Score
2015 145 81 0.687 94 0.636 1 1.000 42 0.979 83 0.134
2014 142 96 0.674 100 0.622 1 1.000 37 0.979 109 0.094
2013 136 83 0.677 95 0.604 1 1.000 46 0.979 79 0.125
2012 135 73 0.677 95 0.603 1 1.000 49 0.979 76 0.125
2011 135 75 0.679 94 0.596 1 1.000 39 0.979 60 0.140
2010 134 65 0.685 80 0.621 1 1.000 38 0.979 59 0.140
2009 134 74 0.679 70 0.644 1 1.000 41 0.979 91 0.092
2008 130 69 0.677 68 0.637 1 1.000 38 0.979 88 0.092
2007 128 64 0.672 71 0.630 53 0.991 37 0.979 78 0.088
2006 115 53 0.671 52 0.627 47 0.991 36 0.979 70 0.088
2006–2015 CHANGE s 0.016 s 0.009 s 0.009 s 0.000 s 0.047
Part 2: Country Profiles
The Global Gender Gap Report 2015 | 155
1 Survey data, responses on a 1-to-7 scale (1 = worst score, 7 = best score)
2 Bracketed numbers show the range between the uncertainties, estimated to contain the true maternal mortality ratio with a 95% probability
3 Data on a 0-to-1 scale (1 = worst score, 0 = best score)
Czech Republic
Selected contextual data
EMPLOYMENT AND LEADERSHIP
Female, male adult unemployment
(as % of female, male labour force)............................................................8.3, 5.9
Female, male part-time employment
(as % of total female, male employment)...................................................7.0, 2.3
Female, male workers in informal employment
(as % of non-agricultural employment).......................................................—, —
Share of women in wage employment in the non-agricultural sector
(% of total non-agricultural employment).......................................................... 46
Average minutes spent per day on unpaid work (female, male)......................—, —
Percentage of women, men with an account
at a financial institution................................................................................79, 85
Ability of women to rise to positions of leadership1............................................. 4.5
Firms with female top managers (% of firms)....................................................... 12
Share of women on boards of listed companies (%)............................................... 0
Firms with female participation in ownership (% of firms).................................... 31
Percentage of total R&D personnel (FTE) (female, male)..................................30, 70
EDUCATION AND TECHNOLOGY
Out-of-school children of primary school age (%) (female, male)....................—, —
Female, male primary education attainment rate (% aged 25+)..................100, 100
Female, male secondary education attainment rate (% aged 25+)..............100, 100
Female, male tertiary education attainment rate (% aged 25+).......................17, 19
Percentage of tertiary-level students enrolled in STEM studies
(female, male)..............................................................................................31, 69
Percentage of tertiary-level graduates in STEM studies (female, male)............32, 68
Percentage of PhD graduates (female, male)...................................................41, 59
Percentage of individuals using the internet (female, male).............................73, 75
Percentage of individuals using a
mobile cellular telephone (female, male).....................................................—, —
HEALTH
Cardiovascular disease age-standardized deaths
per 100,000 (female, male)................................................................191.9, 299.3
Cancer age-standardized deaths per 100,000
excl. non-melanoma skin cancer (female, male).................................109.2, 188.2
Diabetes age-standardized deaths per 100,000 (female, male)...................9.5, 12.9
Chronic respiratory disease age-standardized deaths
per 100,000 (female, male)....................................................................10.0, 23.1
HEALTH (cont’d.)
HIV/AIDS age-standardized deaths per 100,000 (female, male).....................0.0, 0.1
Malaria age-standardized deaths per 100,000 (female, male).......................0.0, 0.0
Tuberculosis age-standardized deaths per 100,000 (female, male)................0.1, 0.4
Malnutrition prev., weight for age (female, male) (% of children <5)..............1.6, 2.5
Maternal mortality ratio (per 100,000 live births)2.........................................5 [3–9]
Total fertility rate (children per women)............................................................... 1.6
Adolescent fertility rate (births per 1,000 girls aged 15–19).............................. 10.7
Antenatal care coverage, at least one visit (%)..................................................... 98
Births attended by skilled health personnel (%).................................................. 100
Contraceptive prevalence, any method
(% of married or in-union women aged 15–49)................................................. 86
Existence of legislation permitting abortion
to preserve a woman’s physical health............................................................. Yes
FAMILY
Singulate mean age (years) at marriage (female, male)...................................30, 33
Early marriage (% of women aged 15–19)............................................................. 0
Mean age of women at the birth of the first child................................................. 28
Length of paid maternity leave (calendar days)................................................... 196
Provider of maternity leave benefits........................................................Government
Percent of wages paid during maternity leave...................................................... 70
Length of paid paternity leave (calendar days)...................................................... —
Provider of paternity leave benefits....................................................................... —
Percent of wages paid during paternity leave....................................................... —
RIGHTS AND NORMS
Parental authority in marriage3............................................................................ 0.0
Parental authority after divorce3.......................................................................... 0.0
Female genital mutilation (% of women aged 15–49).......................................... 0.0
Existence of legislation on domestic violence3..................................................... 0.0
Existence of legislation on gender-based discrimination...................................... Yes
Inheritance rights for daughters3......................................................................... 0.0
Women’s secure access to land use, control and ownership3.............................. 0.0
Women’s access to financial services3................................................................ 0.0
Women’s secure access to non-land assets use, control and ownership3............ 0.0
Year women received right to vote.................................................................... 1920
Quota type (single/lower house)............................................................................ —
Voluntary political party quotas............................................................................. —](https://image.slidesharecdn.com/theglobalgendergapreport2015-160119013910/85/The-Global-Gender-Gap-Report-2015-163-320.jpg)

![Index over the years
SAMPLE INDEX ECONOMY EDUCATION HEALTH POLITICS
Year No. of countries Rank Score Rank Score Rank Score Rank Score Rank Score
2015 145 14 0.767 20 0.788 1 1.000 107 0.970 29 0.309
2014 142 5 0.803 12 0.805 1 1.000 65 0.974 7 0.431
2013 136 8 0.778 25 0.764 1 1.000 64 0.974 11 0.374
2012 135 7 0.778 16 0.772 1 1.000 67 0.974 11 0.364
2011 135 7 0.778 13 0.767 1 1.000 68 0.974 10 0.370
2010 134 7 0.772 23 0.744 1 1.000 68 0.974 10 0.370
2009 134 7 0.763 20 0.748 1 1.000 102 0.970 11 0.334
2008 130 7 0.754 28 0.712 1 1.000 97 0.970 10 0.334
2007 128 8 0.752 18 0.734 1 1.000 96 0.970 13 0.305
2006 115 8 0.746 19 0.708 1 1.000 76 0.972 13 0.305
2006–2015 CHANGE s 0.020 s 0.080 t 0.000 t –0.003 s 0.005
Part 2: Country Profiles
The Global Gender Gap Report 2015 | 157
1 Survey data, responses on a 1-to-7 scale (1 = worst score, 7 = best score)
2 Bracketed numbers show the range between the uncertainties, estimated to contain the true maternal mortality ratio with a 95% probability
3 Data on a 0-to-1 scale (1 = worst score, 0 = best score)
Denmark
Selected contextual data
EMPLOYMENT AND LEADERSHIP
Female, male adult unemployment
(as % of female, male labour force)............................................................7.3, 6.7
Female, male part-time employment
(as % of total female, male employment)...............................................24.8, 14.4
Female, male workers in informal employment
(as % of non-agricultural employment).......................................................—, —
Share of women in wage employment in the non-agricultural sector
(% of total non-agricultural employment).......................................................... 50
Average minutes spent per day on unpaid work (female, male)...................243, 186
Percentage of women, men with an account
at a financial institution............................................................................100, 100
Ability of women to rise to positions of leadership1............................................. 5.7
Firms with female top managers (% of firms)....................................................... —
Share of women on boards of listed companies (%)............................................... 9
Firms with female participation in ownership (% of firms).................................... —
Percentage of total R&D personnel (FTE) (female, male)..................................36, 64
EDUCATION AND TECHNOLOGY
Out-of-school children of primary school age (%) (female, male).....................38, 62
Female, male primary education attainment rate (% aged 25+)..................100, 100
Female, male secondary education attainment rate (% aged 25+)................100, 99
Female, male tertiary education attainment rate (% aged 25+).......................37, 25
Percentage of tertiary-level students enrolled in STEM studies
(female, male)..............................................................................................34, 66
Percentage of tertiary-level graduates in STEM studies (female, male)............35, 65
Percentage of PhD graduates (female, male)...................................................45, 55
Percentage of individuals using the internet (female, male).............................94, 95
Percentage of individuals using a
mobile cellular telephone (female, male).....................................................—, —
HEALTH
Cardiovascular disease age-standardized deaths
per 100,000 (female, male)..................................................................85.5, 134.6
Cancer age-standardized deaths per 100,000
excl. non-melanoma skin cancer (female, male).................................137.8, 179.9
Diabetes age-standardized deaths per 100,000 (female, male)...................8.5, 16.9
Chronic respiratory disease age-standardized deaths
per 100,000 (female, male)....................................................................32.9, 40.4
HEALTH (cont’d.)
HIV/AIDS age-standardized deaths per 100,000 (female, male).....................0.2, 0.6
Malaria age-standardized deaths per 100,000 (female, male).......................0.0, 0.0
Tuberculosis age-standardized deaths per 100,000 (female, male)................0.2, 0.4
Malnutrition prev., weight for age (female, male) (% of children <5)...............—, —
Maternal mortality ratio (per 100,000 live births)2.......................................5 [2–12]
Total fertility rate (children per women)............................................................... 1.9
Adolescent fertility rate (births per 1,000 girls aged 15–19)................................ 4.6
Antenatal care coverage, at least one visit (%)..................................................... —
Births attended by skilled health personnel (%).................................................... 98
Contraceptive prevalence, any method
(% of married or in-union women aged 15–49)................................................. 77
Existence of legislation permitting abortion
to preserve a woman’s physical health............................................................. Yes
FAMILY
Singulate mean age (years) at marriage (female, male)...................................31, 33
Early marriage (% of women aged 15–19)............................................................. 0
Mean age of women at the birth of the first child................................................. 29
Length of paid maternity leave (calendar days)................................................... 126
Provider of maternity leave benefits........................................................Government
Percent of wages paid during maternity leave...................................................... 50
Length of paid paternity leave (calendar days)...................................................... 14
Provider of paternity leave benefits.........................................................Government
Percent of wages paid during paternity leave....................................................... 50
RIGHTS AND NORMS
Parental authority in marriage3............................................................................ 0.0
Parental authority after divorce3.......................................................................... 0.0
Female genital mutilation (% of women aged 15–49).......................................... 0.0
Existence of legislation on domestic violence3..................................................... 0.0
Existence of legislation on gender-based discrimination...................................... Yes
Inheritance rights for daughters3......................................................................... 0.0
Women’s secure access to land use, control and ownership3.............................. 0.0
Women’s access to financial services3................................................................ 0.0
Women’s secure access to non-land assets use, control and ownership3............ 0.0
Year women received right to vote.................................................................... 1915
Quota type (single/lower house)............................................................................ —
Voluntary political party quotas............................................................................. —](https://image.slidesharecdn.com/theglobalgendergapreport2015-160119013910/85/The-Global-Gender-Gap-Report-2015-165-320.jpg)

![Index over the years
SAMPLE INDEX ECONOMY EDUCATION HEALTH POLITICS
Year No. of countries Rank Score Rank Score Rank Score Rank Score Rank Score
2015 145 86 0.686 86 0.648 91 0.984 98 0.971 81 0.140
2014 142 78 0.691 63 0.679 91 0.984 91 0.971 84 0.128
2013 136 72 0.687 63 0.675 84 0.982 89 0.971 84 0.118
2012 135 89 0.666 93 0.605 94 0.969 89 0.971 84 0.118
2011 135 81 0.668 92 0.597 1 1.000 88 0.971 80 0.105
2010 134 73 0.677 64 0.652 1 1.000 86 0.971 92 0.087
2009 134 67 0.686 67 0.647 1 1.000 1 0.980 73 0.117
2008 130 72 0.674 82 0.601 1 1.000 1 0.980 69 0.117
2007 128 65 0.670 88 0.585 1 1.000 1 0.980 55 0.117
2006 115 59 0.664 78 0.559 1 1.000 1 0.980 49 0.117
2006–2015 CHANGE s 0.022 s 0.089 t –0.016 t –0.009 s 0.023
Part 2: Country Profiles
The Global Gender Gap Report 2015 | 159
1 Survey data, responses on a 1-to-7 scale (1 = worst score, 7 = best score)
2 Bracketed numbers show the range between the uncertainties, estimated to contain the true maternal mortality ratio with a 95% probability
3 Data on a 0-to-1 scale (1 = worst score, 0 = best score)
Dominican Republic
Selected contextual data
EMPLOYMENT AND LEADERSHIP
Female, male adult unemployment
(as % of female, male labour force)..........................................................23.0, 9.7
Female, male part-time employment
(as % of total female, male employment)...............................................16.4, 11.8
Female, male workers in informal employment
(as % of non-agricultural employment)........................................................41, 59
Share of women in wage employment in the non-agricultural sector
(% of total non-agricultural employment).......................................................... 42
Average minutes spent per day on unpaid work (female, male)......................—, —
Percentage of women, men with an account
at a financial institution................................................................................56, 52
Ability of women to rise to positions of leadership1............................................. 3.6
Firms with female top managers (% of firms)....................................................... 11
Share of women on boards of listed companies (%)............................................. —
Firms with female participation in ownership (% of firms).................................... 30
Percentage of total R&D personnel (FTE) (female, male).................................—, —
EDUCATION AND TECHNOLOGY
Out-of-school children of primary school age (%) (female, male).....................53, 47
Female, male primary education attainment rate (% aged 25+)......................66, 65
Female, male secondary education attainment rate (% aged 25+)..................56, 54
Female, male tertiary education attainment rate (% aged 25+).......................12, 10
Percentage of tertiary-level students enrolled in STEM studies
(female, male)..............................................................................................31, 69
Percentage of tertiary-level graduates in STEM studies (female, male)............35, 65
Percentage of PhD graduates (female, male)..................................................—, —
Percentage of individuals using the internet (female, male)............................—, —
Percentage of individuals using a
mobile cellular telephone (female, male).....................................................—, —
HEALTH
Cardiovascular disease age-standardized deaths
per 100,000 (female, male)................................................................208.7, 187.0
Cancer age-standardized deaths per 100,000
excl. non-melanoma skin cancer (female, male)...................................81.6, 111.5
Diabetes age-standardized deaths per 100,000 (female, male).................30.9, 18.2
Chronic respiratory disease age-standardized deaths
per 100,000 (female, male)....................................................................14.7, 14.7
HEALTH (cont’d.)
HIV/AIDS age-standardized deaths per 100,000 (female, male).................11.8, 19.5
Malaria age-standardized deaths per 100,000 (female, male).......................0.0, 0.0
Tuberculosis age-standardized deaths per 100,000 (female, male)................3.2, 6.1
Malnutrition prev., weight for age (female, male) (% of children <5)..............4.1, 3.9
Maternal mortality ratio (per 100,000 live births)2...............................100 [71–150]
Total fertility rate (children per women)............................................................... 2.5
Adolescent fertility rate (births per 1,000 girls aged 15–19).............................. 96.2
Antenatal care coverage, at least one visit (%)..................................................... 99
Births attended by skilled health personnel (%).................................................... 99
Contraceptive prevalence, any method
(% of married or in-union women aged 15–49)................................................. 72
Existence of legislation permitting abortion
to preserve a woman’s physical health.............................................................. No
FAMILY
Singulate mean age (years) at marriage (female, male)...................................21, 25
Early marriage (% of women aged 15–19)........................................................... 27
Mean age of women at the birth of the first child................................................. —
Length of paid maternity leave (calendar days)..................................................... 84
Provider of maternity leave benefits................................. Employer and Government
Percent of wages paid during maternity leave.................................................... 100
Length of paid paternity leave (calendar days)........................................................ 2
Provider of paternity leave benefits.............................................................Employer
Percent of wages paid during paternity leave..................................................... 100
RIGHTS AND NORMS
Parental authority in marriage3............................................................................ 0.0
Parental authority after divorce3.......................................................................... 0.0
Female genital mutilation (% of women aged 15–49).......................................... 0.0
Existence of legislation on domestic violence3..................................................... 0.0
Existence of legislation on gender-based discrimination...................................... Yes
Inheritance rights for daughters3......................................................................... 0.0
Women’s secure access to land use, control and ownership3.............................. 0.0
Women’s access to financial services3................................................................ 0.0
Women’s secure access to non-land assets use, control and ownership3............ 0.0
Year women received right to vote.................................................................... 1942
Quota type (single/lower house).................................... Legislated Candidate Quotas
Voluntary political party quotas............................................................................. No](https://image.slidesharecdn.com/theglobalgendergapreport2015-160119013910/85/The-Global-Gender-Gap-Report-2015-167-320.jpg)

![Index over the years
SAMPLE INDEX ECONOMY EDUCATION HEALTH POLITICS
Year No. of countries Rank Score Rank Score Rank Score Rank Score Rank Score
2015 145 33 0.738 66 0.677 53 0.996 1 0.980 31 0.297
2014 142 21 0.745 45 0.715 52 0.996 1 0.980 28 0.291
2013 136 25 0.739 90 0.625 52 0.994 55 0.976 17 0.360
2012 135 33 0.721 97 0.600 54 0.994 58 0.976 23 0.313
2011 135 45 0.704 99 0.584 77 0.988 58 0.976 29 0.267
2010 134 40 0.707 90 0.599 78 0.988 57 0.976 28 0.267
2009 134 23 0.722 77 0.630 45 0.996 1 0.980 21 0.283
2008 130 35 0.709 74 0.623 52 0.995 1 0.980 28 0.238
2007 128 44 0.688 65 0.634 42 0.994 1 0.980 44 0.145
2006 115 82 0.643 92 0.499 39 0.994 1 0.980 64 0.100
2006–2015 CHANGE s 0.094 s 0.178 s 0.003 s 0.000 s 0.197
Part 2: Country Profiles
The Global Gender Gap Report 2015 | 161
1 Survey data, responses on a 1-to-7 scale (1 = worst score, 7 = best score)
2 Bracketed numbers show the range between the uncertainties, estimated to contain the true maternal mortality ratio with a 95% probability
3 Data on a 0-to-1 scale (1 = worst score, 0 = best score)
Ecuador
Selected contextual data
EMPLOYMENT AND LEADERSHIP
Female, male adult unemployment
(as % of female, male labour force)............................................................4.8, 3.7
Female, male part-time employment
(as % of total female, male employment)...............................................22.9, 11.5
Female, male workers in informal employment
(as % of non-agricultural employment)........................................................45, 55
Share of women in wage employment in the non-agricultural sector
(% of total non-agricultural employment).......................................................... 40
Average minutes spent per day on unpaid work (female, male)......................—, —
Percentage of women, men with an account
at a financial institution................................................................................41, 52
Ability of women to rise to positions of leadership1............................................. 4.2
Firms with female top managers (% of firms)....................................................... 17
Share of women on boards of listed companies (%)............................................. —
Firms with female participation in ownership (% of firms).................................... 24
Percentage of total R&D personnel (FTE) (female, male).................................—, —
EDUCATION AND TECHNOLOGY
Out-of-school children of primary school age (%) (female, male).....................36, 64
Female, male primary education attainment rate (% aged 25+)......................78, 81
Female, male secondary education attainment rate (% aged 25+)..................48, 48
Female, male tertiary education attainment rate (% aged 25+).......................14, 14
Percentage of tertiary-level students enrolled in STEM studies
(female, male)..............................................................................................28, 72
Percentage of tertiary-level graduates in STEM studies (female, male)............30, 70
Percentage of PhD graduates (female, male)...................................................54, 46
Percentage of individuals using the internet (female, male)............................—, —
Percentage of individuals using a
mobile cellular telephone (female, male)......................................................43, 40
HEALTH
Cardiovascular disease age-standardized deaths
per 100,000 (female, male)................................................................130.3, 170.3
Cancer age-standardized deaths per 100,000
excl. non-melanoma skin cancer (female, male).................................106.0, 111.7
Diabetes age-standardized deaths per 100,000 (female, male).................27.4, 24.5
Chronic respiratory disease age-standardized deaths
per 100,000 (female, male)....................................................................18.5, 29.3
HEALTH (cont’d.)
HIV/AIDS age-standardized deaths per 100,000 (female, male)...................6.3, 30.1
Malaria age-standardized deaths per 100,000 (female, male).......................0.0, 0.0
Tuberculosis age-standardized deaths per 100,000 (female, male)................2.1, 4.4
Malnutrition prev., weight for age (female, male) (% of children <5)..............5.6, 7.1
Maternal mortality ratio (per 100,000 live births)2.................................87 [58–130]
Total fertility rate (children per women)............................................................... 2.6
Adolescent fertility rate (births per 1,000 girls aged 15–19).............................. 99.6
Antenatal care coverage, at least one visit (%)..................................................... 84
Births attended by skilled health personnel (%).................................................... 95
Contraceptive prevalence, any method
(% of married or in-union women aged 15–49)................................................. 73
Existence of legislation permitting abortion
to preserve a woman’s physical health............................................................. Yes
FAMILY
Singulate mean age (years) at marriage (female, male)...................................22, 25
Early marriage (% of women aged 15–19)........................................................... 22
Mean age of women at the birth of the first child................................................. —
Length of paid maternity leave (calendar days)..................................................... 84
Provider of maternity leave benefits................................. Employer and Government
Percent of wages paid during maternity leave.................................................... 100
Length of paid paternity leave (calendar days)...................................................... 12
Provider of paternity leave benefits.............................................................Employer
Percent of wages paid during paternity leave..................................................... 100
RIGHTS AND NORMS
Parental authority in marriage3............................................................................ 0.0
Parental authority after divorce3.......................................................................... 0.0
Female genital mutilation (% of women aged 15–49).......................................... 0.0
Existence of legislation on domestic violence3..................................................... 0.0
Existence of legislation on gender-based discrimination...................................... Yes
Inheritance rights for daughters3......................................................................... 0.0
Women’s secure access to land use, control and ownership3.............................. 0.5
Women’s access to financial services3................................................................ 0.0
Women’s secure access to non-land assets use, control and ownership3............ 0.0
Year women received right to vote.................................................................... 1929
Quota type (single/lower house).................................... Legislated Candidate Quotas
Voluntary political party quotas............................................................................. No](https://image.slidesharecdn.com/theglobalgendergapreport2015-160119013910/85/The-Global-Gender-Gap-Report-2015-169-320.jpg)

![Index over the years
SAMPLE INDEX ECONOMY EDUCATION HEALTH POLITICS
Year No. of countries Rank Score Rank Score Rank Score Rank Score Rank Score
2015 145 136 0.599 135 0.441 115 0.935 97 0.971 136 0.048
2014 142 129 0.606 131 0.461 109 0.947 57 0.976 134 0.041
2013 136 125 0.594 125 0.443 108 0.920 51 0.977 128 0.035
2012 135 126 0.597 124 0.454 110 0.925 54 0.977 125 0.035
2011 135 123 0.593 122 0.457 110 0.908 52 0.977 126 0.031
2010 134 125 0.590 121 0.453 110 0.899 52 0.977 125 0.031
2009 134 126 0.586 124 0.450 107 0.900 89 0.972 129 0.023
2008 130 124 0.583 120 0.437 105 0.902 84 0.972 124 0.023
2007 128 120 0.581 120 0.421 101 0.909 83 0.972 123 0.022
2006 115 109 0.579 108 0.416 90 0.903 66 0.974 111 0.022
2006–2015 CHANGE s 0.020 s 0.026 s 0.032 t –0.003 s 0.026
Part 2: Country Profiles
The Global Gender Gap Report 2015 | 163
1 Survey data, responses on a 1-to-7 scale (1 = worst score, 7 = best score)
2 Bracketed numbers show the range between the uncertainties, estimated to contain the true maternal mortality ratio with a 95% probability
3 Data on a 0-to-1 scale (1 = worst score, 0 = best score)
Egypt
Selected contextual data
EMPLOYMENT AND LEADERSHIP
Female, male adult unemployment
(as % of female, male labour force)..........................................................24.2, 9.9
Female, male part-time employment
(as % of total female, male employment)....................................................—, —
Female, male workers in informal employment
(as % of non-agricultural employment)..........................................................7, 93
Share of women in wage employment in the non-agricultural sector
(% of total non-agricultural employment).......................................................... 19
Average minutes spent per day on unpaid work (female, male)......................—, —
Percentage of women, men with an account
at a financial institution..................................................................................9, 18
Ability of women to rise to positions of leadership1............................................. 4.2
Firms with female top managers (% of firms)....................................................... —
Share of women on boards of listed companies (%)............................................... 7
Firms with female participation in ownership (% of firms).................................... 34
Percentage of total R&D personnel (FTE) (female, male).................................—, —
EDUCATION AND TECHNOLOGY
Out-of-school children of primary school age (%) (female, male).....................76, 24
Female, male primary education attainment rate (% aged 25+).....................—, —
Female, male secondary education attainment rate (% aged 25+).................—, —
Female, male tertiary education attainment rate (% aged 25+)......................—, —
Percentage of tertiary-level students enrolled in STEM studies
(female, male)..............................................................................................32, 68
Percentage of tertiary-level graduates in STEM studies (female, male)............34, 66
Percentage of PhD graduates (female, male)...................................................45, 55
Percentage of individuals using the internet (female, male).............................19, 24
Percentage of individuals using a
mobile cellular telephone (female, male)......................................................83, 78
HEALTH
Cardiovascular disease age-standardized deaths
per 100,000 (female, male)................................................................387.7, 515.9
Cancer age-standardized deaths per 100,000
excl. non-melanoma skin cancer (female, male).................................100.5, 145.9
Diabetes age-standardized deaths per 100,000 (female, male).................12.7, 13.5
Chronic respiratory disease age-standardized deaths
per 100,000 (female, male)....................................................................31.5, 54.5
HEALTH (cont’d.)
HIV/AIDS age-standardized deaths per 100,000 (female, male).....................0.2, 0.6
Malaria age-standardized deaths per 100,000 (female, male).......................0.0, 0.0
Tuberculosis age-standardized deaths per 100,000 (female, male)................0.4, 0.8
Malnutrition prev., weight for age (female, male) (% of children <5)..............5.4, 8.1
Maternal mortality ratio (per 100,000 live births)2...................................45 [30–70]
Total fertility rate (children per women)............................................................... 2.8
Adolescent fertility rate (births per 1,000 girls aged 15–19).............................. 50.0
Antenatal care coverage, at least one visit (%)..................................................... 90
Births attended by skilled health personnel (%).................................................... 92
Contraceptive prevalence, any method
(% of married or in-union women aged 15–49)................................................. 59
Existence of legislation permitting abortion
to preserve a woman’s physical health.............................................................. No
FAMILY
Singulate mean age (years) at marriage (female, male).................................. 23, —
Early marriage (% of women aged 15–19)........................................................... 14
Mean age of women at the birth of the first child................................................. —
Length of paid maternity leave (calendar days)..................................................... 90
Provider of maternity leave benefits................................. Employer and Government
Percent of wages paid during maternity leave.................................................... 100
Length of paid paternity leave (calendar days)...................................................... —
Provider of paternity leave benefits....................................................................... —
Percent of wages paid during paternity leave....................................................... —
RIGHTS AND NORMS
Parental authority in marriage3............................................................................ 1.0
Parental authority after divorce3.......................................................................... 1.0
Female genital mutilation (% of women aged 15–49).......................................... 0.9
Existence of legislation on domestic violence3..................................................... 1.0
Existence of legislation on gender-based discrimination....................................... —
Inheritance rights for daughters3......................................................................... 1.0
Women’s secure access to land use, control and ownership3.............................. 0.5
Women’s access to financial services3................................................................ 0.5
Women’s secure access to non-land assets use, control and ownership3............ 0.5
Year women received right to vote.................................................................... 1956
Quota type (single/lower house).................................... Legislated Candidate Quotas
Voluntary political party quotas............................................................................. No](https://image.slidesharecdn.com/theglobalgendergapreport2015-160119013910/85/The-Global-Gender-Gap-Report-2015-171-320.jpg)

![Index over the years
SAMPLE INDEX ECONOMY EDUCATION HEALTH POLITICS
Year No. of countries Rank Score Rank Score Rank Score Rank Score Rank Score
2015 145 62 0.706 92 0.639 78 0.991 1 0.980 49 0.214
2014 142 84 0.686 89 0.642 82 0.988 1 0.980 80 0.136
2013 136 96 0.661 114 0.535 79 0.989 1 0.980 70 0.141
2012 135 94 0.663 112 0.543 77 0.989 1 0.980 66 0.141
2011 135 94 0.657 108 0.541 72 0.989 1 0.980 72 0.118
2010 134 90 0.660 102 0.553 79 0.988 1 0.980 73 0.118
2009 134 55 0.694 98 0.579 81 0.988 1 0.980 32 0.230
2008 130 58 0.688 97 0.563 78 0.988 1 0.980 32 0.219
2007 128 48 0.685 91 0.576 66 0.988 1 0.980 26 0.197
2006 115 39 0.684 73 0.570 59 0.988 1 0.980 24 0.197
2006–2015 CHANGE s 0.022 s 0.068 s 0.003 s 0.000 s 0.017
Part 2: Country Profiles
The Global Gender Gap Report 2015 | 165
1 Survey data, responses on a 1-to-7 scale (1 = worst score, 7 = best score)
2 Bracketed numbers show the range between the uncertainties, estimated to contain the true maternal mortality ratio with a 95% probability
3 Data on a 0-to-1 scale (1 = worst score, 0 = best score)
El Salvador
Selected contextual data
EMPLOYMENT AND LEADERSHIP
Female, male adult unemployment
(as % of female, male labour force)............................................................4.7, 6.8
Female, male part-time employment
(as % of total female, male employment)...................................................7.2, 3.4
Female, male workers in informal employment
(as % of non-agricultural employment)........................................................56, 44
Share of women in wage employment in the non-agricultural sector
(% of total non-agricultural employment).......................................................... 33
Average minutes spent per day on unpaid work (female, male)......................—, —
Percentage of women, men with an account
at a financial institution................................................................................29, 40
Ability of women to rise to positions of leadership1............................................. 3.4
Firms with female top managers (% of firms)....................................................... 21
Share of women on boards of listed companies (%)............................................. —
Firms with female participation in ownership (% of firms).................................... 40
Percentage of total R&D personnel (FTE) (female, male).................................—, —
EDUCATION AND TECHNOLOGY
Out-of-school children of primary school age (%) (female, male).....................47, 53
Female, male primary education attainment rate (% aged 25+)......................52, 60
Female, male secondary education attainment rate (% aged 25+)..................37, 44
Female, male tertiary education attainment rate (% aged 25+).......................11, 12
Percentage of tertiary-level students enrolled in STEM studies
(female, male)..............................................................................................25, 75
Percentage of tertiary-level graduates in STEM studies (female, male)............28, 72
Percentage of PhD graduates (female, male)...................................................27, 73
Percentage of individuals using the internet (female, male).............................21, 25
Percentage of individuals using a
mobile cellular telephone (female, male)......................................................77, 76
HEALTH
Cardiovascular disease age-standardized deaths
per 100,000 (female, male)................................................................155.0, 191.9
Cancer age-standardized deaths per 100,000
excl. non-melanoma skin cancer (female, male).................................112.0, 107.9
Diabetes age-standardized deaths per 100,000 (female, male).................44.0, 34.1
Chronic respiratory disease age-standardized deaths
per 100,000 (female, male)....................................................................29.8, 29.6
HEALTH (cont’d.)
HIV/AIDS age-standardized deaths per 100,000 (female, male).................12.3, 25.4
Malaria age-standardized deaths per 100,000 (female, male).......................0.0, 0.0
Tuberculosis age-standardized deaths per 100,000 (female, male)................0.9, 1.6
Malnutrition prev., weight for age (female, male) (% of children <5)..............6.7, 6.5
Maternal mortality ratio (per 100,000 live births)2.................................69 [48–100]
Total fertility rate (children per women)............................................................... 2.2
Adolescent fertility rate (births per 1,000 girls aged 15–19).............................. 63.3
Antenatal care coverage, at least one visit (%)..................................................... 94
Births attended by skilled health personnel (%).................................................. 100
Contraceptive prevalence, any method
(% of married or in-union women aged 15–49)................................................. 72
Existence of legislation permitting abortion
to preserve a woman’s physical health.............................................................. No
FAMILY
Singulate mean age (years) at marriage (female, male)...................................23, 26
Early marriage (% of women aged 15–19)........................................................... 17
Mean age of women at the birth of the first child................................................. —
Length of paid maternity leave (calendar days)..................................................... 84
Provider of maternity leave benefits........................................................Government
Percent of wages paid during maternity leave.................................................... 100
Length of paid paternity leave (calendar days)........................................................ 3
Provider of paternity leave benefits.............................................................Employer
Percent of wages paid during paternity leave..................................................... 100
RIGHTS AND NORMS
Parental authority in marriage3............................................................................ 0.0
Parental authority after divorce3.......................................................................... 0.0
Female genital mutilation (% of women aged 15–49).......................................... 0.0
Existence of legislation on domestic violence3..................................................... 0.3
Existence of legislation on gender-based discrimination....................................... —
Inheritance rights for daughters3......................................................................... 0.0
Women’s secure access to land use, control and ownership3.............................. 0.5
Women’s access to financial services3................................................................ 0.5
Women’s secure access to non-land assets use, control and ownership3............ 0.0
Year women received right to vote.................................................................... 1939
Quota type (single/lower house).................................... Legislated Candidate Quotas
Voluntary political party quotas............................................................................ Yes](https://image.slidesharecdn.com/theglobalgendergapreport2015-160119013910/85/The-Global-Gender-Gap-Report-2015-173-320.jpg)

![Index over the years
SAMPLE INDEX ECONOMY EDUCATION HEALTH POLITICS
Year No. of countries Rank Score Rank Score Rank Score Rank Score Rank Score
2015 145 21 0.749 47 0.711 39 0.999 1 0.980 30 0.308
2014 142 62 0.702 56 0.705 1 1.000 37 0.979 88 0.122
2013 136 59 0.700 41 0.723 59 0.993 34 0.979 88 0.104
2012 135 60 0.698 40 0.719 58 0.994 34 0.979 87 0.099
2011 135 52 0.698 35 0.720 38 0.997 51 0.977 87 0.099
2010 134 47 0.702 35 0.719 38 0.997 50 0.977 74 0.114
2009 134 37 0.709 36 0.705 37 0.998 41 0.979 50 0.156
2008 130 37 0.708 33 0.700 48 0.995 38 0.979 48 0.156
2007 128 30 0.701 34 0.694 20 0.999 37 0.979 51 0.131
2006 115 29 0.694 27 0.682 16 0.999 36 0.979 51 0.117
2006–2015 CHANGE s 0.055 s 0.028 t 0.000 s 0.000 s 0.192
Part 2: Country Profiles
The Global Gender Gap Report 2015 | 167
1 Survey data, responses on a 1-to-7 scale (1 = worst score, 7 = best score)
2 Bracketed numbers show the range between the uncertainties, estimated to contain the true maternal mortality ratio with a 95% probability
3 Data on a 0-to-1 scale (1 = worst score, 0 = best score)
Estonia
Selected contextual data
EMPLOYMENT AND LEADERSHIP
Female, male adult unemployment
(as % of female, male labour force)............................................................8.2, 9.1
Female, male part-time employment
(as % of total female, male employment).................................................14.9, 5.8
Female, male workers in informal employment
(as % of non-agricultural employment).......................................................—, —
Share of women in wage employment in the non-agricultural sector
(% of total non-agricultural employment).......................................................... 53
Average minutes spent per day on unpaid work (female, male)...................288, 169
Percentage of women, men with an account
at a financial institution................................................................................97, 98
Ability of women to rise to positions of leadership1............................................. 5.3
Firms with female top managers (% of firms)....................................................... 25
Share of women on boards of listed companies (%)............................................... 0
Firms with female participation in ownership (% of firms).................................... 36
Percentage of total R&D personnel (FTE) (female, male)..................................44, 56
EDUCATION AND TECHNOLOGY
Out-of-school children of primary school age (%) (female, male).....................44, 56
Female, male primary education attainment rate (% aged 25+)..................100, 100
Female, male secondary education attainment rate (% aged 25+)..............100, 100
Female, male tertiary education attainment rate (% aged 25+).......................44, 29
Percentage of tertiary-level students enrolled in STEM studies
(female, male)..............................................................................................31, 69
Percentage of tertiary-level graduates in STEM studies (female, male)............36, 64
Percentage of PhD graduates (female, male)...................................................51, 49
Percentage of individuals using the internet (female, male).............................79, 81
Percentage of individuals using a
mobile cellular telephone (female, male).....................................................—, —
HEALTH
Cardiovascular disease age-standardized deaths
per 100,000 (female, male)................................................................199.5, 387.4
Cancer age-standardized deaths per 100,000
excl. non-melanoma skin cancer (female, male).................................103.6, 216.2
Diabetes age-standardized deaths per 100,000 (female, male).....................4.3, 6.8
Chronic respiratory disease age-standardized deaths
per 100,000 (female, male)......................................................................3.8, 20.2
HEALTH (cont’d.)
HIV/AIDS age-standardized deaths per 100,000 (female, male).....................2.4, 6.0
Malaria age-standardized deaths per 100,000 (female, male).......................0.0, 0.0
Tuberculosis age-standardized deaths per 100,000 (female, male)................0.3, 3.7
Malnutrition prev., weight for age (female, male) (% of children <5)...............—, —
Maternal mortality ratio (per 100,000 live births)2.....................................11 [5–25]
Total fertility rate (children per women)............................................................... 1.6
Adolescent fertility rate (births per 1,000 girls aged 15–19).............................. 16.4
Antenatal care coverage, at least one visit (%)..................................................... 99
Births attended by skilled health personnel (%).................................................... 99
Contraceptive prevalence, any method
(% of married or in-union women aged 15–49)................................................. 63
Existence of legislation permitting abortion
to preserve a woman’s physical health............................................................. Yes
FAMILY
Singulate mean age (years) at marriage (female, male)...................................25, 27
Early marriage (% of women aged 15–19)............................................................. 5
Mean age of women at the birth of the first child................................................. 27
Length of paid maternity leave (calendar days)................................................... 140
Provider of maternity leave benefits........................................................Government
Percent of wages paid during maternity leave.................................................... 100
Length of paid paternity leave (calendar days)...................................................... 10
Provider of paternity leave benefits.........................................................Government
Percent of wages paid during paternity leave..................................................... 100
RIGHTS AND NORMS
Parental authority in marriage3............................................................................ 0.0
Parental authority after divorce3.......................................................................... 0.0
Female genital mutilation (% of women aged 15–49).......................................... 0.0
Existence of legislation on domestic violence3..................................................... 0.0
Existence of legislation on gender-based discrimination...................................... Yes
Inheritance rights for daughters3......................................................................... 0.0
Women’s secure access to land use, control and ownership3.............................. 0.0
Women’s access to financial services3................................................................ 0.0
Women’s secure access to non-land assets use, control and ownership3............ 0.0
Year women received right to vote.................................................................... 1918
Quota type (single/lower house)............................................................................ —
Voluntary political party quotas............................................................................. —](https://image.slidesharecdn.com/theglobalgendergapreport2015-160119013910/85/The-Global-Gender-Gap-Report-2015-175-320.jpg)

![Index over the years
SAMPLE INDEX ECONOMY EDUCATION HEALTH POLITICS
Year No. of countries Rank Score Rank Score Rank Score Rank Score Rank Score
2015 145 124 0.640 108 0.608 140 0.741 59 0.978 44 0.232
2014 142 127 0.614 103 0.618 139 0.711 82 0.973 70 0.156
2013 136 118 0.620 93 0.615 131 0.745 68 0.974 66 0.146
2012 135 118 0.620 85 0.622 130 0.739 72 0.974 62 0.146
2011 135 116 0.614 71 0.637 131 0.704 77 0.974 64 0.139
2010 134 121 0.602 74 0.632 129 0.700 75 0.974 82 0.102
2009 134 122 0.595 91 0.598 130 0.700 106 0.969 74 0.113
2008 130 122 0.587 96 0.565 126 0.700 101 0.969 70 0.113
2007 128 113 0.599 86 0.585 121 0.740 100 0.969 68 0.102
2006 115 100 0.595 74 0.568 108 0.739 87 0.969 61 0.102
2006–2015 CHANGE s 0.045 s 0.039 s 0.002 s 0.009 s 0.130
Part 2: Country Profiles
The Global Gender Gap Report 2015 | 169
1 Survey data, responses on a 1-to-7 scale (1 = worst score, 7 = best score)
2 Bracketed numbers show the range between the uncertainties, estimated to contain the true maternal mortality ratio with a 95% probability
3 Data on a 0-to-1 scale (1 = worst score, 0 = best score)
Ethiopia
Selected contextual data
EMPLOYMENT AND LEADERSHIP
Female, male adult unemployment
(as % of female, male labour force)............................................................6.5, 2.7
Female, male part-time employment
(as % of total female, male employment)...............................................28.4, 16.8
Female, male workers in informal employment
(as % of non-agricultural employment).......................................................—, —
Share of women in wage employment in the non-agricultural sector
(% of total non-agricultural employment).......................................................... 42
Average minutes spent per day on unpaid work (female, male)......................—, —
Percentage of women, men with an account
at a financial institution................................................................................21, 23
Ability of women to rise to positions of leadership1............................................. 4.1
Firms with female top managers (% of firms)....................................................... 14
Share of women on boards of listed companies (%)............................................. —
Firms with female participation in ownership (% of firms).................................... 35
Percentage of total R&D personnel (FTE) (female, male)..................................16, 85
EDUCATION AND TECHNOLOGY
Out-of-school children of primary school age (%) (female, male).....................53, 47
Female, male primary education attainment rate (% aged 25+)......................14, 37
Female, male secondary education attainment rate (% aged 25+)....................8, 18
Female, male tertiary education attainment rate (% aged 25+)...........................0, 2
Percentage of tertiary-level students enrolled in STEM studies
(female, male)..............................................................................................19, 81
Percentage of tertiary-level graduates in STEM studies (female, male)............17, 83
Percentage of PhD graduates (female, male)...................................................10, 90
Percentage of individuals using the internet (female, male)............................—, —
Percentage of individuals using a
mobile cellular telephone (female, male).....................................................—, —
HEALTH
Cardiovascular disease age-standardized deaths
per 100,000 (female, male)................................................................141.1, 183.9
Cancer age-standardized deaths per 100,000
excl. non-melanoma skin cancer (female, male)...................................107.2, 63.5
Diabetes age-standardized deaths per 100,000 (female, male).................24.2, 24.7
Chronic respiratory disease age-standardized deaths
per 100,000 (female, male)..................................................................11.6, 103.0
HEALTH (cont’d.)
HIV/AIDS age-standardized deaths per 100,000 (female, male).................71.3, 50.3
Malaria age-standardized deaths per 100,000 (female, male)...................19.3, 16.0
Tuberculosis age-standardized deaths per 100,000 (female, male)............24.3, 44.1
Malnutrition prev., weight for age (female, male) (% of children <5)..........25.7, 24.8
Maternal mortality ratio (per 100,000 live births)2.............................420 [240–720]
Total fertility rate (children per women)............................................................... 4.5
Adolescent fertility rate (births per 1,000 girls aged 15–19).............................. 87.0
Antenatal care coverage, at least one visit (%)..................................................... 34
Births attended by skilled health personnel (%).................................................... 10
Contraceptive prevalence, any method
(% of married or in-union women aged 15–49)................................................. 34
Existence of legislation permitting abortion
to preserve a woman’s physical health............................................................. Yes
FAMILY
Singulate mean age (years) at marriage (female, male)...................................21, 26
Early marriage (% of women aged 15–19)........................................................... 23
Mean age of women at the birth of the first child................................................. —
Length of paid maternity leave (calendar days)..................................................... 90
Provider of maternity leave benefits............................................................Employer
Percent of wages paid during maternity leave.................................................... 100
Length of paid paternity leave (calendar days)...................................................... —
Provider of paternity leave benefits....................................................................... —
Percent of wages paid during paternity leave....................................................... —
RIGHTS AND NORMS
Parental authority in marriage3............................................................................ 0.0
Parental authority after divorce3.......................................................................... 0.0
Female genital mutilation (% of women aged 15–49).......................................... 0.7
Existence of legislation on domestic violence3..................................................... 0.3
Existence of legislation on gender-based discrimination...................................... Yes
Inheritance rights for daughters3......................................................................... 0.5
Women’s secure access to land use, control and ownership3.............................. 0.5
Women’s access to financial services3................................................................ 0.5
Women’s secure access to non-land assets use, control and ownership3............ 0.5
Year women received right to vote.................................................................... 1955
Quota type (single/lower house)............................................................................ —
Voluntary political party quotas............................................................................. —](https://image.slidesharecdn.com/theglobalgendergapreport2015-160119013910/85/The-Global-Gender-Gap-Report-2015-177-320.jpg)

![Index over the years
SAMPLE INDEX ECONOMY EDUCATION HEALTH POLITICS
Year No. of countries Rank Score Rank Score Rank Score Rank Score Rank Score
2015 145 121 0.645 129 0.512 71 0.992 1 0.980 110 0.097
2014 142 122 0.629 125 0.506 70 0.992 1 0.980 136 0.036
2013 136 117 0.629 120 0.498 63 0.992 1 0.980 125 0.045
2012 135 113 0.629 117 0.497 63 0.992 1 0.980 123 0.045
2011 135 109 0.625 116 0.497 70 0.989 1 0.980 123 0.036
2010 134 108 0.626 114 0.498 70 0.989 1 0.980 121 0.036
2009 134 103 0.641 111 0.534 72 0.991 1 0.980 115 0.061
2008 130 — — — — — — — — — —
2007 128 — — — — — — — — — —
2006 115 — — — — — — — — — —
2006–2015 CHANGE s 0.004 t –0.022 s 0.002 t 0.000 s 0.036
Part 2: Country Profiles
The Global Gender Gap Report 2015 | 171
1 Survey data, responses on a 1-to-7 scale (1 = worst score, 7 = best score)
2 Bracketed numbers show the range between the uncertainties, estimated to contain the true maternal mortality ratio with a 95% probability
3 Data on a 0-to-1 scale (1 = worst score, 0 = best score)
Fiji
Selected contextual data
EMPLOYMENT AND LEADERSHIP
Female, male adult unemployment
(as % of female, male labour force)..........................................................12.9, 6.4
Female, male part-time employment
(as % of total female, male employment)....................................................—, —
Female, male workers in informal employment
(as % of non-agricultural employment).......................................................—, —
Share of women in wage employment in the non-agricultural sector
(% of total non-agricultural employment).......................................................... 30
Average minutes spent per day on unpaid work (female, male)......................—, —
Percentage of women, men with an account
at a financial institution...............................................................................—, —
Ability of women to rise to positions of leadership1.............................................. —
Firms with female top managers (% of firms)....................................................... —
Share of women on boards of listed companies (%)............................................. —
Firms with female participation in ownership (% of firms).................................... 49
Percentage of total R&D personnel (FTE) (female, male).................................—, —
EDUCATION AND TECHNOLOGY
Out-of-school children of primary school age (%) (female, male).......................9, 91
Female, male primary education attainment rate (% aged 25+)......................78, 81
Female, male secondary education attainment rate (% aged 25+)..................58, 58
Female, male tertiary education attainment rate (% aged 25+).......................11, 13
Percentage of tertiary-level students enrolled in STEM studies
(female, male).............................................................................................—, —
Percentage of tertiary-level graduates in STEM studies (female, male)...........—, —
Percentage of PhD graduates (female, male)..................................................—, —
Percentage of individuals using the internet (female, male)............................—, —
Percentage of individuals using a
mobile cellular telephone (female, male).....................................................—, —
HEALTH
Cardiovascular disease age-standardized deaths
per 100,000 (female, male)................................................................264.0, 494.1
Cancer age-standardized deaths per 100,000
excl. non-melanoma skin cancer (female, male)...................................119.0, 76.0
Diabetes age-standardized deaths per 100,000 (female, male).............134.7, 170.1
Chronic respiratory disease age-standardized deaths
per 100,000 (female, male)....................................................................29.9, 75.0
HEALTH (cont’d.)
HIV/AIDS age-standardized deaths per 100,000 (female, male).....................1.0, 9.7
Malaria age-standardized deaths per 100,000 (female, male).......................0.0, 0.0
Tuberculosis age-standardized deaths per 100,000 (female, male)................2.0, 2.4
Malnutrition prev., weight for age (female, male) (% of children <5)..............5.7, 4.9
Maternal mortality ratio (per 100,000 live births)2...................................59 [35–95]
Total fertility rate (children per women)............................................................... 2.6
Adolescent fertility rate (births per 1,000 girls aged 15–19).............................. 31.1
Antenatal care coverage, at least one visit (%)..................................................... 98
Births attended by skilled health personnel (%).................................................... 99
Contraceptive prevalence, any method
(% of married or in-union women aged 15–49)................................................. —
Existence of legislation permitting abortion
to preserve a woman’s physical health............................................................. Yes
FAMILY
Singulate mean age (years) at marriage (female, male)...................................23, 26
Early marriage (% of women aged 15–19)........................................................... 10
Mean age of women at the birth of the first child................................................. —
Length of paid maternity leave (calendar days)..................................................... 84
Provider of maternity leave benefits............................................................Employer
Percent of wages paid during maternity leave.................................................... 100
Length of paid paternity leave (calendar days)...................................................... —
Provider of paternity leave benefits....................................................................... —
Percent of wages paid during paternity leave....................................................... —
RIGHTS AND NORMS
Parental authority in marriage3............................................................................ 0.0
Parental authority after divorce3.......................................................................... 0.0
Female genital mutilation (% of women aged 15–49).......................................... 0.0
Existence of legislation on domestic violence3..................................................... 0.3
Existence of legislation on gender-based discrimination....................................... —
Inheritance rights for daughters3......................................................................... 0.5
Women’s secure access to land use, control and ownership3.............................. 0.5
Women’s access to financial services3................................................................ 0.5
Women’s secure access to non-land assets use, control and ownership3............ 0.5
Year women received right to vote.................................................................... 1963
Quota type (single/lower house)............................................................................ —
Voluntary political party quotas............................................................................. —](https://image.slidesharecdn.com/theglobalgendergapreport2015-160119013910/85/The-Global-Gender-Gap-Report-2015-179-320.jpg)

![Index over the years
SAMPLE INDEX ECONOMY EDUCATION HEALTH POLITICS
Year No. of countries Rank Score Rank Score Rank Score Rank Score Rank Score
2015 145 3 0.850 8 0.815 1 1.000 1 0.980 2 0.607
2014 142 2 0.845 21 0.786 1 1.000 52 0.979 2 0.616
2013 136 2 0.842 19 0.773 1 1.000 1 0.980 2 0.616
2012 135 2 0.845 14 0.785 1 1.000 1 0.980 2 0.616
2011 135 3 0.838 12 0.768 26 0.999 1 0.980 2 0.606
2010 134 3 0.826 16 0.757 28 0.999 1 0.980 2 0.569
2009 134 2 0.825 15 0.750 1 1.000 1 0.980 2 0.571
2008 130 2 0.820 19 0.741 1 1.000 1 0.980 1 0.558
2007 128 3 0.804 22 0.723 21 0.999 1 0.980 2 0.517
2006 115 3 0.796 8 0.734 18 0.999 1 0.980 3 0.470
2006–2015 CHANGE s 0.054 s 0.080 s 0.001 s 0.000 s 0.137
Part 2: Country Profiles
The Global Gender Gap Report 2015 | 173
1 Survey data, responses on a 1-to-7 scale (1 = worst score, 7 = best score)
2 Bracketed numbers show the range between the uncertainties, estimated to contain the true maternal mortality ratio with a 95% probability
3 Data on a 0-to-1 scale (1 = worst score, 0 = best score)
Finland
Selected contextual data
EMPLOYMENT AND LEADERSHIP
Female, male adult unemployment
(as % of female, male labour force)............................................................7.6, 8.7
Female, male part-time employment
(as % of total female, male employment).................................................16.4, 9.5
Female, male workers in informal employment
(as % of non-agricultural employment).......................................................—, —
Share of women in wage employment in the non-agricultural sector
(% of total non-agricultural employment).......................................................... 52
Average minutes spent per day on unpaid work (female, male)...................232, 159
Percentage of women, men with an account
at a financial institution............................................................................100, 100
Ability of women to rise to positions of leadership1............................................. 5.8
Firms with female top managers (% of firms)....................................................... —
Share of women on boards of listed companies (%)............................................. 14
Firms with female participation in ownership (% of firms).................................... —
Percentage of total R&D personnel (FTE) (female, male).................................—, —
EDUCATION AND TECHNOLOGY
Out-of-school children of primary school age (%) (female, male).....................32, 68
Female, male primary education attainment rate (% aged 25+)..................100, 100
Female, male secondary education attainment rate (% aged 25+)..............100, 100
Female, male tertiary education attainment rate (% aged 25+).......................36, 30
Percentage of tertiary-level students enrolled in STEM studies
(female, male)..............................................................................................24, 76
Percentage of tertiary-level graduates in STEM studies (female, male)............27, 73
Percentage of PhD graduates (female, male)...................................................51, 49
Percentage of individuals using the internet (female, male).............................91, 92
Percentage of individuals using a
mobile cellular telephone (female, male).....................................................—, —
HEALTH
Cardiovascular disease age-standardized deaths
per 100,000 (female, male)................................................................104.1, 197.3
Cancer age-standardized deaths per 100,000
excl. non-melanoma skin cancer (female, male)...................................86.9, 124.5
Diabetes age-standardized deaths per 100,000 (female, male).....................3.0, 5.6
Chronic respiratory disease age-standardized deaths
per 100,000 (female, male)......................................................................8.1, 19.8
HEALTH (cont’d.)
HIV/AIDS age-standardized deaths per 100,000 (female, male).....................0.0, 0.1
Malaria age-standardized deaths per 100,000 (female, male).......................0.0, 0.0
Tuberculosis age-standardized deaths per 100,000 (female, male)................0.3, 0.6
Malnutrition prev., weight for age (female, male) (% of children <5)...............—, —
Maternal mortality ratio (per 100,000 live births)2.........................................4 [2–6]
Total fertility rate (children per women)............................................................... 1.9
Adolescent fertility rate (births per 1,000 girls aged 15–19)................................ 7.6
Antenatal care coverage, at least one visit (%)..................................................... —
Births attended by skilled health personnel (%).................................................. 100
Contraceptive prevalence, any method
(% of married or in-union women aged 15–49)................................................. 77
Existence of legislation permitting abortion
to preserve a woman’s physical health............................................................. Yes
FAMILY
Singulate mean age (years) at marriage (female, male)...................................30, 32
Early marriage (% of women aged 15–19)............................................................. 1
Mean age of women at the birth of the first child................................................. 29
Length of paid maternity leave (calendar days)................................................... 147
Provider of maternity leave benefits........................................................Government
Percent of wages paid during maternity leave...................................................... 58
Length of paid paternity leave (calendar days)...................................................... 24
Provider of paternity leave benefits.........................................................Government
Percent of wages paid during paternity leave....................................................... 58
RIGHTS AND NORMS
Parental authority in marriage3............................................................................ 0.0
Parental authority after divorce3.......................................................................... 0.0
Female genital mutilation (% of women aged 15–49).......................................... 0.0
Existence of legislation on domestic violence3..................................................... 0.3
Existence of legislation on gender-based discrimination...................................... Yes
Inheritance rights for daughters3......................................................................... 0.0
Women’s secure access to land use, control and ownership3.............................. 0.0
Women’s access to financial services3................................................................ 0.0
Women’s secure access to non-land assets use, control and ownership3............ 0.0
Year women received right to vote.................................................................... 1906
Quota type (single/lower house)............................................................................ —
Voluntary political party quotas............................................................................. —](https://image.slidesharecdn.com/theglobalgendergapreport2015-160119013910/85/The-Global-Gender-Gap-Report-2015-181-320.jpg)

![Index over the years
SAMPLE INDEX ECONOMY EDUCATION HEALTH POLITICS
Year No. of countries Rank Score Rank Score Rank Score Rank Score Rank Score
2015 145 15 0.761 56 0.699 1 1.000 1 0.980 19 0.365
2014 142 16 0.759 57 0.704 1 1.000 1 0.980 20 0.352
2013 136 45 0.709 67 0.669 1 1.000 1 0.980 45 0.187
2012 135 57 0.698 62 0.669 1 1.000 1 0.980 63 0.145
2011 135 48 0.702 61 0.659 1 1.000 1 0.980 46 0.169
2010 134 46 0.703 60 0.661 1 1.000 1 0.980 47 0.169
2009 134 18 0.733 61 0.659 1 1.000 1 0.980 16 0.294
2008 130 15 0.734 53 0.663 1 1.000 1 0.980 18 0.294
2007 128 51 0.682 61 0.646 1 1.000 1 0.980 67 0.104
2006 115 70 0.652 88 0.525 1 1.000 1 0.980 60 0.104
2006–2015 CHANGE s 0.109 s 0.174 t 0.000 s 0.000 s 0.261
Part 2: Country Profiles
The Global Gender Gap Report 2015 | 175
1 Survey data, responses on a 1-to-7 scale (1 = worst score, 7 = best score)
2 Bracketed numbers show the range between the uncertainties, estimated to contain the true maternal mortality ratio with a 95% probability
3 Data on a 0-to-1 scale (1 = worst score, 0 = best score)
France
Selected contextual data
EMPLOYMENT AND LEADERSHIP
Female, male adult unemployment
(as % of female, male labour force)..........................................................9.7, 10.0
Female, male part-time employment
(as % of total female, male employment).................................................30.2, 6.8
Female, male workers in informal employment
(as % of non-agricultural employment).......................................................—, —
Share of women in wage employment in the non-agricultural sector
(% of total non-agricultural employment).......................................................... 50
Average minutes spent per day on unpaid work (female, male)...................233, 143
Percentage of women, men with an account
at a financial institution................................................................................95, 98
Ability of women to rise to positions of leadership1............................................. 4.2
Firms with female top managers (% of firms)....................................................... —
Share of women on boards of listed companies (%)............................................. 18
Firms with female participation in ownership (% of firms).................................... —
Percentage of total R&D personnel (FTE) (female, male)..................................30, 70
EDUCATION AND TECHNOLOGY
Out-of-school children of primary school age (%) (female, male).....................31, 69
Female, male primary education attainment rate (% aged 25+)......................98, 99
Female, male secondary education attainment rate (% aged 25+)..................78, 83
Female, male tertiary education attainment rate (% aged 25+).......................26, 26
Percentage of tertiary-level students enrolled in STEM studies
(female, male)..............................................................................................30, 70
Percentage of tertiary-level graduates in STEM studies (female, male)............30, 70
Percentage of PhD graduates (female, male)...................................................44, 56
Percentage of individuals using the internet (female, male).............................80, 84
Percentage of individuals using a
mobile cellular telephone (female, male).....................................................—, —
HEALTH
Cardiovascular disease age-standardized deaths
per 100,000 (female, male)..................................................................65.0, 111.8
Cancer age-standardized deaths per 100,000
excl. non-melanoma skin cancer (female, male)...................................95.5, 179.8
Diabetes age-standardized deaths per 100,000 (female, male).....................5.6, 9.0
Chronic respiratory disease age-standardized deaths
per 100,000 (female, male)......................................................................8.1, 18.7
HEALTH (cont’d.)
HIV/AIDS age-standardized deaths per 100,000 (female, male).....................0.3, 0.9
Malaria age-standardized deaths per 100,000 (female, male).......................0.0, 0.0
Tuberculosis age-standardized deaths per 100,000 (female, male)................0.2, 0.5
Malnutrition prev., weight for age (female, male) (% of children <5)...............—, —
Maternal mortality ratio (per 100,000 live births)2.....................................12 [8–19]
Total fertility rate (children per women)............................................................... 2.0
Adolescent fertility rate (births per 1,000 girls aged 15–19)................................ 9.4
Antenatal care coverage, at least one visit (%)................................................... 100
Births attended by skilled health personnel (%).................................................... 97
Contraceptive prevalence, any method
(% of married or in-union women aged 15–49)................................................. 76
Existence of legislation permitting abortion
to preserve a woman’s physical health............................................................. Yes
FAMILY
Singulate mean age (years) at marriage (female, male)...................................32, 33
Early marriage (% of women aged 15–19)............................................................. 1
Mean age of women at the birth of the first child................................................. 29
Length of paid maternity leave (calendar days)................................................... 112
Provider of maternity leave benefits........................................................Government
Percent of wages paid during maternity leave...................................................... 73
Length of paid paternity leave (calendar days)...................................................... 11
Provider of paternity leave benefits.........................................................Government
Percent of wages paid during paternity leave....................................................... 73
RIGHTS AND NORMS
Parental authority in marriage3............................................................................ 0.0
Parental authority after divorce3.......................................................................... 0.0
Female genital mutilation (% of women aged 15–49).......................................... 0.0
Existence of legislation on domestic violence3..................................................... 0.0
Existence of legislation on gender-based discrimination....................................... —
Inheritance rights for daughters3......................................................................... 0.0
Women’s secure access to land use, control and ownership3.............................. 0.0
Women’s access to financial services3................................................................ 0.0
Women’s secure access to non-land assets use, control and ownership3............ 0.0
Year women received right to vote.................................................................... 1944
Quota type (single/lower house).................................... Legislated Candidate Quotas
Voluntary political party quotas............................................................................ Yes](https://image.slidesharecdn.com/theglobalgendergapreport2015-160119013910/85/The-Global-Gender-Gap-Report-2015-183-320.jpg)

![Index over the years
SAMPLE INDEX ECONOMY EDUCATION HEALTH POLITICS
Year No. of countries Rank Score Rank Score Rank Score Rank Score Rank Score
2015 145 98 0.674 58 0.697 118 0.926 85 0.973 108 0.098
2014 142 — — — — — — — — — —
2013 136 — — — — — — — — — —
2012 135 93 0.663 18 0.772 127 0.763 1 0.980 70 0.137
2011 135 77 0.676 19 0.756 122 0.832 1 0.980 66 0.137
2010 134 75 0.676 14 0.759 121 0.829 1 0.980 62 0.138
2009 134 75 0.675 23 0.741 119 0.853 1 0.980 68 0.127
2008 130 85 0.662 32 0.706 118 0.836 1 0.980 63 0.127
2007 128 95 0.642 37 0.687 117 0.808 1 0.980 73 0.094
2006 115 79 0.645 25 0.688 106 0.809 64 0.974 55 0.109
2006–2015 CHANGE s 0.029 s 0.010 s 0.117 t –0.001 t –0.011
Part 2: Country Profiles
The Global Gender Gap Report 2015 | 177
1 Survey data, responses on a 1-to-7 scale (1 = worst score, 7 = best score)
2 Bracketed numbers show the range between the uncertainties, estimated to contain the true maternal mortality ratio with a 95% probability
3 Data on a 0-to-1 scale (1 = worst score, 0 = best score)
Gambia, The
Selected contextual data
EMPLOYMENT AND LEADERSHIP
Female, male adult unemployment
(as % of female, male labour force).............................................................—, —
Female, male part-time employment
(as % of total female, male employment)....................................................—, —
Female, male workers in informal employment
(as % of non-agricultural employment).......................................................—, —
Share of women in wage employment in the non-agricultural sector
(% of total non-agricultural employment).......................................................... 32
Average minutes spent per day on unpaid work (female, male)......................—, —
Percentage of women, men with an account
at a financial institution...............................................................................—, —
Ability of women to rise to positions of leadership1............................................. 5.0
Firms with female top managers (% of firms)....................................................... —
Share of women on boards of listed companies (%)............................................. —
Firms with female participation in ownership (% of firms).................................... 21
Percentage of total R&D personnel (FTE) (female, male)....................................5, 95
EDUCATION AND TECHNOLOGY
Out-of-school children of primary school age (%) (female, male).....................46, 54
Female, male primary education attainment rate (% aged 25+).....................—, —
Female, male secondary education attainment rate (% aged 25+).................—, —
Female, male tertiary education attainment rate (% aged 25+)......................—, —
Percentage of tertiary-level students enrolled in STEM studies
(female, male).............................................................................................—, —
Percentage of tertiary-level graduates in STEM studies (female, male)...........—, —
Percentage of PhD graduates (female, male)..................................................—, —
Percentage of individuals using the internet (female, male)............................—, —
Percentage of individuals using a
mobile cellular telephone (female, male).....................................................—, —
HEALTH
Cardiovascular disease age-standardized deaths
per 100,000 (female, male)................................................................292.0, 306.2
Cancer age-standardized deaths per 100,000
excl. non-melanoma skin cancer (female, male).....................................56.6, 73.3
Diabetes age-standardized deaths per 100,000 (female, male).................55.7, 41.3
Chronic respiratory disease age-standardized deaths
per 100,000 (female, male)....................................................................28.1, 49.3
HEALTH (cont’d.)
HIV/AIDS age-standardized deaths per 100,000 (female, male).................25.4, 40.6
Malaria age-standardized deaths per 100,000 (female, male)...................68.5, 67.4
Tuberculosis age-standardized deaths per 100,000 (female, male)..........59.3, 123.3
Malnutrition prev., weight for age (female, male) (% of children <5)..........16.9, 17.8
Maternal mortality ratio (per 100,000 live births)2.............................430 [210–930]
Total fertility rate (children per women)............................................................... 5.8
Adolescent fertility rate (births per 1,000 girls aged 15–19).............................. 88.0
Antenatal care coverage, at least one visit (%)..................................................... 86
Births attended by skilled health personnel (%).................................................... 57
Contraceptive prevalence, any method
(% of married or in-union women aged 15–49)................................................... 9
Existence of legislation permitting abortion
to preserve a woman’s physical health............................................................. Yes
FAMILY
Singulate mean age (years) at marriage (female, male)...................................20, 28
Early marriage (% of women aged 15–19)........................................................... 25
Mean age of women at the birth of the first child................................................. —
Length of paid maternity leave (calendar days)..................................................... —
Provider of maternity leave benefits...................................................................... —
Percent of wages paid during maternity leave...................................................... —
Length of paid paternity leave (calendar days)...................................................... —
Provider of paternity leave benefits....................................................................... —
Percent of wages paid during paternity leave....................................................... —
RIGHTS AND NORMS
Parental authority in marriage3............................................................................ 0.0
Parental authority after divorce3.......................................................................... 0.0
Female genital mutilation (% of women aged 15–49).......................................... 0.8
Existence of legislation on domestic violence3..................................................... 1.0
Existence of legislation on gender-based discrimination....................................... —
Inheritance rights for daughters3......................................................................... 1.0
Women’s secure access to land use, control and ownership3.............................. 1.0
Women’s access to financial services3................................................................ 0.5
Women’s secure access to non-land assets use, control and ownership3............ 1.0
Year women received right to vote.................................................................... 1960
Quota type (single/lower house)............................................................................ —
Voluntary political party quotas............................................................................. —](https://image.slidesharecdn.com/theglobalgendergapreport2015-160119013910/85/The-Global-Gender-Gap-Report-2015-185-320.jpg)

![Index over the years
SAMPLE INDEX ECONOMY EDUCATION HEALTH POLITICS
Year No. of countries Rank Score Rank Score Rank Score Rank Score Rank Score
2015 145 82 0.687 60 0.692 31 1.000 120 0.967 114 0.089
2014 142 85 0.685 66 0.675 80 0.989 115 0.967 94 0.111
2013 136 86 0.675 64 0.674 89 0.979 126 0.955 97 0.091
2012 135 85 0.669 57 0.677 89 0.979 129 0.950 109 0.071
2011 135 86 0.662 54 0.672 67 0.990 128 0.948 120 0.039
2010 134 88 0.660 54 0.675 87 0.981 129 0.944 119 0.039
2009 134 83 0.668 54 0.675 82 0.985 131 0.939 103 0.073
2008 130 82 0.665 69 0.635 1 1.000 127 0.939 92 0.088
2007 128 67 0.666 69 0.630 28 0.998 125 0.933 66 0.104
2006 115 54 0.670 41 0.656 28 0.997 115 0.923 59 0.104
2006–2015 CHANGE s 0.017 s 0.036 s 0.003 s 0.044 t –0.015
Part 2: Country Profiles
The Global Gender Gap Report 2015 | 179
1 Survey data, responses on a 1-to-7 scale (1 = worst score, 7 = best score)
2 Bracketed numbers show the range between the uncertainties, estimated to contain the true maternal mortality ratio with a 95% probability
3 Data on a 0-to-1 scale (1 = worst score, 0 = best score)
Georgia
Selected contextual data
EMPLOYMENT AND LEADERSHIP
Female, male adult unemployment
(as % of female, male labour force)........................................................12.3, 16.5
Female, male part-time employment
(as % of total female, male employment)...............................................50.5, 36.5
Female, male workers in informal employment
(as % of non-agricultural employment).......................................................—, —
Share of women in wage employment in the non-agricultural sector
(% of total non-agricultural employment).......................................................... 46
Average minutes spent per day on unpaid work (female, male)......................—, —
Percentage of women, men with an account
at a financial institution................................................................................40, 40
Ability of women to rise to positions of leadership1............................................. 4.8
Firms with female top managers (% of firms)....................................................... 32
Share of women on boards of listed companies (%)............................................. —
Firms with female participation in ownership (% of firms).................................... 34
Percentage of total R&D personnel (FTE) (female, male).................................—, —
EDUCATION AND TECHNOLOGY
Out-of-school children of primary school age (%) (female, male).....................38, 62
Female, male primary education attainment rate (% aged 25+)......................98, 99
Female, male secondary education attainment rate (% aged 25+)..................95, 97
Female, male tertiary education attainment rate (% aged 25+).......................30, 31
Percentage of tertiary-level students enrolled in STEM studies
(female, male)..............................................................................................32, 68
Percentage of tertiary-level graduates in STEM studies (female, male)............38, 62
Percentage of PhD graduates (female, male)...................................................54, 46
Percentage of individuals using the internet (female, male).............................42, 45
Percentage of individuals using a
mobile cellular telephone (female, male).....................................................—, —
HEALTH
Cardiovascular disease age-standardized deaths
per 100,000 (female, male)................................................................349.3, 545.3
Cancer age-standardized deaths per 100,000
excl. non-melanoma skin cancer (female, male)...................................76.9, 134.4
Diabetes age-standardized deaths per 100,000 (female, male).....................7.4, 9.7
Chronic respiratory disease age-standardized deaths
per 100,000 (female, male)....................................................................15.7, 39.3
HEALTH (cont’d.)
HIV/AIDS age-standardized deaths per 100,000 (female, male).....................1.4, 5.8
Malaria age-standardized deaths per 100,000 (female, male).......................0.0, 0.0
Tuberculosis age-standardized deaths per 100,000 (female, male)................1.0, 6.4
Malnutrition prev., weight for age (female, male) (% of children <5)..............1.0, 1.3
Maternal mortality ratio (per 100,000 live births)2...................................41 [23–77]
Total fertility rate (children per women)............................................................... 1.8
Adolescent fertility rate (births per 1,000 girls aged 15–19).............................. 39.5
Antenatal care coverage, at least one visit (%)..................................................... 98
Births attended by skilled health personnel (%).................................................. 100
Contraceptive prevalence, any method
(% of married or in-union women aged 15–49)................................................. 53
Existence of legislation permitting abortion
to preserve a woman’s physical health............................................................. Yes
FAMILY
Singulate mean age (years) at marriage (female, male).................................. 23, —
Early marriage (% of women aged 15–19)........................................................... 14
Mean age of women at the birth of the first child................................................. —
Length of paid maternity leave (calendar days)................................................... 183
Provider of maternity leave benefits........................................................Government
Percent of wages paid during maternity leave.................................................... 100
Length of paid paternity leave (calendar days)...................................................... —
Provider of paternity leave benefits....................................................................... —
Percent of wages paid during paternity leave....................................................... —
RIGHTS AND NORMS
Parental authority in marriage3............................................................................ 0.5
Parental authority after divorce3.......................................................................... 0.5
Female genital mutilation (% of women aged 15–49).......................................... 0.0
Existence of legislation on domestic violence3..................................................... 0.3
Existence of legislation on gender-based discrimination...................................... Yes
Inheritance rights for daughters3......................................................................... 0.5
Women’s secure access to land use, control and ownership3.............................. 0.5
Women’s access to financial services3................................................................ 0.0
Women’s secure access to non-land assets use, control and ownership3............ 0.5
Year women received right to vote...........................................................1918, 1921
Quota type (single/lower house)............................................................................ —
Voluntary political party quotas............................................................................. —](https://image.slidesharecdn.com/theglobalgendergapreport2015-160119013910/85/The-Global-Gender-Gap-Report-2015-187-320.jpg)

![Index over the years
SAMPLE INDEX ECONOMY EDUCATION HEALTH POLITICS
Year No. of countries Rank Score Rank Score Rank Score Rank Score Rank Score
2015 145 11 0.779 38 0.737 88 0.987 56 0.979 11 0.413
2014 142 12 0.778 34 0.739 34 0.999 67 0.974 11 0.400
2013 136 14 0.758 46 0.712 86 0.982 49 0.978 15 0.361
2012 135 13 0.763 31 0.740 83 0.985 52 0.978 15 0.349
2011 135 11 0.759 32 0.727 50 0.994 49 0.978 15 0.336
2010 134 13 0.753 37 0.714 51 0.995 47 0.978 15 0.325
2009 134 12 0.745 37 0.696 49 0.995 60 0.978 13 0.311
2008 130 11 0.739 45 0.688 49 0.995 57 0.978 16 0.296
2007 128 7 0.762 29 0.700 35 0.995 56 0.978 6 0.374
2006 115 5 0.752 32 0.669 31 0.995 36 0.979 6 0.366
2006–2015 CHANGE s 0.027 s 0.068 t –0.009 t –0.001 s 0.048
Part 2: Country Profiles
The Global Gender Gap Report 2015 | 181
1 Survey data, responses on a 1-to-7 scale (1 = worst score, 7 = best score)
2 Bracketed numbers show the range between the uncertainties, estimated to contain the true maternal mortality ratio with a 95% probability
3 Data on a 0-to-1 scale (1 = worst score, 0 = best score)
Germany
Selected contextual data
EMPLOYMENT AND LEADERSHIP
Female, male adult unemployment
(as % of female, male labour force)............................................................4.9, 5.6
Female, male part-time employment
(as % of total female, male employment).................................................38.4, 8.9
Female, male workers in informal employment
(as % of non-agricultural employment).......................................................—, —
Share of women in wage employment in the non-agricultural sector
(% of total non-agricultural employment).......................................................... 48
Average minutes spent per day on unpaid work (female, male)...................269, 164
Percentage of women, men with an account
at a financial institution................................................................................99, 98
Ability of women to rise to positions of leadership1............................................. 4.6
Firms with female top managers (% of firms)....................................................... —
Share of women on boards of listed companies (%)............................................... 3
Firms with female participation in ownership (% of firms).................................... 20
Percentage of total R&D personnel (FTE) (female, male)..................................27, 73
EDUCATION AND TECHNOLOGY
Out-of-school children of primary school age (%) (female, male).....................46, 54
Female, male primary education attainment rate (% aged 25+)..................100, 100
Female, male secondary education attainment rate (% aged 25+)..................96, 97
Female, male tertiary education attainment rate (% aged 25+).......................22, 30
Percentage of tertiary-level students enrolled in STEM studies
(female, male)..............................................................................................26, 74
Percentage of tertiary-level graduates in STEM studies (female, male)............23, 77
Percentage of PhD graduates (female, male)...................................................45, 55
Percentage of individuals using the internet (female, male).............................82, 87
Percentage of individuals using a
mobile cellular telephone (female, male).....................................................—, —
HEALTH
Cardiovascular disease age-standardized deaths
per 100,000 (female, male)................................................................116.2, 171.6
Cancer age-standardized deaths per 100,000
excl. non-melanoma skin cancer (female, male)...................................98.9, 152.3
Diabetes age-standardized deaths per 100,000 (female, male)...................8.6, 11.9
Chronic respiratory disease age-standardized deaths
per 100,000 (female, male)....................................................................14.1, 27.1
HEALTH (cont’d.)
HIV/AIDS age-standardized deaths per 100,000 (female, male).....................0.2, 0.7
Malaria age-standardized deaths per 100,000 (female, male).......................0.0, 0.0
Tuberculosis age-standardized deaths per 100,000 (female, male)................0.1, 0.2
Malnutrition prev., weight for age (female, male) (% of children <5)..............1.3, 0.9
Maternal mortality ratio (per 100,000 live births)2.........................................7 [5–9]
Total fertility rate (children per women)............................................................... 1.4
Adolescent fertility rate (births per 1,000 girls aged 15–19)................................ 7.9
Antenatal care coverage, at least one visit (%)..................................................... —
Births attended by skilled health personnel (%).................................................... 99
Contraceptive prevalence, any method
(% of married or in-union women aged 15–49)................................................. 66
Existence of legislation permitting abortion
to preserve a woman’s physical health............................................................. Yes
FAMILY
Singulate mean age (years) at marriage (female, male)...................................32, 34
Early marriage (% of women aged 15–19)............................................................. 0
Mean age of women at the birth of the first child................................................. 29
Length of paid maternity leave (calendar days)..................................................... 98
Provider of maternity leave benefits................................. Employer and Government
Percent of wages paid during maternity leave.................................................... 100
Length of paid paternity leave (calendar days)...................................................... —
Provider of paternity leave benefits....................................................................... —
Percent of wages paid during paternity leave....................................................... —
RIGHTS AND NORMS
Parental authority in marriage3............................................................................ 0.0
Parental authority after divorce3.......................................................................... 0.0
Female genital mutilation (% of women aged 15–49).......................................... 0.0
Existence of legislation on domestic violence3..................................................... 0.5
Existence of legislation on gender-based discrimination...................................... Yes
Inheritance rights for daughters3......................................................................... 0.0
Women’s secure access to land use, control and ownership3.............................. 0.0
Women’s access to financial services3................................................................ 0.0
Women’s secure access to non-land assets use, control and ownership3............ 0.0
Year women received right to vote.................................................................... 1918
Quota type (single/lower house)............................................................................ —
Voluntary political party quotas............................................................................. —](https://image.slidesharecdn.com/theglobalgendergapreport2015-160119013910/85/The-Global-Gender-Gap-Report-2015-189-320.jpg)

![Index over the years
SAMPLE INDEX ECONOMY EDUCATION HEALTH POLITICS
Year No. of countries Rank Score Rank Score Rank Score Rank Score Rank Score
2015 145 63 0.704 13 0.808 119 0.924 87 0.973 96 0.112
2014 142 101 0.666 64 0.677 117 0.910 116 0.967 97 0.110
2013 136 76 0.681 24 0.766 111 0.897 104 0.967 95 0.094
2012 135 71 0.678 26 0.754 113 0.906 105 0.967 100 0.084
2011 135 70 0.681 17 0.758 111 0.903 104 0.967 91 0.096
2010 134 70 0.678 15 0.758 111 0.891 103 0.967 88 0.096
2009 134 80 0.670 13 0.755 112 0.886 111 0.967 101 0.073
2008 130 77 0.668 14 0.745 110 0.875 106 0.967 94 0.085
2007 128 63 0.673 3 0.781 106 0.871 105 0.967 91 0.071
2006 115 58 0.665 5 0.753 94 0.868 89 0.969 80 0.071
2006–2015 CHANGE s 0.039 s 0.055 s 0.056 s 0.004 s 0.041
Part 2: Country Profiles
The Global Gender Gap Report 2015 | 183
1 Survey data, responses on a 1-to-7 scale (1 = worst score, 7 = best score)
2 Bracketed numbers show the range between the uncertainties, estimated to contain the true maternal mortality ratio with a 95% probability
3 Data on a 0-to-1 scale (1 = worst score, 0 = best score)
Ghana
Selected contextual data
EMPLOYMENT AND LEADERSHIP
Female, male adult unemployment
(as % of female, male labour force)............................................................4.4, 3.9
Female, male part-time employment
(as % of total female, male employment)....................................................—, —
Female, male workers in informal employment
(as % of non-agricultural employment).......................................................—, —
Share of women in wage employment in the non-agricultural sector
(% of total non-agricultural employment).......................................................... 32
Average minutes spent per day on unpaid work (female, male)......................—, —
Percentage of women, men with an account
at a financial institution................................................................................34, 35
Ability of women to rise to positions of leadership1............................................. 4.5
Firms with female top managers (% of firms)....................................................... 15
Share of women on boards of listed companies (%)............................................. —
Firms with female participation in ownership (% of firms).................................... 32
Percentage of total R&D personnel (FTE) (female, male)..................................21, 79
EDUCATION AND TECHNOLOGY
Out-of-school children of primary school age (%) (female, male).....................48, 52
Female, male primary education attainment rate (% aged 25+)......................57, 73
Female, male secondary education attainment rate (% aged 25+)..................45, 65
Female, male tertiary education attainment rate (% aged 25+)...........................2, 5
Percentage of tertiary-level students enrolled in STEM studies
(female, male)..............................................................................................21, 79
Percentage of tertiary-level graduates in STEM studies (female, male)............23, 77
Percentage of PhD graduates (female, male)...................................................19, 81
Percentage of individuals using the internet (female, male)............................—, —
Percentage of individuals using a
mobile cellular telephone (female, male)..................................................... —, 48
HEALTH
Cardiovascular disease age-standardized deaths
per 100,000 (female, male)................................................................350.0, 320.0
Cancer age-standardized deaths per 100,000
excl. non-melanoma skin cancer (female, male).....................................72.6, 93.3
Diabetes age-standardized deaths per 100,000 (female, male).................37.3, 41.9
Chronic respiratory disease age-standardized deaths
per 100,000 (female, male)....................................................................29.6, 36.4
HEALTH (cont’d.)
HIV/AIDS age-standardized deaths per 100,000 (female, male).................49.0, 50.0
Malaria age-standardized deaths per 100,000 (female, male)...................62.2, 64.1
Tuberculosis age-standardized deaths per 100,000 (female, male)..............9.0, 14.3
Malnutrition prev., weight for age (female, male) (% of children <5)..........11.3, 15.4
Maternal mortality ratio (per 100,000 live births)2.............................380 [210–720]
Total fertility rate (children per women)............................................................... 3.9
Adolescent fertility rate (births per 1,000 girls aged 15–19).............................. 70.0
Antenatal care coverage, at least one visit (%)..................................................... 96
Births attended by skilled health personnel (%).................................................... 67
Contraceptive prevalence, any method
(% of married or in-union women aged 15–49)................................................. 26
Existence of legislation permitting abortion
to preserve a woman’s physical health............................................................. Yes
FAMILY
Singulate mean age (years) at marriage (female, male)...................................23, 28
Early marriage (% of women aged 15–19)............................................................. 9
Mean age of women at the birth of the first child................................................. —
Length of paid maternity leave (calendar days)..................................................... 84
Provider of maternity leave benefits............................................................Employer
Percent of wages paid during maternity leave.................................................... 100
Length of paid paternity leave (calendar days)...................................................... —
Provider of paternity leave benefits....................................................................... —
Percent of wages paid during paternity leave....................................................... —
RIGHTS AND NORMS
Parental authority in marriage3............................................................................ 0.0
Parental authority after divorce3.......................................................................... 0.5
Female genital mutilation (% of women aged 15–49).......................................... 0.0
Existence of legislation on domestic violence3..................................................... 0.3
Existence of legislation on gender-based discrimination....................................... No
Inheritance rights for daughters3......................................................................... 0.5
Women’s secure access to land use, control and ownership3.............................. 1.0
Women’s access to financial services3................................................................ 0.5
Women’s secure access to non-land assets use, control and ownership3............ 0.5
Year women received right to vote.................................................................... 1954
Quota type (single/lower house)............................................................................ —
Voluntary political party quotas............................................................................. —](https://image.slidesharecdn.com/theglobalgendergapreport2015-160119013910/85/The-Global-Gender-Gap-Report-2015-191-320.jpg)

![Index over the years
SAMPLE INDEX ECONOMY EDUCATION HEALTH POLITICS
Year No. of countries Rank Score Rank Score Rank Score Rank Score Rank Score
2015 145 87 0.685 87 0.644 56 0.996 56 0.979 91 0.120
2014 142 91 0.678 87 0.643 53 0.995 55 0.979 108 0.096
2013 136 81 0.678 79 0.647 46 0.995 65 0.974 92 0.097
2012 135 82 0.672 80 0.633 55 0.994 69 0.974 99 0.086
2011 135 56 0.692 78 0.624 53 0.994 86 0.971 42 0.177
2010 134 58 0.691 79 0.621 54 0.994 84 0.971 42 0.177
2009 134 85 0.666 86 0.607 60 0.993 57 0.979 94 0.086
2008 130 75 0.673 72 0.631 55 0.994 54 0.979 93 0.086
2007 128 72 0.665 70 0.630 57 0.989 53 0.979 98 0.061
2006 115 69 0.654 70 0.585 46 0.992 53 0.978 87 0.061
2006–2015 CHANGE s 0.031 s 0.058 s 0.004 s 0.001 s 0.059
Part 2: Country Profiles
The Global Gender Gap Report 2015 | 185
1 Survey data, responses on a 1-to-7 scale (1 = worst score, 7 = best score)
2 Bracketed numbers show the range between the uncertainties, estimated to contain the true maternal mortality ratio with a 95% probability
3 Data on a 0-to-1 scale (1 = worst score, 0 = best score)
Greece
Selected contextual data
EMPLOYMENT AND LEADERSHIP
Female, male adult unemployment
(as % of female, male labour force)........................................................31.3, 24.3
Female, male part-time employment
(as % of total female, male employment).................................................15.0, 6.0
Female, male workers in informal employment
(as % of non-agricultural employment).......................................................—, —
Share of women in wage employment in the non-agricultural sector
(% of total non-agricultural employment).......................................................... 44
Average minutes spent per day on unpaid work (female, male)......................—, —
Percentage of women, men with an account
at a financial institution................................................................................87, 88
Ability of women to rise to positions of leadership1............................................. 4.1
Firms with female top managers (% of firms)....................................................... —
Share of women on boards of listed companies (%)............................................. 11
Firms with female participation in ownership (% of firms).................................... 24
Percentage of total R&D personnel (FTE) (female, male)..................................42, 58
EDUCATION AND TECHNOLOGY
Out-of-school children of primary school age (%) (female, male).....................19, 81
Female, male primary education attainment rate (% aged 25+)......................91, 96
Female, male secondary education attainment rate (% aged 25+)..................60, 67
Female, male tertiary education attainment rate (% aged 25+).......................19, 21
Percentage of tertiary-level students enrolled in STEM studies
(female, male)..............................................................................................31, 69
Percentage of tertiary-level graduates in STEM studies (female, male)............38, 62
Percentage of PhD graduates (female, male)...................................................44, 56
Percentage of individuals using the internet (female, male).............................56, 64
Percentage of individuals using a
mobile cellular telephone (female, male).....................................................—, —
HEALTH
Cardiovascular disease age-standardized deaths
per 100,000 (female, male)................................................................145.2, 210.2
Cancer age-standardized deaths per 100,000
excl. non-melanoma skin cancer (female, male)...................................82.8, 157.0
Diabetes age-standardized deaths per 100,000 (female, male).....................4.7, 6.6
Chronic respiratory disease age-standardized deaths
per 100,000 (female, male)....................................................................22.5, 34.2
HEALTH (cont’d.)
HIV/AIDS age-standardized deaths per 100,000 (female, male).....................0.9, 2.1
Malaria age-standardized deaths per 100,000 (female, male).......................0.0, 0.0
Tuberculosis age-standardized deaths per 100,000 (female, male)................0.2, 0.6
Malnutrition prev., weight for age (female, male) (% of children <5)...............—, —
Maternal mortality ratio (per 100,000 live births)2.......................................5 [2–13]
Total fertility rate (children per women)............................................................... 1.5
Adolescent fertility rate (births per 1,000 girls aged 15–19).............................. 10.0
Antenatal care coverage, at least one visit (%)..................................................... —
Births attended by skilled health personnel (%).................................................... —
Contraceptive prevalence, any method
(% of married or in-union women aged 15–49)................................................. 76
Existence of legislation permitting abortion
to preserve a woman’s physical health............................................................. Yes
FAMILY
Singulate mean age (years) at marriage (female, male)...................................27, 31
Early marriage (% of women aged 15–19)............................................................. 4
Mean age of women at the birth of the first child................................................. 30
Length of paid maternity leave (calendar days)................................................... 119
Provider of maternity leave benefits........................................................Government
Percent of wages paid during maternity leave.................................................... 100
Length of paid paternity leave (calendar days)........................................................ 2
Provider of paternity leave benefits.............................................................Employer
Percent of wages paid during paternity leave..................................................... 100
RIGHTS AND NORMS
Parental authority in marriage3............................................................................ 0.5
Parental authority after divorce3.......................................................................... 0.5
Female genital mutilation (% of women aged 15–49).......................................... 0.0
Existence of legislation on domestic violence3..................................................... 0.3
Existence of legislation on gender-based discrimination...................................... Yes
Inheritance rights for daughters3......................................................................... 0.5
Women’s secure access to land use, control and ownership3.............................. 0.0
Women’s access to financial services3................................................................ 0.0
Women’s secure access to non-land assets use, control and ownership3............ 0.0
Year women received right to vote.................................................................... 1952
Quota type (single/lower house).................................... Legislated Candidate Quotas
Voluntary political party quotas............................................................................ Yes](https://image.slidesharecdn.com/theglobalgendergapreport2015-160119013910/85/The-Global-Gender-Gap-Report-2015-193-320.jpg)

![Index over the years
SAMPLE INDEX ECONOMY EDUCATION HEALTH POLITICS
Year No. of countries Rank Score Rank Score Rank Score Rank Score Rank Score
2015 145 106 0.667 98 0.627 108 0.953 1 0.980 99 0.109
2014 142 89 0.682 72 0.662 108 0.949 1 0.980 78 0.137
2013 136 114 0.630 113 0.542 102 0.952 1 0.980 123 0.048
2012 135 116 0.626 114 0.526 102 0.951 1 0.980 121 0.048
2011 135 112 0.623 113 0.524 98 0.946 1 0.980 118 0.042
2010 134 109 0.624 109 0.528 101 0.945 1 0.980 116 0.042
2009 134 111 0.621 115 0.506 101 0.938 1 0.980 118 0.060
2008 130 112 0.607 114 0.475 103 0.915 1 0.980 113 0.060
2007 128 106 0.614 112 0.471 102 0.897 1 0.980 61 0.110
2006 115 95 0.607 104 0.443 91 0.895 1 0.980 54 0.110
2006–2015 CHANGE s 0.061 s 0.185 s 0.059 s 0.000 t –0.001
Part 2: Country Profiles
The Global Gender Gap Report 2015 | 187
1 Survey data, responses on a 1-to-7 scale (1 = worst score, 7 = best score)
2 Bracketed numbers show the range between the uncertainties, estimated to contain the true maternal mortality ratio with a 95% probability
3 Data on a 0-to-1 scale (1 = worst score, 0 = best score)
Guatemala
Selected contextual data
EMPLOYMENT AND LEADERSHIP
Female, male adult unemployment
(as % of female, male labour force)............................................................2.9, 3.0
Female, male part-time employment
(as % of total female, male employment).................................................37.8, 9.5
Female, male workers in informal employment
(as % of non-agricultural employment).......................................................—, —
Share of women in wage employment in the non-agricultural sector
(% of total non-agricultural employment).......................................................... 29
Average minutes spent per day on unpaid work (female, male)......................—, —
Percentage of women, men with an account
at a financial institution................................................................................35, 48
Ability of women to rise to positions of leadership1............................................. 4.1
Firms with female top managers (% of firms)....................................................... 16
Share of women on boards of listed companies (%)............................................. —
Firms with female participation in ownership (% of firms).................................... 44
Percentage of total R&D personnel (FTE) (female, male)..................................46, 54
EDUCATION AND TECHNOLOGY
Out-of-school children of primary school age (%) (female, male).....................51, 49
Female, male primary education attainment rate (% aged 25+)......................40, 50
Female, male secondary education attainment rate (% aged 25+)..................23, 29
Female, male tertiary education attainment rate (% aged 25+)...........................3, 3
Percentage of tertiary-level students enrolled in STEM studies
(female, male).............................................................................................—, —
Percentage of tertiary-level graduates in STEM studies (female, male)............34, 66
Percentage of PhD graduates (female, male)..................................................—, —
Percentage of individuals using the internet (female, male)............................—, —
Percentage of individuals using a
mobile cellular telephone (female, male).....................................................—, —
HEALTH
Cardiovascular disease age-standardized deaths
per 100,000 (female, male)................................................................108.6, 139.2
Cancer age-standardized deaths per 100,000
excl. non-melanoma skin cancer (female, male).................................110.0, 108.9
Diabetes age-standardized deaths per 100,000 (female, male).................45.6, 39.6
Chronic respiratory disease age-standardized deaths
per 100,000 (female, male)....................................................................19.5, 26.9
HEALTH (cont’d.)
HIV/AIDS age-standardized deaths per 100,000 (female, male).................15.4, 44.1
Malaria age-standardized deaths per 100,000 (female, male).......................0.0, 0.0
Tuberculosis age-standardized deaths per 100,000 (female, male)................2.5, 4.6
Malnutrition prev., weight for age (female, male) (% of children <5)..........12.1, 13.9
Maternal mortality ratio (per 100,000 live births)2...............................140 [89–210]
Total fertility rate (children per women)............................................................... 3.8
Adolescent fertility rate (births per 1,000 girls aged 15–19).............................. 92.4
Antenatal care coverage, at least one visit (%)..................................................... 93
Births attended by skilled health personnel (%).................................................... 59
Contraceptive prevalence, any method
(% of married or in-union women aged 15–49)................................................. 54
Existence of legislation permitting abortion
to preserve a woman’s physical health.............................................................. No
FAMILY
Singulate mean age (years) at marriage (female, male).................................. 22, —
Early marriage (% of women aged 15–19)........................................................... 20
Mean age of women at the birth of the first child................................................. —
Length of paid maternity leave (calendar days)..................................................... 84
Provider of maternity leave benefits................................. Employer and Government
Percent of wages paid during maternity leave.................................................... 100
Length of paid paternity leave (calendar days)........................................................ 2
Provider of paternity leave benefits.............................................................Employer
Percent of wages paid during paternity leave..................................................... 100
RIGHTS AND NORMS
Parental authority in marriage3............................................................................ 0.5
Parental authority after divorce3.......................................................................... 0.5
Female genital mutilation (% of women aged 15–49).......................................... 0.0
Existence of legislation on domestic violence3..................................................... 0.0
Existence of legislation on gender-based discrimination....................................... —
Inheritance rights for daughters3......................................................................... 0.0
Women’s secure access to land use, control and ownership3.............................. 0.5
Women’s access to financial services3................................................................ 0.0
Women’s secure access to non-land assets use, control and ownership3............ 0.0
Year women received right to vote.................................................................... 1946
Quota type (single/lower house)............................................................................ —
Voluntary political party quotas............................................................................. —](https://image.slidesharecdn.com/theglobalgendergapreport2015-160119013910/85/The-Global-Gender-Gap-Report-2015-195-320.jpg)

![Index over the years
SAMPLE INDEX ECONOMY EDUCATION HEALTH POLITICS
Year No. of countries Rank Score Rank Score Rank Score Rank Score Rank Score
2015 145 131 0.618 76 0.666 143 0.707 116 0.967 85 0.130
2014 142 132 0.600 74 0.656 141 0.649 107 0.967 83 0.130
2013 136 — — — — — — — — — —
2012 135 — — — — — — — — — —
2011 135 — — — — — — — — — —
2010 134 — — — — — — — — — —
2009 134 — — — — — — — — — —
2008 130 — — — — — — — — — —
2007 128 — — — — — — — — — —
2006 115 — — — — — — — — — —
2006–2015 CHANGE s 0.017 s 0.010 s 0.058 t 0.000 s 0.000
Part 2: Country Profiles
The Global Gender Gap Report 2015 | 189
1 Survey data, responses on a 1-to-7 scale (1 = worst score, 7 = best score)
2 Bracketed numbers show the range between the uncertainties, estimated to contain the true maternal mortality ratio with a 95% probability
3 Data on a 0-to-1 scale (1 = worst score, 0 = best score)
Guinea
Selected contextual data
EMPLOYMENT AND LEADERSHIP
Female, male adult unemployment
(as % of female, male labour force)............................................................0.9, 2.5
Female, male part-time employment
(as % of total female, male employment)....................................................—, —
Female, male workers in informal employment
(as % of non-agricultural employment).......................................................—, —
Share of women in wage employment in the non-agricultural sector
(% of total non-agricultural employment).......................................................... 18
Average minutes spent per day on unpaid work (female, male)......................—, —
Percentage of women, men with an account
at a financial institution....................................................................................4, 9
Ability of women to rise to positions of leadership1............................................. 3.9
Firms with female top managers (% of firms)....................................................... —
Share of women on boards of listed companies (%)............................................. —
Firms with female participation in ownership (% of firms).................................... 25
Percentage of total R&D personnel (FTE) (female, male).................................—, —
EDUCATION AND TECHNOLOGY
Out-of-school children of primary school age (%) (female, male).....................62, 38
Female, male primary education attainment rate (% aged 25+).....................—, —
Female, male secondary education attainment rate (% aged 25+).................—, —
Female, male tertiary education attainment rate (% aged 25+)......................—, —
Percentage of tertiary-level students enrolled in STEM studies
(female, male)..............................................................................................23, 77
Percentage of tertiary-level graduates in STEM studies (female, male)...........—, —
Percentage of PhD graduates (female, male)..................................................—, —
Percentage of individuals using the internet (female, male)............................—, —
Percentage of individuals using a
mobile cellular telephone (female, male).....................................................—, —
HEALTH
Cardiovascular disease age-standardized deaths
per 100,000 (female, male)................................................................332.0, 288.1
Cancer age-standardized deaths per 100,000
excl. non-melanoma skin cancer (female, male)...................................74.2, 119.7
Diabetes age-standardized deaths per 100,000 (female, male).................44.9, 41.4
Chronic respiratory disease age-standardized deaths
per 100,000 (female, male)....................................................................36.4, 50.2
HEALTH (cont’d.)
HIV/AIDS age-standardized deaths per 100,000 (female, male).................60.7, 50.4
Malaria age-standardized deaths per 100,000 (female, male)...................62.6, 61.9
Tuberculosis age-standardized deaths per 100,000 (female, male)............23.6, 50.0
Malnutrition prev., weight for age (female, male) (% of children <5)..........15.2, 17.3
Maternal mortality ratio (per 100,000 live births)2...........................650 [390–1100]
Total fertility rate (children per women)............................................................... 4.9
Adolescent fertility rate (births per 1,000 girls aged 15–19)............................ 154.0
Antenatal care coverage, at least one visit (%)..................................................... 85
Births attended by skilled health personnel (%).................................................... 45
Contraceptive prevalence, any method
(% of married or in-union women aged 15–49)................................................... 6
Existence of legislation permitting abortion
to preserve a woman’s physical health............................................................. Yes
FAMILY
Singulate mean age (years) at marriage (female, male)...................................19, 26
Early marriage (% of women aged 15–19)........................................................... 38
Mean age of women at the birth of the first child................................................. —
Length of paid maternity leave (calendar days)..................................................... 98
Provider of maternity leave benefits................................. Employer and Government
Percent of wages paid during maternity leave.................................................... 100
Length of paid paternity leave (calendar days)...................................................... —
Provider of paternity leave benefits....................................................................... —
Percent of wages paid during paternity leave....................................................... —
RIGHTS AND NORMS
Parental authority in marriage3............................................................................ 1.0
Parental authority after divorce3.......................................................................... 1.0
Female genital mutilation (% of women aged 15–49).......................................... 1.0
Existence of legislation on domestic violence3..................................................... 0.5
Existence of legislation on gender-based discrimination....................................... —
Inheritance rights for daughters3......................................................................... 0.5
Women’s secure access to land use, control and ownership3.............................. 0.5
Women’s access to financial services3................................................................ 0.5
Women’s secure access to non-land assets use, control and ownership3............ 0.0
Year women received right to vote.................................................................... 1958
Quota type (single/lower house).................................... Legislated Candidate Quotas
Voluntary political party quotas............................................................................. No](https://image.slidesharecdn.com/theglobalgendergapreport2015-160119013910/85/The-Global-Gender-Gap-Report-2015-197-320.jpg)

![Index over the years
SAMPLE INDEX ECONOMY EDUCATION HEALTH POLITICS
Year No. of countries Rank Score Rank Score Rank Score Rank Score Rank Score
2015 145 66 0.702 124 0.569 1 1.000 1 0.980 37 0.261
2014 142 64 0.701 117 0.565 1 1.000 1 0.980 34 0.259
2013 136 48 0.709 102 0.589 1 1.000 45 0.979 33 0.267
2012 135 42 0.712 94 0.603 28 0.999 47 0.979 32 0.267
2011 135 38 0.708 88 0.598 75 0.989 45 0.979 28 0.268
2010 134 38 0.709 93 0.592 33 0.998 43 0.979 27 0.267
2009 134 35 0.711 85 0.613 41 0.997 1 0.980 28 0.254
2008 130 — — — — — — — — — —
2007 128 — — — — — — — — — —
2006 115 — — — — — — — — — —
2006–2015 CHANGE t –0.008 t –0.045 s 0.003 t 0.000 s 0.008
Part 2: Country Profiles
The Global Gender Gap Report 2015 | 191
1 Survey data, responses on a 1-to-7 scale (1 = worst score, 7 = best score)
2 Bracketed numbers show the range between the uncertainties, estimated to contain the true maternal mortality ratio with a 95% probability
3 Data on a 0-to-1 scale (1 = worst score, 0 = best score)
Guyana
Selected contextual data
EMPLOYMENT AND LEADERSHIP
Female, male adult unemployment
(as % of female, male labour force)........................................................15.2, 10.3
Female, male part-time employment
(as % of total female, male employment)....................................................—, —
Female, male workers in informal employment
(as % of non-agricultural employment).......................................................—, —
Share of women in wage employment in the non-agricultural sector
(% of total non-agricultural employment).......................................................... 35
Average minutes spent per day on unpaid work (female, male)......................—, —
Percentage of women, men with an account
at a financial institution...............................................................................—, —
Ability of women to rise to positions of leadership1............................................. 4.3
Firms with female top managers (% of firms)....................................................... 18
Share of women on boards of listed companies (%)............................................. —
Firms with female participation in ownership (% of firms).................................... 58
Percentage of total R&D personnel (FTE) (female, male).................................—, —
EDUCATION AND TECHNOLOGY
Out-of-school children of primary school age (%) (female, male).....................37, 63
Female, male primary education attainment rate (% aged 25+)......................68, 67
Female, male secondary education attainment rate (% aged 25+)..................33, 29
Female, male tertiary education attainment rate (% aged 25+)...........................0, 0
Percentage of tertiary-level students enrolled in STEM studies
(female, male)..............................................................................................33, 67
Percentage of tertiary-level graduates in STEM studies (female, male)............25, 75
Percentage of PhD graduates (female, male)..................................................—, —
Percentage of individuals using the internet (female, male)............................—, —
Percentage of individuals using a
mobile cellular telephone (female, male).....................................................—, —
HEALTH
Cardiovascular disease age-standardized deaths
per 100,000 (female, male)................................................................451.0, 709.7
Cancer age-standardized deaths per 100,000
excl. non-melanoma skin cancer (female, male).................................134.8, 230.4
Diabetes age-standardized deaths per 100,000 (female, male).............142.1, 129.5
Chronic respiratory disease age-standardized deaths
per 100,000 (female, male)....................................................................15.2, 35.1
HEALTH (cont’d.)
HIV/AIDS age-standardized deaths per 100,000 (female, male)...................9.2, 16.2
Malaria age-standardized deaths per 100,000 (female, male).....................8.7, 23.0
Tuberculosis age-standardized deaths per 100,000 (female, male)............15.4, 53.4
Malnutrition prev., weight for age (female, male) (% of children <5)............9.4, 12.8
Maternal mortality ratio (per 100,000 live births)2.............................250 [160–380]
Total fertility rate (children per women)............................................................... 2.5
Adolescent fertility rate (births per 1,000 girls aged 15–19).............................. 97.0
Antenatal care coverage, at least one visit (%)..................................................... 86
Births attended by skilled health personnel (%).................................................... 87
Contraceptive prevalence, any method
(% of married or in-union women aged 15–49)................................................. 43
Existence of legislation permitting abortion
to preserve a woman’s physical health............................................................. Yes
FAMILY
Singulate mean age (years) at marriage (female, male)...................................22, 25
Early marriage (% of women aged 15–19)........................................................... —
Mean age of women at the birth of the first child................................................. —
Length of paid maternity leave (calendar days)..................................................... 91
Provider of maternity leave benefits........................................................Government
Percent of wages paid during maternity leave...................................................... 70
Length of paid paternity leave (calendar days)...................................................... —
Provider of paternity leave benefits....................................................................... —
Percent of wages paid during paternity leave....................................................... —
RIGHTS AND NORMS
Parental authority in marriage3............................................................................. —
Parental authority after divorce3........................................................................... —
Female genital mutilation (% of women aged 15–49)........................................... —
Existence of legislation on domestic violence3...................................................... —
Existence of legislation on gender-based discrimination....................................... —
Inheritance rights for daughters3.......................................................................... —
Women’s secure access to land use, control and ownership3............................... —
Women’s access to financial services3................................................................. —
Women’s secure access to non-land assets use, control and ownership3............. —
Year women received right to vote.................................................................... 1953
Quota type (single/lower house).................................... Legislated Candidate Quotas
Voluntary political party quotas............................................................................. No](https://image.slidesharecdn.com/theglobalgendergapreport2015-160119013910/85/The-Global-Gender-Gap-Report-2015-199-320.jpg)

![Index over the years
SAMPLE INDEX ECONOMY EDUCATION HEALTH POLITICS
Year No. of countries Rank Score Rank Score Rank Score Rank Score Rank Score
2015 145 80 0.688 101 0.617 1 1.000 61 0.976 74 0.160
2014 142 73 0.693 91 0.639 38 0.998 59 0.976 69 0.161
2013 136 82 0.677 94 0.606 35 0.999 52 0.976 78 0.128
2012 135 74 0.676 96 0.601 21 1.000 55 0.976 75 0.128
2011 135 54 0.694 91 0.597 29 0.999 53 0.976 37 0.205
2010 134 54 0.693 96 0.590 30 0.999 53 0.976 35 0.205
2009 134 62 0.689 87 0.605 1 1.000 1 0.980 41 0.173
2008 130 47 0.696 70 0.634 1 1.000 1 0.980 41 0.171
2007 128 68 0.666 98 0.549 1 1.000 1 0.980 48 0.136
2006 115 74 0.648 99 0.478 1 1.000 1 0.980 42 0.136
2006–2015 CHANGE s 0.040 s 0.139 t 0.000 t –0.004 s 0.024
Part 2: Country Profiles
The Global Gender Gap Report 2015 | 193
1 Survey data, responses on a 1-to-7 scale (1 = worst score, 7 = best score)
2 Bracketed numbers show the range between the uncertainties, estimated to contain the true maternal mortality ratio with a 95% probability
3 Data on a 0-to-1 scale (1 = worst score, 0 = best score)
Honduras
Selected contextual data
EMPLOYMENT AND LEADERSHIP
Female, male adult unemployment
(as % of female, male labour force)............................................................6.2, 3.4
Female, male part-time employment
(as % of total female, male employment)...............................................35.0, 16.0
Female, male workers in informal employment
(as % of non-agricultural employment)........................................................50, 50
Share of women in wage employment in the non-agricultural sector
(% of total non-agricultural employment).......................................................... 42
Average minutes spent per day on unpaid work (female, male)......................—, —
Percentage of women, men with an account
at a financial institution................................................................................25, 35
Ability of women to rise to positions of leadership1............................................. 4.5
Firms with female top managers (% of firms)....................................................... 32
Share of women on boards of listed companies (%)............................................. —
Firms with female participation in ownership (% of firms).................................... 43
Percentage of total R&D personnel (FTE) (female, male).................................—, —
EDUCATION AND TECHNOLOGY
Out-of-school children of primary school age (%) (female, male).....................45, 55
Female, male primary education attainment rate (% aged 25+)......................53, 53
Female, male secondary education attainment rate (% aged 25+)..................28, 26
Female, male tertiary education attainment rate (% aged 25+)...........................4, 4
Percentage of tertiary-level students enrolled in STEM studies
(female, male)..............................................................................................33, 67
Percentage of tertiary-level graduates in STEM studies (female, male)............37, 63
Percentage of PhD graduates (female, male)...................................................27, 73
Percentage of individuals using the internet (female, male)............................—, —
Percentage of individuals using a
mobile cellular telephone (female, male).....................................................—, —
HEALTH
Cardiovascular disease age-standardized deaths
per 100,000 (female, male)................................................................164.4, 240.1
Cancer age-standardized deaths per 100,000
excl. non-melanoma skin cancer (female, male).................................104.6, 106.8
Diabetes age-standardized deaths per 100,000 (female, male).................15.2, 16.4
Chronic respiratory disease age-standardized deaths
per 100,000 (female, male)....................................................................30.8, 50.4
HEALTH (cont’d.)
HIV/AIDS age-standardized deaths per 100,000 (female, male).................18.0, 33.2
Malaria age-standardized deaths per 100,000 (female, male).......................0.0, 0.1
Tuberculosis age-standardized deaths per 100,000 (female, male)................3.5, 6.1
Malnutrition prev., weight for age (female, male) (% of children <5)..............6.5, 7.7
Maternal mortality ratio (per 100,000 live births)2...............................120 [73–190]
Total fertility rate (children per women)............................................................... 3.0
Adolescent fertility rate (births per 1,000 girls aged 15–19).............................. 99.0
Antenatal care coverage, at least one visit (%)..................................................... 94
Births attended by skilled health personnel (%).................................................... 83
Contraceptive prevalence, any method
(% of married or in-union women aged 15–49)................................................. 73
Existence of legislation permitting abortion
to preserve a woman’s physical health.............................................................. No
FAMILY
Singulate mean age (years) at marriage (female, male).................................. 21, —
Early marriage (% of women aged 15–19)........................................................... 25
Mean age of women at the birth of the first child................................................. —
Length of paid maternity leave (calendar days)..................................................... 84
Provider of maternity leave benefits................................. Employer and Government
Percent of wages paid during maternity leave.................................................... 100
Length of paid paternity leave (calendar days)...................................................... —
Provider of paternity leave benefits....................................................................... —
Percent of wages paid during paternity leave....................................................... —
RIGHTS AND NORMS
Parental authority in marriage3............................................................................ 0.0
Parental authority after divorce3.......................................................................... 0.0
Female genital mutilation (% of women aged 15–49).......................................... 0.0
Existence of legislation on domestic violence3..................................................... 0.3
Existence of legislation on gender-based discrimination...................................... Yes
Inheritance rights for daughters3......................................................................... 0.5
Women’s secure access to land use, control and ownership3.............................. 0.5
Women’s access to financial services3................................................................ 0.5
Women’s secure access to non-land assets use, control and ownership3............ 0.0
Year women received right to vote.................................................................... 1955
Quota type (single/lower house).................................... Legislated Candidate Quotas
Voluntary political party quotas............................................................................. No](https://image.slidesharecdn.com/theglobalgendergapreport2015-160119013910/85/The-Global-Gender-Gap-Report-2015-201-320.jpg)

![Index over the years
SAMPLE INDEX ECONOMY EDUCATION HEALTH POLITICS
Year No. of countries Rank Score Rank Score Rank Score Rank Score Rank Score
2015 145 99 0.672 62 0.685 76 0.991 42 0.979 139 0.035
2014 142 93 0.676 69 0.668 71 0.992 37 0.979 128 0.064
2013 136 87 0.674 68 0.668 62 0.993 34 0.979 120 0.057
2012 135 81 0.672 68 0.659 68 0.992 34 0.979 117 0.057
2011 135 85 0.664 64 0.654 56 0.993 1 0.980 127 0.031
2010 134 79 0.672 48 0.689 64 0.990 49 0.978 126 0.031
2009 134 65 0.688 55 0.674 64 0.992 41 0.979 81 0.106
2008 130 60 0.687 50 0.669 64 0.993 38 0.979 77 0.106
2007 128 61 0.673 56 0.653 50 0.991 37 0.979 93 0.069
2006 115 55 0.670 48 0.640 49 0.991 36 0.979 82 0.069
2006–2015 CHANGE s 0.003 s 0.045 s 0.000 s 0.000 t –0.034
Part 2: Country Profiles
The Global Gender Gap Report 2015 | 195
1 Survey data, responses on a 1-to-7 scale (1 = worst score, 7 = best score)
2 Bracketed numbers show the range between the uncertainties, estimated to contain the true maternal mortality ratio with a 95% probability
3 Data on a 0-to-1 scale (1 = worst score, 0 = best score)
Hungary
Selected contextual data
EMPLOYMENT AND LEADERSHIP
Female, male adult unemployment
(as % of female, male labour force)........................................................10.2, 10.2
Female, male part-time employment
(as % of total female, male employment)...................................................6.6, 3.1
Female, male workers in informal employment
(as % of non-agricultural employment).......................................................—, —
Share of women in wage employment in the non-agricultural sector
(% of total non-agricultural employment).......................................................... 49
Average minutes spent per day on unpaid work (female, male)...................268, 127
Percentage of women, men with an account
at a financial institution................................................................................72, 72
Ability of women to rise to positions of leadership1............................................. 3.6
Firms with female top managers (% of firms)....................................................... 20
Share of women on boards of listed companies (%)............................................... 7
Firms with female participation in ownership (% of firms).................................... 47
Percentage of total R&D personnel (FTE) (female, male)..................................37, 63
EDUCATION AND TECHNOLOGY
Out-of-school children of primary school age (%) (female, male).....................49, 51
Female, male primary education attainment rate (% aged 25+)..................100, 100
Female, male secondary education attainment rate (% aged 25+)..................98, 99
Female, male tertiary education attainment rate (% aged 25+).......................23, 19
Percentage of tertiary-level students enrolled in STEM studies
(female, male)..............................................................................................24, 76
Percentage of tertiary-level graduates in STEM studies (female, male)............28, 72
Percentage of PhD graduates (female, male)...................................................46, 54
Percentage of individuals using the internet (female, male).............................72, 74
Percentage of individuals using a
mobile cellular telephone (female, male).....................................................—, —
HEALTH
Cardiovascular disease age-standardized deaths
per 100,000 (female, male)................................................................229.4, 383.7
Cancer age-standardized deaths per 100,000
excl. non-melanoma skin cancer (female, male).................................137.8, 253.0
Diabetes age-standardized deaths per 100,000 (female, male).................10.8, 14.2
Chronic respiratory disease age-standardized deaths
per 100,000 (female, male)....................................................................18.4, 42.0
HEALTH (cont’d.)
HIV/AIDS age-standardized deaths per 100,000 (female, male).....................0.0, 0.2
Malaria age-standardized deaths per 100,000 (female, male).......................0.0, 0.0
Tuberculosis age-standardized deaths per 100,000 (female, male)................0.4, 1.3
Malnutrition prev., weight for age (female, male) (% of children <5)..............1.6, 2.9
Maternal mortality ratio (per 100,000 live births)2.....................................14 [9–21]
Total fertility rate (children per women)............................................................... 1.4
Adolescent fertility rate (births per 1,000 girls aged 15–19).............................. 17.7
Antenatal care coverage, at least one visit (%)..................................................... —
Births attended by skilled health personnel (%).................................................... 99
Contraceptive prevalence, any method
(% of married or in-union women aged 15–49)................................................. 81
Existence of legislation permitting abortion
to preserve a woman’s physical health............................................................. Yes
FAMILY
Singulate mean age (years) at marriage (female, male)...................................31, 33
Early marriage (% of women aged 15–19)............................................................. 1
Mean age of women at the birth of the first child................................................. 28
Length of paid maternity leave (calendar days)................................................... 168
Provider of maternity leave benefits........................................................Government
Percent of wages paid during maternity leave...................................................... 70
Length of paid paternity leave (calendar days)........................................................ 5
Provider of paternity leave benefits.............................................................Employer
Percent of wages paid during paternity leave..................................................... 100
RIGHTS AND NORMS
Parental authority in marriage3............................................................................ 0.0
Parental authority after divorce3.......................................................................... 0.0
Female genital mutilation (% of women aged 15–49).......................................... 0.0
Existence of legislation on domestic violence3..................................................... 0.5
Existence of legislation on gender-based discrimination...................................... Yes
Inheritance rights for daughters3...............................................................................
Women’s secure access to land use, control and ownership3.............................. 0.0
Women’s access to financial services3................................................................ 0.0
Women’s secure access to non-land assets use, control and ownership3............ 0.0
Year women received right to vote...........................................................1918, 1945
Quota type (single/lower house)............................................................................ —
Voluntary political party quotas............................................................................. —](https://image.slidesharecdn.com/theglobalgendergapreport2015-160119013910/85/The-Global-Gender-Gap-Report-2015-203-320.jpg)
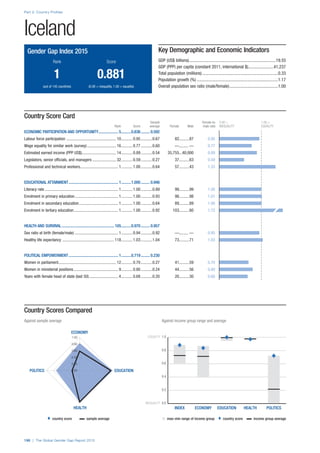
![Index over the years
SAMPLE INDEX ECONOMY EDUCATION HEALTH POLITICS
Year No. of countries Rank Score Rank Score Rank Score Rank Score Rank Score
2015 145 1 0.881 5 0.836 1 1.000 105 0.970 1 0.719
2014 142 1 0.859 7 0.817 1 1.000 128 0.965 1 0.655
2013 136 1 0.873 22 0.768 1 1.000 97 0.970 1 0.754
2012 135 1 0.864 27 0.754 1 1.000 98 0.970 1 0.733
2011 135 1 0.853 24 0.745 1 1.000 96 0.970 1 0.697
2010 134 1 0.850 18 0.754 1 1.000 96 0.970 1 0.675
2009 134 1 0.828 16 0.750 1 1.000 101 0.970 1 0.591
2008 130 4 0.800 20 0.732 61 0.993 96 0.970 3 0.504
2007 128 4 0.784 23 0.721 67 0.987 95 0.970 4 0.456
2006 115 4 0.781 17 0.711 50 0.991 92 0.968 4 0.456
2006–2015 CHANGE s 0.100 s 0.125 s 0.009 s 0.002 s 0.263
Part 2: Country Profiles
The Global Gender Gap Report 2015 | 197
1 Survey data, responses on a 1-to-7 scale (1 = worst score, 7 = best score)
2 Bracketed numbers show the range between the uncertainties, estimated to contain the true maternal mortality ratio with a 95% probability
3 Data on a 0-to-1 scale (1 = worst score, 0 = best score)
Iceland
Selected contextual data
EMPLOYMENT AND LEADERSHIP
Female, male adult unemployment
(as % of female, male labour force)............................................................5.1, 5.7
Female, male part-time employment
(as % of total female, male employment)...............................................23.7, 11.4
Female, male workers in informal employment
(as % of non-agricultural employment).......................................................—, —
Share of women in wage employment in the non-agricultural sector
(% of total non-agricultural employment).......................................................... 51
Average minutes spent per day on unpaid work (female, male)......................—, —
Percentage of women, men with an account
at a financial institution...............................................................................—, —
Ability of women to rise to positions of leadership1............................................. 6.0
Firms with female top managers (% of firms)....................................................... —
Share of women on boards of listed companies (%)............................................... 0
Firms with female participation in ownership (% of firms).................................... —
Percentage of total R&D personnel (FTE) (female, male)..................................39, 62
EDUCATION AND TECHNOLOGY
Out-of-school children of primary school age (%) (female, male).....................41, 59
Female, male primary education attainment rate (% aged 25+)......................96, 95
Female, male secondary education attainment rate (% aged 25+)..................91, 92
Female, male tertiary education attainment rate (% aged 25+).......................30, 25
Percentage of tertiary-level students enrolled in STEM studies
(female, male)..............................................................................................35, 65
Percentage of tertiary-level graduates in STEM studies (female, male)............35, 65
Percentage of PhD graduates (female, male)...................................................53, 48
Percentage of individuals using the internet (female, male).............................96, 98
Percentage of individuals using a
mobile cellular telephone (female, male).....................................................—, —
HEALTH
Cardiovascular disease age-standardized deaths
per 100,000 (female, male)..................................................................87.2, 118.8
Cancer age-standardized deaths per 100,000
excl. non-melanoma skin cancer (female, male).................................112.9, 127.4
Diabetes age-standardized deaths per 100,000 (female, male).....................5.0, 4.9
Chronic respiratory disease age-standardized deaths
per 100,000 (female, male)....................................................................20.1, 25.1
HEALTH (cont’d.)
HIV/AIDS age-standardized deaths per 100,000 (female, male).....................0.0, 0.2
Malaria age-standardized deaths per 100,000 (female, male).......................0.0, 0.0
Tuberculosis age-standardized deaths per 100,000 (female, male)................0.9, 0.2
Malnutrition prev., weight for age (female, male) (% of children <5)...............—, —
Maternal mortality ratio (per 100,000 live births)2.........................................4 [2–7]
Total fertility rate (children per women)............................................................... 2.1
Adolescent fertility rate (births per 1,000 girls aged 15–19).............................. 10.8
Antenatal care coverage, at least one visit (%)..................................................... —
Births attended by skilled health personnel (%).................................................... —
Contraceptive prevalence, any method
(% of married or in-union women aged 15–49)................................................. —
Existence of legislation permitting abortion
to preserve a woman’s physical health............................................................. Yes
FAMILY
Singulate mean age (years) at marriage (female, male)...................................28, 30
Early marriage (% of women aged 15–19)............................................................. 1
Mean age of women at the birth of the first child................................................. 27
Length of paid maternity leave (calendar days)..................................................... 90
Provider of maternity leave benefits........................................................Government
Percent of wages paid during maternity leave...................................................... 49
Length of paid paternity leave (calendar days)...................................................... 90
Provider of paternity leave benefits.........................................................Government
Percent of wages paid during paternity leave....................................................... 49
RIGHTS AND NORMS
Parental authority in marriage3............................................................................ 0.0
Parental authority after divorce3.......................................................................... 0.0
Female genital mutilation (% of women aged 15–49).......................................... 0.0
Existence of legislation on domestic violence3..................................................... 0.5
Existence of legislation on gender-based discrimination...................................... Yes
Inheritance rights for daughters3......................................................................... 0.0
Women’s secure access to land use, control and ownership3.............................. 0.0
Women’s access to financial services3................................................................ 0.0
Women’s secure access to non-land assets use, control and ownership3............ 0.0
Year women received right to vote...........................................................1915, 1920
Quota type (single/lower house)............................................................................ —
Voluntary political party quotas............................................................................. —](https://image.slidesharecdn.com/theglobalgendergapreport2015-160119013910/85/The-Global-Gender-Gap-Report-2015-205-320.jpg)
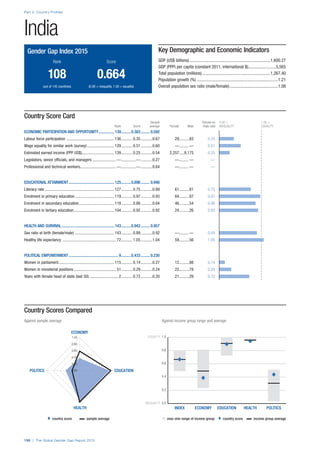
![Index over the years
SAMPLE INDEX ECONOMY EDUCATION HEALTH POLITICS
Year No. of countries Rank Score Rank Score Rank Score Rank Score Rank Score
2015 145 108 0.664 139 0.383 125 0.896 143 0.942 9 0.433
2014 142 114 0.646 134 0.410 126 0.850 141 0.937 15 0.385
2013 136 101 0.655 124 0.446 120 0.857 135 0.931 9 0.385
2012 135 105 0.644 123 0.459 121 0.852 134 0.931 17 0.334
2011 135 113 0.619 131 0.396 121 0.837 134 0.931 19 0.312
2010 134 112 0.615 128 0.403 120 0.837 132 0.931 23 0.291
2009 134 114 0.615 127 0.412 121 0.843 134 0.931 24 0.273
2008 130 113 0.606 125 0.399 116 0.845 128 0.931 25 0.248
2007 128 114 0.594 122 0.398 116 0.819 126 0.931 21 0.227
2006 115 98 0.601 110 0.397 102 0.819 103 0.962 20 0.227
2006–2015 CHANGE s 0.062 t –0.013 s 0.077 t –0.020 s 0.206
Part 2: Country Profiles
The Global Gender Gap Report 2015 | 199
1 Survey data, responses on a 1-to-7 scale (1 = worst score, 7 = best score)
2 Bracketed numbers show the range between the uncertainties, estimated to contain the true maternal mortality ratio with a 95% probability
3 Data on a 0-to-1 scale (1 = worst score, 0 = best score)
India
Selected contextual data
EMPLOYMENT AND LEADERSHIP
Female, male adult unemployment
(as % of female, male labour force)............................................................4.0, 3.4
Female, male part-time employment
(as % of total female, male employment)....................................................—, —
Female, male workers in informal employment
(as % of non-agricultural employment)........................................................19, 81
Share of women in wage employment in the non-agricultural sector
(% of total non-agricultural employment).......................................................... 19
Average minutes spent per day on unpaid work (female, male).....................352, 52
Percentage of women, men with an account
at a financial institution................................................................................43, 62
Ability of women to rise to positions of leadership1............................................. 3.3
Firms with female top managers (% of firms)......................................................... 9
Share of women on boards of listed companies (%)............................................... 7
Firms with female participation in ownership (% of firms).................................... 11
Percentage of total R&D personnel (FTE) (female, male)..................................15, 85
EDUCATION AND TECHNOLOGY
Out-of-school children of primary school age (%) (female, male).....................56, 44
Female, male primary education attainment rate (% aged 25+).....................—, —
Female, male secondary education attainment rate (% aged 25+).................—, —
Female, male tertiary education attainment rate (% aged 25+)......................—, —
Percentage of tertiary-level students enrolled in STEM studies
(female, male).............................................................................................—, —
Percentage of tertiary-level graduates in STEM studies (female, male)...........—, —
Percentage of PhD graduates (female, male)..................................................—, —
Percentage of individuals using the internet (female, male)............................—, —
Percentage of individuals using a
mobile cellular telephone (female, male).....................................................—, —
HEALTH
Cardiovascular disease age-standardized deaths
per 100,000 (female, male)................................................................264.6, 348.9
Cancer age-standardized deaths per 100,000
excl. non-melanoma skin cancer (female, male).....................................66.3, 79.0
Diabetes age-standardized deaths per 100,000 (female, male).................22.7, 30.2
Chronic respiratory disease age-standardized deaths
per 100,000 (female, male)................................................................124.9, 188.5
HEALTH (cont’d.)
HIV/AIDS age-standardized deaths per 100,000 (female, male)...................8.5, 13.8
Malaria age-standardized deaths per 100,000 (female, male).......................2.0, 3.2
Tuberculosis age-standardized deaths per 100,000 (female, male)............18.2, 39.5
Malnutrition prev., weight for age (female, male) (% of children <5)..........43.9, 43.1
Maternal mortality ratio (per 100,000 live births)2.............................190 [130–300]
Total fertility rate (children per women)............................................................... 2.5
Adolescent fertility rate (births per 1,000 girls aged 15–19).............................. 38.5
Antenatal care coverage, at least one visit (%)..................................................... 75
Births attended by skilled health personnel (%).................................................... 67
Contraceptive prevalence, any method
(% of married or in-union women aged 15–49)................................................. 55
Existence of legislation permitting abortion
to preserve a woman’s physical health............................................................. Yes
FAMILY
Singulate mean age (years) at marriage (female, male).................................. 20, —
Early marriage (% of women aged 15–19)........................................................... 28
Mean age of women at the birth of the first child................................................. —
Length of paid maternity leave (calendar days)..................................................... 84
Provider of maternity leave benefits............................................................Employer
Percent of wages paid during maternity leave.................................................... 100
Length of paid paternity leave (calendar days)...................................................... —
Provider of paternity leave benefits....................................................................... —
Percent of wages paid during paternity leave....................................................... —
RIGHTS AND NORMS
Parental authority in marriage3............................................................................ 0.5
Parental authority after divorce3.......................................................................... 0.5
Female genital mutilation (% of women aged 15–49).......................................... 0.0
Existence of legislation on domestic violence3..................................................... 0.3
Existence of legislation on gender-based discrimination....................................... —
Inheritance rights for daughters3......................................................................... 0.5
Women’s secure access to land use, control and ownership3.............................. 0.5
Women’s access to financial services3................................................................ 0.5
Women’s secure access to non-land assets use, control and ownership3............ 0.5
Year women received right to vote...........................................................1935, 1950
Quota type (single/lower house)............................................................ No legislated
Voluntary political party quotas............................................................................. No](https://image.slidesharecdn.com/theglobalgendergapreport2015-160119013910/85/The-Global-Gender-Gap-Report-2015-207-320.jpg)

![Index over the years
SAMPLE INDEX ECONOMY EDUCATION HEALTH POLITICS
Year No. of countries Rank Score Rank Score Rank Score Rank Score Rank Score
2015 145 92 0.681 114 0.593 89 0.986 60 0.976 71 0.168
2014 142 97 0.672 108 0.598 78 0.989 58 0.976 86 0.126
2013 136 95 0.661 103 0.588 101 0.957 107 0.966 75 0.133
2012 135 97 0.659 104 0.565 92 0.973 107 0.966 73 0.132
2011 135 90 0.659 101 0.564 93 0.967 106 0.966 61 0.140
2010 134 87 0.661 100 0.575 95 0.964 105 0.966 58 0.141
2009 134 92 0.658 100 0.572 95 0.966 87 0.972 70 0.122
2008 130 93 0.647 90 0.571 97 0.945 82 0.972 80 0.101
2007 128 81 0.655 82 0.599 93 0.949 81 0.972 70 0.101
2006 115 68 0.654 67 0.598 81 0.949 88 0.969 63 0.101
2006–2015 CHANGE s 0.027 t –0.006 s 0.038 s 0.008 s 0.067
Part 2: Country Profiles
The Global Gender Gap Report 2015 | 201
1 Survey data, responses on a 1-to-7 scale (1 = worst score, 7 = best score)
2 Bracketed numbers show the range between the uncertainties, estimated to contain the true maternal mortality ratio with a 95% probability
3 Data on a 0-to-1 scale (1 = worst score, 0 = best score)
Indonesia
Selected contextual data
EMPLOYMENT AND LEADERSHIP
Female, male adult unemployment
(as % of female, male labour force)............................................................6.4, 6.0
Female, male part-time employment
(as % of total female, male employment)...............................................31.0, 16.7
Female, male workers in informal employment
(as % of non-agricultural employment).......................................................—, —
Share of women in wage employment in the non-agricultural sector
(% of total non-agricultural employment).......................................................... 33
Average minutes spent per day on unpaid work (female, male)......................—, —
Percentage of women, men with an account
at a financial institution................................................................................37, 35
Ability of women to rise to positions of leadership1............................................. 4.7
Firms with female top managers (% of firms)....................................................... 31
Share of women on boards of listed companies (%)............................................. 18
Firms with female participation in ownership (% of firms).................................... 43
Percentage of total R&D personnel (FTE) (female, male).................................—, —
EDUCATION AND TECHNOLOGY
Out-of-school children of primary school age (%) (female, male).....................42, 58
Female, male primary education attainment rate (% aged 25+)......................70, 79
Female, male secondary education attainment rate (% aged 25+)..................40, 49
Female, male tertiary education attainment rate (% aged 25+)...........................8, 8
Percentage of tertiary-level students enrolled in STEM studies
(female, male).............................................................................................—, —
Percentage of tertiary-level graduates in STEM studies (female, male)...........—, —
Percentage of PhD graduates (female, male)...................................................41, 59
Percentage of individuals using the internet (female, male)...............................9, 11
Percentage of individuals using a
mobile cellular telephone (female, male)..................................................... —, 35
HEALTH
Cardiovascular disease age-standardized deaths
per 100,000 (female, male)................................................................337.0, 407.5
Cancer age-standardized deaths per 100,000
excl. non-melanoma skin cancer (female, male)...................................94.8, 132.6
Diabetes age-standardized deaths per 100,000 (female, male).................71.9, 48.9
Chronic respiratory disease age-standardized deaths
per 100,000 (female, male)....................................................................34.2, 85.4
HEALTH (cont’d.)
HIV/AIDS age-standardized deaths per 100,000 (female, male)...................7.1, 13.2
Malaria age-standardized deaths per 100,000 (female, male).......................2.2, 6.2
Tuberculosis age-standardized deaths per 100,000 (female, male)............24.7, 48.7
Malnutrition prev., weight for age (female, male) (% of children <5)..........19.4, 20.5
Maternal mortality ratio (per 100,000 live births)2.............................190 [120–300]
Total fertility rate (children per women)............................................................... 2.3
Adolescent fertility rate (births per 1,000 girls aged 15–19).............................. 47.0
Antenatal care coverage, at least one visit (%)..................................................... 96
Births attended by skilled health personnel (%).................................................... 83
Contraceptive prevalence, any method
(% of married or in-union women aged 15–49)................................................. 63
Existence of legislation permitting abortion
to preserve a woman’s physical health.............................................................. No
FAMILY
Singulate mean age (years) at marriage (female, male)...................................22, 26
Early marriage (% of women aged 15–19)........................................................... 14
Mean age of women at the birth of the first child................................................. —
Length of paid maternity leave (calendar days)..................................................... 90
Provider of maternity leave benefits............................................................Employer
Percent of wages paid during maternity leave.................................................... 100
Length of paid paternity leave (calendar days)........................................................ 2
Provider of paternity leave benefits.............................................................Employer
Percent of wages paid during paternity leave..................................................... 100
RIGHTS AND NORMS
Parental authority in marriage3............................................................................ 0.5
Parental authority after divorce3.......................................................................... 0.5
Female genital mutilation (% of women aged 15–49).......................................... 0.0
Existence of legislation on domestic violence3..................................................... 0.5
Existence of legislation on gender-based discrimination....................................... —
Inheritance rights for daughters3......................................................................... 0.5
Women’s secure access to land use, control and ownership3.............................. 0.0
Women’s access to financial services3................................................................ 0.5
Women’s secure access to non-land assets use, control and ownership3............ 0.0
Year women received right to vote...........................................................1945, 2003
Quota type (single/lower house).................................... Legislated Candidate Quotas
Voluntary political party quotas............................................................................. No](https://image.slidesharecdn.com/theglobalgendergapreport2015-160119013910/85/The-Global-Gender-Gap-Report-2015-209-320.jpg)

![Index over the years
SAMPLE INDEX ECONOMY EDUCATION HEALTH POLITICS
Year No. of countries Rank Score Rank Score Rank Score Rank Score Rank Score
2015 145 141 0.580 141 0.357 106 0.954 99 0.971 137 0.037
2014 142 137 0.581 139 0.359 104 0.957 89 0.971 135 0.037
2013 136 130 0.584 130 0.365 98 0.965 87 0.971 129 0.035
2012 135 127 0.593 130 0.412 101 0.953 87 0.971 126 0.035
2011 135 125 0.589 125 0.444 105 0.925 85 0.971 130 0.017
2010 134 123 0.593 125 0.426 96 0.959 83 0.971 129 0.017
2009 134 128 0.584 131 0.377 96 0.964 63 0.978 132 0.017
2008 130 116 0.602 118 0.449 92 0.965 60 0.978 128 0.017
2007 128 118 0.590 123 0.395 90 0.958 58 0.978 122 0.031
2006 115 108 0.580 113 0.359 80 0.954 52 0.978 109 0.031
2006–2015 CHANGE t 0.000 t –0.001 s 0.000 t –0.007 s 0.006
Part 2: Country Profiles
The Global Gender Gap Report 2015 | 203
1 Survey data, responses on a 1-to-7 scale (1 = worst score, 7 = best score)
2 Bracketed numbers show the range between the uncertainties, estimated to contain the true maternal mortality ratio with a 95% probability
3 Data on a 0-to-1 scale (1 = worst score, 0 = best score)
Iran, Islamic Rep.
Selected contextual data
EMPLOYMENT AND LEADERSHIP
Female, male adult unemployment
(as % of female, male labour force)..........................................................19.8, 8.6
Female, male part-time employment
(as % of total female, male employment)....................................................—, —
Female, male workers in informal employment
(as % of non-agricultural employment).......................................................—, —
Share of women in wage employment in the non-agricultural sector
(% of total non-agricultural employment).......................................................... 15
Average minutes spent per day on unpaid work (female, male)......................—, —
Percentage of women, men with an account
at a financial institution................................................................................87, 97
Ability of women to rise to positions of leadership1............................................. 3.5
Firms with female top managers (% of firms)....................................................... —
Share of women on boards of listed companies (%)............................................. —
Firms with female participation in ownership (% of firms).................................... —
Percentage of total R&D personnel (FTE) (female, male).................................—, —
EDUCATION AND TECHNOLOGY
Out-of-school children of primary school age (%) (female, male).....................65, 35
Female, male primary education attainment rate (% aged 25+)..................100, 100
Female, male secondary education attainment rate (% aged 25+)..................62, 67
Female, male tertiary education attainment rate (% aged 25+).......................18, 21
Percentage of tertiary-level students enrolled in STEM studies
(female, male)..............................................................................................35, 65
Percentage of tertiary-level graduates in STEM studies (female, male)............32, 68
Percentage of PhD graduates (female, male)...................................................35, 65
Percentage of individuals using the internet (female, male).............................26, 34
Percentage of individuals using a
mobile cellular telephone (female, male)......................................................78, 67
HEALTH
Cardiovascular disease age-standardized deaths
per 100,000 (female, male)................................................................329.6, 371.0
Cancer age-standardized deaths per 100,000
excl. non-melanoma skin cancer (female, male)...................................81.4, 112.6
Diabetes age-standardized deaths per 100,000 (female, male).................18.9, 15.1
Chronic respiratory disease age-standardized deaths
per 100,000 (female, male)....................................................................24.3, 33.3
HEALTH (cont’d.)
HIV/AIDS age-standardized deaths per 100,000 (female, male).....................1.6, 9.5
Malaria age-standardized deaths per 100,000 (female, male).......................0.0, 0.0
Tuberculosis age-standardized deaths per 100,000 (female, male)................3.0, 4.5
Malnutrition prev., weight for age (female, male) (% of children <5)...............—, —
Maternal mortality ratio (per 100,000 live births)2...................................23 [16–35]
Total fertility rate (children per women)............................................................... 1.9
Adolescent fertility rate (births per 1,000 girls aged 15–19).............................. 23.0
Antenatal care coverage, at least one visit (%)..................................................... 97
Births attended by skilled health personnel (%).................................................... 96
Contraceptive prevalence, any method
(% of married or in-union women aged 15–49)................................................. 77
Existence of legislation permitting abortion
to preserve a woman’s physical health.............................................................. No
FAMILY
Singulate mean age (years) at marriage (female, male)...................................24, 27
Early marriage (% of women aged 15–19)........................................................... 21
Mean age of women at the birth of the first child................................................. —
Length of paid maternity leave (calendar days)................................................... 270
Provider of maternity leave benefits........................................................Government
Percent of wages paid during maternity leave...................................................... 67
Length of paid paternity leave (calendar days)...................................................... 14
Provider of paternity leave benefits.........................................................Government
Percent of wages paid during paternity leave..................................................... 100
RIGHTS AND NORMS
Parental authority in marriage3............................................................................ 1.0
Parental authority after divorce3.......................................................................... 1.0
Female genital mutilation (% of women aged 15–49).......................................... 0.0
Existence of legislation on domestic violence3..................................................... 1.0
Existence of legislation on gender-based discrimination....................................... —
Inheritance rights for daughters3......................................................................... 1.0
Women’s secure access to land use, control and ownership3.............................. 0.5
Women’s access to financial services3................................................................ 0.5
Women’s secure access to non-land assets use, control and ownership3............ 0.5
Year women received right to vote.................................................................... 1963
Quota type (single/lower house)............................................................................ —
Voluntary political party quotas............................................................................. —](https://image.slidesharecdn.com/theglobalgendergapreport2015-160119013910/85/The-Global-Gender-Gap-Report-2015-211-320.jpg)

![Index over the years
SAMPLE INDEX ECONOMY EDUCATION HEALTH POLITICS
Year No. of countries Rank Score Rank Score Rank Score Rank Score Rank Score
2015 145 5 0.807 26 0.777 44 0.998 56 0.979 6 0.474
2014 142 8 0.785 28 0.754 40 0.998 67 0.974 8 0.414
2013 136 6 0.782 29 0.745 34 0.999 65 0.974 6 0.412
2012 135 5 0.784 29 0.751 30 0.999 69 0.974 6 0.412
2011 135 5 0.783 30 0.732 1 1.000 72 0.974 6 0.426
2010 134 6 0.777 25 0.741 1 1.000 89 0.970 7 0.398
2009 134 8 0.760 43 0.692 1 1.000 86 0.973 8 0.374
2008 130 8 0.752 48 0.681 1 1.000 81 0.973 8 0.354
2007 128 9 0.746 48 0.667 1 1.000 80 0.973 8 0.343
2006 115 10 0.733 47 0.640 1 1.000 81 0.970 9 0.323
2006–2015 CHANGE s 0.073 s 0.136 t –0.002 s 0.008 s 0.151
Part 2: Country Profiles
The Global Gender Gap Report 2015 | 205
1 Survey data, responses on a 1-to-7 scale (1 = worst score, 7 = best score)
2 Bracketed numbers show the range between the uncertainties, estimated to contain the true maternal mortality ratio with a 95% probability
3 Data on a 0-to-1 scale (1 = worst score, 0 = best score)
Ireland
Selected contextual data
EMPLOYMENT AND LEADERSHIP
Female, male adult unemployment
(as % of female, male labour force)........................................................10.7, 15.0
Female, male part-time employment
(as % of total female, male employment)...............................................35.3, 13.9
Female, male workers in informal employment
(as % of non-agricultural employment).......................................................—, —
Share of women in wage employment in the non-agricultural sector
(% of total non-agricultural employment).......................................................... 52
Average minutes spent per day on unpaid work (female, male)...................296, 129
Percentage of women, men with an account
at a financial institution................................................................................95, 95
Ability of women to rise to positions of leadership1............................................. 5.0
Firms with female top managers (% of firms)....................................................... —
Share of women on boards of listed companies (%)............................................... 6
Firms with female participation in ownership (% of firms).................................... 42
Percentage of total R&D personnel (FTE) (female, male)..................................31, 70
EDUCATION AND TECHNOLOGY
Out-of-school children of primary school age (%) (female, male).....................34, 66
Female, male primary education attainment rate (% aged 25+)......................94, 93
Female, male secondary education attainment rate (% aged 25+)..................81, 79
Female, male tertiary education attainment rate (% aged 25+).......................33, 28
Percentage of tertiary-level students enrolled in STEM studies
(female, male)..............................................................................................28, 72
Percentage of tertiary-level graduates in STEM studies (female, male)............29, 71
Percentage of PhD graduates (female, male)...................................................49, 51
Percentage of individuals using the internet (female, male).............................79, 78
Percentage of individuals using a
mobile cellular telephone (female, male).....................................................—, —
HEALTH
Cardiovascular disease age-standardized deaths
per 100,000 (female, male)..................................................................93.5, 147.5
Cancer age-standardized deaths per 100,000
excl. non-melanoma skin cancer (female, male).................................107.3, 149.2
Diabetes age-standardized deaths per 100,000 (female, male).....................4.7, 8.9
Chronic respiratory disease age-standardized deaths
per 100,000 (female, male)....................................................................20.1, 33.0
HEALTH (cont’d.)
HIV/AIDS age-standardized deaths per 100,000 (female, male).....................0.2, 0.3
Malaria age-standardized deaths per 100,000 (female, male).......................0.0, 0.0
Tuberculosis age-standardized deaths per 100,000 (female, male)................0.4, 0.7
Malnutrition prev., weight for age (female, male) (% of children <5)...............—, —
Maternal mortality ratio (per 100,000 live births)2.......................................9 [5–13]
Total fertility rate (children per women)............................................................... 2.0
Adolescent fertility rate (births per 1,000 girls aged 15–19).............................. 14.0
Antenatal care coverage, at least one visit (%)................................................... 100
Births attended by skilled health personnel (%).................................................. 100
Contraceptive prevalence, any method
(% of married or in-union women aged 15–49)................................................. 65
Existence of legislation permitting abortion
to preserve a woman’s physical health.............................................................. No
FAMILY
Singulate mean age (years) at marriage (female, male)...................................32, 33
Early marriage (% of women aged 15–19)............................................................. 0
Mean age of women at the birth of the first child................................................. 29
Length of paid maternity leave (calendar days)................................................... 182
Provider of maternity leave benefits........................................................Government
Percent of wages paid during maternity leave...................................................... 35
Length of paid paternity leave (calendar days)...................................................... —
Provider of paternity leave benefits....................................................................... —
Percent of wages paid during paternity leave....................................................... —
RIGHTS AND NORMS
Parental authority in marriage3............................................................................ 0.0
Parental authority after divorce3.......................................................................... 0.0
Female genital mutilation (% of women aged 15–49).......................................... 0.0
Existence of legislation on domestic violence3..................................................... 0.0
Existence of legislation on gender-based discrimination...................................... Yes
Inheritance rights for daughters3......................................................................... 0.0
Women’s secure access to land use, control and ownership3.............................. 0.0
Women’s access to financial services3................................................................ 0.0
Women’s secure access to non-land assets use, control and ownership3............ 0.0
Year women received right to vote...........................................................1918, 1928
Quota type (single/lower house).................................... Legislated Candidate Quotas
Voluntary political party quotas............................................................................. No](https://image.slidesharecdn.com/theglobalgendergapreport2015-160119013910/85/The-Global-Gender-Gap-Report-2015-213-320.jpg)
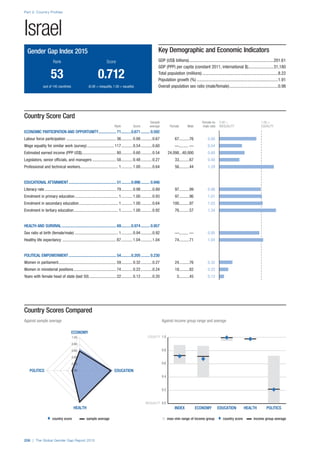
![Index over the years
SAMPLE INDEX ECONOMY EDUCATION HEALTH POLITICS
Year No. of countries Rank Score Rank Score Rank Score Rank Score Rank Score
2015 145 53 0.712 71 0.671 51 0.996 69 0.974 54 0.205
2014 142 65 0.700 90 0.639 49 0.996 96 0.970 49 0.196
2013 136 53 0.703 56 0.691 82 0.987 93 0.970 57 0.164
2012 135 56 0.699 53 0.682 80 0.987 94 0.970 54 0.156
2011 135 55 0.693 55 0.672 78 0.987 92 0.970 59 0.141
2010 134 52 0.696 49 0.688 80 0.987 91 0.970 63 0.138
2009 134 45 0.702 41 0.693 50 0.995 98 0.970 53 0.150
2008 130 56 0.690 55 0.659 42 0.996 93 0.970 59 0.135
2007 128 36 0.696 45 0.671 38 0.995 92 0.970 41 0.150
2006 115 35 0.689 46 0.641 36 0.995 83 0.969 36 0.150
2006–2015 CHANGE s 0.023 s 0.030 s 0.001 s 0.005 s 0.055
Part 2: Country Profiles
The Global Gender Gap Report 2015 | 207
1 Survey data, responses on a 1-to-7 scale (1 = worst score, 7 = best score)
2 Bracketed numbers show the range between the uncertainties, estimated to contain the true maternal mortality ratio with a 95% probability
3 Data on a 0-to-1 scale (1 = worst score, 0 = best score)
Israel
Selected contextual data
EMPLOYMENT AND LEADERSHIP
Female, male adult unemployment
(as % of female, male labour force)............................................................7.0, 6.8
Female, male part-time employment
(as % of total female, male employment).................................................17.9, 7.0
Female, male workers in informal employment
(as % of non-agricultural employment).......................................................—, —
Share of women in wage employment in the non-agricultural sector
(% of total non-agricultural employment).......................................................... 49
Average minutes spent per day on unpaid work (female, male)......................—, —
Percentage of women, men with an account
at a financial institution................................................................................90, 90
Ability of women to rise to positions of leadership1............................................. 4.6
Firms with female top managers (% of firms)....................................................... 10
Share of women on boards of listed companies (%)............................................. —
Firms with female participation in ownership (% of firms).................................... 27
Percentage of total R&D personnel (FTE) (female, male)..................................24, 77
EDUCATION AND TECHNOLOGY
Out-of-school children of primary school age (%) (female, male).....................44, 56
Female, male primary education attainment rate (% aged 25+)......................93, 97
Female, male secondary education attainment rate (% aged 25+)..................84, 87
Female, male tertiary education attainment rate (% aged 25+).......................47, 41
Percentage of tertiary-level students enrolled in STEM studies
(female, male)..............................................................................................31, 69
Percentage of tertiary-level graduates in STEM studies (female, male)............31, 69
Percentage of PhD graduates (female, male)...................................................52, 48
Percentage of individuals using the internet (female, male).............................68, 73
Percentage of individuals using a
mobile cellular telephone (female, male)......................................................94, 91
HEALTH
Cardiovascular disease age-standardized deaths
per 100,000 (female, male)..................................................................70.1, 105.0
Cancer age-standardized deaths per 100,000
excl. non-melanoma skin cancer (female, male)...................................95.7, 129.1
Diabetes age-standardized deaths per 100,000 (female, male).................17.6, 23.3
Chronic respiratory disease age-standardized deaths
per 100,000 (female, male)....................................................................14.4, 24.1
HEALTH (cont’d.)
HIV/AIDS age-standardized deaths per 100,000 (female, male).....................0.2, 0.6
Malaria age-standardized deaths per 100,000 (female, male).......................0.0, 0.0
Tuberculosis age-standardized deaths per 100,000 (female, male)................0.1, 0.3
Malnutrition prev., weight for age (female, male) (% of children <5)...............—, —
Maternal mortality ratio (per 100,000 live births)2.........................................2 [1–4]
Total fertility rate (children per women)............................................................... 2.9
Adolescent fertility rate (births per 1,000 girls aged 15–19).............................. 13.1
Antenatal care coverage, at least one visit (%)..................................................... —
Births attended by skilled health personnel (%).................................................... —
Contraceptive prevalence, any method
(% of married or in-union women aged 15–49)................................................. —
Existence of legislation permitting abortion
to preserve a woman’s physical health............................................................. Yes
FAMILY
Singulate mean age (years) at marriage (female, male)...................................26, 29
Early marriage (% of women aged 15–19)............................................................. 3
Mean age of women at the birth of the first child................................................. 27
Length of paid maternity leave (calendar days)..................................................... 98
Provider of maternity leave benefits........................................................Government
Percent of wages paid during maternity leave.................................................... 100
Length of paid paternity leave (calendar days)........................................................ 0
Provider of paternity leave benefits....................................................................... —
Percent of wages paid during paternity leave....................................................... —
RIGHTS AND NORMS
Parental authority in marriage3............................................................................ 0.0
Parental authority after divorce3.......................................................................... 0.0
Female genital mutilation (% of women aged 15–49).......................................... 0.0
Existence of legislation on domestic violence3..................................................... 0.3
Existence of legislation on gender-based discrimination...................................... Yes
Inheritance rights for daughters3......................................................................... 0.0
Women’s secure access to land use, control and ownership3.............................. 0.0
Women’s access to financial services3................................................................ 0.0
Women’s secure access to non-land assets use, control and ownership3............ 0.0
Year women received right to vote.................................................................... 1948
Quota type (single/lower house)............................................................................ —
Voluntary political party quotas............................................................................. —](https://image.slidesharecdn.com/theglobalgendergapreport2015-160119013910/85/The-Global-Gender-Gap-Report-2015-215-320.jpg)

![Index over the years
SAMPLE INDEX ECONOMY EDUCATION HEALTH POLITICS
Year No. of countries Rank Score Rank Score Rank Score Rank Score Rank Score
2015 145 41 0.726 111 0.603 58 0.995 74 0.974 24 0.331
2014 142 69 0.697 114 0.574 62 0.994 70 0.974 37 0.248
2013 136 71 0.689 97 0.597 65 0.992 72 0.973 44 0.191
2012 135 80 0.673 101 0.591 65 0.992 76 0.973 71 0.135
2011 135 74 0.680 90 0.598 48 0.995 75 0.974 55 0.152
2010 134 74 0.677 97 0.589 49 0.995 95 0.970 54 0.152
2009 134 72 0.680 95 0.590 46 0.996 88 0.972 45 0.162
2008 130 67 0.679 85 0.587 43 0.996 83 0.972 46 0.160
2007 128 84 0.650 101 0.543 32 0.997 82 0.972 80 0.087
2006 115 77 0.646 87 0.527 27 0.997 77 0.972 72 0.087
2006–2015 CHANGE s 0.080 s 0.076 t –0.002 s 0.002 s 0.244
Part 2: Country Profiles
The Global Gender Gap Report 2015 | 209
1 Survey data, responses on a 1-to-7 scale (1 = worst score, 7 = best score)
2 Bracketed numbers show the range between the uncertainties, estimated to contain the true maternal mortality ratio with a 95% probability
3 Data on a 0-to-1 scale (1 = worst score, 0 = best score)
Italy
Selected contextual data
EMPLOYMENT AND LEADERSHIP
Female, male adult unemployment
(as % of female, male labour force)........................................................13.1, 11.5
Female, male part-time employment
(as % of total female, male employment).................................................31.1, 7.1
Female, male workers in informal employment
(as % of non-agricultural employment).......................................................—, —
Share of women in wage employment in the non-agricultural sector
(% of total non-agricultural employment).......................................................... 45
Average minutes spent per day on unpaid work (female, male)...................315, 104
Percentage of women, men with an account
at a financial institution................................................................................83, 92
Ability of women to rise to positions of leadership1............................................. 3.5
Firms with female top managers (% of firms)....................................................... —
Share of women on boards of listed companies (%)............................................... 8
Firms with female participation in ownership (% of firms).................................... —
Percentage of total R&D personnel (FTE) (female, male)..................................35, 66
EDUCATION AND TECHNOLOGY
Out-of-school children of primary school age (%) (female, male).....................57, 43
Female, male primary education attainment rate (% aged 25+)......................93, 96
Female, male secondary education attainment rate (% aged 25+)..................71, 81
Female, male tertiary education attainment rate (% aged 25+).......................13, 12
Percentage of tertiary-level students enrolled in STEM studies
(female, male)..............................................................................................38, 62
Percentage of tertiary-level graduates in STEM studies (female, male)............45, 55
Percentage of PhD graduates (female, male)...................................................53, 47
Percentage of individuals using the internet (female, male).............................54, 63
Percentage of individuals using a
mobile cellular telephone (female, male).....................................................—, —
HEALTH
Cardiovascular disease age-standardized deaths
per 100,000 (female, male)..................................................................85.4, 129.7
Cancer age-standardized deaths per 100,000
excl. non-melanoma skin cancer (female, male)...................................90.2, 150.8
Diabetes age-standardized deaths per 100,000 (female, male)...................9.5, 13.1
Chronic respiratory disease age-standardized deaths
per 100,000 (female, male)....................................................................10.0, 23.5
HEALTH (cont’d.)
HIV/AIDS age-standardized deaths per 100,000 (female, male).....................0.5, 1.7
Malaria age-standardized deaths per 100,000 (female, male).......................0.0, 0.0
Tuberculosis age-standardized deaths per 100,000 (female, male)................0.2, 0.4
Malnutrition prev., weight for age (female, male) (% of children <5)...............—, —
Maternal mortality ratio (per 100,000 live births)2.........................................4 [3–6]
Total fertility rate (children per women)............................................................... 1.5
Adolescent fertility rate (births per 1,000 girls aged 15–19)................................ 6.6
Antenatal care coverage, at least one visit (%)..................................................... 98
Births attended by skilled health personnel (%).................................................. 100
Contraceptive prevalence, any method
(% of married or in-union women aged 15–49)................................................. 63
Existence of legislation permitting abortion
to preserve a woman’s physical health............................................................. Yes
FAMILY
Singulate mean age (years) at marriage (female, male)...................................31, 34
Early marriage (% of women aged 15–19)............................................................. 0
Mean age of women at the birth of the first child................................................. 29
Length of paid maternity leave (calendar days)................................................... 150
Provider of maternity leave benefits........................................................Government
Percent of wages paid during maternity leave...................................................... 80
Length of paid paternity leave (calendar days)........................................................ 1
Provider of paternity leave benefits.........................................................Government
Percent of wages paid during paternity leave..................................................... 100
RIGHTS AND NORMS
Parental authority in marriage3............................................................................ 0.0
Parental authority after divorce3.......................................................................... 0.0
Female genital mutilation (% of women aged 15–49).......................................... 0.0
Existence of legislation on domestic violence3..................................................... 0.3
Existence of legislation on gender-based discrimination...................................... Yes
Inheritance rights for daughters3......................................................................... 0.0
Women’s secure access to land use, control and ownership3.............................. 0.0
Women’s access to financial services3................................................................ 0.0
Women’s secure access to non-land assets use, control and ownership3............ 0.0
Year women received right to vote.................................................................... 1945
Quota type (single/lower house)............................................................ No legislated
Voluntary political party quotas............................................................................ Yes](https://image.slidesharecdn.com/theglobalgendergapreport2015-160119013910/85/The-Global-Gender-Gap-Report-2015-217-320.jpg)

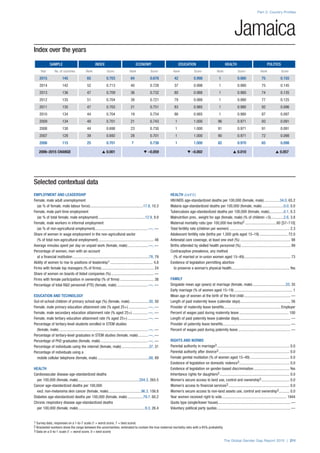


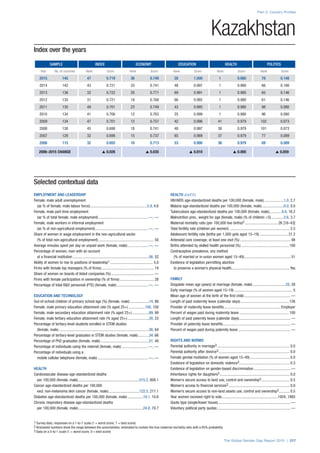

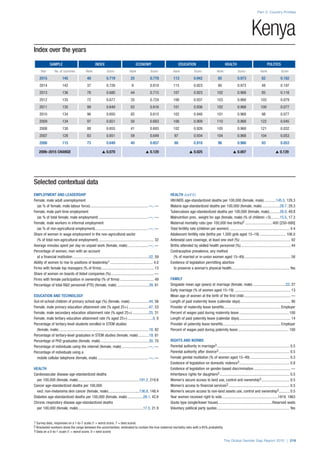

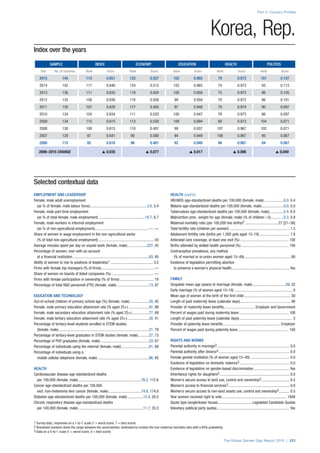


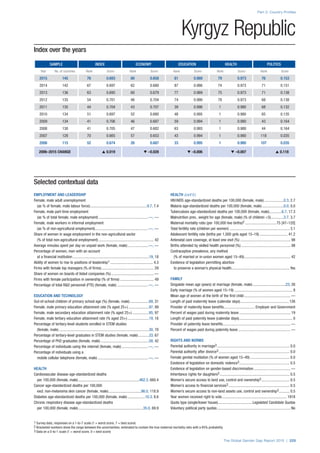


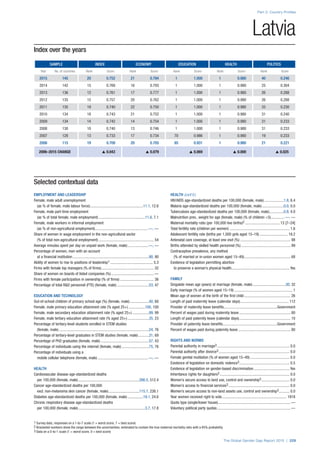


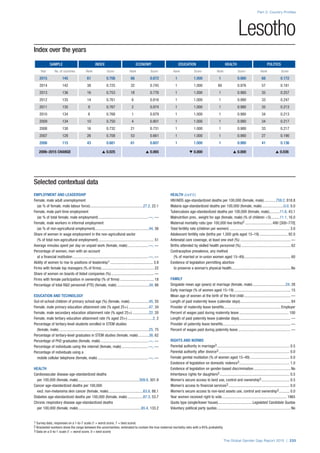

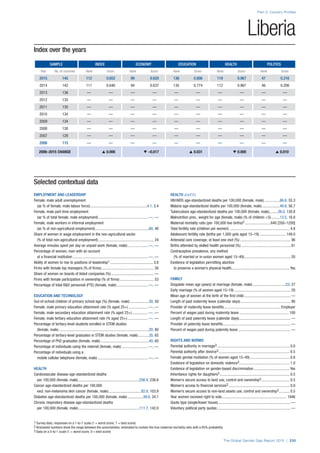


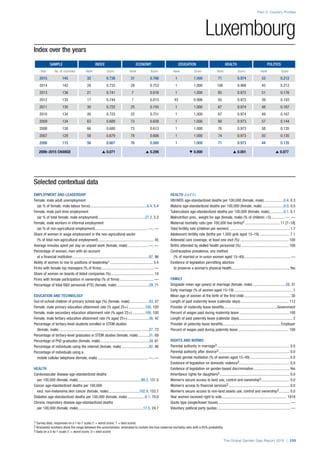
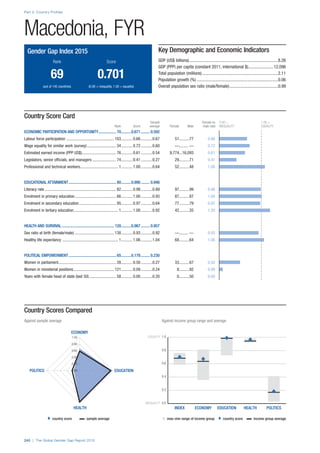
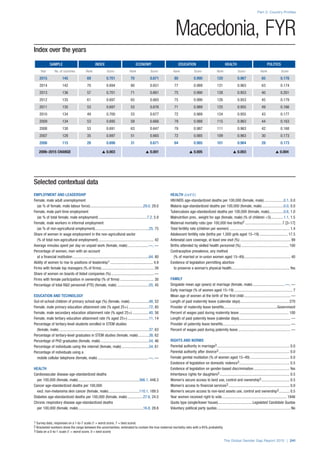

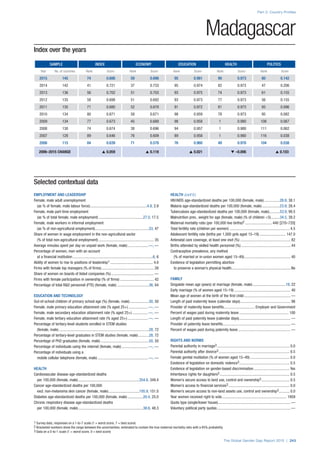

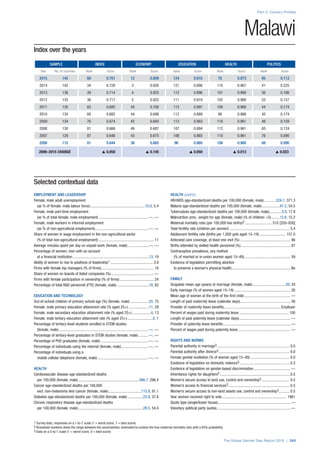


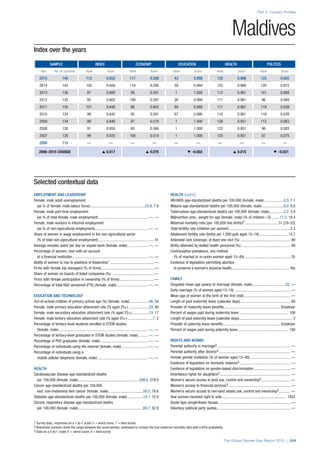

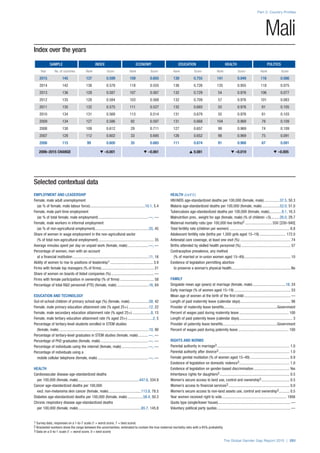

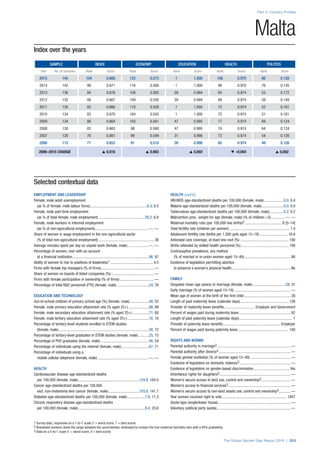
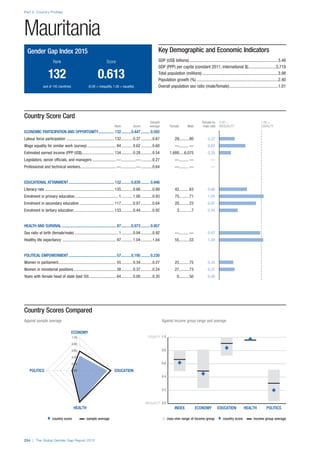
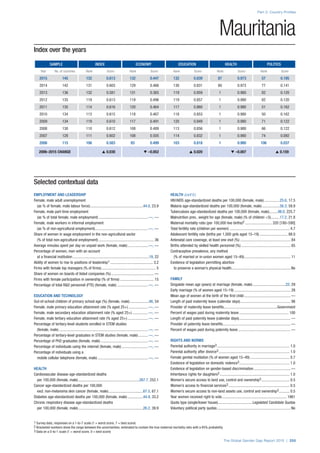


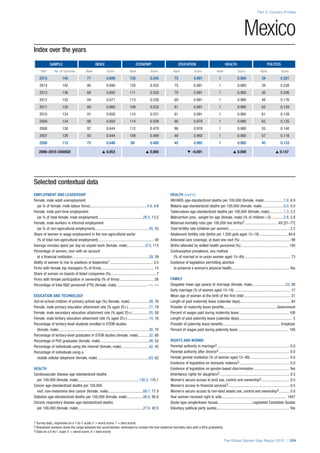

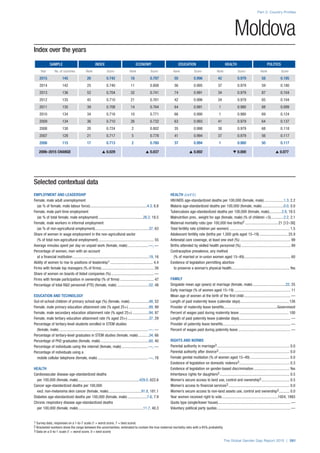

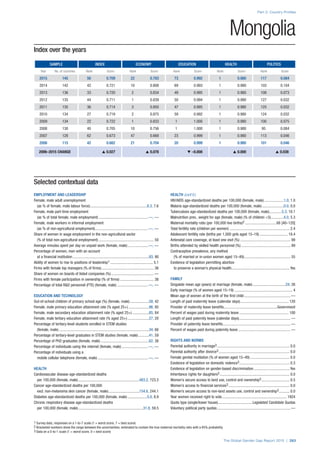

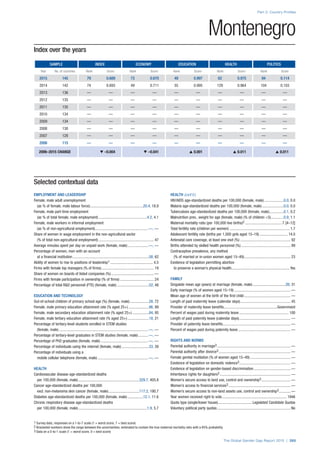

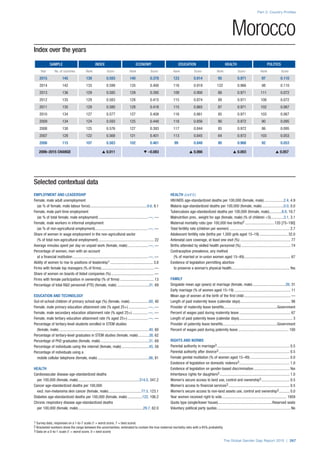


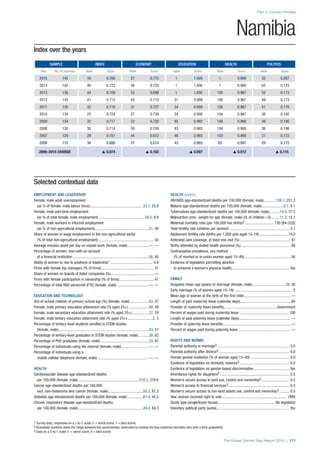

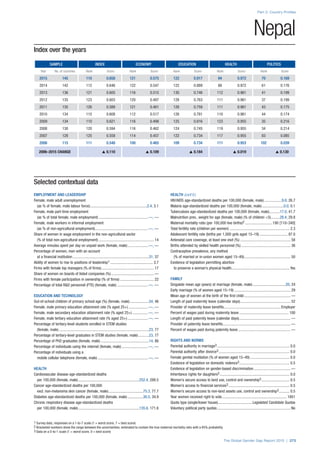

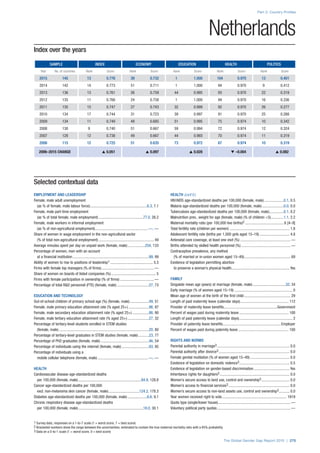
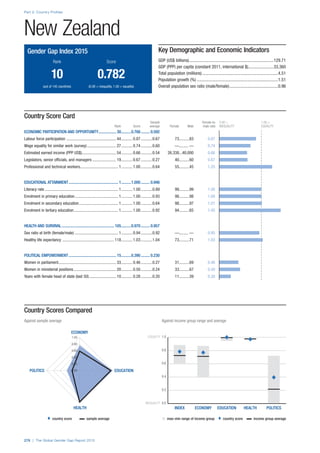
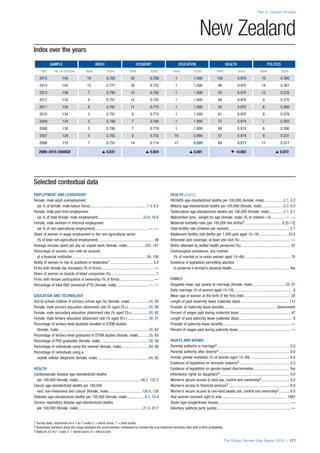

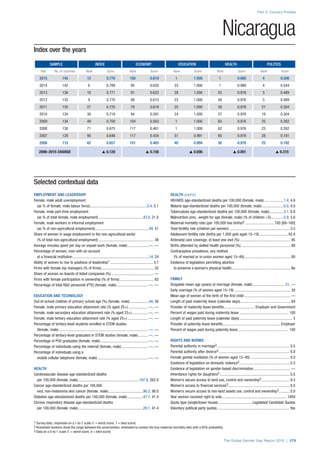

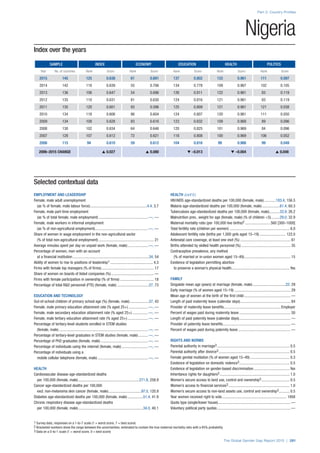

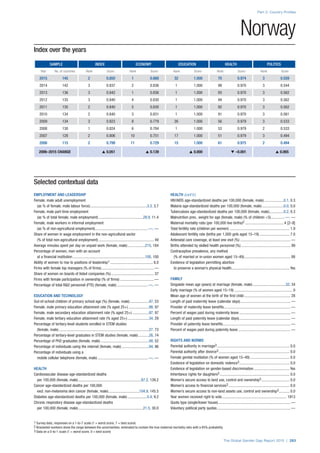

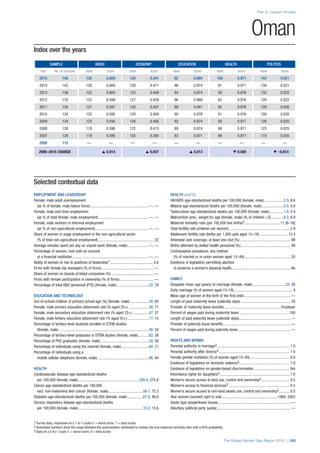

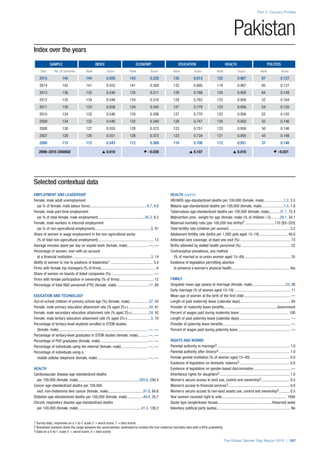


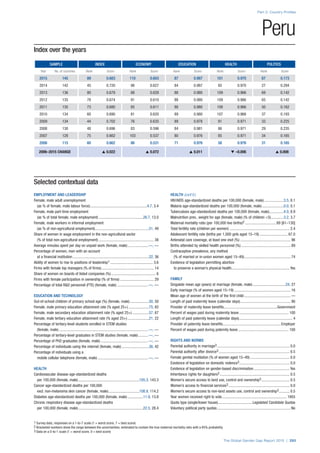
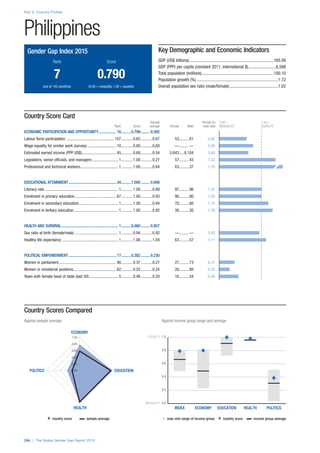
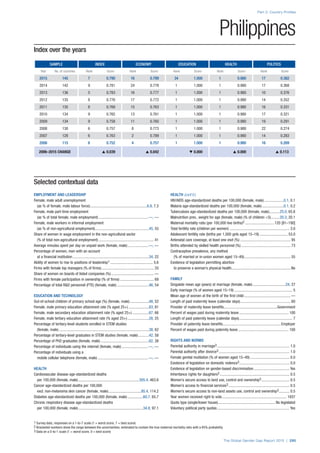


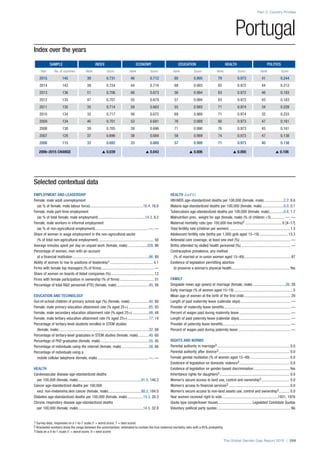


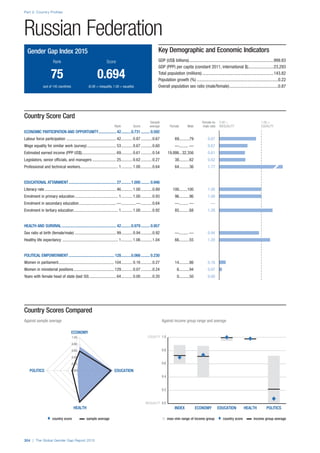
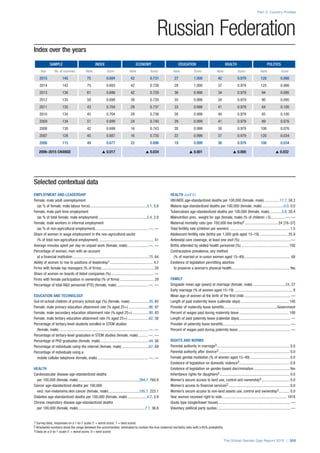
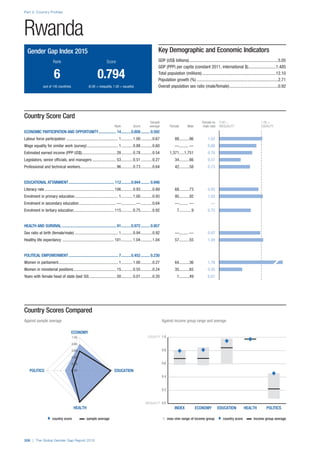
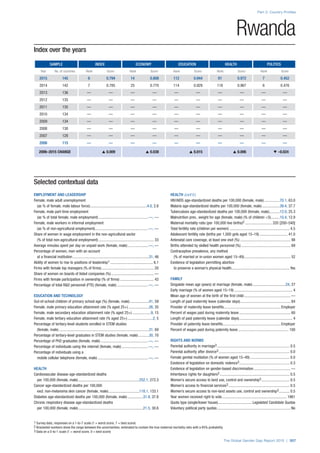

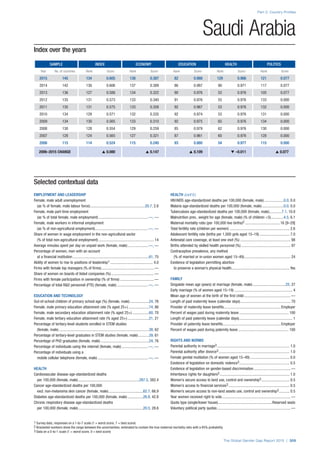
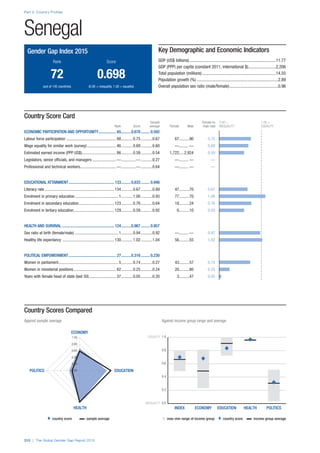
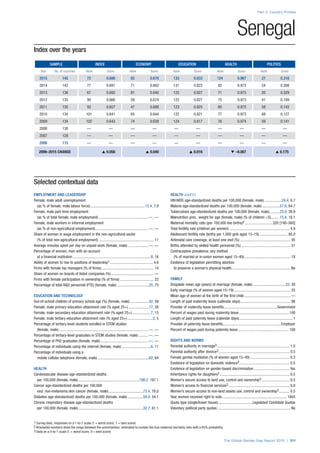

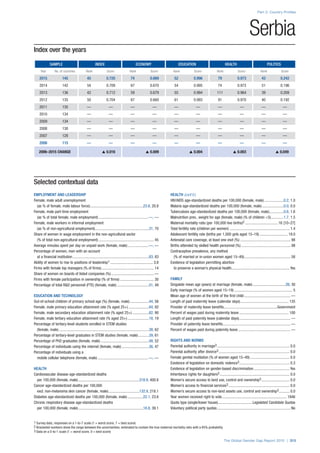


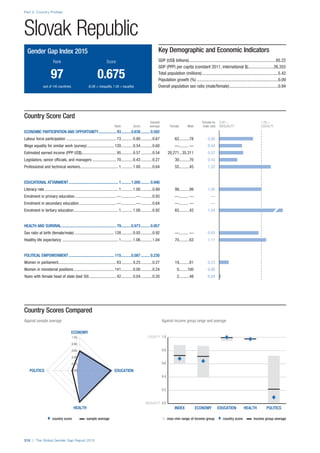


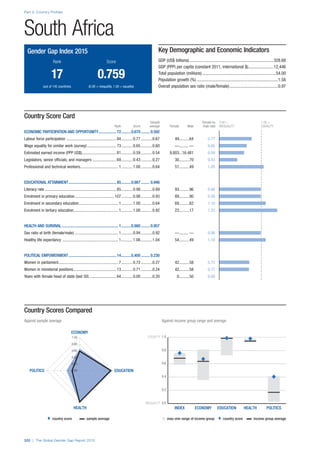

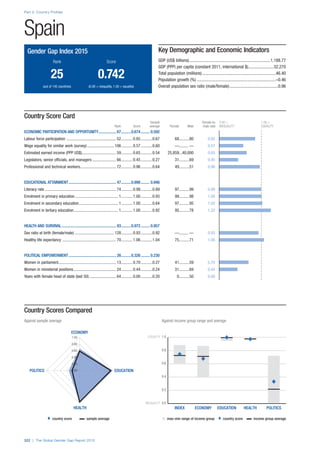
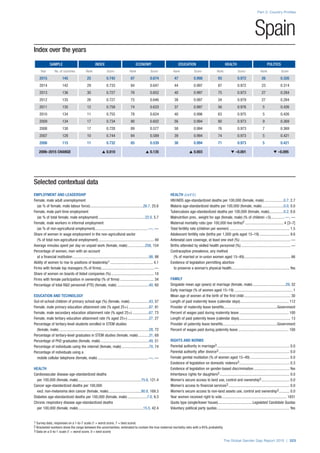

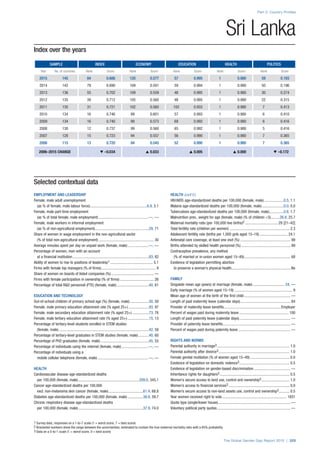

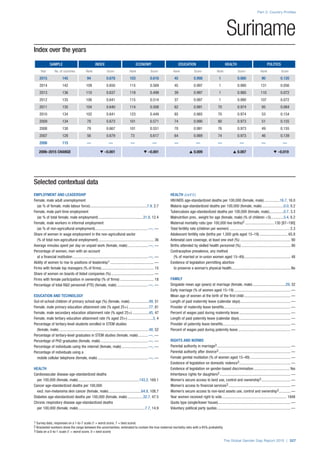


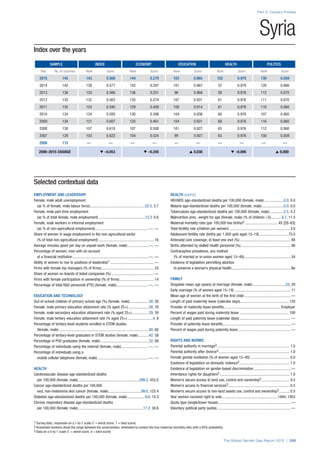


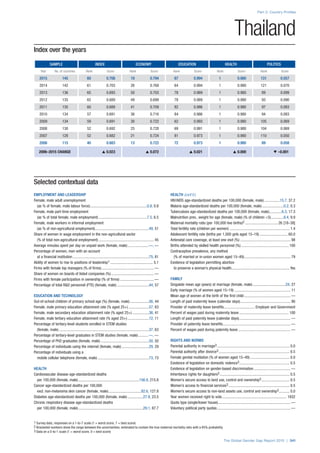
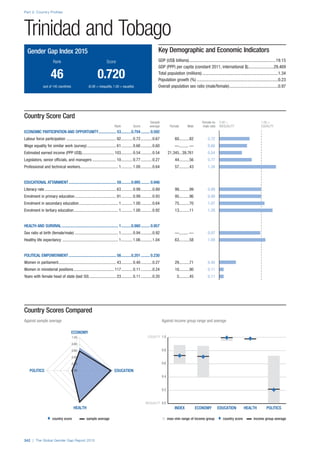
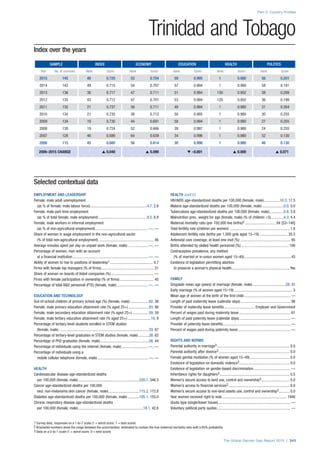


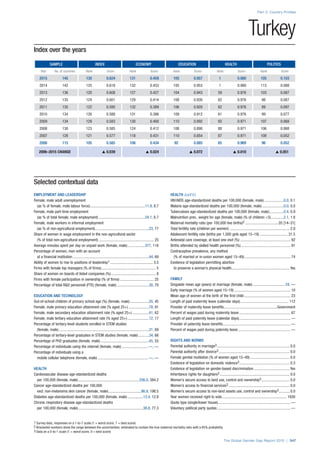


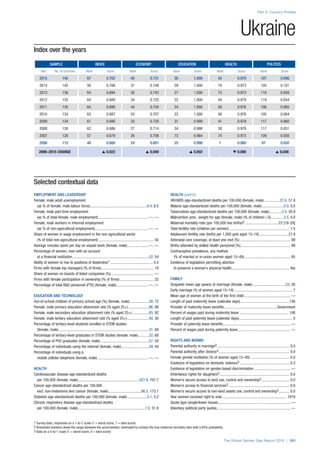

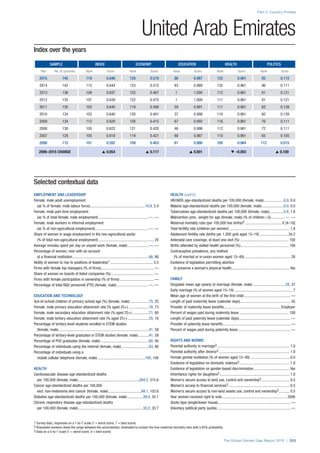

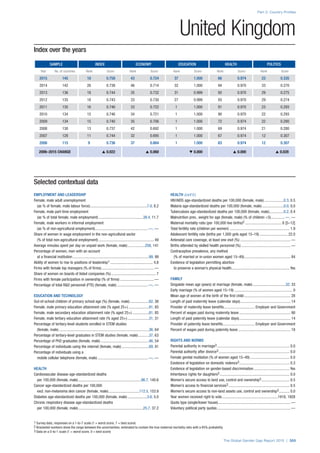

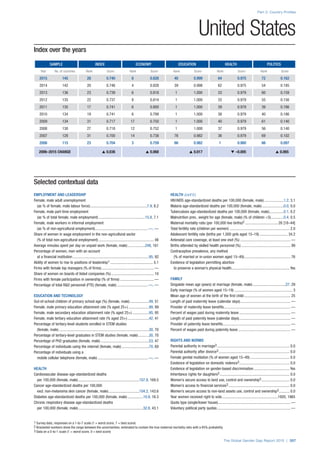


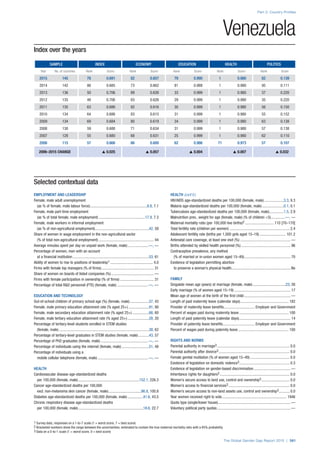


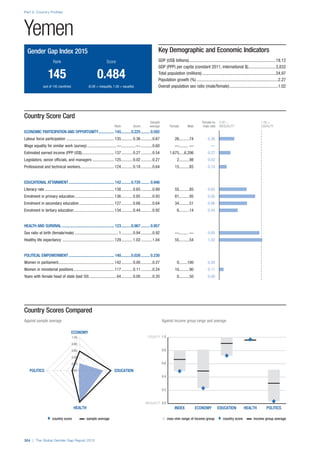

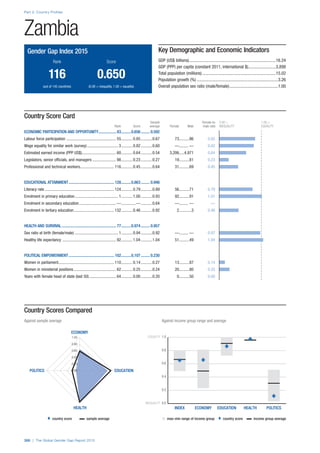
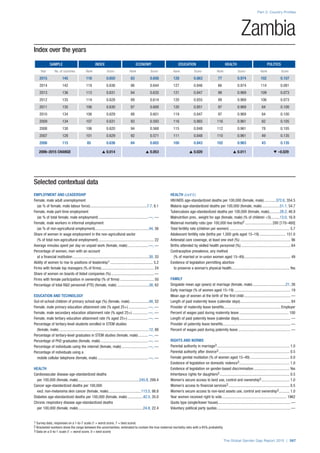

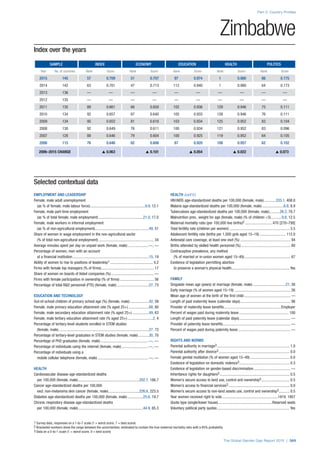

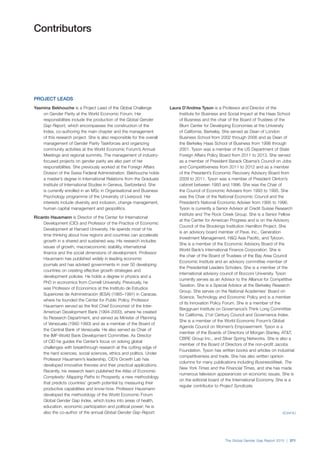
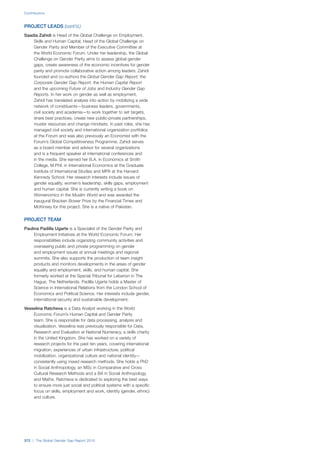
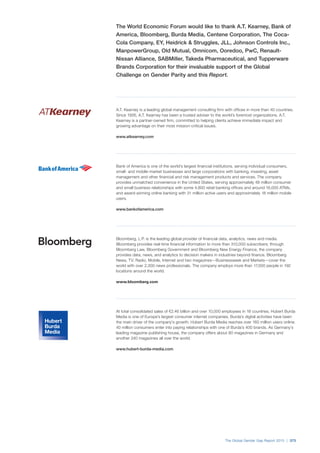
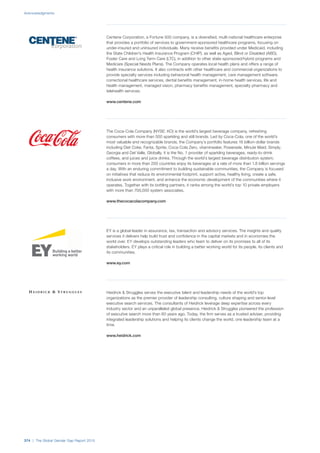
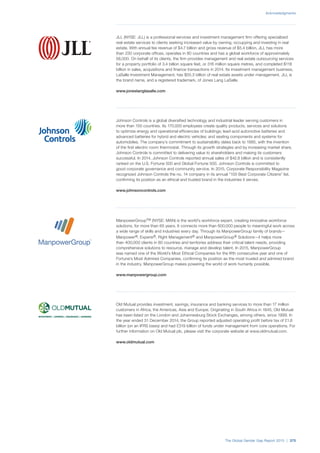
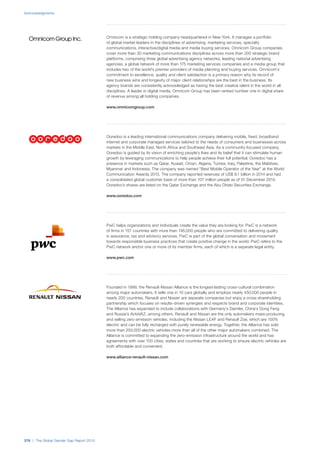
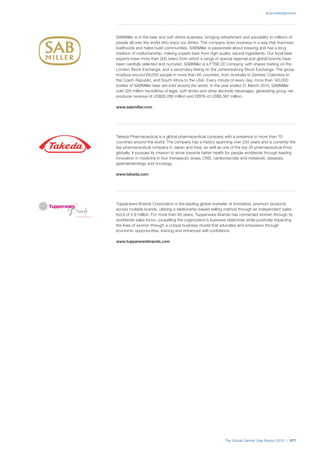

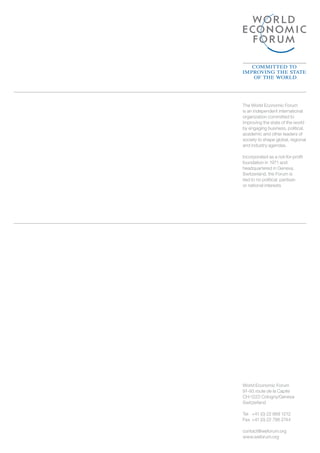

The Global Gender Gap Report 2015, published by the World Economic Forum, evaluates gender disparities worldwide across four areas: health, education, economic participation, and political empowerment. It highlights the necessity of closing gender gaps for sustainable economic growth and outlines the role of governments, businesses, and society in fostering gender parity. Utilizing a decade of data from the Global Gender Gap Index, the report provides insights into progress and challenges, emphasizing the need for collaborative efforts to promote gender equality.


![[DSC Europe 25] Srdj Stanisic - Local and Private AI in UX.pdf](https://cdn.slidesharecdn.com/ss_thumbnails/vwmetykqmztgmokmmkfa-3-srdjan-stanisic-local-and-small-ai-in-ux-260120105855-55a31869-thumbnail.jpg?width=640&height=640&fit=bounds)


![[DSC Europe 25] Tali Fulman - Guild Meetings, Then What? Building Data Commun...](https://cdn.slidesharecdn.com/ss_thumbnails/fgohhi33rwmhqdowdj5k-tali-fulman-guild-meetings-then-what-building-data-communities-that-actually-ch-260120105855-528492c3-thumbnail.jpg?width=640&height=640&fit=bounds)
![[DSC Europe 25] Josip Saban - Career building for data professionals.pptx](https://cdn.slidesharecdn.com/ss_thumbnails/zroflcttkm1vmli0txea-josip-saban-career-building-for-data-professionals-260123083019-587cdb8c-thumbnail.jpg?width=640&height=640&fit=bounds)

![[DSC Europe 25] Milos Belcevic - Product Professional's Journey to Full-Stack...](https://cdn.slidesharecdn.com/ss_thumbnails/1zovd6fgsycdg4wvgvls-milos-belcevic-product-professionals-journey-to-full-stack-product-developer-260123083019-d993120d-thumbnail.jpg?width=640&height=640&fit=bounds)
![[DSC Europe 25] Jovan Sumarac - Real-World Applications of Computer Vision in...](https://cdn.slidesharecdn.com/ss_thumbnails/fiksms22smcpopvvld03-jovan-sumarac-real-life-applications-of-computer-vision-in-automotive-systems-260120105855-de622abb-thumbnail.jpg?width=640&height=640&fit=bounds)

![[DSC Europe 25] Laila Kakar - Leveraging AI for Strategic Excellence: Enhanci...](https://cdn.slidesharecdn.com/ss_thumbnails/eykmhrtsqmaaftwkexh7-dsc-lailakakar-1-260119101520-5f3b5616-thumbnail.jpg?width=640&height=640&fit=bounds)
![[DSC Europe 25] Gordana Milutinovic Dumbelovic - From Insight to Oversight: A...](https://cdn.slidesharecdn.com/ss_thumbnails/t7dkjsfxqwwzceropjv4-gordana-milutinovicdumbelovic-from-insight-to-oversight-ai-driven-power-bi-moni-260119121559-9e0bf11b-thumbnail.jpg?width=640&height=640&fit=bounds)


