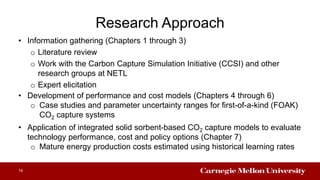
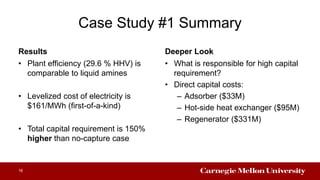
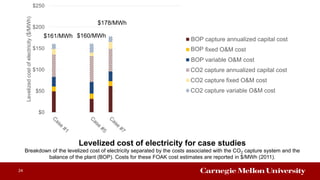
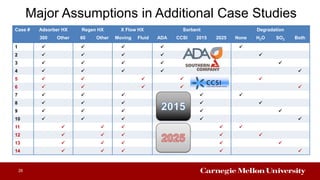
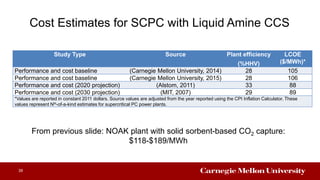
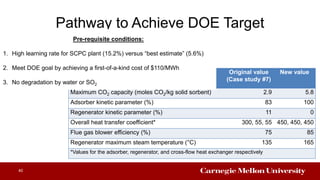
SOLID SORBENT-BASED CO2
CAPTURE FOR PULVERIZED
COAL POWER PLANTS
TECHNO-ECONOMIC MODEL CREATION AND EVALUATION
JUSTIN C. GLIER
NOVEMBER 30TH, 2015
Committee Members:
Edward Rubin (Chair), Paul Fischbeck , Holly Krutka, Hari Mantripragada, Jeff Siirola,
1
Motivation: Climate Change
“Combustion of fossil fuels produces the greenhouse gas carbon dioxide; which
is a major contributor to climate change”
-Metz 2005-
“Limiting emissions from fossil fuel power plants is considered vital to holding
the global temperature increase below 2°C”
-U.S. IEA AEO 2011-
2
Coal combustion is the major source of power plant CO2 emissions
Options for Reducing Coal Plant Emissions
1. Reduce the overall demand for electricity
2. Substitute a lower carbon fuel or generation source
3. Capture and sequester carbon dioxide emissions from coal combustion
3
World Net Coal-Fired Electricity Generation
4
0
2
4
6
8
10
12
14
16
2000 2010 2020 2030 2040
QuadrillionkWh
Year
OECD
Non-OECD
World Total
Source: EIA IEO 2013
Global demand
for electricity is
not predicted to
decrease
Electricity Generation in the U.S.
5
U.S. total
electricity
generation
(Trillion kWh)
Source: EIA, 2015. Analysis of the Impacts of the Clean Power Plan
Even with the Clean Power
Plan, Current U.S. policy
relies on utilization of coal in
the short to mid-term
PC Plant
Carbon Capture Technology Options
6
Oxyfuel Plant
IGCC Plant
Existing U.S. Facilities
• TECO’s Polk Power Station 260 MWe
(FL)
• Duke Energy’s 618 MWe Edwardsport (IN)
• Southern Company’s 582 MWe Kemper Co.(MS)
Existing U.S. Infrastructure
• Installed U.S. Capacity: 300 GWe conventional
• Retiring U.S. Capacity by 2020: 50 GWe
• Planned U.S. Additions by 2020: 2 GWe
-EIA AEO 2014
• Shanxi International, China (expected to operate by 20
• White Rose CCS, UK (Expected to operate by 2020-2
Diagrams: Rubin, 2006
Post-combustion CO2 Capture
7
SaskPower
Saskpowerccs.com
State-of-the-Art Post-Combustion Capture
Study Type Source Plant efficiency
(%HHV)
LCOE
($/MWh)*
Performance and cost baseline (Carnegie Mellon University, 2014) 28 105
Performance and cost baseline (Carnegie Mellon University, 2015) 28 106
Performance and cost (2020 projection) (Alstom, 2011) 33 88
Performance and cost (2030 projection) (MIT, 2007) 29 89
*Values are reported in constant dollars and represent Nth-of-a-kind estimates for supercritical PC power plants
8
Case Study Source Plant Efficiency
(%HHV)
LCOE
($/MWh)*
SCPC Reference System (No CCS) (DOE/NETL, 2015) 40.7 82
SCPC Reference System (No CCS) (Carnegie Mellon University, 2014) 38.9 61
Supercritical PC plants with amine-based capture systems
Policy Directive: Alternative to Liquid Solvents
“The CCS RD&D effort is aggressively pursuing development to reduce these
costs to a less than 30 percent increase in the cost of electricity for PC power
plants.”
-NETL CCS RD&D Roadmap, 2010-
9
A common method of manufacturing solid sorbents is to
attach liquid amines to a substrate (like clay, activated
carbon, or hollow fibers)
Solid Sorbent-Based CO2 Capture
10
Multiple chemical reactions
pathways are possible such
as:
Why Pursue Solid Sorbents for CO2 Capture
Perceived advantages Challenges
• Heat management in solid systems is often
problematic, particularly for indirect heat exchange
• Pressure drop can be large in flue gas
applications
• Degradation and corrosion control practices
have not been developed for solid sorbents
• Degradation of CO2 capacity of the material
may be high due to interactions with oxygen, SO2
and water
11
• Fresh solids can have a higher CO2 capacity
on a mass or volume basis than similar wet-
scrubbing chemicals
• Solids have lower specific heat compared to
wet-scrubbing in many cases (1.0 kJ/kg solid
sorbent versus 4.2 kJ/kg-°C water)
• Potential for a lower sensible heat requirement
Research Objectives
• What are the technological capabilities of the SSCCS process?
• Is it competitive with other post-combustion carbon capture options?
• Can it play a role in meeting current R&D objectives?
12
DEVELOPMENT OF A SOLID SORBENT
CO2 CAPTURE MODEL
13
Research Approach
• Information gathering (Chapters 1 through 3)
o Literature review
o Work with the Carbon Capture Simulation Initiative (CCSI) and other
research groups at NETL
o Expert elicitation
14
• Development of performance and cost models (Chapters 4 through 6)
o Case studies and parameter uncertainty ranges for first-of-a-kind (FOAK)
CO2 capture systems
• Application of integrated solid sorbent-based CO2 capture models to evaluate
technology performance, cost and policy options (Chapter 7)
o Mature energy production costs estimated using historical learning rates
Case Study #1: “Ideal System”
15
Solid sorbent and
vessel conditions
reported for the 1 MW
pilot project at Plant
Miller, Alabama Power
Co, Southern Company
IECM version 8.0.2 is
used to obtain the input
and output mass flow
rates and cost data for
the Balance of Plant
(BOP)
CO2-rich
flue gas
Mostly N2
550 MWe plant, supercritical boiler, Illinois #6 coal, meets NSPS regs + 90% CO2 capture
Case Study #1 Summary
Results
• Plant efficiency (29.6 % HHV) is
comparable to liquid amines
• Levelized cost of electricity is
$161/MWh (first-of-a-kind)
• Total capital requirement is 150%
higher than no-capture case
Deeper Look
• What is responsible for high capital
requirement?
• Direct capital costs:
– Adsorber ($33M)
– Hot-side heat exchanger ($95M)
– Regenerator ($331M)
16
How to Calculate the Cost of Heat Transfer
Vessels
17
𝐴𝐴𝐴𝐴𝐴𝐴𝐴𝐴 𝐴𝐴𝐴𝐴𝐴𝐴 𝐴𝐴𝐴𝐴 $ = ∗ 𝐴𝐴𝐴𝐴𝐴𝐴𝐴𝐴𝐴 𝐴𝐴𝐴𝐴 $/m ∗ 𝐴𝐴𝐴𝐴𝐴𝐴𝐴𝐴 𝐴𝐴 𝐴
Where:
NT,A = No. of trains, total
NO,A = No. of trains, operating
Reference cost = Normalized vessel cost ($/m2)
Adsorber, regenerator, and
heat exchanger costs are a
function of the heat
exchange (HX) surface
area
𝐴𝐴𝐴𝐴𝐴𝐴𝐴𝐴 𝐴𝐴 𝐴𝐴𝐴𝐴𝐴𝐴𝐴 𝐴𝐴𝐴𝐴 = 𝐴 ∗ 1000
3600 ∗ 𝐴𝐴𝐴𝐴 ∗ 𝐴
𝐴 = Total adsorber cooling duty (kJ/hr)
1000 = Conversion from kilojoules to joules
3600 = Conversion from seconds to hours
LMTDA = Log mean temp. difference in the adsorber (K)
UA = Overall heat exchange coefficient (W/m2-K)
HX surface area is a function
of 𝐴, LMTDA and UA
Influence of adsorber temperature on adsorber heat transfer area
Adsorber heat exchange surface area requirement normalized by the quantity of CO2 and expressed as a function of the adsorber temperature.
Higher solid outlet temperatures initially reduce the specific surface area requirement but this trend is reversed as the working capacity of the
solid falls to zero and increases the sensible heating requirement of the solid flow rate. The nominal solid outlet temperature is 40°C.
18
𝐴𝐴𝐴𝐴𝐴𝐴𝐴𝐴 𝐴𝐴 𝐴𝐴𝐴𝐴𝐴𝐴𝐴 𝐴𝐴𝐴𝐴 = 𝐴 ∗ 1000
3600 ∗ 𝐴𝐴𝐴𝐴 ∗ 𝐴
𝐴 = Total adsorber cooling duty (kJ/hr)
1000 = Conversion from kilojoules to joules
3600 = Conversions from seconds to hours
LMTDA = Logarithmic mean temperature difference in the adsorber (K)
UA = Overall heat exchange coefficient (W/m2-K)
Case Study #1
Adsorber:
40°C
Rich loading:
2.6 mol CO2/kg
Regenerator:
120°C
Lean loading:
0.8 mol CO2/kg
Influence of adsorber temperature on vessel design
Log mean temperature difference and cooling requirement as a function of the outlet solid temperature. The nominal
temperature for the in the adsorption process is 40°C and the solids are cooled from an initial temperature of 80°C.
19
Tradeoff:
40°C is good
for cooling
requirement
but bad for
LMTD
Case Study #1
Adsorber:
40°C
Rich loading:
2.6 mol CO2/kg
Regenerator:
120°C
Lean loading:
0.8 mol CO2/kg
Influence of the overall heat transfer coefficient on adsorber capital cost
Direct capital cost of the adsorber as a function of the overall heat transfer coefficient and adsorption temperature for Case Study
#1. The capital cost is a function of the heat exchange surface area. The nominal overall heat transfer coefficient for the regenerator
is 300 W/m2-K at 120°C resulting in a capital cost of $30 million (2007$) or $33 million (2011$).
20
𝐴𝐴𝐴𝐴𝐴𝐴𝐴𝐴 𝐴𝐴𝐴𝐴𝐴𝐴 𝐴𝐴𝐴𝐴 $ = 𝐴 ∗ 𝐴𝐴𝐴𝐴𝐴𝐴𝐴𝐴𝐴 𝐴𝐴𝐴𝐴 $ ∗ 𝐴𝐴𝐴𝐴𝐴𝐴𝐴𝐴
Where:
NT,A = # Trains total
NO,A = # Trains operating
Ref. cost = $M (2007)/m2
Influence of the overall heat transfer coefficient on regenerator capital cost
Direct capital cost of the regenerator as a function of the overall heat transfer coefficient and regenerator temperature for Case Study #1. The
capital cost is a function of the heat exchange surface area. The nominal overall heat transfer coefficient for the regenerator is 60 W/m2-K at
120°C resulting in a capital cost of $306 million (2007$) or $331 million (2011$).
21
𝐴𝐴𝐴𝐴𝐴𝐴𝐴𝐴𝐴𝐴𝐴 𝐴𝐴𝐴𝐴 $ = 𝐴 ∗ 𝐴𝐴𝐴𝐴𝐴𝐴𝐴𝐴𝐴 𝐴𝐴𝐴𝐴 ∗ 𝐴𝐴𝐴𝐴𝐴𝐴𝐴𝐴𝐴𝐴𝐴 𝐴𝐴 𝐴𝐴𝐴𝐴
𝐴
Where:
NT,R = # Trains total
NO,R = # Trains operating
Ref. cost = $M (2007)/m2
Cross-Flow Heat Exchanger
• Cost and performance are a
function of heat exchange surface
area:
– Thermal mass of solids
– Log mean temperature difference
between shell and tube sides
– Overall heat exchange coefficient
• HX fluid conditions are derived from
CCSI assumptions
• Same overall heat transfer
coefficient as regenerator
22
Alternative Case Studies
(assuming no sorbent degradation)
23
Solid sorbent and vessel conditions reported for the
1 MW pilot project at Plant Miller, Alabama Power
Co, Southern Company
Multi-scale simulation tool based on
Aspen Custom Modeler with a focus
on solid sorbent system design and
optimization
Based on information from experts who develop solid sorbent materials and
investigate solid sorbent-based CO2 capture processes
Case Study #1
Case Study #5
Case Study #7
24
Levelized cost of electricity for case studies
Breakdown of the levelized cost of electricity separated by the costs associated with the CO2 capture system and the
balance of the plant (BOP). Costs for these FOAK cost estimates are reported in $/MWh (2011).
$0
$50
$100
$150
$200
$250
Levelizedcostofelectricity($/MWh)
ROP capture annualized capital cost
ROP fixed O&M cost
ROP variable O&M cost
CO2 capture annualized capital cost
CO2 capture fixed O&M cost
CO2 capture variable O&M cost
BOP
BOP
BOP
$160/MWh$161/MWh
$178/MWh
Effect of Chemical Degradation
• To date, system studies of solid sorbent CCS have not
included the effects of flue gas constituents such as SO2
and H2O on overall process performance and cost
• The solid sorbent materials currently being studied can
degrade in the presence of such constituents, reducing
their effectiveness for CO2 capture
• This work examines the overall effects of such
interactions
25
26
Case # Adsorber HX Regen HX X Flow HX Sorbent Degradation
300 Other 60 Other Moving Fluid ADA CCSI 2015 2025 None H2O SO2 Both
1     
2     
3     
4     
5     
6     
7     
8     
9     
10     
11     
12     
13     
14     
Major Assumptions in Additional Case Studies
27
Levelized cost of electricity for case studies
Breakdown of the levelized cost of electricity separated by the costs associated with the CO2 capture system and the
balance of the plant (BOP). Costs for these FOAK cost estimates are reported in $/MWh (2011).
$0
$50
$100
$150
$200
$250
Levelizedcostofelectricity($/MWh)
ROP capture annualized capital cost
ROP fixed O&M cost
ROP variable O&M cost
CO2 capture annualized capital cost
CO2 capture fixed O&M cost
CO2 capture variable O&M cost
BOP
BOP
BOP
Breakdown of CCS Total Capital Requirement
28
CO2 Capture System
Direct Capital Costs ($M,
2011)
Case
#1
Case
#4
Case
#5
Case
#6
Case
#7
Case
#10
Case
#11
Case
#14
Adsorber 33 35 29 32 29 21 20 12
Cold-side heat exchanger 29 44 3 3 43 52 21 24
Conveyors 4 5 4 5 6 6 4 4
Cyclones 9 8 9 9 9 8 9 8
Drying and compression unit 16 16 18 18 16 17 16 16
Flue gas blower 18 20 22 22 18 20 18 20
Flue gas pre-treatment 9 9 10 10 9 9 9 9
Heat exchange fluid pump 0 0 0 0 0 0 0 0
Heat exchange fluid
compressor
3 4 2 2 3 4 3 3
Hot-side heat exchanger 95 143 13 14 264 320 130 144
Regenerator 331 419 217 229 298 448 196 295
Sorbent storage 2 3 2 3 3 4 2 3
Steam extractor 4 4 4 4 4 4 4 4
Process Facilities Capital 552 709 332 350 700 913 430 541
Probabilistic Analysis
• Monte Carlo Simulation using Decision Tool Suite
• Parameter uncertainty distributions (35+)
– Performance parameters (21)
– Cost parameters (14)
– ±25% equipment reference cost
29
Parameters Considered (Chapter 7)
Performance Parameters (21)
Ads. heat transfer coeff.
Ads. pressure drop
Ads. temp
CO2 capture efficiency
CO2 compressor efficiency
CO2 outlet pressure
HHX solid temp. at outlet
HX (hot&cold) overall heat trans.coeff.
Final CO2 product pressure
Flue gas blower efficiency
Heat of reaction
Maximum CO2 loading
30
Regen. kinetics
Regen. overall heat transfer coeff.
Regen. steam temp
Regen. solid temperature
SO2 capture efficiency
Solid heat capacity
Solids purge fraction
Water influence on CO2 capacity
Water regeneration efficiency
Water uptake
Cost Parameters (16*)
CO2 storage/disposal cost
CO2 transport cost
Direct capital costs
Engineering & home office fees
Fixed charge factor
General facilities capital
Inventory capital (AFUDC)
Inventory cost
Operating labor
Project contingency cost
Process contingency cost
Reference capital cost*
Royalty fees
Purge steam
Solid sorbent cost
Start-up cost
Total maintenance cost
Waste disposal cost
Performance and cost variables can be changed to represent variation in system design and cost
Probability distribution for a FOAK levelized cost of electricity of
a supercritical PC plant equipped with solid sorbent-based CCS.
31
Levelized cost of electricity probability estimates
Uncertainty
Scenario
Mean
cost
Median cost
(50th percentile)
Cost range
(5th and 95th percentile)
Most influential
parameters
Performance
variables only
$330 $209 $167 - $534 • Lost CO2 capacity (water)
• Regenerator CO2
pressure
• FG blower efficiency
Cost variables
only
$254 $254 $232 - $278 • Total maintenance cost
(%TPC)
• Reference regenerator
cost
• Reference HHX cost
Performance and
Cost variables
$355 $209 $156 - $613 • Water loss
• Regenerator CO2
pressure
• Reference regenerator
cost
PREDICTING THE FUTURE COST OF
SUPERCRITICAL PLANTS EQUIPPED WITH
SOLID SORBENT SYSTEMS
32
Background
33
• Airplane production times (Wright, 1936)
Ci= 𝑎𝑎
Where:
Ci = Cost to produce the ith unit
a = Coefficient (constant)
xi = Cumulative capacity through period i
b = Learning rate exponent
• Each doubling of cumulative production or capacity results in a cost savings
of (1-2-b). This quantity is defined as the learning rate
Capital and O&M cost trends for wet limestone FGD systems
These are cost trends for wet limestone FGD systems at a new coal-fired power plant in
the U.S. (500 MW, 90% SO2 capture), including cost studies conducted during the period
of early commercial applications.
34
Rubin, et. al, 2006
FOAK to NOAK Calculation
• Separate learning rates are applied to Total Capital
Requirement (TCR) and Total Operating and Maintenance
Costs (TOM)
• Case Study #10 (“2015” with water and SO2 degradation)
• Supercritical power plant is decomposed into (5)
technology areas with different learning rates and initial
cumulative installed capacity
35
Breakdown of Process Areas
Balance of Plant
• Boiler
• Air pollution controls
• Fuel (Variable O&M)
CO2 Capture, Transport, and Storage
• Solid sorbent-based CO2 capture
• CO2 transport and storage
36
CO2-rich
flue gas
Mostly N2
Learning Rates
37
Summary of learning rates for capital and O&M costs from historical case studies and the initial cumulative installed capacity
used to calculate future costs of supercritical PC systems equipped with solid sorbent-based CO2 capture and storage
Technology Learning rate (%)*
Installed capacity
(GW)**
Capital cost O&M cost
Balance of plant
Supercritical pulverized coal boilers 6 (3,9) 15 (7,30) 120
Air pollution control (APC) 12 (6,18) 22 (10,30) 230
Fuel n/a 4 (0,5) 120
CO2 capture and storage
CO2 capture 9 (8,29) 21 (9,29) 10
CO2 transport and storage*** 4(-25,24) 4 (-25,24) 10
*Percent reduction in cost for each doubling of total production or capacity, ** (Rubin, et al,
2007), ***(McDonald and Shrattenholzer, 2001)
Future costs of SSCCS
38
Technology LCOE ($/MWh)
Nominal ($/MWh) Range ($/MWh)
FOAK NOAK* % Change* NOAK* % Change*
SCPC plant w/ solid sorbent-based CCS 208.0 163.2 22.0 117.7-188.8 9.2-43.4
*Overall change in cost of electricity relative to FOAK cost after 100 GW of global capture plant capacity
(including transport and storage costs) for supercritical power plants equipped with post-combustion CO2
capture. All costs are in constant 2011 dollars.
Cost Estimates for SCPC with Liquid Amine CCS
39
From previous slide: NOAK plant with solid sorbent-based CO2 capture:
$118-$189/MWh
Study Type Source Plant efficiency
(%HHV)
LCOE
($/MWh)*
Performance and cost baseline (Carnegie Mellon University, 2014) 28 105
Performance and cost baseline (Carnegie Mellon University, 2015) 28 106
Performance and cost (2020 projection) (Alstom, 2011) 33 88
Performance and cost (2030 projection) (MIT, 2007) 29 89
*Values are reported in constant 2011 dollars. Source values are adjusted from the year reported using the CPI Inflation Calculator. These
values represent Nth-of-a-kind estimates for supercritical PC power plants.
Pathway to Achieve DOE Target
40
Performance parameter Original value
(Case study #7)
New value
Maximum CO2 capacity (moles CO2/kg solid sorbent) 2.9 5.8
Adsorber kinetic parameter (%) 83 100
Regenerator kinetic parameter (%) 11 0
Overall heat transfer coefficient* 300, 55, 55 450, 450, 450
Flue gas blower efficiency (%) 75 85
Regenerator maximum steam temperature (°C) 135 165
*Values for the adsorber, regenerator, and cross-flow heat exchanger respectively
Pre-requisite conditions:
1. High learning rate for SCPC plant (15.2%) versus “best estimate” (5.6%)
2. Meet DOE goal by achieving a first-of-a-kind cost of $110/MWh
3. No degradation by water or SO2
Results and Conclusions
• Without degradation, plant efficiency is similar to liquid systems
• Capital costs are much higher due regenerator and cross-flow heat
exchanger costs
• Performance characteristics control overall process economics
• Solid sorbent-based CCS is likely to have high capital costs
– Degradation
– Vessel heat exchange surface areas
– Solid sorbent oxidation
• Sharper learning rates for solid sorbent-based CCS
• Steep learning curves and significant system improvements are needed to
achieve DOE targets
41
Potential Research Paper Topics
Based on dissertation
• Computational prediction of desirable solid sorbent traits for coal-based post-
combustion CO2 capture and storage.
• Economic assessment of amine-based solid sorbents for post-combustion CO2
capture
• Estimating future costs of solid sorbent-based CO2 capture systems using historical
experience curves
• Using robust models to elucidate sulfur dioxide and water-based degradation of
solid sorbents for post-combustion CO2 capture.
Future work
• Comparison of conventional solid sorbent materials and mixed
physisorption/chemisorption composition
• A techno-economic analysis of pressure swing solid sorbent systems for post-
combustion CO2 capture from supercritical pulverized coal power plants
42
Thank you
43

Glier_Defense_Online_Publication

  • 1.
    SOLID SORBENT-BASED CO2 CAPTUREFOR PULVERIZED COAL POWER PLANTS TECHNO-ECONOMIC MODEL CREATION AND EVALUATION JUSTIN C. GLIER NOVEMBER 30TH, 2015 Committee Members: Edward Rubin (Chair), Paul Fischbeck , Holly Krutka, Hari Mantripragada, Jeff Siirola, 1
  • 2.
    Motivation: Climate Change “Combustionof fossil fuels produces the greenhouse gas carbon dioxide; which is a major contributor to climate change” -Metz 2005- “Limiting emissions from fossil fuel power plants is considered vital to holding the global temperature increase below 2°C” -U.S. IEA AEO 2011- 2 Coal combustion is the major source of power plant CO2 emissions
  • 3.
    Options for ReducingCoal Plant Emissions 1. Reduce the overall demand for electricity 2. Substitute a lower carbon fuel or generation source 3. Capture and sequester carbon dioxide emissions from coal combustion 3
  • 4.
    World Net Coal-FiredElectricity Generation 4 0 2 4 6 8 10 12 14 16 2000 2010 2020 2030 2040 QuadrillionkWh Year OECD Non-OECD World Total Source: EIA IEO 2013 Global demand for electricity is not predicted to decrease
  • 5.
    Electricity Generation inthe U.S. 5 U.S. total electricity generation (Trillion kWh) Source: EIA, 2015. Analysis of the Impacts of the Clean Power Plan Even with the Clean Power Plan, Current U.S. policy relies on utilization of coal in the short to mid-term
  • 6.
    PC Plant Carbon CaptureTechnology Options 6 Oxyfuel Plant IGCC Plant Existing U.S. Facilities • TECO’s Polk Power Station 260 MWe (FL) • Duke Energy’s 618 MWe Edwardsport (IN) • Southern Company’s 582 MWe Kemper Co.(MS) Existing U.S. Infrastructure • Installed U.S. Capacity: 300 GWe conventional • Retiring U.S. Capacity by 2020: 50 GWe • Planned U.S. Additions by 2020: 2 GWe -EIA AEO 2014 • Shanxi International, China (expected to operate by 20 • White Rose CCS, UK (Expected to operate by 2020-2 Diagrams: Rubin, 2006
  • 7.
  • 8.
    State-of-the-Art Post-Combustion Capture StudyType Source Plant efficiency (%HHV) LCOE ($/MWh)* Performance and cost baseline (Carnegie Mellon University, 2014) 28 105 Performance and cost baseline (Carnegie Mellon University, 2015) 28 106 Performance and cost (2020 projection) (Alstom, 2011) 33 88 Performance and cost (2030 projection) (MIT, 2007) 29 89 *Values are reported in constant dollars and represent Nth-of-a-kind estimates for supercritical PC power plants 8 Case Study Source Plant Efficiency (%HHV) LCOE ($/MWh)* SCPC Reference System (No CCS) (DOE/NETL, 2015) 40.7 82 SCPC Reference System (No CCS) (Carnegie Mellon University, 2014) 38.9 61 Supercritical PC plants with amine-based capture systems
  • 9.
    Policy Directive: Alternativeto Liquid Solvents “The CCS RD&D effort is aggressively pursuing development to reduce these costs to a less than 30 percent increase in the cost of electricity for PC power plants.” -NETL CCS RD&D Roadmap, 2010- 9
  • 10.
    A common methodof manufacturing solid sorbents is to attach liquid amines to a substrate (like clay, activated carbon, or hollow fibers) Solid Sorbent-Based CO2 Capture 10 Multiple chemical reactions pathways are possible such as:
  • 11.
    Why Pursue SolidSorbents for CO2 Capture Perceived advantages Challenges • Heat management in solid systems is often problematic, particularly for indirect heat exchange • Pressure drop can be large in flue gas applications • Degradation and corrosion control practices have not been developed for solid sorbents • Degradation of CO2 capacity of the material may be high due to interactions with oxygen, SO2 and water 11 • Fresh solids can have a higher CO2 capacity on a mass or volume basis than similar wet- scrubbing chemicals • Solids have lower specific heat compared to wet-scrubbing in many cases (1.0 kJ/kg solid sorbent versus 4.2 kJ/kg-°C water) • Potential for a lower sensible heat requirement
  • 12.
    Research Objectives • Whatare the technological capabilities of the SSCCS process? • Is it competitive with other post-combustion carbon capture options? • Can it play a role in meeting current R&D objectives? 12
  • 13.
    DEVELOPMENT OF ASOLID SORBENT CO2 CAPTURE MODEL 13
  • 14.
    Research Approach • Informationgathering (Chapters 1 through 3) o Literature review o Work with the Carbon Capture Simulation Initiative (CCSI) and other research groups at NETL o Expert elicitation 14 • Development of performance and cost models (Chapters 4 through 6) o Case studies and parameter uncertainty ranges for first-of-a-kind (FOAK) CO2 capture systems • Application of integrated solid sorbent-based CO2 capture models to evaluate technology performance, cost and policy options (Chapter 7) o Mature energy production costs estimated using historical learning rates
  • 15.
    Case Study #1:“Ideal System” 15 Solid sorbent and vessel conditions reported for the 1 MW pilot project at Plant Miller, Alabama Power Co, Southern Company IECM version 8.0.2 is used to obtain the input and output mass flow rates and cost data for the Balance of Plant (BOP) CO2-rich flue gas Mostly N2 550 MWe plant, supercritical boiler, Illinois #6 coal, meets NSPS regs + 90% CO2 capture
  • 16.
    Case Study #1Summary Results • Plant efficiency (29.6 % HHV) is comparable to liquid amines • Levelized cost of electricity is $161/MWh (first-of-a-kind) • Total capital requirement is 150% higher than no-capture case Deeper Look • What is responsible for high capital requirement? • Direct capital costs: – Adsorber ($33M) – Hot-side heat exchanger ($95M) – Regenerator ($331M) 16
  • 17.
    How to Calculatethe Cost of Heat Transfer Vessels 17 𝐴𝐴𝐴𝐴𝐴𝐴𝐴𝐴 𝐴𝐴𝐴𝐴𝐴𝐴 𝐴𝐴𝐴𝐴 $ = ∗ 𝐴𝐴𝐴𝐴𝐴𝐴𝐴𝐴𝐴 𝐴𝐴𝐴𝐴 $/m ∗ 𝐴𝐴𝐴𝐴𝐴𝐴𝐴𝐴 𝐴𝐴 𝐴 Where: NT,A = No. of trains, total NO,A = No. of trains, operating Reference cost = Normalized vessel cost ($/m2) Adsorber, regenerator, and heat exchanger costs are a function of the heat exchange (HX) surface area 𝐴𝐴𝐴𝐴𝐴𝐴𝐴𝐴 𝐴𝐴 𝐴𝐴𝐴𝐴𝐴𝐴𝐴 𝐴𝐴𝐴𝐴 = 𝐴 ∗ 1000 3600 ∗ 𝐴𝐴𝐴𝐴 ∗ 𝐴 𝐴 = Total adsorber cooling duty (kJ/hr) 1000 = Conversion from kilojoules to joules 3600 = Conversion from seconds to hours LMTDA = Log mean temp. difference in the adsorber (K) UA = Overall heat exchange coefficient (W/m2-K) HX surface area is a function of 𝐴, LMTDA and UA
  • 18.
    Influence of adsorbertemperature on adsorber heat transfer area Adsorber heat exchange surface area requirement normalized by the quantity of CO2 and expressed as a function of the adsorber temperature. Higher solid outlet temperatures initially reduce the specific surface area requirement but this trend is reversed as the working capacity of the solid falls to zero and increases the sensible heating requirement of the solid flow rate. The nominal solid outlet temperature is 40°C. 18 𝐴𝐴𝐴𝐴𝐴𝐴𝐴𝐴 𝐴𝐴 𝐴𝐴𝐴𝐴𝐴𝐴𝐴 𝐴𝐴𝐴𝐴 = 𝐴 ∗ 1000 3600 ∗ 𝐴𝐴𝐴𝐴 ∗ 𝐴 𝐴 = Total adsorber cooling duty (kJ/hr) 1000 = Conversion from kilojoules to joules 3600 = Conversions from seconds to hours LMTDA = Logarithmic mean temperature difference in the adsorber (K) UA = Overall heat exchange coefficient (W/m2-K) Case Study #1 Adsorber: 40°C Rich loading: 2.6 mol CO2/kg Regenerator: 120°C Lean loading: 0.8 mol CO2/kg
  • 19.
    Influence of adsorbertemperature on vessel design Log mean temperature difference and cooling requirement as a function of the outlet solid temperature. The nominal temperature for the in the adsorption process is 40°C and the solids are cooled from an initial temperature of 80°C. 19 Tradeoff: 40°C is good for cooling requirement but bad for LMTD Case Study #1 Adsorber: 40°C Rich loading: 2.6 mol CO2/kg Regenerator: 120°C Lean loading: 0.8 mol CO2/kg
  • 20.
    Influence of theoverall heat transfer coefficient on adsorber capital cost Direct capital cost of the adsorber as a function of the overall heat transfer coefficient and adsorption temperature for Case Study #1. The capital cost is a function of the heat exchange surface area. The nominal overall heat transfer coefficient for the regenerator is 300 W/m2-K at 120°C resulting in a capital cost of $30 million (2007$) or $33 million (2011$). 20 𝐴𝐴𝐴𝐴𝐴𝐴𝐴𝐴 𝐴𝐴𝐴𝐴𝐴𝐴 𝐴𝐴𝐴𝐴 $ = 𝐴 ∗ 𝐴𝐴𝐴𝐴𝐴𝐴𝐴𝐴𝐴 𝐴𝐴𝐴𝐴 $ ∗ 𝐴𝐴𝐴𝐴𝐴𝐴𝐴𝐴 Where: NT,A = # Trains total NO,A = # Trains operating Ref. cost = $M (2007)/m2
  • 21.
    Influence of theoverall heat transfer coefficient on regenerator capital cost Direct capital cost of the regenerator as a function of the overall heat transfer coefficient and regenerator temperature for Case Study #1. The capital cost is a function of the heat exchange surface area. The nominal overall heat transfer coefficient for the regenerator is 60 W/m2-K at 120°C resulting in a capital cost of $306 million (2007$) or $331 million (2011$). 21 𝐴𝐴𝐴𝐴𝐴𝐴𝐴𝐴𝐴𝐴𝐴 𝐴𝐴𝐴𝐴 $ = 𝐴 ∗ 𝐴𝐴𝐴𝐴𝐴𝐴𝐴𝐴𝐴 𝐴𝐴𝐴𝐴 ∗ 𝐴𝐴𝐴𝐴𝐴𝐴𝐴𝐴𝐴𝐴𝐴 𝐴𝐴 𝐴𝐴𝐴𝐴 𝐴 Where: NT,R = # Trains total NO,R = # Trains operating Ref. cost = $M (2007)/m2
  • 22.
    Cross-Flow Heat Exchanger •Cost and performance are a function of heat exchange surface area: – Thermal mass of solids – Log mean temperature difference between shell and tube sides – Overall heat exchange coefficient • HX fluid conditions are derived from CCSI assumptions • Same overall heat transfer coefficient as regenerator 22
  • 23.
    Alternative Case Studies (assumingno sorbent degradation) 23 Solid sorbent and vessel conditions reported for the 1 MW pilot project at Plant Miller, Alabama Power Co, Southern Company Multi-scale simulation tool based on Aspen Custom Modeler with a focus on solid sorbent system design and optimization Based on information from experts who develop solid sorbent materials and investigate solid sorbent-based CO2 capture processes Case Study #1 Case Study #5 Case Study #7
  • 24.
    24 Levelized cost ofelectricity for case studies Breakdown of the levelized cost of electricity separated by the costs associated with the CO2 capture system and the balance of the plant (BOP). Costs for these FOAK cost estimates are reported in $/MWh (2011). $0 $50 $100 $150 $200 $250 Levelizedcostofelectricity($/MWh) ROP capture annualized capital cost ROP fixed O&M cost ROP variable O&M cost CO2 capture annualized capital cost CO2 capture fixed O&M cost CO2 capture variable O&M cost BOP BOP BOP $160/MWh$161/MWh $178/MWh
  • 25.
    Effect of ChemicalDegradation • To date, system studies of solid sorbent CCS have not included the effects of flue gas constituents such as SO2 and H2O on overall process performance and cost • The solid sorbent materials currently being studied can degrade in the presence of such constituents, reducing their effectiveness for CO2 capture • This work examines the overall effects of such interactions 25
  • 26.
    26 Case # AdsorberHX Regen HX X Flow HX Sorbent Degradation 300 Other 60 Other Moving Fluid ADA CCSI 2015 2025 None H2O SO2 Both 1      2      3      4      5      6      7      8      9      10      11      12      13      14      Major Assumptions in Additional Case Studies
  • 27.
    27 Levelized cost ofelectricity for case studies Breakdown of the levelized cost of electricity separated by the costs associated with the CO2 capture system and the balance of the plant (BOP). Costs for these FOAK cost estimates are reported in $/MWh (2011). $0 $50 $100 $150 $200 $250 Levelizedcostofelectricity($/MWh) ROP capture annualized capital cost ROP fixed O&M cost ROP variable O&M cost CO2 capture annualized capital cost CO2 capture fixed O&M cost CO2 capture variable O&M cost BOP BOP BOP
  • 28.
    Breakdown of CCSTotal Capital Requirement 28 CO2 Capture System Direct Capital Costs ($M, 2011) Case #1 Case #4 Case #5 Case #6 Case #7 Case #10 Case #11 Case #14 Adsorber 33 35 29 32 29 21 20 12 Cold-side heat exchanger 29 44 3 3 43 52 21 24 Conveyors 4 5 4 5 6 6 4 4 Cyclones 9 8 9 9 9 8 9 8 Drying and compression unit 16 16 18 18 16 17 16 16 Flue gas blower 18 20 22 22 18 20 18 20 Flue gas pre-treatment 9 9 10 10 9 9 9 9 Heat exchange fluid pump 0 0 0 0 0 0 0 0 Heat exchange fluid compressor 3 4 2 2 3 4 3 3 Hot-side heat exchanger 95 143 13 14 264 320 130 144 Regenerator 331 419 217 229 298 448 196 295 Sorbent storage 2 3 2 3 3 4 2 3 Steam extractor 4 4 4 4 4 4 4 4 Process Facilities Capital 552 709 332 350 700 913 430 541
  • 29.
    Probabilistic Analysis • MonteCarlo Simulation using Decision Tool Suite • Parameter uncertainty distributions (35+) – Performance parameters (21) – Cost parameters (14) – ±25% equipment reference cost 29
  • 30.
    Parameters Considered (Chapter7) Performance Parameters (21) Ads. heat transfer coeff. Ads. pressure drop Ads. temp CO2 capture efficiency CO2 compressor efficiency CO2 outlet pressure HHX solid temp. at outlet HX (hot&cold) overall heat trans.coeff. Final CO2 product pressure Flue gas blower efficiency Heat of reaction Maximum CO2 loading 30 Regen. kinetics Regen. overall heat transfer coeff. Regen. steam temp Regen. solid temperature SO2 capture efficiency Solid heat capacity Solids purge fraction Water influence on CO2 capacity Water regeneration efficiency Water uptake Cost Parameters (16*) CO2 storage/disposal cost CO2 transport cost Direct capital costs Engineering & home office fees Fixed charge factor General facilities capital Inventory capital (AFUDC) Inventory cost Operating labor Project contingency cost Process contingency cost Reference capital cost* Royalty fees Purge steam Solid sorbent cost Start-up cost Total maintenance cost Waste disposal cost Performance and cost variables can be changed to represent variation in system design and cost
  • 31.
    Probability distribution fora FOAK levelized cost of electricity of a supercritical PC plant equipped with solid sorbent-based CCS. 31 Levelized cost of electricity probability estimates Uncertainty Scenario Mean cost Median cost (50th percentile) Cost range (5th and 95th percentile) Most influential parameters Performance variables only $330 $209 $167 - $534 • Lost CO2 capacity (water) • Regenerator CO2 pressure • FG blower efficiency Cost variables only $254 $254 $232 - $278 • Total maintenance cost (%TPC) • Reference regenerator cost • Reference HHX cost Performance and Cost variables $355 $209 $156 - $613 • Water loss • Regenerator CO2 pressure • Reference regenerator cost
  • 32.
    PREDICTING THE FUTURECOST OF SUPERCRITICAL PLANTS EQUIPPED WITH SOLID SORBENT SYSTEMS 32
  • 33.
    Background 33 • Airplane productiontimes (Wright, 1936) Ci= 𝑎𝑎 Where: Ci = Cost to produce the ith unit a = Coefficient (constant) xi = Cumulative capacity through period i b = Learning rate exponent • Each doubling of cumulative production or capacity results in a cost savings of (1-2-b). This quantity is defined as the learning rate
  • 34.
    Capital and O&Mcost trends for wet limestone FGD systems These are cost trends for wet limestone FGD systems at a new coal-fired power plant in the U.S. (500 MW, 90% SO2 capture), including cost studies conducted during the period of early commercial applications. 34 Rubin, et. al, 2006
  • 35.
    FOAK to NOAKCalculation • Separate learning rates are applied to Total Capital Requirement (TCR) and Total Operating and Maintenance Costs (TOM) • Case Study #10 (“2015” with water and SO2 degradation) • Supercritical power plant is decomposed into (5) technology areas with different learning rates and initial cumulative installed capacity 35
  • 36.
    Breakdown of ProcessAreas Balance of Plant • Boiler • Air pollution controls • Fuel (Variable O&M) CO2 Capture, Transport, and Storage • Solid sorbent-based CO2 capture • CO2 transport and storage 36 CO2-rich flue gas Mostly N2
  • 37.
    Learning Rates 37 Summary oflearning rates for capital and O&M costs from historical case studies and the initial cumulative installed capacity used to calculate future costs of supercritical PC systems equipped with solid sorbent-based CO2 capture and storage Technology Learning rate (%)* Installed capacity (GW)** Capital cost O&M cost Balance of plant Supercritical pulverized coal boilers 6 (3,9) 15 (7,30) 120 Air pollution control (APC) 12 (6,18) 22 (10,30) 230 Fuel n/a 4 (0,5) 120 CO2 capture and storage CO2 capture 9 (8,29) 21 (9,29) 10 CO2 transport and storage*** 4(-25,24) 4 (-25,24) 10 *Percent reduction in cost for each doubling of total production or capacity, ** (Rubin, et al, 2007), ***(McDonald and Shrattenholzer, 2001)
  • 38.
    Future costs ofSSCCS 38 Technology LCOE ($/MWh) Nominal ($/MWh) Range ($/MWh) FOAK NOAK* % Change* NOAK* % Change* SCPC plant w/ solid sorbent-based CCS 208.0 163.2 22.0 117.7-188.8 9.2-43.4 *Overall change in cost of electricity relative to FOAK cost after 100 GW of global capture plant capacity (including transport and storage costs) for supercritical power plants equipped with post-combustion CO2 capture. All costs are in constant 2011 dollars.
  • 39.
    Cost Estimates forSCPC with Liquid Amine CCS 39 From previous slide: NOAK plant with solid sorbent-based CO2 capture: $118-$189/MWh Study Type Source Plant efficiency (%HHV) LCOE ($/MWh)* Performance and cost baseline (Carnegie Mellon University, 2014) 28 105 Performance and cost baseline (Carnegie Mellon University, 2015) 28 106 Performance and cost (2020 projection) (Alstom, 2011) 33 88 Performance and cost (2030 projection) (MIT, 2007) 29 89 *Values are reported in constant 2011 dollars. Source values are adjusted from the year reported using the CPI Inflation Calculator. These values represent Nth-of-a-kind estimates for supercritical PC power plants.
  • 40.
    Pathway to AchieveDOE Target 40 Performance parameter Original value (Case study #7) New value Maximum CO2 capacity (moles CO2/kg solid sorbent) 2.9 5.8 Adsorber kinetic parameter (%) 83 100 Regenerator kinetic parameter (%) 11 0 Overall heat transfer coefficient* 300, 55, 55 450, 450, 450 Flue gas blower efficiency (%) 75 85 Regenerator maximum steam temperature (°C) 135 165 *Values for the adsorber, regenerator, and cross-flow heat exchanger respectively Pre-requisite conditions: 1. High learning rate for SCPC plant (15.2%) versus “best estimate” (5.6%) 2. Meet DOE goal by achieving a first-of-a-kind cost of $110/MWh 3. No degradation by water or SO2
  • 41.
    Results and Conclusions •Without degradation, plant efficiency is similar to liquid systems • Capital costs are much higher due regenerator and cross-flow heat exchanger costs • Performance characteristics control overall process economics • Solid sorbent-based CCS is likely to have high capital costs – Degradation – Vessel heat exchange surface areas – Solid sorbent oxidation • Sharper learning rates for solid sorbent-based CCS • Steep learning curves and significant system improvements are needed to achieve DOE targets 41
  • 42.
    Potential Research PaperTopics Based on dissertation • Computational prediction of desirable solid sorbent traits for coal-based post- combustion CO2 capture and storage. • Economic assessment of amine-based solid sorbents for post-combustion CO2 capture • Estimating future costs of solid sorbent-based CO2 capture systems using historical experience curves • Using robust models to elucidate sulfur dioxide and water-based degradation of solid sorbents for post-combustion CO2 capture. Future work • Comparison of conventional solid sorbent materials and mixed physisorption/chemisorption composition • A techno-economic analysis of pressure swing solid sorbent systems for post- combustion CO2 capture from supercritical pulverized coal power plants 42
  • 43.