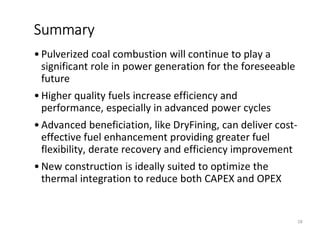
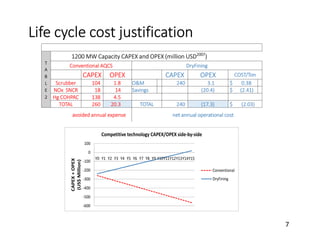
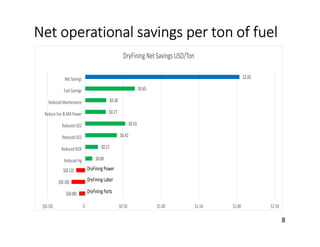
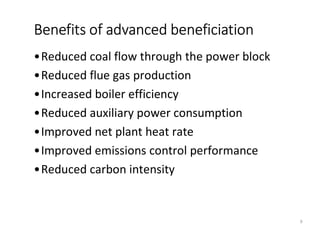
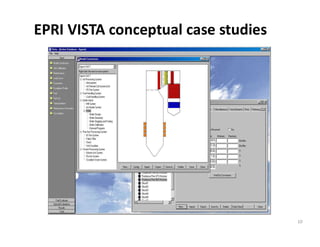
The document summarizes 6 years of operating experience with DryFining, a coal drying process. It has upgraded 1000 tons per hour of lignite coal since 2009, reducing moisture from 38% to 30% by weight. This has increased the coal's heating value and reduced emissions while improving the net plant heat rate by 4.5%. Case studies show the process can increase generation capacity at coal plants and reduce capital and operating costs. The process provides more flexible, efficient fuel enhancement that benefits both new and existing coal-fired power facilities.
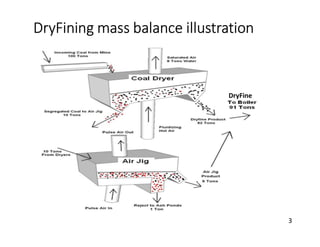
![Case study 2: Net unit efficiency
33.8
35.6
38.8
41.9
36.6
38.6
41.9
45.3
36.4
38.4
41.8
45.1
32
33
34
35
36
37
38
39
40
41
42
43
44
45
46
47
48
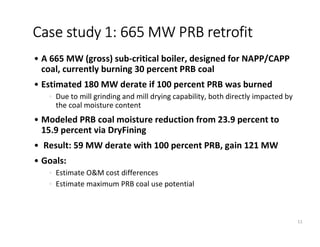
Subcritical Supercritical USC A-USC
NetUnitEfficiency[%-HHV]
Indonesian Coal: Wara
Indonesian, TM=41%
Indonesian, TM=35%
Indonesian, TM=30%
Indonesian, TM=25%
Indonesian, TM=20%
Indonesian, TM=15%
Indonesian, TM=10%
Bituminous (Hard), TM=11%
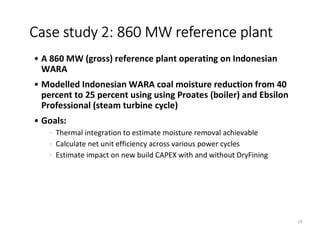
Reference Plant
22](https://image.slidesharecdn.com/ce1b177d-338e-418a-91d5-800b6a25eb5d-161221195551/85/2016-12-14-DryFining-Coal-Gen-presentation-FINAL-22-320.jpg)
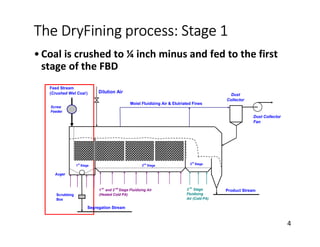
![Case study 2: Net unit efficiency
0
1
2
3
4
5
6
7
8
9
10
11
12
13
14
15
5 10 15 20 25 30 35 40
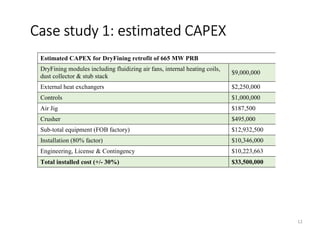
NetUnitEfficiencyImprovement[%-point,HHV]
Total Coal Moisture Content, TM [%]
Indonesian Coal: Wara Subcritical
SC
USC
A-USC
SUBC with ICDS
SC with ICDS
USC with ICDS
A-USC
ICDS = LT Integrated Coal Drying System
Waste HeatWaste + Process Heat
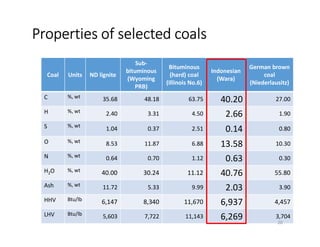
Reference Plant
23](https://image.slidesharecdn.com/ce1b177d-338e-418a-91d5-800b6a25eb5d-161221195551/85/2016-12-14-DryFining-Coal-Gen-presentation-FINAL-23-320.jpg)
![300
350
400
450
500
550
600
650
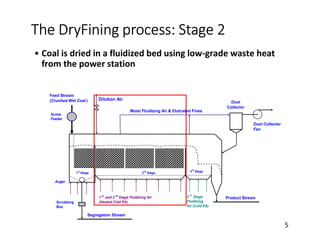
5 10 15 20 25 30 35 40
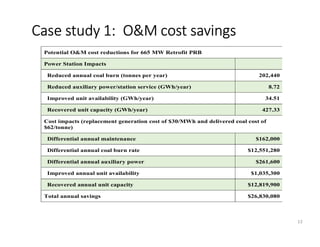
CoalFlowRate[g/kWh-gross]
Total Coal Moisture Content, TM [%]
Supercritical unit using dried Indonesian Wara
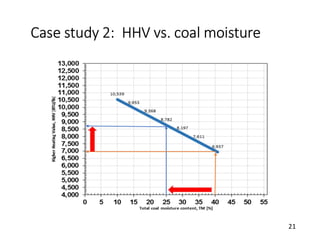
Case study 2: Coal flow rate change
ICDS = LT Integrated Coal Drying System
Efficiency improvement
Evaporated Coal
Moisture
24
1
3
2
4](https://image.slidesharecdn.com/ce1b177d-338e-418a-91d5-800b6a25eb5d-161221195551/85/2016-12-14-DryFining-Coal-Gen-presentation-FINAL-24-320.jpg)
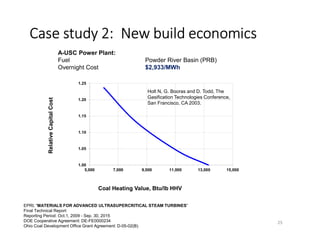
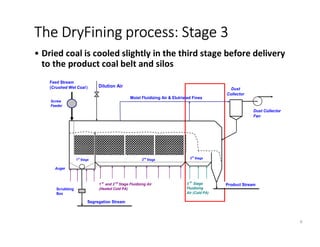
![Case study 2: Capital costs and savings
0
50
100
150
200
250
300
350
400
5 10 15 20 25 30
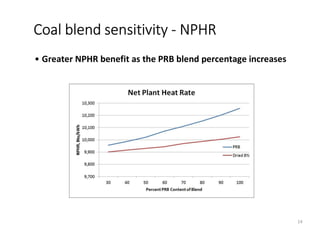
CapitalCostsandSavings[$/kW]
Reduction in Total Coal Moisture Content, DTM [%-point]
Indonesian: WaraCore System Cost, A-USC
Core System Cost, USC
Reduction in Plant Cost, A-USC
Reduction in Plant Cost, USC
CAPEX Savings, A-USC
CAPEX Savings, USC
NET CAPEX
Savings
A-USC
USC
Core System Cost
Reduction in
Plant Cost
USC
A-USC
A-USC
USC
Reference Plant
26](https://image.slidesharecdn.com/ce1b177d-338e-418a-91d5-800b6a25eb5d-161221195551/85/2016-12-14-DryFining-Coal-Gen-presentation-FINAL-26-320.jpg)
![Water recovery potential at 60 percent
50
100
150
200
250
300
350
400
5 10 15 20 25 30 35
EvaporatedCoalMoisture[klb/hr]
Total Coal Moisture Content, TM [%]
Indonesian: Wara
Subcritical
SC
USC
A-USC
Condensed, Subcritical
Condensed, SC
Condensed, USC
Condensed, A-USC
27
860 MW Reference Plant
60% Recovery](https://image.slidesharecdn.com/ce1b177d-338e-418a-91d5-800b6a25eb5d-161221195551/85/2016-12-14-DryFining-Coal-Gen-presentation-FINAL-27-320.jpg)