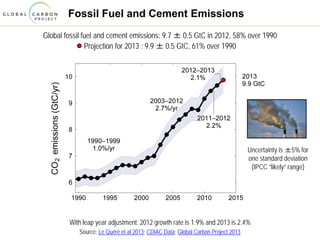
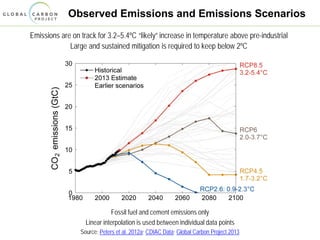
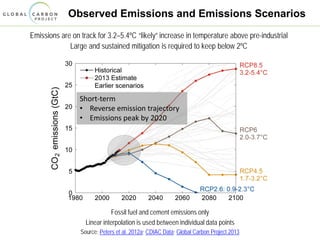
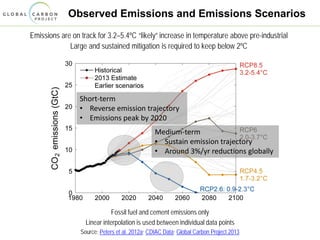
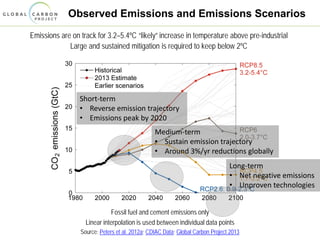
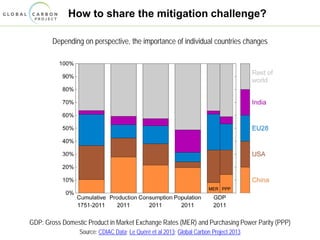
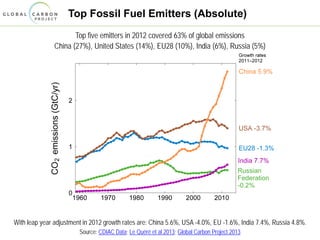
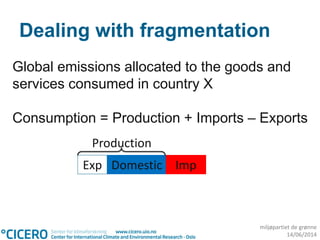
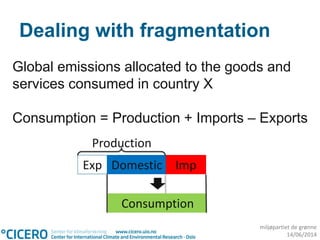
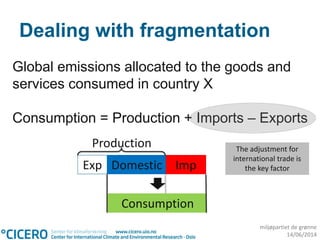
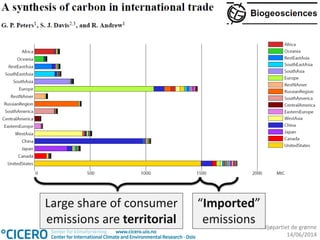
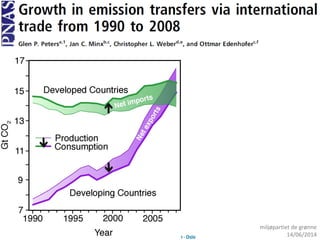
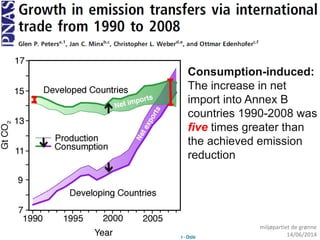
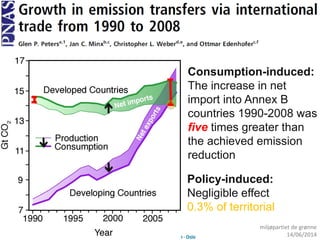
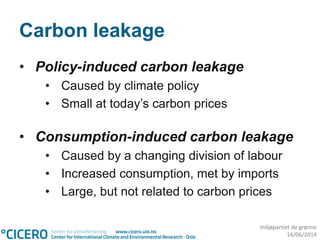
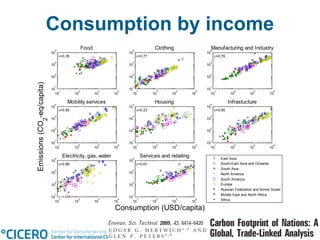
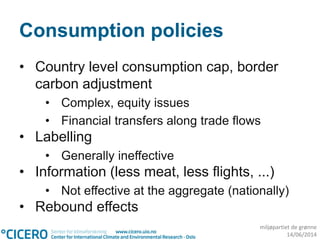
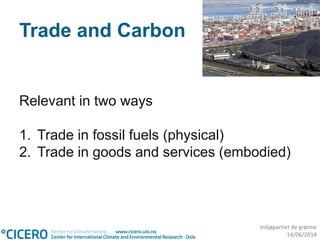
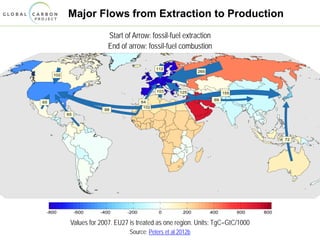
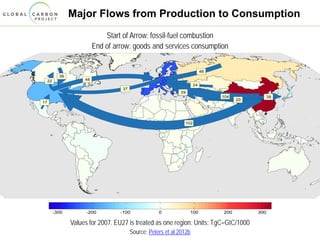
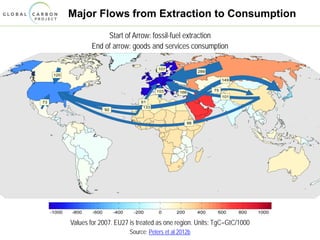
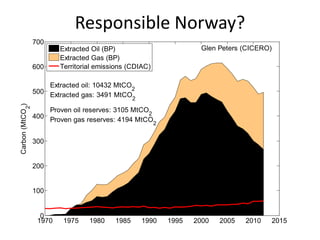
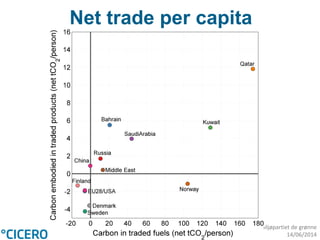
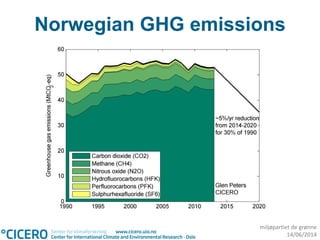
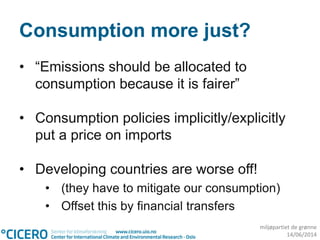
Governing the willingness to extract,
combust and consume less carbon
Miljøpartiet de Grønne
June 14, 2014 (11-12)
Glen Peters
Center for International Climate and Environmental Research – Oslo (CICERO)
Email: glen.peters@cicero.uio.no Twitter: @Peters_Glen
Fossil Fuel and Cement Emissions
Global fossil fuel and cement emissions: 9.7 ± 0.5 GtC in 2012, 58% over 1990
Projection for 2013 : 9.9 ± 0.5 GtC, 61% over 1990
With leap year adjustment: 2012 growth rate is 1.9% and 2013 is 2.4%
Source: Le Quéré et al 2013; CDIAC Data; Global Carbon Project 2013
Uncertainty is ±5% for
one standard deviation
(IPCC “likely” range)
Observed Emissions and Emissions Scenarios
Emissions are on track for 3.2–5.4ºC “likely” increase in temperature above pre-industrial
Large and sustained mitigation is required to keep below 2ºC
Fossil fuel and cement emissions only
Linear interpolation is used between individual data points
Source: Peters et al. 2012a; CDIAC Data; Global Carbon Project 2013
Short-term
• Reverse emission trajectory
• Emissions peak by 2020
Observed Emissions and Emissions Scenarios
Emissions are on track for 3.2–5.4ºC “likely” increase in temperature above pre-industrial
Large and sustained mitigation is required to keep below 2ºC
Fossil fuel and cement emissions only
Linear interpolation is used between individual data points
Source: Peters et al. 2012a; CDIAC Data; Global Carbon Project 2013
Medium-term
• Sustain emission trajectory
• Around 3%/yr reductions globally
Short-term
• Reverse emission trajectory
• Emissions peak by 2020
Observed Emissions and Emissions Scenarios
Emissions are on track for 3.2–5.4ºC “likely” increase in temperature above pre-industrial
Large and sustained mitigation is required to keep below 2ºC
Fossil fuel and cement emissions only
Linear interpolation is used between individual data points
Source: Peters et al. 2012a; CDIAC Data; Global Carbon Project 2013
Short-term
• Reverse emission trajectory
• Emissions peak by 2020
Medium-term
• Sustain emission trajectory
• Around 3%/yr reductions globally
Long-term
• Net negative emissions
• Unproven technologies
How to share the mitigation challenge?
Depending on perspective, the importance of individual countries changes
GDP: Gross Domestic Product in Market Exchange Rates (MER) and Purchasing Power Parity (PPP)
Source: CDIAC Data; Le Quéré et al 2013; Global Carbon Project 2013
Top Fossil Fuel Emitters (Absolute)
Top five emitters in 2012 covered 63% of global emissions
China (27%), United States (14%), EU28 (10%), India (6%), Russia (5%)
With leap year adjustment in 2012 growth rates are: China 5.6%, USA -4.0%, EU -1.6%, India 7.4%, Russia 4.8%.
Source: CDIAC Data; Le Quéré et al 2013; Global Carbon Project 2013
Top Fossil Fuel Emitters (Per Capita)
Average per capita emissions in 2012
China is growing rapidly and the US is declining fast
Source: CDIAC Data; Le Quéré et al 2013; Global Carbon Project 2013
Historical Cumulative Emissions by Country
Cumulative emissions from fossil-fuel and cement were distributed (1870–2012):
USA (26%), EU28 (23%), China (11%), Russia (8%), and India (4%) covering 71% of the total share
Cumulative emissions (1990–2012) were distributed USA (20%), EU28 (15%), China (18%), Russia (6%), India (5%)
Source: CDIAC Data; Le Quéré et al 2013; Global Carbon Project 2013
miljøpartiet de grønne
14/06/2014
The mitigation challange
• “Common but differentiated” leads to
fragmented policies
• Strong, weak, none
• Global commons
• “Free rider” problems
• Relevant in a global economy
• Carbon leakage
• Competiveness concerns
miljøpartiet de grønne
14/06/2014
CARBON FOOTPRINTS
miljøpartiet de grønne
14/06/2014
Dealing with fragmentation
Global emissions allocated to the goods and
services consumed in country X
miljøpartiet de grønne
14/06/2014
Dealing with fragmentation
Global emissions allocated to the goods and
services consumed in country X
Consumption = Production + Imports – Exports
miljøpartiet de grønne
14/06/2014
Dealing with fragmentation
Global emissions allocated to the goods and
services consumed in country X
Consumption = Production + Imports – Exports
Production
miljøpartiet de grønne
14/06/2014
Dealing with fragmentation
Global emissions allocated to the goods and
services consumed in country X
Consumption = Production + Imports – Exports
Production
Exp Domestic
miljøpartiet de grønne
14/06/2014
Dealing with fragmentation
Global emissions allocated to the goods and
services consumed in country X
Consumption = Production + Imports – Exports
Production
Exp ImpDomestic
miljøpartiet de grønne
14/06/2014
Dealing with fragmentation
Global emissions allocated to the goods and
services consumed in country X
Consumption = Production + Imports – Exports
Production
Exp Imp
Consumption
Domestic
miljøpartiet de grønne
14/06/2014
Dealing with fragmentation
Global emissions allocated to the goods and
services consumed in country X
Consumption = Production + Imports – Exports
Production
Exp Imp
Consumption
Domestic
The adjustment for
international trade is
the key factor
miljøpartiet de grønne
14/06/2014
Large share of consumer
emissions are territorial
“Imported”
emissions
miljøpartiet de grønne
14/06/2014
miljøpartiet de grønne
14/06/2014
Consumption-induced:
The increase in net
import into Annex B
countries 1990-2008 was
five times greater than
the achieved emission
reduction
miljøpartiet de grønne
14/06/2014
Policy-induced:
Negligible effect
0.3% of territorial
Consumption-induced:
The increase in net
import into Annex B
countries 1990-2008 was
five times greater than
the achieved emission
reduction
miljøpartiet de grønne
14/06/2014
Carbon leakage
• Policy-induced carbon leakage
• Caused by climate policy
• Small at today’s carbon prices
• Consumption-induced carbon leakage
• Caused by a changing division of labour
• Increased consumption, met by imports
• Large, but not related to carbon prices
miljøpartiet de grønne
14/06/2014
Carbon footprints and scale
• Scale is important for footprints
• Big country, small share imported
• Small country, large share imported
• City, most imported
• Household, all imported
miljøpartiet de grønne
14/06/2014
miljøpartiet de grønne
14/06/2014
City and the Hinterland
GHG t/household Sydney Melbourne Brisbane Adelaide Perth
Greater
Hobart
Canberra Darwin
GHG Footprint 52.9 66.8 63.3 51.4 69.3 44.3 58.3 50.1
GHG Footprint - Domestic 12.3 16.2 15.6 16.2 11.4 5.3 4.7 10.2
GHG Footprint - Import 40.5 50.5 47.7 35.2 57.9 39.0 53.6 39.8
Share imported (%) 77 76 75 69 84 88 92 80
70-90% of carbon
footprint imported!
miljøpartiet de grønne
14/06/2014
City and the Hinterland
GHG t/household Sydney Melbourne Brisbane Adelaide Perth
Greater
Hobart
Canberra Darwin
GHG Footprint 52.9 66.8 63.3 51.4 69.3 44.3 58.3 50.1
GHG Footprint - Domestic 12.3 16.2 15.6 16.2 11.4 5.3 4.7 10.2
GHG Footprint - Import 40.5 50.5 47.7 35.2 57.9 39.0 53.6 39.8
Share imported (%) 77 76 75 69 84 88 92 80
y = 0.8955x1.0911
R² = 0.9869
1.0
10.0
100.0
1 10 100
GHG Footprint vs Income
70-90% of carbon
footprint imported!
Income dominates footprints,
other factors (urban form,
house size, etc) are marginal
miljøpartiet de grønne
14/06/2014
10
1
10
2
10
3
10
4
10
1
10
2
10
3
10
4
ε=0.35
Food
10
1
10
2
10
3
10
4
10
1
10
2
10
3
10
4
ε=0.77
Clothing
10
1
10
2
10
3
10
4
10
1
10
2
10
3
10
4
ε=0.79
Manufacturing and Industry
10
1
10
2
10
3
10
4
10
1
10
2
10
3
10
4
ε=0.85
Mobility services
10
1
10
2
10
3
10
4
10
1
10
2
10
3
10
4
ε=0.23
Housing
10
1
10
2
10
3
10
4
10
1
10
2
10
3
10
4
ε=0.85
Infrastucture
10
1
10
2
10
3
10
4
10
1
10
2
10
3
10
4
ε=0.88
Electricity, gas, water
10
1
10
2
10
3
10
4
10
1
10
2
10
3
10
4
ε=0.61
Services and retailing East Asia
South-East Asia and Oceania
South Asia
North America
South America
Europe
Russian Federation and former Soviet
Middle East and North Africa
Africa
Consumption (USD/capita)
Emissions(CO
2
-eq/capita)
Consumption by income
miljøpartiet de grønne
14/06/2014
Consumption policies
• Country level consumption cap, border
carbon adjustment
• Complex, equity issues
• Financial transfers along trade flows
• Labelling
• Generally ineffective
• Information (less meat, less flights, ...)
• Not effective at the aggregate (nationally)
• Rebound effects
miljøpartiet de grønne
14/06/2014
FOSSIL FUELS
miljøpartiet de grønne
14/06/2014
The emissions supply chain
Production
(Territorial)
(Combustion)
miljøpartiet de grønne
14/06/2014
The emissions supply chain
Consumption
(Carbon Footprint)
Production
(Territorial)
(Combustion)
miljøpartiet de grønne
14/06/2014
The emissions supply chain
Extraction Production
Consumption
(Carbon Footprint)
Production
(Territorial)
(Combustion)
miljøpartiet de grønne
14/06/2014
The emissions supply chain
Extraction Production
Consumption
(Carbon Footprint)
Production
(Territorial)
(Combustion)
miljøpartiet de grønne
14/06/2014
Trade and Carbon
Relevant in two ways
1. Trade in fossil fuels (physical)
2. Trade in goods and services (embodied)
Major Flows from Extraction to Production
Start of Arrow: fossil-fuel extraction
End of arrow: fossil-fuel combustion
Values for 2007. EU27 is treated as one region. Units: TgC=GtC/1000
Source: Peters et al 2012b
Major Flows from Production to Consumption
Start of Arrow: fossil-fuel combustion
End of arrow: goods and services consumption
Values for 2007. EU27 is treated as one region. Units: TgC=GtC/1000
Source: Peters et al 2012b
Major Flows from Extraction to Consumption
Start of Arrow: fossil-fuel extraction
End of arrow: goods and services consumption
Values for 2007. EU27 is treated as one region. Units: TgC=GtC/1000
Source: Peters et al 2012b
Responsible Norway?
1970 1975 1980 1985 1990 1995 2000 2005 2010 2015
0
100
200
300
400
500
600
700
Carbon(MtCO
2
)
Extracted oil: 10432 MtCO2
Extracted gas: 3491 MtCO2
Proven oil reserves: 3105 MtCO2
Proven gas reserves: 4194 MtCO2
Glen Peters (CICERO)Extracted Oil (BP)
Extracted Gas (BP)
Territorial emissions (CDIAC)
miljøpartiet de grønne
14/06/2014
Net trade per capita
miljøpartiet de grønne
14/06/2014
Norwegian GHG emissions
miljøpartiet de grønne
14/06/2014
EQUITY
miljøpartiet de grønne
14/06/2014
Consumption more just?
• “Emissions should be allocated to
consumption because it is fairer”
• Consumption policies implicitly/explicitly
put a price on imports
• Developing countries are worse off!
• (they have to mitigate our consumption)
• Offset this by financial transfers
miljøpartiet de grønne
14/06/2014
Extraction more just?
• “It is fairer to make fossil fuel exporters
pay for the carbon they extract”
• Revenue
• Could be used for financial transfers
• Buy support for carbon price by letting
extractors keep the income
miljøpartiet de grønne
14/06/2014
POLICY IMPLICATIONS
miljøpartiet de grønne
14/06/2014
The policy problem
• Differential carbon pricing
 Countries unwilling to deepen and broaden
climate policies unilaterally
• Two main issues
• Competitiveness concerns (economic)
• Carbon leakage (environmental)
• International trade is a key factor
miljøpartiet de grønne
14/06/2014
Extraction
Extractors collect tax revenue
In principle easy
Production/Territorial
Easy and status quo
Fragmentation, free riders,
carbon leakage
Consumption
Puts focus on key drivers
Complex (and uncertain)
Alternate carbon policy
miljøpartiet de grønne
14/06/2014
Thank you
I would love some questions 
folk.uio.no/glen
Twitter: @Peters_Glen

Glenn Peters, faglig innlegg MDG lsm 14.06.2014

  • 1.
    Governing the willingnessto extract, combust and consume less carbon Miljøpartiet de Grønne June 14, 2014 (11-12) Glen Peters Center for International Climate and Environmental Research – Oslo (CICERO) Email: glen.peters@cicero.uio.no Twitter: @Peters_Glen
  • 2.
    Fossil Fuel andCement Emissions Global fossil fuel and cement emissions: 9.7 ± 0.5 GtC in 2012, 58% over 1990 Projection for 2013 : 9.9 ± 0.5 GtC, 61% over 1990 With leap year adjustment: 2012 growth rate is 1.9% and 2013 is 2.4% Source: Le Quéré et al 2013; CDIAC Data; Global Carbon Project 2013 Uncertainty is ±5% for one standard deviation (IPCC “likely” range)
  • 3.
    Observed Emissions andEmissions Scenarios Emissions are on track for 3.2–5.4ºC “likely” increase in temperature above pre-industrial Large and sustained mitigation is required to keep below 2ºC Fossil fuel and cement emissions only Linear interpolation is used between individual data points Source: Peters et al. 2012a; CDIAC Data; Global Carbon Project 2013
  • 4.
    Observed Emissions andEmissions Scenarios Emissions are on track for 3.2–5.4ºC “likely” increase in temperature above pre-industrial Large and sustained mitigation is required to keep below 2ºC Fossil fuel and cement emissions only Linear interpolation is used between individual data points Source: Peters et al. 2012a; CDIAC Data; Global Carbon Project 2013 Short-term • Reverse emission trajectory • Emissions peak by 2020
  • 5.
    Observed Emissions andEmissions Scenarios Emissions are on track for 3.2–5.4ºC “likely” increase in temperature above pre-industrial Large and sustained mitigation is required to keep below 2ºC Fossil fuel and cement emissions only Linear interpolation is used between individual data points Source: Peters et al. 2012a; CDIAC Data; Global Carbon Project 2013 Medium-term • Sustain emission trajectory • Around 3%/yr reductions globally Short-term • Reverse emission trajectory • Emissions peak by 2020
  • 6.
    Observed Emissions andEmissions Scenarios Emissions are on track for 3.2–5.4ºC “likely” increase in temperature above pre-industrial Large and sustained mitigation is required to keep below 2ºC Fossil fuel and cement emissions only Linear interpolation is used between individual data points Source: Peters et al. 2012a; CDIAC Data; Global Carbon Project 2013 Short-term • Reverse emission trajectory • Emissions peak by 2020 Medium-term • Sustain emission trajectory • Around 3%/yr reductions globally Long-term • Net negative emissions • Unproven technologies
  • 7.
    How to sharethe mitigation challenge? Depending on perspective, the importance of individual countries changes GDP: Gross Domestic Product in Market Exchange Rates (MER) and Purchasing Power Parity (PPP) Source: CDIAC Data; Le Quéré et al 2013; Global Carbon Project 2013
  • 8.
    Top Fossil FuelEmitters (Absolute) Top five emitters in 2012 covered 63% of global emissions China (27%), United States (14%), EU28 (10%), India (6%), Russia (5%) With leap year adjustment in 2012 growth rates are: China 5.6%, USA -4.0%, EU -1.6%, India 7.4%, Russia 4.8%. Source: CDIAC Data; Le Quéré et al 2013; Global Carbon Project 2013
  • 9.
    Top Fossil FuelEmitters (Per Capita) Average per capita emissions in 2012 China is growing rapidly and the US is declining fast Source: CDIAC Data; Le Quéré et al 2013; Global Carbon Project 2013
  • 10.
    Historical Cumulative Emissionsby Country Cumulative emissions from fossil-fuel and cement were distributed (1870–2012): USA (26%), EU28 (23%), China (11%), Russia (8%), and India (4%) covering 71% of the total share Cumulative emissions (1990–2012) were distributed USA (20%), EU28 (15%), China (18%), Russia (6%), India (5%) Source: CDIAC Data; Le Quéré et al 2013; Global Carbon Project 2013
  • 11.
    miljøpartiet de grønne 14/06/2014 Themitigation challange • “Common but differentiated” leads to fragmented policies • Strong, weak, none • Global commons • “Free rider” problems • Relevant in a global economy • Carbon leakage • Competiveness concerns
  • 12.
  • 13.
    miljøpartiet de grønne 14/06/2014 Dealingwith fragmentation Global emissions allocated to the goods and services consumed in country X
  • 14.
    miljøpartiet de grønne 14/06/2014 Dealingwith fragmentation Global emissions allocated to the goods and services consumed in country X Consumption = Production + Imports – Exports
  • 15.
    miljøpartiet de grønne 14/06/2014 Dealingwith fragmentation Global emissions allocated to the goods and services consumed in country X Consumption = Production + Imports – Exports Production
  • 16.
    miljøpartiet de grønne 14/06/2014 Dealingwith fragmentation Global emissions allocated to the goods and services consumed in country X Consumption = Production + Imports – Exports Production Exp Domestic
  • 17.
    miljøpartiet de grønne 14/06/2014 Dealingwith fragmentation Global emissions allocated to the goods and services consumed in country X Consumption = Production + Imports – Exports Production Exp ImpDomestic
  • 18.
    miljøpartiet de grønne 14/06/2014 Dealingwith fragmentation Global emissions allocated to the goods and services consumed in country X Consumption = Production + Imports – Exports Production Exp Imp Consumption Domestic
  • 19.
    miljøpartiet de grønne 14/06/2014 Dealingwith fragmentation Global emissions allocated to the goods and services consumed in country X Consumption = Production + Imports – Exports Production Exp Imp Consumption Domestic The adjustment for international trade is the key factor
  • 20.
    miljøpartiet de grønne 14/06/2014 Largeshare of consumer emissions are territorial “Imported” emissions
  • 21.
  • 22.
    miljøpartiet de grønne 14/06/2014 Consumption-induced: Theincrease in net import into Annex B countries 1990-2008 was five times greater than the achieved emission reduction
  • 23.
    miljøpartiet de grønne 14/06/2014 Policy-induced: Negligibleeffect 0.3% of territorial Consumption-induced: The increase in net import into Annex B countries 1990-2008 was five times greater than the achieved emission reduction
  • 24.
    miljøpartiet de grønne 14/06/2014 Carbonleakage • Policy-induced carbon leakage • Caused by climate policy • Small at today’s carbon prices • Consumption-induced carbon leakage • Caused by a changing division of labour • Increased consumption, met by imports • Large, but not related to carbon prices
  • 25.
    miljøpartiet de grønne 14/06/2014 Carbonfootprints and scale • Scale is important for footprints • Big country, small share imported • Small country, large share imported • City, most imported • Household, all imported
  • 26.
  • 27.
    miljøpartiet de grønne 14/06/2014 Cityand the Hinterland GHG t/household Sydney Melbourne Brisbane Adelaide Perth Greater Hobart Canberra Darwin GHG Footprint 52.9 66.8 63.3 51.4 69.3 44.3 58.3 50.1 GHG Footprint - Domestic 12.3 16.2 15.6 16.2 11.4 5.3 4.7 10.2 GHG Footprint - Import 40.5 50.5 47.7 35.2 57.9 39.0 53.6 39.8 Share imported (%) 77 76 75 69 84 88 92 80 70-90% of carbon footprint imported!
  • 28.
    miljøpartiet de grønne 14/06/2014 Cityand the Hinterland GHG t/household Sydney Melbourne Brisbane Adelaide Perth Greater Hobart Canberra Darwin GHG Footprint 52.9 66.8 63.3 51.4 69.3 44.3 58.3 50.1 GHG Footprint - Domestic 12.3 16.2 15.6 16.2 11.4 5.3 4.7 10.2 GHG Footprint - Import 40.5 50.5 47.7 35.2 57.9 39.0 53.6 39.8 Share imported (%) 77 76 75 69 84 88 92 80 y = 0.8955x1.0911 R² = 0.9869 1.0 10.0 100.0 1 10 100 GHG Footprint vs Income 70-90% of carbon footprint imported! Income dominates footprints, other factors (urban form, house size, etc) are marginal
  • 29.
    miljøpartiet de grønne 14/06/2014 10 1 10 2 10 3 10 4 10 1 10 2 10 3 10 4 ε=0.35 Food 10 1 10 2 10 3 10 4 10 1 10 2 10 3 10 4 ε=0.77 Clothing 10 1 10 2 10 3 10 4 10 1 10 2 10 3 10 4 ε=0.79 Manufacturingand Industry 10 1 10 2 10 3 10 4 10 1 10 2 10 3 10 4 ε=0.85 Mobility services 10 1 10 2 10 3 10 4 10 1 10 2 10 3 10 4 ε=0.23 Housing 10 1 10 2 10 3 10 4 10 1 10 2 10 3 10 4 ε=0.85 Infrastucture 10 1 10 2 10 3 10 4 10 1 10 2 10 3 10 4 ε=0.88 Electricity, gas, water 10 1 10 2 10 3 10 4 10 1 10 2 10 3 10 4 ε=0.61 Services and retailing East Asia South-East Asia and Oceania South Asia North America South America Europe Russian Federation and former Soviet Middle East and North Africa Africa Consumption (USD/capita) Emissions(CO 2 -eq/capita) Consumption by income
  • 30.
    miljøpartiet de grønne 14/06/2014 Consumptionpolicies • Country level consumption cap, border carbon adjustment • Complex, equity issues • Financial transfers along trade flows • Labelling • Generally ineffective • Information (less meat, less flights, ...) • Not effective at the aggregate (nationally) • Rebound effects
  • 31.
  • 32.
    miljøpartiet de grønne 14/06/2014 Theemissions supply chain Production (Territorial) (Combustion)
  • 33.
    miljøpartiet de grønne 14/06/2014 Theemissions supply chain Consumption (Carbon Footprint) Production (Territorial) (Combustion)
  • 34.
    miljøpartiet de grønne 14/06/2014 Theemissions supply chain Extraction Production Consumption (Carbon Footprint) Production (Territorial) (Combustion)
  • 35.
    miljøpartiet de grønne 14/06/2014 Theemissions supply chain Extraction Production Consumption (Carbon Footprint) Production (Territorial) (Combustion)
  • 36.
    miljøpartiet de grønne 14/06/2014 Tradeand Carbon Relevant in two ways 1. Trade in fossil fuels (physical) 2. Trade in goods and services (embodied)
  • 37.
    Major Flows fromExtraction to Production Start of Arrow: fossil-fuel extraction End of arrow: fossil-fuel combustion Values for 2007. EU27 is treated as one region. Units: TgC=GtC/1000 Source: Peters et al 2012b
  • 38.
    Major Flows fromProduction to Consumption Start of Arrow: fossil-fuel combustion End of arrow: goods and services consumption Values for 2007. EU27 is treated as one region. Units: TgC=GtC/1000 Source: Peters et al 2012b
  • 39.
    Major Flows fromExtraction to Consumption Start of Arrow: fossil-fuel extraction End of arrow: goods and services consumption Values for 2007. EU27 is treated as one region. Units: TgC=GtC/1000 Source: Peters et al 2012b
  • 40.
    Responsible Norway? 1970 19751980 1985 1990 1995 2000 2005 2010 2015 0 100 200 300 400 500 600 700 Carbon(MtCO 2 ) Extracted oil: 10432 MtCO2 Extracted gas: 3491 MtCO2 Proven oil reserves: 3105 MtCO2 Proven gas reserves: 4194 MtCO2 Glen Peters (CICERO)Extracted Oil (BP) Extracted Gas (BP) Territorial emissions (CDIAC)
  • 41.
  • 42.
  • 43.
  • 44.
    miljøpartiet de grønne 14/06/2014 Consumptionmore just? • “Emissions should be allocated to consumption because it is fairer” • Consumption policies implicitly/explicitly put a price on imports • Developing countries are worse off! • (they have to mitigate our consumption) • Offset this by financial transfers
  • 45.
    miljøpartiet de grønne 14/06/2014 Extractionmore just? • “It is fairer to make fossil fuel exporters pay for the carbon they extract” • Revenue • Could be used for financial transfers • Buy support for carbon price by letting extractors keep the income
  • 46.
  • 47.
    miljøpartiet de grønne 14/06/2014 Thepolicy problem • Differential carbon pricing  Countries unwilling to deepen and broaden climate policies unilaterally • Two main issues • Competitiveness concerns (economic) • Carbon leakage (environmental) • International trade is a key factor
  • 48.
    miljøpartiet de grønne 14/06/2014 Extraction Extractorscollect tax revenue In principle easy Production/Territorial Easy and status quo Fragmentation, free riders, carbon leakage Consumption Puts focus on key drivers Complex (and uncertain) Alternate carbon policy
  • 49.
    miljøpartiet de grønne 14/06/2014 Thankyou I would love some questions  folk.uio.no/glen Twitter: @Peters_Glen