Download free for 30 days
Sign in
Upload
Language (EN)
Support
Business
Mobile
Social Media
Marketing
Technology
Art & Photos
Career
Design
Education
Presentations & Public Speaking
Government & Nonprofit
Healthcare
Internet
Law
Leadership & Management
Automotive
Engineering
Software
Recruiting & HR
Retail
Sales
Services
Science
Small Business & Entrepreneurship
Food
Environment
Economy & Finance
Data & Analytics
Investor Relations
Sports
Spiritual
News & Politics
Travel
Self Improvement
Real Estate
Entertainment & Humor
Health & Medicine
Devices & Hardware
Lifestyle
Change Language
Language
English
Español
Português
Français
Deutsche
Cancel
Save
EN
Uploaded by
Інститут економічних досліджень та політичних консультацій
PDF, PPTX
50 views
Моніторинг ІТ сектору України GET_UKR_PB_03_2025-1.pdf
Огляд IT-сектору України за 2024 рік.
Economy & Finance
◦
Read more
0
Save
Share
Embed
Embed presentation
Download
Download as PDF, PPTX
1
/ 20
2
/ 20
3
/ 20
4
/ 20
5
/ 20
6
/ 20
7
/ 20
8
/ 20
9
/ 20
10
/ 20
11
/ 20
12
/ 20
13
/ 20
14
/ 20
15
/ 20
16
/ 20
17
/ 20
18
/ 20
19
/ 20
20
/ 20
More Related Content
PDF
National project Innovative Ukraine
by
Yevgen Sysoyev
PPTX
IT Industry - Development of Economy and Talent (Vitaliy Nuzhnyy Business Str...
by
IT Arena
PDF
Kharkiv_IT_Research_report
by
Kharkov IT Cluster
PPTX
Обзор ИТ-индустрии от Miratech
by
Expert and Consulting (EnC)
PDF
Invest in Ukraine: IT sector
by
OfficeNIC
PDF
Razom/IT presents Ukraine: Rise of Tech Nation
by
Razom For Ukraine
PPTX
NYC event Razom Ukraine: Rise of Ukraine as Technology Nation
by
Yevgen Sysoyev
PDF
Ukrainian Tech Ecosystem at a Glance
by
DenSmyrnov
National project Innovative Ukraine
by
Yevgen Sysoyev
IT Industry - Development of Economy and Talent (Vitaliy Nuzhnyy Business Str...
by
IT Arena
Kharkiv_IT_Research_report
by
Kharkov IT Cluster
Обзор ИТ-индустрии от Miratech
by
Expert and Consulting (EnC)
Invest in Ukraine: IT sector
by
OfficeNIC
Razom/IT presents Ukraine: Rise of Tech Nation
by
Razom For Ukraine
NYC event Razom Ukraine: Rise of Ukraine as Technology Nation
by
Yevgen Sysoyev
Ukrainian Tech Ecosystem at a Glance
by
DenSmyrnov
Similar to Моніторинг ІТ сектору України GET_UKR_PB_03_2025-1.pdf
PDF
Ukraine’s Tech Ecosystem at a Glance
by
Den Smirnov
PDF
Ukraine: The Rise of a Technology Nation
by
Yevgen Sysoyev
PDF
Ua hightech
by
Ruslan Sivoplyas
PPTX
Ukraine Software Tech
by
Yevgen Sysoyev
PDF
Nation: technological and/or successful
by
Dima Malenko
PPT
Seminario CoreaArgentina Sep09
by
Alejandro Prince
PPT
Outsourcing to Ukraine.Country overview.
by
HI-TECH_Org_Ua
PPT
Outsourcing to Ukraine. Country Overview. Webinar 13.01.10.
by
Victor_Maznyuk
PPT
Outsourcing To CEE. Country Overview. Ukraine Webinar 13.01.10
by
guest4ffcf5f
PDF
IT Professionals – The Right Time/The Right Place
by
IT Weekend
PPTX
The future of outsourcing in Belarus and Ukraine
by
Intetics
PDF
OMGKRK Academy #8 Ecosystem Summit, Kyiv: Nataly Veremeeva
by
Foundation Supporting #OMGKRK
PPTX
An overview of Ukrainian it market.
by
Artem Berman
PDF
The Economic Impact of IT, Software and Innovation”
by
TUESDAY Business Network
PDF
Ukrainian Trade Mission to Canada
by
Eduard Rubin
PPT
Lviv outsourcing forum, Victor Maznuk
by
Lviv Startup Club
PDF
State of Global IT Services and Software Industry - 2023
by
Vishal Sharma
PDF
Denis Gursky — Government as a Platform: Data Infrastructure for Ukraine
by
Black Sea Summit — IT-conference in Odessa
PDF
IT Dnipro Research 2019
by
Yevhen Hostishchev
PDF
Nearshoring for EU: Ukrainian Perspective
by
Infopulse
Ukraine’s Tech Ecosystem at a Glance
by
Den Smirnov
Ukraine: The Rise of a Technology Nation
by
Yevgen Sysoyev
Ua hightech
by
Ruslan Sivoplyas
Ukraine Software Tech
by
Yevgen Sysoyev
Nation: technological and/or successful
by
Dima Malenko
Seminario CoreaArgentina Sep09
by
Alejandro Prince
Outsourcing to Ukraine.Country overview.
by
HI-TECH_Org_Ua
Outsourcing to Ukraine. Country Overview. Webinar 13.01.10.
by
Victor_Maznyuk
Outsourcing To CEE. Country Overview. Ukraine Webinar 13.01.10
by
guest4ffcf5f
IT Professionals – The Right Time/The Right Place
by
IT Weekend
The future of outsourcing in Belarus and Ukraine
by
Intetics
OMGKRK Academy #8 Ecosystem Summit, Kyiv: Nataly Veremeeva
by
Foundation Supporting #OMGKRK
An overview of Ukrainian it market.
by
Artem Berman
The Economic Impact of IT, Software and Innovation”
by
TUESDAY Business Network
Ukrainian Trade Mission to Canada
by
Eduard Rubin
Lviv outsourcing forum, Victor Maznuk
by
Lviv Startup Club
State of Global IT Services and Software Industry - 2023
by
Vishal Sharma
Denis Gursky — Government as a Platform: Data Infrastructure for Ukraine
by
Black Sea Summit — IT-conference in Odessa
IT Dnipro Research 2019
by
Yevhen Hostishchev
Nearshoring for EU: Ukrainian Perspective
by
Infopulse
More from Інститут економічних досліджень та політичних консультацій
PDF
В січні на проблеми з електропостачанням вказували майже 50% бізнесів — опиту...
by
Інститут економічних досліджень та політичних консультацій
PDF
Trade Facilitation Monitoring in Ukraine № 98
by
Інститут економічних досліджень та політичних консультацій
PDF
Щомісячний моніторинг сприяння торгівлі в Україні № 98
by
Інститут економічних досліджень та політичних консультацій
PDF
Україна вже втрачає 3,7 млрд євро і ризикує втратити ще 1,4 млрд євро
by
Інститут економічних досліджень та політичних консультацій
PDF
Український ВВП у 2026 році зросте на 2,1% — прогноз ІЕД та GET
by
Інститут економічних досліджень та політичних консультацій
PDF
Monitoring implementation of the IMF program and EU assistance (January 2026)
by
Інститут економічних досліджень та політичних консультацій
PDF
Україна не виконує суттєвий обсяг реформ за програмами МВФ та Ukraine Facilit...
by
Інститут економічних досліджень та політичних консультацій
PDF
Аналітична записка: Процедура макроекономічних дисбалансів
by
Інститут економічних досліджень та політичних консультацій
PDF
Моніторинг виконання програми МВФ та допомоги ЄС (січень 2026)
by
Інститут економічних досліджень та політичних консультацій
PDF
Average Order Backlog of Enterprises Shortened to 3.4 Months — IER Survey
by
Інститут економічних досліджень та політичних консультацій
PDF
New Monthly Enterprises Survey. Issue 44. (12.2025) Ukrainian Business in War...
by
Інститут економічних досліджень та політичних консультацій
PDF
44-те Щомісячне опитування підприємств «Український бізнес під час війни» (гр...
by
Інститут економічних досліджень та політичних консультацій
PDF
New Monthly Enterprises Survey. Issue 43. (11.2025) Ukrainian Business in War...
by
Інститут економічних досліджень та політичних консультацій
PDF
New Monthly Enterprises Survey. Issue 42. (10.2025) Ukrainian Business in War...
by
Інститут економічних досліджень та політичних консультацій
PDF
Ukraine Has Significant Untapped Trade Potential Within the Pan-Euro-Mediterr...
by
Інститут економічних досліджень та політичних консультацій
PDF
Iron and Steel Production, Cereals, and Oilseed Crops Lead in Export Potentia...
by
Інститут економічних досліджень та політичних консультацій
PDF
Labor Shortages and Security Risks Were the Top Obstacles for Business in Dec...
by
Інститут економічних досліджень та політичних консультацій
PDF
Лідерами за експортним потенціалом є виробництво чорних металів та вирощуванн...
by
Інститут економічних досліджень та політичних консультацій
PDF
Україна має значний невикористаний потенціал для торгівлі в рамках Пан-Євро-С...
by
Інститут економічних досліджень та політичних консультацій
PDF
Місячний Економічний Моніторинг України №252
by
Інститут економічних досліджень та політичних консультацій
В січні на проблеми з електропостачанням вказували майже 50% бізнесів — опиту...
by
Інститут економічних досліджень та політичних консультацій
Trade Facilitation Monitoring in Ukraine № 98
by
Інститут економічних досліджень та політичних консультацій
Щомісячний моніторинг сприяння торгівлі в Україні № 98
by
Інститут економічних досліджень та політичних консультацій
Україна вже втрачає 3,7 млрд євро і ризикує втратити ще 1,4 млрд євро
by
Інститут економічних досліджень та політичних консультацій
Український ВВП у 2026 році зросте на 2,1% — прогноз ІЕД та GET
by
Інститут економічних досліджень та політичних консультацій
Monitoring implementation of the IMF program and EU assistance (January 2026)
by
Інститут економічних досліджень та політичних консультацій
Україна не виконує суттєвий обсяг реформ за програмами МВФ та Ukraine Facilit...
by
Інститут економічних досліджень та політичних консультацій
Аналітична записка: Процедура макроекономічних дисбалансів
by
Інститут економічних досліджень та політичних консультацій
Моніторинг виконання програми МВФ та допомоги ЄС (січень 2026)
by
Інститут економічних досліджень та політичних консультацій
Average Order Backlog of Enterprises Shortened to 3.4 Months — IER Survey
by
Інститут економічних досліджень та політичних консультацій
New Monthly Enterprises Survey. Issue 44. (12.2025) Ukrainian Business in War...
by
Інститут економічних досліджень та політичних консультацій
44-те Щомісячне опитування підприємств «Український бізнес під час війни» (гр...
by
Інститут економічних досліджень та політичних консультацій
New Monthly Enterprises Survey. Issue 43. (11.2025) Ukrainian Business in War...
by
Інститут економічних досліджень та політичних консультацій
New Monthly Enterprises Survey. Issue 42. (10.2025) Ukrainian Business in War...
by
Інститут економічних досліджень та політичних консультацій
Ukraine Has Significant Untapped Trade Potential Within the Pan-Euro-Mediterr...
by
Інститут економічних досліджень та політичних консультацій
Iron and Steel Production, Cereals, and Oilseed Crops Lead in Export Potentia...
by
Інститут економічних досліджень та політичних консультацій
Labor Shortages and Security Risks Were the Top Obstacles for Business in Dec...
by
Інститут економічних досліджень та політичних консультацій
Лідерами за експортним потенціалом є виробництво чорних металів та вирощуванн...
by
Інститут економічних досліджень та політичних консультацій
Україна має значний невикористаний потенціал для торгівлі в рамках Пан-Євро-С...
by
Інститут економічних досліджень та політичних консультацій
Місячний Економічний Моніторинг України №252
by
Інститут економічних досліджень та політичних консультацій
Recently uploaded
PPTX
PPT Chapter 1 Introducing economic development A global perspective.pptx
by
RokhediSantoso1
PDF
Veritas Financial Statement presentation 2025
by
Veritas Eläkevakuutus - Veritas Pensionsförsäkring
PDF
"Comprehensive Infographics on India's Budget 2026-2027: Key Reforms, Economi...
by
CA Suvidha Chaplot
PDF
Developing Soft Skills through Social Hackathons
by
GeorgeDiamandis11
PDF
Healthcare Sector Overview - Finance Club UoM.pdf
by
Finance Club UoM
PDF
Financial Analysis Report Eli Lilly & Co. - Finance Club UoM.pdf
by
Finance Club UoM
PDF
"Free AI Tools for Operational Management | Boost Efficiency with CA Suvidha ...
by
CA Suvidha Chaplot
DOCX
11 Best Trusted Places to Buy Verified Remitly Accounts in 2026.docx
by
marketing
PPTX
Precious Metals Performance in 2025 and Outlook Outlook 2026
by
James Whitfield
PDF
Financial Analysis Report AMEX - Finance Club UoM.pdf
by
Finance Club UoM
PDF
India_Structural_Re-Rating_Beyond_Gold.pdf
by
ApoorvaRaval1
DOCX
Buy A Verified Remitly Account for Freelancers & Businesses.docx
by
marketing
PDF
Andhra Pradesh Budget in Brief 2026-27.pdf
by
ssuser9d8e4e
PDF
"Mastering Financial Literacy and Planning with CA Suvidha Chaplot: Your Guid...
by
CA Suvidha Chaplot
PDF
Bladex Earnings Call Presentation 4Q2025
by
Bladex
PDF
Tisza Párt programjának makroökonómiai elemzése ( EN )
by
Gábor Nagymajtényi
PDF
Unsung Britain conference: Context setting presentation from Resolution Found...
by
ResolutionFoundation
PDF
"India Budget 2026-2027: Key Economic Reforms, Growth Strategies & Fiscal Pri...
by
CA Suvidha Chaplot
PPTX
Dr. D. Sundari PRICING STRATEGIES ppt.pptx
by
DrSundariD
DOCX
Buy Verified Binance Accounts with Guaranteed Security and Trust not risk .docx
by
marketing
PPT Chapter 1 Introducing economic development A global perspective.pptx
by
RokhediSantoso1
Veritas Financial Statement presentation 2025
by
Veritas Eläkevakuutus - Veritas Pensionsförsäkring
"Comprehensive Infographics on India's Budget 2026-2027: Key Reforms, Economi...
by
CA Suvidha Chaplot
Developing Soft Skills through Social Hackathons
by
GeorgeDiamandis11
Healthcare Sector Overview - Finance Club UoM.pdf
by
Finance Club UoM
Financial Analysis Report Eli Lilly & Co. - Finance Club UoM.pdf
by
Finance Club UoM
"Free AI Tools for Operational Management | Boost Efficiency with CA Suvidha ...
by
CA Suvidha Chaplot
11 Best Trusted Places to Buy Verified Remitly Accounts in 2026.docx
by
marketing
Precious Metals Performance in 2025 and Outlook Outlook 2026
by
James Whitfield
Financial Analysis Report AMEX - Finance Club UoM.pdf
by
Finance Club UoM
India_Structural_Re-Rating_Beyond_Gold.pdf
by
ApoorvaRaval1
Buy A Verified Remitly Account for Freelancers & Businesses.docx
by
marketing
Andhra Pradesh Budget in Brief 2026-27.pdf
by
ssuser9d8e4e
"Mastering Financial Literacy and Planning with CA Suvidha Chaplot: Your Guid...
by
CA Suvidha Chaplot
Bladex Earnings Call Presentation 4Q2025
by
Bladex
Tisza Párt programjának makroökonómiai elemzése ( EN )
by
Gábor Nagymajtényi
Unsung Britain conference: Context setting presentation from Resolution Found...
by
ResolutionFoundation
"India Budget 2026-2027: Key Economic Reforms, Growth Strategies & Fiscal Pri...
by
CA Suvidha Chaplot
Dr. D. Sundari PRICING STRATEGIES ppt.pptx
by
DrSundariD
Buy Verified Binance Accounts with Guaranteed Security and Trust not risk .docx
by
marketing
Моніторинг ІТ сектору України GET_UKR_PB_03_2025-1.pdf
1.
Copyright © 2025 BE Berlin Economics GmbH | All rights reserved. In cooperation with POLICY BRIEFING IT
Sector Monitor Ukraine by Iryna Kosse, Garry Poluschkin UKRAINE NO 03 | MAY 2025
2.
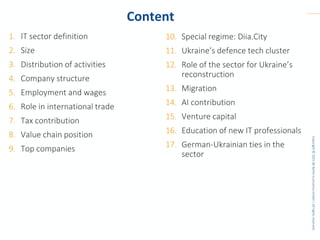
Copyright © 2025 BE Berlin Economics GmbH | All rights reserved. Content 1. IT sector
definition 2. Size 3. Distribution of activities 4. Company structure 5. Employment and wages 6. Role in international trade 7. Tax contribution 8. Value chain position 9. Top companies 10. Special regime: Diia.City 11. Ukraine’s defence tech cluster 12. Role of the sector for Ukraine’s reconstruction 13. Migration 14. AI contribution 15. Venture capital 16. Education of new IT professionals 17. German-Ukrainian ties in the sector
3.
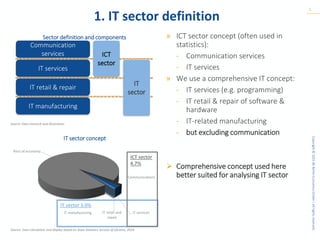
Copyright © 2025 BE Berlin Economics GmbH | All rights reserved. 1. IT sector
definition 3 » ICT sector concept (often used in statistics): - Communication services - IT services » We use a comprehensive IT concept: - IT services (e.g. programming) - IT retail & repair of software & hardware - IT-related manufacturing - but excluding communication ➢ Comprehensive concept used here better suited for analysing IT sector Sector definition and components IT sector concept Source: Own calculation and display based on State Statistics Service of Ukraine, 2024 Communication services IT services IT retail & repair IT manufacturing ICT sector IT sector Source: Own research and illustration Communications IT services IT manufacturing IT retail and repair Rest of economy IT sector 3.0% ICT sector 4.7%
4.
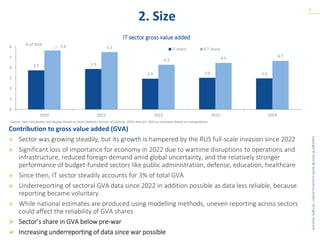
Copyright © 2025 BE Berlin Economics GmbH | All rights reserved. 2. Size 4 Contribution to
gross value added (GVA) » Sector was growing steadily, but its growth is hampered by the RUS full-scale invasion since 2022 » Significant loss of importance for economy in 2022 due to wartime disruptions to operations and infrastructure, reduced foreign demand amid global uncertainty, and the relatively stronger performance of budget-funded sectors like public administration, defense, education, healthcare » Since then, IT sector steadily accounts for 3% of total GVA » Underreporting of sectoral GVA data since 2022 in addition possible as data less reliable, because reporting became voluntary. » While national estimates are produced using modelling methods, uneven reporting across sectors could affect the reliability of GVA shares ➢ Sector’s share in GVA below pre-war ➢ Increasing underreporting of data since war possible IT sector gross value added 3.7 3.9 2.9 3.0 3.0 5.6 5.5 4.3 4.5 4.7 0 1 2 3 4 5 6 2020 2021 2022 2023 2024 % of GVA IT share ICT share Source: Own calculation and display based on State Statistics Service of Ukraine, 2024, data for 2024 as estimates based on extrapolation
5.
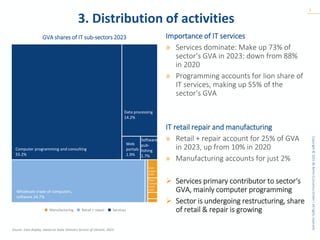
Copyright © 2025 BE Berlin Economics GmbH | All rights reserved. 3. Distribution of
activities 5 Importance of IT services » Services dominate: Make up 73% of sector‘s GVA in 2023: down from 88% in 2020 » Programming accounts for lion share of IT services, making up 55% of the sector‘s GVA IT retail repair and manufacturing » Retail + repair account for 25% of GVA in 2023, up from 10% in 2020 » Manufacturing accounts for just 2% ➢ Services primary contributor to sector‘s GVA, mainly computer programming ➢ Sector is undergoing restructuring, share of retail & repair is growing Source: Own display, based on State Statistics Service of Ukraine, 2023 GVA shares of IT sub-sectors 2023 1 2 3 Repair of IT equip- ment Manufacturing Retail + repair Services Computer programming and consulting 55.2% Data processing 14.2% Web portals 1.9% Wholesale trade of computers, software 24.7% Software pub- lishing 1.7% Com- puters 0.8% Electr. Compo- nents 0.6%
6.
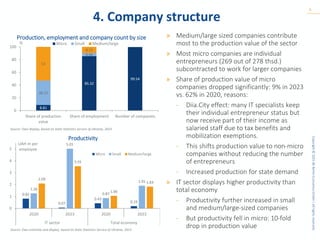
Copyright © 2025 BE Berlin Economics GmbH | All rights reserved. 4. Company structure 6 »
Medium/large sized companies contribute most to the production value of the sector » Most micro companies are individual entrepreneurs (269 out of 278 thsd.) subcontracted to work for larger companies » Share of production value of micro companies dropped significantly: 9% in 2023 vs. 62% in 2020, reasons: - Diia.City effect: many IT specialists keep their individual entrepreneur status but now receive part of their income as salaried staff due to tax benefits and mobilization exemptions. - This shifts production value to non-micro companies without reducing the number of entrepreneurs - Increased production for state demand » IT sector displays higher productivity than total economy - Productivity further increased in small and medium/large-sized companies - But productivity fell in micro: 10-fold drop in production value Production, employment and company count by size Productivity Source: Own display, based on State Statistics Service of Ukraine, 2023 Source: Own estimate and display, based on State Statistics Service of Ukraine, 2023 8.81 85.32 99.54 38.22 4.96 53 9.72 0 20 40 60 80 100 Share of production value Share of employment Number of companies % Micro Small Medium/large 0.82 0.07 0.43 0.19 1.26 5.01 0.87 1.91 2.09 3.55 1.06 1.83 0 1 2 3 4 5 2020 2023 2020 2023 IT sector Total economy UAH m per employee Micro Small Medium/large
7.
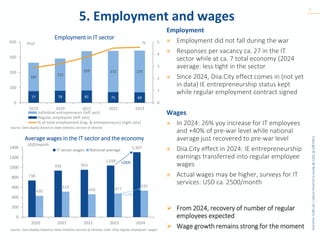
Copyright © 2025 BE Berlin Economics GmbH | All rights reserved. 5. Employment and
wages 7 Employment » Employment did not fall during the war » Responses per vacancy ca. 27 in the IT sector while at ca. 7 total economy (2024 average: less tight in the sector » Since 2024, Diia.City effect comes in (not yet in data) IE entrepreneurship status kept while regular employment contract signed Wages » In 2024: 26% yoy increase for IT employees and +40% of pre-war level while national average just recovered to pre-war level » Diia.City effect in 2024: IE entrepreneurship earnings transferred into regular employee wages » Actual wages may be higher, surveys for IT services: USD ca. 2500/month ➢ From 2024, recovery of number of regular employees expected ➢ Wage growth remains strong for the moment Employment in IT sector Average wages in the IT sector and the economy Source: Own display based on State Statistics Service of Ukraine; note: Only regular employees‘ wages Source: Own display based on State Statistics Service of Ukraine 77 79 81 71 69 187 212 259 272 275 0 1 2 3 4 5 0 100 200 300 400 2019 2020 2021 2022 2023 % thsd. Individual entrepreneurs (left axis) Regular employees (left axis) % of total employment (reg. & entrepreneurs) (right axis) 738 936 953 1,038 1,307 430 514 459 477 535 0 200 400 600 800 1000 1200 1400 2020 2021 2022 2023 2024 USD/month IT sector wages National average +12% +26%
8.
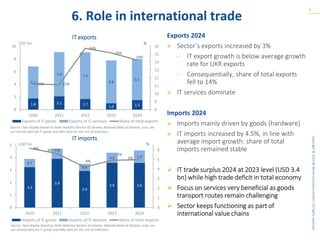
Copyright © 2025 BE Berlin Economics GmbH | All rights reserved. 6. Role in
international trade 8 Exports 2024 » Sector’s exports increased by 3% - IT export growth is below average growth rate for UKR exports - Consequentially, share of total exports fell to 14% » IT services dominate Imports 2024 » Imports mainly driven by goods (hardware) » IT imports increased by 4.5%, in line with average import growth: share of total imports remained stable ➢ IT trade surplus 2024 at 2023 level (USD 3.4 bn) while high trade deficit in total economy ➢ Focus on services very beneficial as goods transport routes remain challenging ➢ Sector keeps functioning as part of international value chains IT exports IT imports Source: Own display based on State Statistics Service of Ukraine, National Bank of Ukraine, note: we use Ukrstat data for IT goods and NBU data for the rest of indicators 1.8 2.1 1.7 1.0 1.5 5.1 7.0 7.4 6.8 6.5 11% 11% 16% 15% 14% 8 9 10 11 12 13 14 15 16 0 2 4 6 8 10 2020 2021 2022 2023 2024 % USD bn Exports of IT goods Exports of IT services Share of total exports 3.2 3.9 2.9 3.6 3.6 0.7 0.8 0.6 0.8 1.0 6% 6% 4% 5% 5% 0 1 2 3 4 5 6 0 1 2 3 4 5 2020 2021 2022 2023 2024 % USD bn Imports of IT goods Imports of IT services Share of total imports . Source: Own display based on State Statistics Service of Ukraine, National Bank of Ukraine, note: we use Ukrstat data for IT goods and NBU data for the rest of indicators
9.
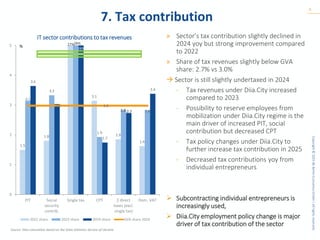
Copyright © 2025 BE Berlin Economics GmbH | All rights reserved. 7. Tax contribution 9 »
Sector’s tax contribution slightly declined in 2024 yoy but strong improvement compared to 2022 » Share of tax revenues slightly below GVA share: 2.7% vs 3.0% → Sector is still slightly undertaxed in 2024 - Tax revenues under Diia.City increased compared to 2023 - Possibility to reserve employees from mobilization under Diia.City regime is the main driver of increased PIT, social contribution but decreased CPT - Tax policy changes under Diia.City to further increase tax contribution in 2025 - Decreased tax contributions yoy from individual entrepreneurs ➢ Subcontracting individual entrepreneurs is increasingly used, ➢ Diia.City employment policy change is major driver of tax contribution of the sector IT sector contributions to tax revenues Source: Own calculation based on the State Statistics Service of Ukraine 1.5 1.8 3.1 1.9 1.6 3.1 3.3 1.9 2.8 2.8 3.6 3.0 1.7 2.7 3.4 3.0 0 1 2 3 4 5 PIT Social security contrib. Single tax CPT Σ direct taxes (excl. single tax) Dom. VAT % 2022 share 2023 share 2024 share GVA share 2024 27%28% 26%
10.
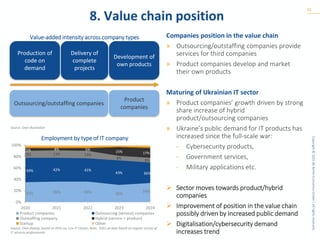
Copyright © 2025 BE Berlin Economics GmbH | All rights reserved. 8. Value chain
position 10 Companies position in the value chain » Outsourcing/outstaffing companies provide services for third companies » Product companies develop and market their own products Maturing of Ukrainian IT sector » Product companies’ growth driven by strong share increase of hybrid product/outsourcing companies » Ukraine’s public demand for IT products has increased since the full-scale war: - Cybersecurity products, - Government services, - Military applications etc. ➢ Sector moves towards product/hybrid companies ➢ Improvement of position in the value chain possibly driven by increased public demand ➢ Digitalisation/cybersecurity demand increases trend Value-added intensity across company types Employment by type of IT company Source: Own illustration Source: Own display, based on DOU.ua, Lviv IT Cluster, Note: DOU.ua data based on regular survey of IT services professionals Production of code on demand Delivery of complete projects Development of own products Outsourcing/outstaffing companies Product companies 35% 36% 36% 30% 34% 43% 42% 41% 43% 36% 12% 13% 13% 8% 8% 5% 4% 5% 15% 17% 2020 2021 2022 2023 2024 0% 20% 40% 60% 80% 100% Product companies Outsourcing (service) companies Outstaffing company Hybrid (service + product) Startup Other
11.
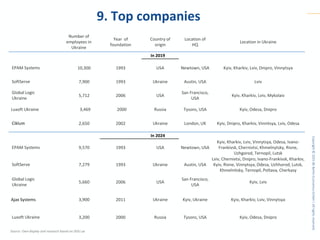
Copyright © 2025 BE Berlin Economics GmbH | All rights reserved. 9. Top companies Source:
Own display and research based on DOU.ua Number of employees in Ukraine Year of foundation Country of origin Location of HQ Location in Ukraine In 2019 EPAM Systems 10,300 1993 USA Newtown, USA Kyiv, Kharkiv, Lviv, Dnipro, Vinnytsya SoftServe 7,900 1993 Ukraine Austin, USA Lviv Global Logic Ukraine 5,712 2006 USA San Francisco, USA Kyiv, Kharkiv, Lviv, Mykolaiv Luxoft Ukraine 3,469 2000 Russia Tysons, USA Kyiv, Odesa, Dnipro Ciklum 2,650 2002 Ukraine London, UK Kyiv, Dnipro, Kharkiv, Vinnitsya, Lviv, Odesa In 2024 EPAM Systems 9,570 1993 USA Newtown, USA Kyiv, Kharkiv, Lviv, Vinnytsya, Odesa, Ivano- Frankivsk, Chernivtsi, Khmelnytsky, Rivne, Uzhgorod, Ternopil, Lutsk SoftServe 7,279 1993 Ukraine Austin, USA Lviv, Chernivtsi, Dnipro, Ivano-Frankivsk, Kharkiv, Kyiv, Rivne, Vinnytsya, Odesa, Uzhhorod, Lutsk, Khmelnitsky, Ternopil, Poltava, Cherkasy Global Logic Ukraine 5,660 2006 USA San Francisco, USA Kyiv, Lviv Ajax Systems 3,900 2011 Ukraine Kyiv, Ukraine Kyiv, Kharkiv, Lviv, Vinnytsya Luxoft Ukraine 3,200 2000 Russia Tysons, USA Kyiv, Odesa, Dnipro
12.
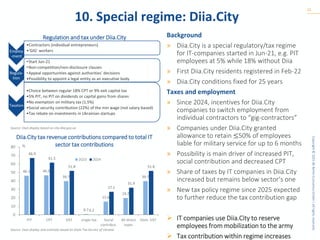
Copyright © 2025 BE Berlin Economics GmbH | All rights reserved. 10. Special regime:
Diia.City 12 Background » Diia.City is a special regulatory/tax regime for IT-companies started in Jun-21, e.g. PIT employees at 5% while 18% without Diia » First Diia.City residents registered in Feb-22 » Diia.City conditions fixed for 25 years Taxes and employment » Since 2024, incentives for Diia.City companies to switch employment from individual contractors to “gig-contractors” » Companies under Diia.City granted allowance to retain ≤50% of employees liable for military service for up to 6 months » Possibility is main driver of increased PIT, social contribution and decreased CPT » Share of taxes by IT companies in Diia.City increased but remains below sector’s one » New tax policy regime since 2025 expected to further reduce the tax contribution gap ➢ IT companies use Diia.City to reserve employees from mobilization to the army ➢ Tax contribution within regime increases Regulation and tax under Diia.City Diia.City tax revenue contributions compared to total IT sector tax contributions Source: Own display based on city.diia.gov.ua Source: Own display and estimate based on State Tax Service of Ukraine Employ -ment •Contractors (individual entrepreneurs) •‘GIG’ workers Regula- tion •Start Jun-21 •Non-competition/non-disclosure clauses •Appeal opportunities against authorities’ decisions •Possibility to appoint a legal entity as an executive body Taxation •Choice between regular 18% CPT or 9% exit capital tax •5% PIT, no PIT on dividends or capital gains from shares •No exemption on military tax (1.5%) •Social security contribution (22%) of the min wage (not salary-based) •Tax rebate on investments in Ukrainian startups 46.1 46.5 39.7 0.7 15.6 19.7 39.7 66.9 61.5 51.8 0.2 27.1 31.9 51.8 0 10 20 30 40 50 60 70 80 PIT CPT VAT single tax Social contribut. All direct taxes Dom. VAT % 2023 2024
13.
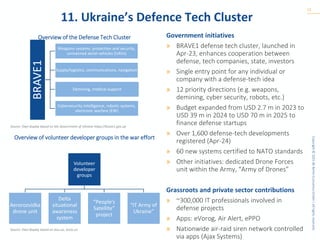
Copyright © 2025 BE Berlin Economics GmbH | All rights reserved. 11. Ukraine’s Defence
Tech Cluster 13 Government initiatives » BRAVE1 defense tech cluster, launched in Apr-23, enhances cooperation between defense, tech companies, state, investors » Single entry point for any individual or company with a defense-tech idea » 12 priority directions (e.g. weapons, demining, cyber security, robots, etc.) » Budget expanded from USD 2.7 m in 2023 to USD 39 m in 2024 to USD 70 m in 2025 to finance defense startups » Over 1,600 defense-tech developments registered (Apr-24) » 60 new systems certified to NATO standards » Other initiatives: dedicated Drone Forces unit within the Army, “Army of Drones” Grassroots and private sector contributions » ~300,000 IT professionals involved in defense projects » Apps: eVorog, Air Alert, ePPO » Nationwide air-raid siren network controlled via apps (Ajax Systems) BRAVE1 Weapons systems, protection and security, unmanned aerial vehicles (UAVs) Supply/logistics, communications, navigation Demining, medical support Cybersecurity intelligence, robotic systems, electronic warfare (EW) Source: Own display based on the Government of Ukraine https://brave1.gov.ua Volunteer developer groups Aerorozvidka drone unit Delta situational awareness system “People’s Satellite” project “IT Army of Ukraine” Overview of the Defense Tech Cluster Overview of volunteer developer groups in the war effort Source: Own display based on dou.ua, texty.ua
14.
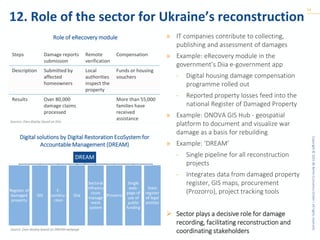
Copyright © 2025 BE Berlin Economics GmbH | All rights reserved. 12. Role of
the sector for Ukraine’s reconstruction 14 » IT companies contribute to collecting, publishing and assessment of damages » Example: eRecovery module in the government’s Diia e-government app - Digital housing damage compensation programme rolled out - Reported property losses feed into the national Register of Damaged Property » Example: ONOVA GIS Hub - geospatial platform to document and visualize war damage as a basis for rebuilding » Example: ‘DREAM’ - Single pipeline for all reconstruction projects - Integrates data from damaged property register, GIS maps, procurement (Prozorro), project tracking tools ➢ Sector plays a decisive role for damage recording, facilitating reconstruction and coordinating stakeholders Steps Damage reports submission Remote verification Compensation Description Submitted by affected homeowners Local authorities inspect the property Funds or housing vouchers Results Over 80,000 damage claims processed More than 55,000 families have received assistance Role of eRecovery module Sources: Own display based on Diia DREAM Register of damaged property GIS E- constru- ction Diia Sectoral Infrastru cture manage ment system Prozorro Single web- page of use of public funding State register of legal entities Digital solutions by Digital Restoration EcoSystem for Accountable Management (DREAM) Source: Own display based on DREAM webpage
15.
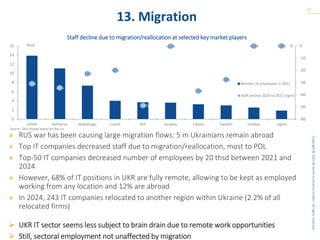
Copyright © 2025 BE Berlin Economics GmbH | All rights reserved. 13. Migration 15 » RUS
war has been causing large migration flows: 5 m Ukrainians remain abroad » Top IT companies decreased staff due to migration/reallocation, most to POL » Top-50 IT companies decreased number of employees by 20 thsd between 2021 and 2024 » However, 68% of IT positions in UKR are fully remote, allowing to be kept as employed working from any location and 12% are abroad » In 2024, 243 IT companies relocated to another region within Ukraine (2.2% of all relocated firms) ➢ UKR IT sector seems less subject to brain drain due to remote work opportunities ➢ Still, sectoral employment not unaffected by migration Staff decline due to migration/reallocation at selected key market players Source: Own display based on dou.ua -31% -34% -23% -20% -49% -0.3% -37% -28% -0.1% 0.0% -60 -50 -40 -30 -20 -10 0 0 2 4 6 8 10 12 14 16 EPAM SoftServe GlobalLogic Luxoft NIX Evoplay Ciklum DataArt Intellias Sigma % thsd Number of employees in 2021 Staff decline 2024 to 2021 (right)
16.
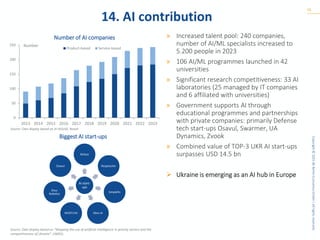
Copyright © 2025 BE Berlin Economics GmbH | All rights reserved. 14. AI contribution 16 »
Increased talent pool: 240 companies, number of AI/ML specialists increased to 5.200 people in 2023 » 106 AI/ML programmes launched in 42 universities » Significant research competitiveness: 33 AI laboratories (25 managed by IT companies and 6 affiliated with universities) » Government supports AI through educational programmes and partnerships with private companies: primarily Defense tech start-ups Osavul, Swarmer, UA Dynamics, Zvook » Combined value of TOP-3 UKR AI start-ups surpasses USD 14.5 bn ➢ Ukraine is emerging as an AI hub in Europe Number of AI companies Source: Own display based on AI HOUSE, Roosh Source: Own display based on ”Mapping the use of artificial intelligence in priority sectors and the competitiveness of Ukraine”, UNIDO, Biggest AI start-ups AI start- ups Reface Respeecher Simplefin Zibra AI MOSTLYAI Deus Robotics Osavul 0 50 100 150 200 250 2013 2014 2015 2016 2017 2018 2019 2020 2021 2022 2023 Number Product-based Service-based
17.
Copyright © 2025 BE Berlin Economics GmbH | All rights reserved. 15. Venture capital 17 »
IT company (focus on B2B) ≠ tech company (focus on B2B and B2C) (DEV Community 2025): Possibilities to develop strong tech companies through deals between pure industry and pure IT companies » 2024: volumes doubled yoy but below pre-war » Strongest growth in defence tech sector » Early-stage investments account for 32% » Foreign VC companies investing in UKR tech sector: Euvic Group, InSoft.Partners ➢ Record volume of deal volume 2021 was not reached since war ➢ However, venture capital deal volume on the rise after sharp drop in 2022 VC deals in IT and tech companies Source: Own display based on AVentures - tech companies which may explain some discepancies in data Source: Own display based on AVentures Biggest deals for tech companies in 2024 Creatio, USD 200m Carmoola, USD 19.2 m Jome, USD 9.8 m IN1, USD 6 m Fintech Farm, USD 5 m 542 571 832 236 209 462 0 100 200 300 400 500 600 700 800 900 2019 2020 2021 2022 2023 2024 USD m
18.
Copyright © 2025 BE Berlin Economics GmbH | All rights reserved. 16. Education of
new IT professionals 18 University education of potential IT workers » STEM graduates focus shift from engineering subjects to ICT - Share of ICT graduates now twice share in POL but natural sciences still behind peers Quality of school education » Education in STEM subjects in Ukraine has generally a good reputation » Yet, Ukraine scores relatively low on standardised PISA test of 15-year-olds » In 2022, scores for Math and Science further decreased (441 and 450 vs. 453 and 469 in 2018) due to Covid-19 and war ➢ Strong growth of ICT graduation ➢ Education in STEM subjects should be further promoted and improved ➢ Lack of skilled workers is a key constraint to IT sector growth in Ukraine and elsewhere STEM subjects among tertiary education graduates PISA scores in fields relevant for IT Source: Own display based on Unesco, Note: 2022 data Source: Own display based on the OECD report “PISA 2022 Results“ 3.8 2.6 3.3 6.1 7.9 4.7 8.5 4.3 9.6 5.5 16.8 12.0 11.9 11.9 22.5 0 10 20 30 40 Ukraine 2018 Ukraine 2022 Poland Estonia Germany % Engineering, manufacturing and construction ICT Natural sciences, mathematics and statistics 453 441 475 489 510 469 450 492 499 526 400 420 440 460 480 500 520 540 Ukraine 2018 Ukraine 2022 Germany Poland Estonia Mathematics Science
19.
Copyright © 2025 BE Berlin Economics GmbH | All rights reserved. 17. German-Ukrainian ties
in the sector 19 Trade » In 2024, bilateral trade (goods) reaches record level of USD 12 bn, further expanding after already record level in 2023 - GER: trade surplus of USD 4.7 bn in 2024 » IT sector (service, goods): trade volume stagnates: UKR trade surplus of USD 0.3 bn » GER is No.7 destination country of UKR computer service exports (4%) - Cybersecurity software solutions, AI - Intellias, GlobalLogic working with GER automakers on infotainment, mapping, autonomous driving software Investment » UKR-founded companies (Grammarly, N-iX, SoftServe, ELEKS, Sigma Software) established operations in GER » GER ICT FDI stock in UKR grew to USD 22 m » GER became a key destination for relocated IT talent due to war ➢ In the sector, strong trade surplus by UKR while sectoral bilateral trade stagnates ➢ Investment ties on the rise Bilateral trade in IT Source: Own display based on Eurostat, National Bank of Ukraine Source: Own display based on National Bank of Ukraine 0.7 0.8 0.8 0.8 0.7 0.3 0.4 0.3 0.4 0.4 0 0.1 0.2 0.3 0.4 0.5 0.6 0.7 0.8 0.9 2020 2021 2022 2023 2024 USD bn Exports from Ukraine Imports to Ukraine 3.0 2.6 16.3 17.3 21.9 0 5 10 15 20 25 2019 2020 2021 2022 2023 USD m German FDI stock in Ukraine’s ICT sector
20.
Copyright © 2025 BE Berlin Economics GmbH | All rights reserved. About the German
Economic Team Financed by the Federal Ministry for Economic Affairs and Climate Action, the German Economic Team (GET) advises the governments of Ukraine, Belarus*, Moldova, Kosovo, Armenia, Georgia* and Uzbekistan on economic policy matters. Berlin Economics has been commissioned with the implementation of the consultancy. *Within the framework of project activities in Georgia, we are in contact solely with reform- oriented partners for the time being; in Belarus advisory activities are suspended. 20 CONTACT Garry Poluschkin Project Manager Ukraine poluschkin@berlin-economics.com German Economic Team c/o BE Berlin Economics GmbH Schillerstraße 59 | 10627 Berlin Tel: +49 30 / 20 61 34 64 0 info@german-economic-team.com www.german-economic-team.com Our publications are available under https://www.german-economic-team.com/ukraine
Download