CEN 341: GEOTEHCNICALENGINEERING-I
DEPARTMENT OF CIVIL ENGINEERING
PORT CITY INTERNATIONAL UNIVERSITY
CHITTAGONG, BANGLADESH
LECTURE 4
Index Properties of Soil
2.
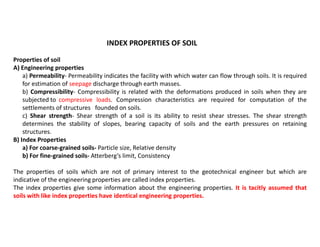
INDEX PROPERTIES OFSOIL
Properties of soil
A) Engineering properties
a) Permeability- Permeability indicates the facility with which water can flow through soils. It is required
for estimation of seepage discharge through earth masses.
b) Compressibility- Compressibility is related with the deformations produced in soils when they are
subjected to compressive loads. Compression characteristics are required for computation of the
settlements of structures founded on soils.
c) Shear strength- Shear strength of a soil is its ability to resist shear stresses. The shear strength
determines the stability of slopes, bearing capacity of soils and the earth pressures on retaining
structures.
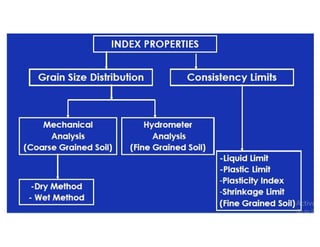
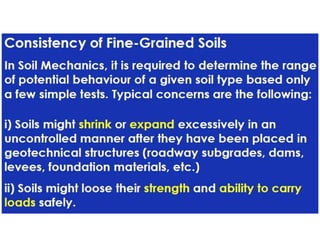
B) Index Properties
a) For coarse-grained soils- Particle size, Relative density
b) For fine-grained soils- Atterberg’s limit, Consistency
The properties of soils which are not of primary interest to the geotechnical engineer but which are
indicative of the engineering properties are called index properties.
The index properties give some information about the engineering properties. It is tacitly assumed that
soils with like index properties have identical engineering properties.
4.
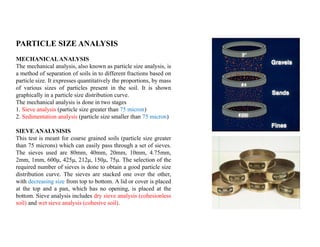
PARTICLE SIZE ANALYSIS
MECHANICALANALYSIS
Themechanical analysis, also known as particle size analysis, is
a method of separation of soils in to different fractions based on
particle size. It expresses quantitatively the proportions, by mass
of various sizes of particles present in the soil. It is shown
graphically in a particle size distribution curve.
The mechanical analysis is done in two stages
1. Sieve analysis (particle size greater than 75 micron)
2. Sedimentation analysis (particle size smaller than 75 micron)
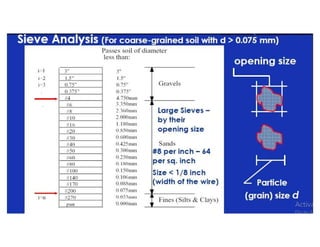
SIEVE ANALYSISIS
This test is meant for coarse grained soils (particle size greater
than 75 microns) which can easily pass through a set of sieves.
The sieves used are 80mm, 40mm, 20mm, 10mm, 4.75mm,
2mm, 1mm, 600μ, 425μ, 212μ, 150μ, 75μ. The selection of the
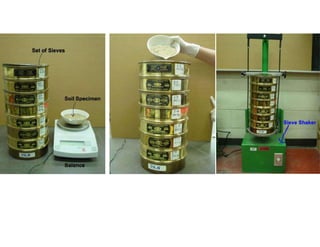
required number of sieves is done to obtain a good particle size
distribution curve. The sieves are stacked one over the other,
with decreasing size from top to bottom. A lid or cover is placed
at the top and a pan, which has no opening, is placed at the
bottom. Sieve analysis includes dry sieve analysis (cohesionless
soil) and wet sieve analysis (cohesive soil).
8.
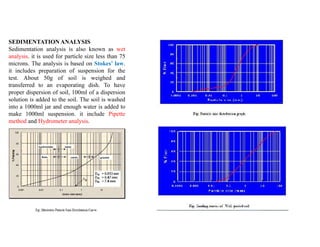
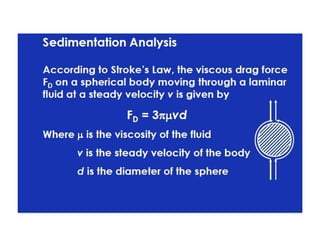
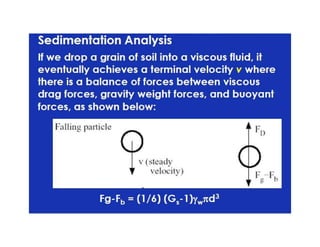
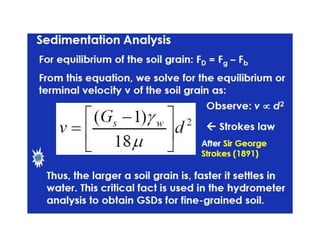
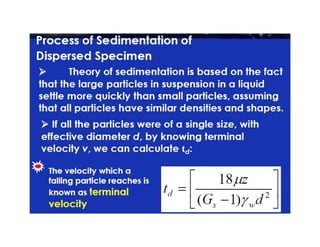
SEDIMENTATION ANALYSIS
Sedimentation analysisis also known as wet
analysis. it is used for particle size less than 75
microns. The analysis is based on Stokes’ law.
it includes preparation of suspension for the
test. About 50g of soil is weighed and
transferred to an evaporating dish. To have
proper dispersion of soil, 100ml of a dispersion
solution is added to the soil. The soil is washed
into a 1000ml jar and enough water is added to
make 1000ml suspension. it include Pipette
method and Hydrometer analysis.
11.
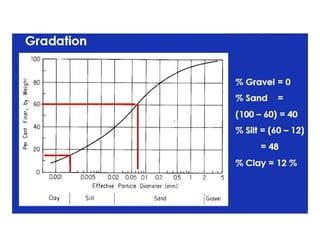
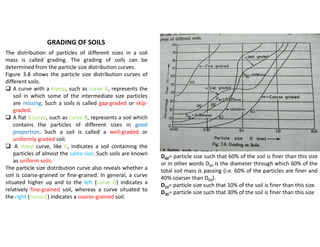
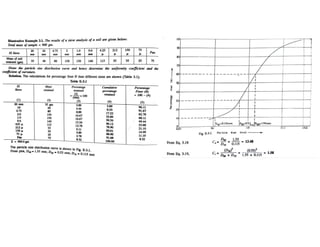
GRADING OF SOILS
Thedistribution of particles of different sizes in a soil
mass is called grading. The grading of soils can be
determined from the particle size distribution curves.
Figure 3.8 shows the particle size distribution curves of
different soils.
A curve with a hump, such as curve A, represents the
soil in which some of the intermediate size particles
are missing. Such a soils is called gap-graded or skip-
graded.
A flat S-curve, such as curve B, represents a soil which
contains the particles of different sizes in good
proportion. Such a soil is called a well-graded or
uniformly graded soil.
A steep curve, like C, indicates a soil containing the
particles of almost the same size. Such soils are known
as uniform soils.
The particle size distribution curve also reveals whether a
soil is coarse-grained or fine-grained. In general, a curve
situated higher up and to the left (curve D) indicates a
relatively fine-grained soil, whereas a curve situated to
the right (curve E) indicates a coarse-grained soil.
D60= particle size such that 60% of the soil is finer than this size
or in other words D60 is the diameter through which 60% of the
total soil mass is passing (i.e. 60% of the particles are finer and
40% coarser than D60).
D10= particle size such that 10% of the soil is finer than this size.
D30= particle size such that 30% of the soil is finer than this size
12.
The grain-size distributioncan be used to determine
some of the basic soil parameters such as the effective
size, the uniformity coefficient and the coefficient of
gradation.
a) The effective size of a soil is the diameter through
which 10% of the total soil mass is passing and is
referred to as D10.
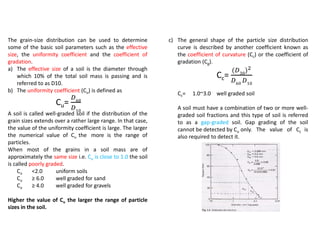
b) The uniformity coefficient (Cu) is defined as
Cu=
A soil is called well-graded soil if the distribution of the
grain sizes extends over a rather large range. In that case,
the value of the uniformity coefficient is large. The larger
the numerical value of Cu the more is the range of
particles.
When most of the grains in a soil mass are of
approximately the same size i.e. Cu is close to 1.0 the soil
is called poorly graded.
Cu <2.0 uniform soils
Cu ≥ 6.0 well graded for sand
Cu ≥ 4.0 well graded for gravels
Higher the value of Cu the larger the range of particle
sizes in the soil.
c) The general shape of the particle size distribution
curve is described by another coefficient known as
the coefficient of curvature (Cc) or the coefficient of
gradation (Cg).
Cc=
( )
Cc= 1.0~3.0 well graded soil
A soil must have a combination of two or more well-
graded soil fractions and this type of soil is referred
to as a gap-graded soil. Gap grading of the soil
cannot be detected by Cu only. The value of Cc is
also required to detect it.
21.
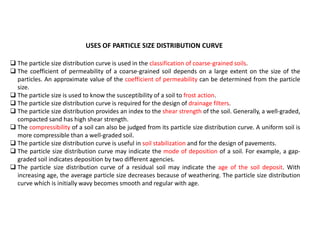
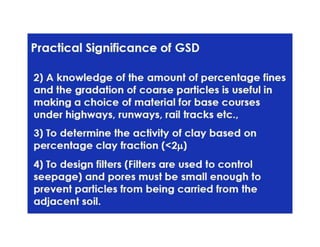
USES OF PARTICLESIZE DISTRIBUTION CURVE
The particle size distribution curve is used in the classification of coarse-grained soils.
The coefficient of permeability of a coarse-grained soil depends on a large extent on the size of the
particles. An approximate value of the coefficient of permeability can be determined from the particle
size.
The particle size is used to know the susceptibility of a soil to frost action.
The particle size distribution curve is required for the design of drainage filters.
The particle size distribution provides an index to the shear strength of the soil. Generally, a well-graded,
compacted sand has high shear strength.
The compressibility of a soil can also be judged from its particle size distribution curve. A uniform soil is
more compressible than a well-graded soil.
The particle size distribution curve is useful in soil stabilization and for the design of pavements.
The particle size distribution curve may indicate the mode of deposition of a soil. For example, a gap-
graded soil indicates deposition by two different agencies.
The particle size distribution curve of a residual soil may indicate the age of the soil deposit. With
increasing age, the average particle size decreases because of weathering. The particle size distribution
curve which is initially wavy becomes smooth and regular with age.
25.
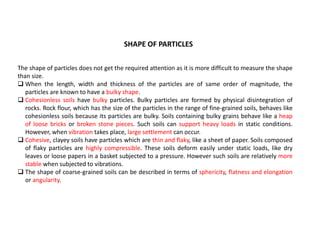
SHAPE OF PARTICLES
Theshape of particles does not get the required attention as it is more difficult to measure the shape
than size.
When the length, width and thickness of the particles are of same order of magnitude, the
particles are known to have a bulky shape.
Cohesionless soils have bulky particles. Bulky particles are formed by physical disintegration of
rocks. Rock flour, which has the size of the particles in the range of fine-grained soils, behaves like
cohesionless soils because its particles are bulky. Soils containing bulky grains behave like a heap
of loose bricks or broken stone pieces. Such soils can support heavy loads in static conditions.
However, when vibration takes place, large settlement can occur.
Cohesive, clayey soils have particles which are thin and flaky, like a sheet of paper. Soils composed
of flaky particles are highly compressible. These soils deform easily under static loads, like dry
leaves or loose papers in a basket subjected to a pressure. However such soils are relatively more
stable when subjected to vibrations.
The shape of coarse-grained soils can be described in terms of sphericity, flatness and elongation
or angularity.
26.
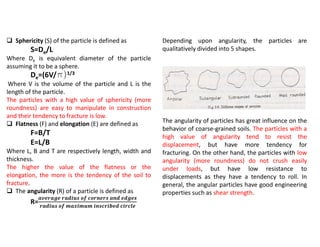
Sphericity (S)of the particle is defined as
S=De/L
Where De is equivalent diameter of the particle
assuming it to be a sphere.
De=(6V/p)1/3
Where V is the volume of the particle and L is the
length of the particle.
The particles with a high value of sphericity (more
roundness) are easy to manipulate in construction
and their tendency to fracture is low.
Flatness (F) and elongation (E) are defined as
F=B/T
E=L/B
Where L, B and T are respectively length, width and
thickness.
The higher the value of the flatness or the
elongation, the more is the tendency of the soil to
fracture.
The angularity (R) of a particle is defined as
R=
𝒂𝒗𝒆𝒓𝒂𝒈𝒆 𝒓𝒂𝒅𝒊𝒖𝒔 𝒐𝒇 𝒄𝒐𝒓𝒏𝒆𝒓𝒔 𝒂𝒏𝒅 𝒆𝒅𝒈𝒆𝒔
𝒓𝒂𝒅𝒊𝒖𝒔 𝒐𝒇 𝒎𝒂𝒙𝒊𝒎𝒖𝒎 𝒊𝒏𝒔𝒄𝒓𝒊𝒃𝒆𝒅 𝒄𝒊𝒓𝒄𝒍𝒆
Depending upon angularity, the particles are
qualitatively divided into 5 shapes.
The angularity of particles has great influence on the
behavior of coarse-grained soils. The particles with a
high value of angularity tend to resist the
displacement, but have more tendency for
fracturing. On the other hand, the particles with low
angularity (more roundness) do not crush easily
under loads, but have low resistance to
displacements as they have a tendency to roll. In
general, the angular particles have good engineering
properties such as shear strength.
27.
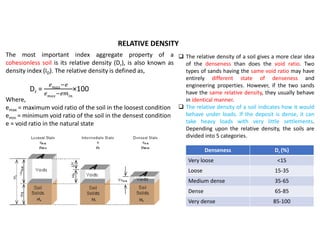
RELATIVE DENSITY
The mostimportant index aggregate property of a
cohesionless soil is its relative density (Dr), is also known as
density index (ID). The relative density is defined as,
Dr = ×100
Where,
emax = maximum void ratio of the soil in the loosest condition
emin = minimum void ratio of the soil in the densest condition
e = void ratio in the natural state
The relative density of a soil gives a more clear idea
of the denseness than does the void ratio. Two
types of sands having the same void ratio may have
entirely different state of denseness and
engineering properties. However, if the two sands
have the same relative density, they usually behave
in identical manner.
The relative density of a soil indicates how it would
behave under loads. If the deposit is dense, it can
take heavy loads with very little settlements.
Depending upon the relative density, the soils are
divided into 5 categories.
Denseness Dr (%)
Very loose <15
Loose 15-35
Medium dense 35-65
Dense 65-85
Very dense 85-100
29.
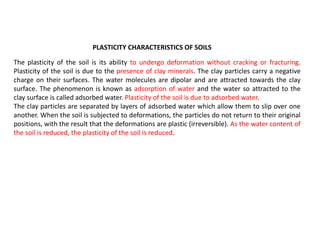
PLASTICITY CHARACTERISTICS OFSOILS
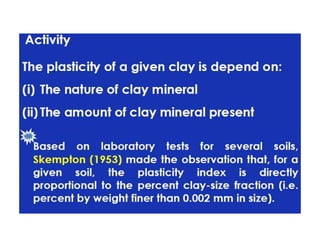
The plasticity of the soil is its ability to undergo deformation without cracking or fracturing.
Plasticity of the soil is due to the presence of clay minerals. The clay particles carry a negative
charge on their surfaces. The water molecules are dipolar and are attracted towards the clay
surface. The phenomenon is known as adsorption of water and the water so attracted to the
clay surface is called adsorbed water. Plasticity of the soil is due to adsorbed water.
The clay particles are separated by layers of adsorbed water which allow them to slip over one
another. When the soil is subjected to deformations, the particles do not return to their original
positions, with the result that the deformations are plastic (irreversible). As the water content of
the soil is reduced, the plasticity of the soil is reduced.
34.
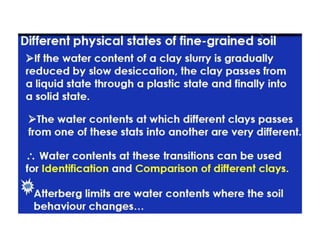
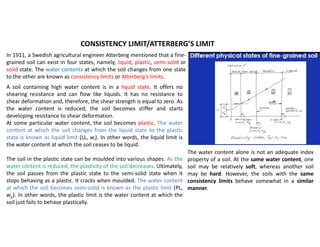
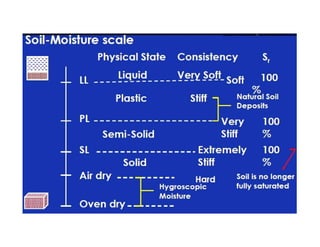
In 1911, aSwedish agricultural engineer Atterberg mentioned that a fine-
grained soil can exist in four states, namely, liquid, plastic, semi-solid or
solid state. The water contents at which the soil changes from one state
to the other are known as consistency limits or Atterberg’s limits.
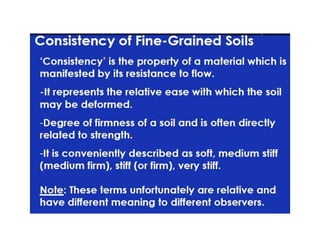
CONSISTENCY LIMIT/ATTERBERG’S LIMIT
The water content alone is not an adequate index
property of a soil. At the same water content, one
soil may be relatively soft, whereas another soil
may be hard. However, the soils with the same
consistency limits behave somewhat in a similar
manner.
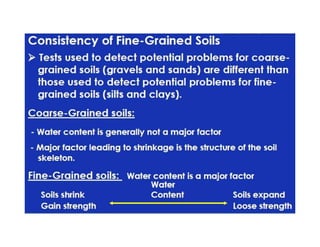
A soil containing high water content is in a liquid state. It offers no
shearing resistance and can flow like liquids. It has no resistance to
shear deformation and, therefore, the shear strength is equal to zero. As
the water content is reduced, the soil becomes stiffer and starts
developing resistance to shear deformation.
At some particular water content, the soil becomes plastic. The water
content at which the soil changes from the liquid state to the plastic
state is known as liquid limit (LL, wl). In other words, the liquid limit is
the water content at which the soil ceases to be liquid.
The soil in the plastic state can be moulded into various shapes. As the
water content is reduced, the plasticity of the soil decreases. Ultimately,
the soil passes from the plastic state to the semi-solid state when it
stops behaving as a plastic. It cracks when moulded. The water content
at which the soil becomes semi-solid is known as the plastic limit (PL,
wp). In other words, the plastic limit is the water content at which the
soil just fails to behave plastically.
35.
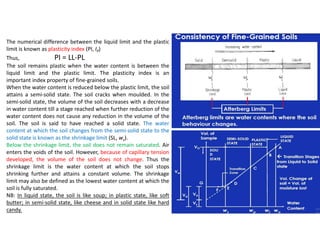
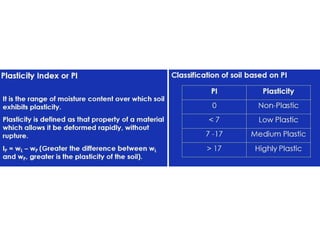
The numerical differencebetween the liquid limit and the plastic
limit is known as plasticity index (PI, IP)
Thus, PI = LL-PL
The soil remains plastic when the water content is between the
liquid limit and the plastic limit. The plasticity index is an
important index property of fine-grained soils.
When the water content is reduced below the plastic limit, the soil
attains a semi-solid state. The soil cracks when moulded. In the
semi-solid state, the volume of the soil decreases with a decrease
in water content till a stage reached when further reduction of the
water content does not cause any reduction in the volume of the
soil. The soil is said to have reached a solid state. The water
content at which the soil changes from the semi-solid state to the
solid state is known as the shrinkage limit (SL, ws).
Below the shrinkage limit, the soil does not remain saturated. Air
enters the voids of the soil. However, because of capillary tension
developed, the volume of the soil does not change. Thus the
shrinkage limit is the water content at which the soil stops
shrinking further and attains a constant volume. The shrinkage
limit may also be defined as the lowest water content at which the
soil is fully saturated.
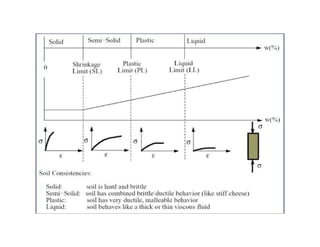
NB: In liquid state, the soil is like soup; in plastic state, like soft
butter; in semi-solid state, like cheese and in solid state like hard
candy.
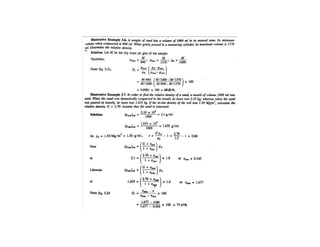
40.
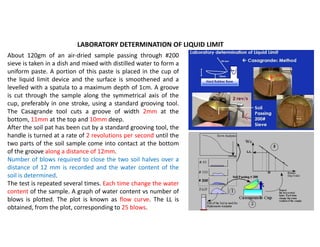
LABORATORY DETERMINATION OFLIQUID LIMIT
About 120gm of an air-dried sample passing through #200
sieve is taken in a dish and mixed with distilled water to form a
uniform paste. A portion of this paste is placed in the cup of
the liquid limit device and the surface is smoothened and a
levelled with a spatula to a maximum depth of 1cm. A groove
is cut through the sample along the symmetrical axis of the
cup, preferably in one stroke, using a standard grooving tool.
The Casagrande tool cuts a groove of width 2mm at the
bottom, 11mm at the top and 10mm deep.
After the soil pat has been cut by a standard grooving tool, the
handle is turned at a rate of 2 revolutions per second until the
two parts of the soil sample come into contact at the bottom
of the groove along a distance of 12mm.
Number of blows required to close the two soil halves over a
distance of 12 mm is recorded and the water content of the
soil is determined.
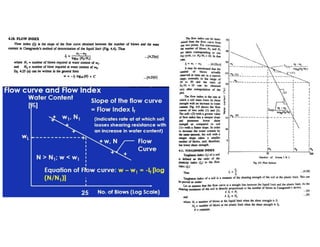
The test is repeated several times. Each time change the water
content of the sample. A graph of water content vs number of
blows is plotted. The plot is known as flow curve. The LL is
obtained, from the plot, corresponding to 25 blows.
41.
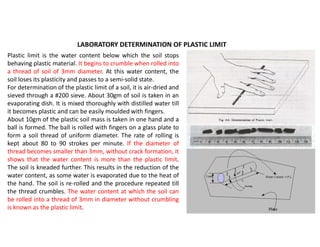
LABORATORY DETERMINATION OFPLASTIC LIMIT
Plastic limit is the water content below which the soil stops
behaving plastic material. It begins to crumble when rolled into
a thread of soil of 3mm diameter. At this water content, the
soil loses its plasticity and passes to a semi-solid state.
For determination of the plastic limit of a soil, it is air-dried and
sieved through a #200 sieve. About 30gm of soil is taken in an
evaporating dish. It is mixed thoroughly with distilled water till
it becomes plastic and can be easily moulded with fingers.
About 10gm of the plastic soil mass is taken in one hand and a
ball is formed. The ball is rolled with fingers on a glass plate to
form a soil thread of uniform diameter. The rate of rolling is
kept about 80 to 90 strokes per minute. If the diameter of
thread becomes smaller than 3mm, without crack formation, it
shows that the water content is more than the plastic limit.
The soil is kneaded further. This results in the reduction of the
water content, as some water is evaporated due to the heat of
the hand. The soil is re-rolled and the procedure repeated till
the thread crumbles. The water content at which the soil can
be rolled into a thread of 3mm in diameter without crumbling
is known as the plastic limit.
43.
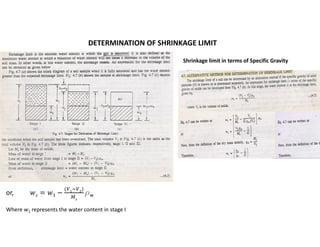
DETERMINATION OF SHRINKAGELIMIT
or, 𝑠 1
( )
rw
Where w1 represents the water content in stage I
Shrinkage limit in terms of Specific Gravity
44.
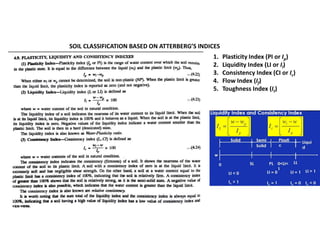
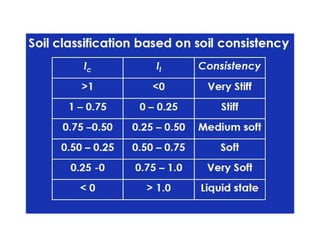
SOIL CLASSIFICATION BASEDON ATTERBERG’S INDICES
1. Plasticity Index (PI or Ip)
2. Liquidity Index (LI or Il)
3. Consistency Index (CI or Ic)
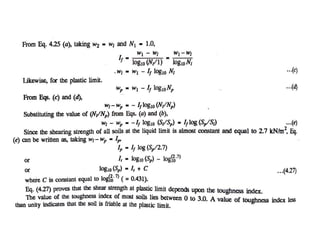
4. Flow Index (If)
5. Toughness Index (It)