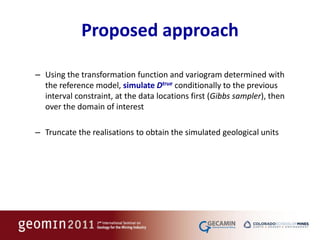
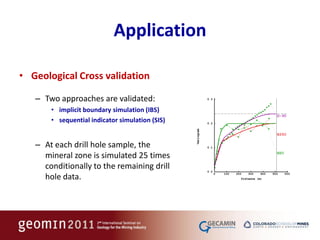
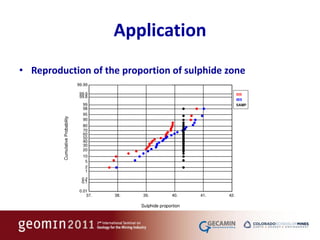
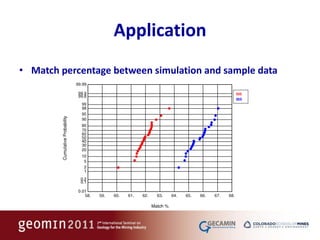
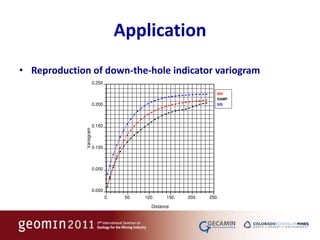
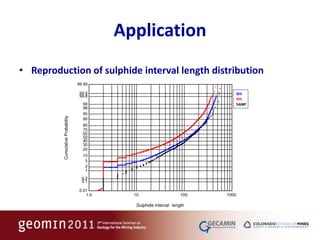
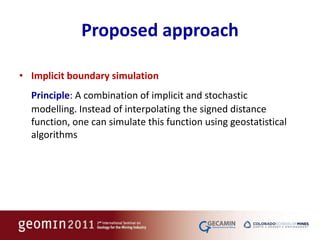
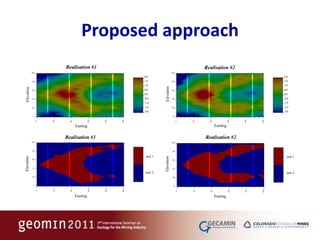
This document proposes a new approach called implicit boundary simulation (IBS) for stochastic geological modelling that combines implicit and stochastic modelling. IBS simulates the distance function to geological boundaries using geostatistical algorithms rather than interpolating distances. The approach is applied to a deposit, showing IBS better reproduces indicator variograms and interval lengths compared to sequential indicator simulation. IBS provides distances to boundaries, conveying information about mineral zone configuration unlike other methods.

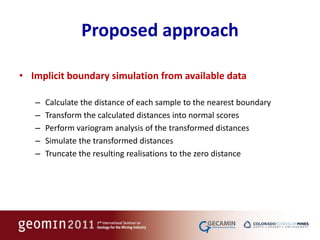
![Proposed approach
• Implicit boundary simulation using a reference model
– In the reference model, calculate the distance Dtrue of each node to
the nearest boubdary. Transform the calculated distances into
normal scores and perform variogram analysis of the transformed
distances
– In the sample data base, calculate the distance Dsample of each
sample to the nearest boundary. The true distance to the boundary
(Dtrue) belongs to the interval [0,Dsample]](https://image.slidesharecdn.com/distancesimulattioncaceres-110923175603-phpapp02/85/Geological-simulation-using-implicit-approach-11-320.jpg)