Download to read offline


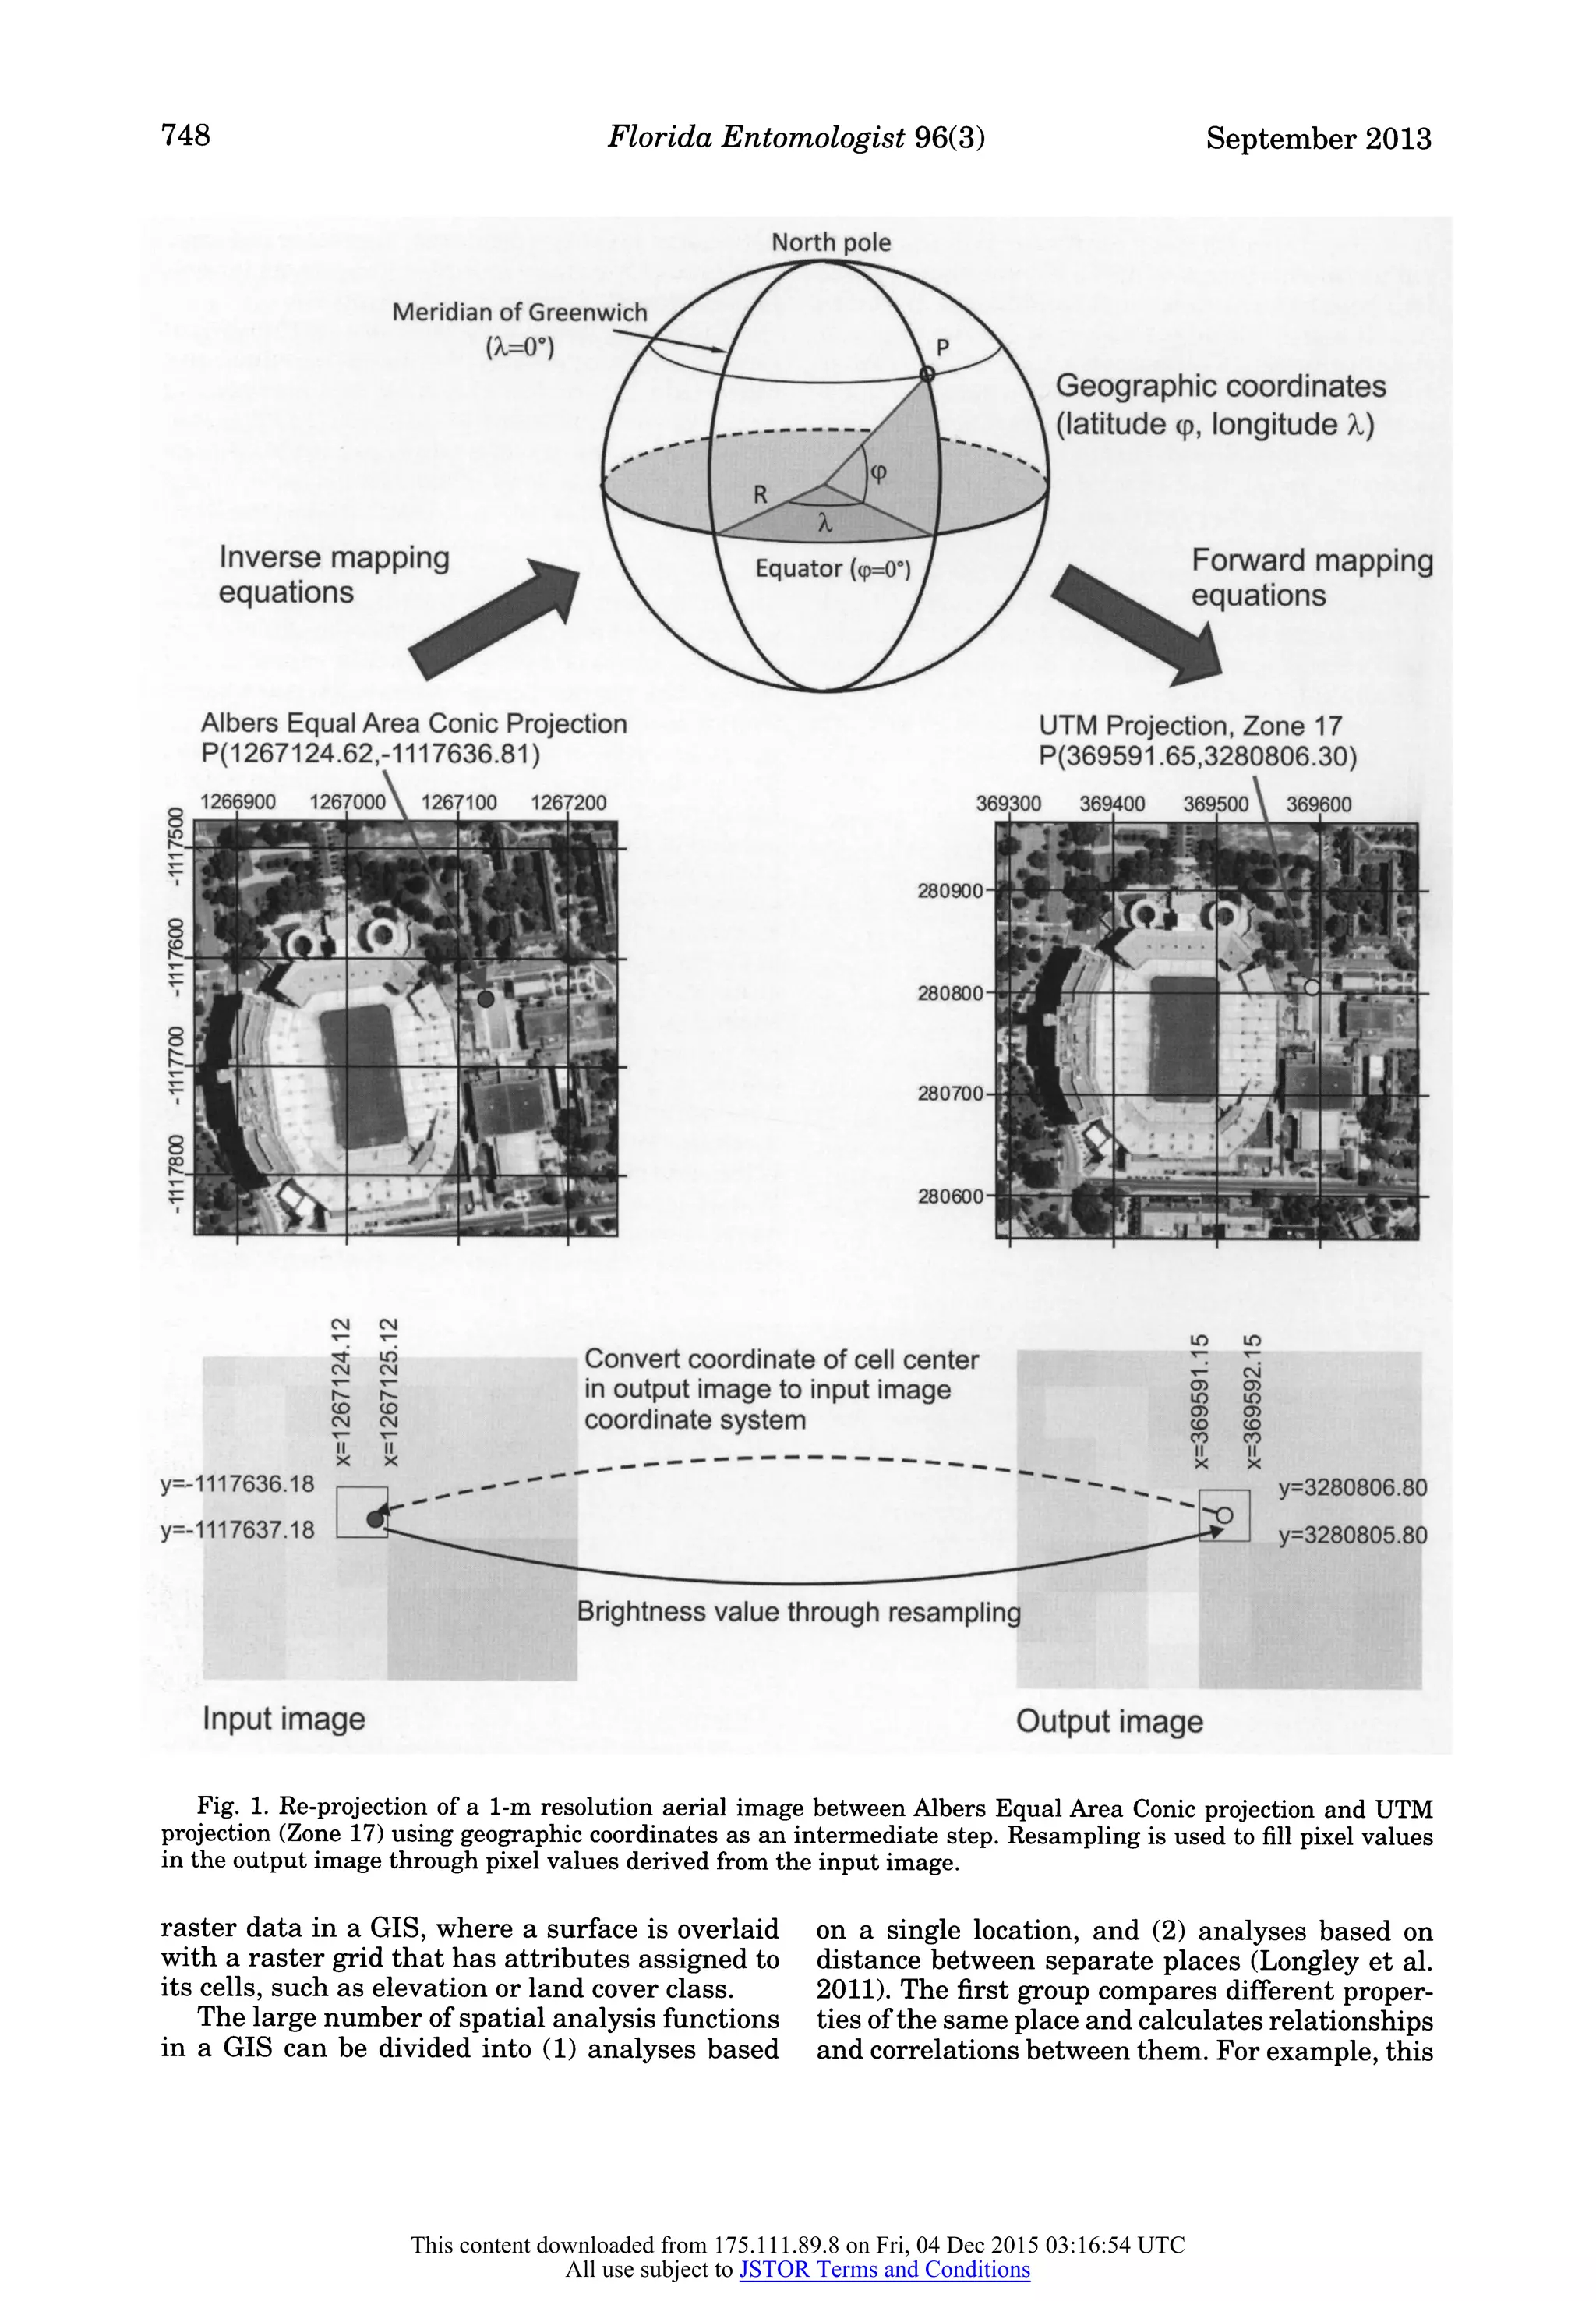


![754 Florida Entomologist 96(3) September 2013
B
ro<3-mvor-*.ooCT>o«-»<N
8©QQ0©0*h*h«-iooooooooo
(N«NrNfMrM(NfN(N(N(N
A Sampled termites (2003)
O Sampled termites (2012)
o Sampled termites (2004-2011)
Probability of Infestation — — — •DIST=100
Year
-Baseline
>o% | >=50% 100%
DIST=300
Fig. 4. A) Model evaluation comparing predicted infested areas for 2012 with 2012 sampled termite locations;
B) Model sensitivity to the mean flight distance parameter in meters (Tonini 2013).
it is crucial to calibrate model parameters if the
spread of other species is modeled, and that the
current model does not take into account anthro
pogenic dispersal.
Summary
A Geographic Information System (GIS) is a
useful tool in various stages of analyzing the in
festation and spread of invasive termites. The 2
examples herein illustrate how mapping and spa
tial analysis operations in the GIS, including map
projection, on-screen digitizing, spatial join, and
overlay functions, facilitate analysis in concert
with external statistical software packages. Due to
continued advances in spatial analysis, improved
customization capabilities of GIS functions, and
steadily increasing computer processing power,
the role of GIS for spatial analysis of invasive pests
is likely to increase further in the near future.
References Cited
Bonabeau, E., Dorigo, M., and Theraulaz, G. 2000.
Inspiration for optimization from social insect be
haviour. Nature 406: 39-42.
de Smith, M. J., Goodchild, M. F., and Longley, P.
A. 2010. Geospatial Analysis (3rd ed.), Matador,
Leicester.
Ermentrout, G. B., and Edelstein-Keshet, L. 1993.
Cellular automata approaches to biological model
ing. J. Theor. Biol. 160: 97-133.
EVANS, T. A. 2011. Invasive termites, pp. 519-562 In D.
E. Bignell, Y. Roisin, Y. and N. Lo [eds.], Biology of
termites: A modern synthesis. Springer SBM, Dor
drecht, The Netherlands.
GAY, F. J. 1967. A world review of introduced species of
termites. Bull. 286. CSIRO, Melbourne.
Hochmair, H. H., AND Scheffrahn, R. H. 2010. Spatial
association of marine dockage with land-borne infes
tations of invasive termites (Isoptera: Rhinotermiti
dae: Coptotermes) in urban south Florida. J. Econ.
Entomol. 103: 1338-1346.
Holmes, E. E., Lewis, M. A., Banks, J. E., and Veit,
R. R. 1994. Partial differential equations in ecology:
spatial interactions and population dynamics. Ecol
ogy 75: 17-29.
JENSEN, J. R. 2005. Introductory Digital Image Process
ing. Pearson Prentice Hall, Upper Saddle River, NJ.
JUDSON, O. P. 1994. The rise of the individual-based
modelling in ecology. Trends Ecol. Evol. 9: 9-14.
LONGLEY, P. A., GOODCHILD, M., MäGUIRE, D. J., AND
Rhind, D. W. 2011. Geographic Information Systems
and Science (3rd ed.), John Wiley & Sons, Hoboken,
NJ.
Mladenoff, D. J. 2004. LANDIS and forest landscape
models. Ecol. Modelling, 180: 7-19.
R Development Core Team 2012. A language and en
vironment for statistical computing, R Foundation
for Statistical Computing, Vienna, Austria.
Scheffrahn, R. H., Cabrera, B. J., Kern Jr., W. H.,
AND Su, N.-Y. 2002. Nasutitermes costalis (Isoptera:
Termitidae) in Florida: first record of a non-endemic
establishment by a higher termite. Florida Entomol.
85: 273-275.
Scheffrahn, R. H., Krecek, J., Ripa, R., and Luppich
INI, P. 2009. Endemic origin and vast anthropogenic
This content downloaded from 175.111.89.8 on Fri, 04 Dec 2015 03:16:54 UTC
All use subject to JSTOR Terms and Conditions](https://image.slidesharecdn.com/geographik6-160326025449/75/Geographik6-10-2048.jpg)


This document discusses how geographic information systems (GIS) can be used to analyze the spread of invasive termite species in urban South Florida. Specifically, it provides two case studies: (1) A GIS spatial analysis showed that the Formosan subterranean termite and Asian subterranean termite were introduced through boat traffic. (2) An agent-based model within a GIS was used to simulate the natural dispersal of an arboreal invasive termite species in Dania Beach, Florida. The document provides an overview of GIS functionality for spatial analysis, modeling, and simulation that can help answer research questions about how invasive species invade and spread in new environments.


![AMC Reference[3] copy](https://cdn.slidesharecdn.com/ss_thumbnails/a84bb3e5-d778-4bd1-991d-6c37fe9d8f58-160125054453-thumbnail.jpg?width=640&height=640&fit=bounds)