
Recommended
More Related Content
What's hot
What's hot (20)
Viewers also liked
Viewers also liked (20)
Similar to Geo 110 Volcanoes
Similar to Geo 110 Volcanoes (20)
More from windyridge
Recently uploaded
Recently uploaded (20)
Geo 110 Volcanoes
- 1. Volcanoes
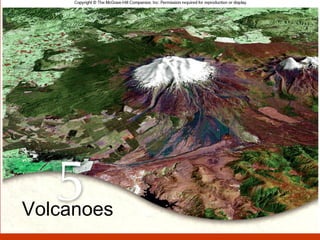
- 2. Figure 5.4 Volcanoes of the World
- 4. Figure 5.2 Relationships of volcanic activity to plate tectonics.
- 6. Figure 5.3 Common volcanic rock types (bottom labels) and their plutonic equivalents (top). The rock names reflect varying proportions of silica, iron, and magnesium, and thus of common silicate minerals. Rhyolite is the fine-grained, volcanic compositional equivalent of granite, and so on.
- 11. Figure 5.5 Selected prominent hot spots around the world. Some coincide with plate boundaries; most do not.
- 12. Figure 5.6 Schematic diagram of a fissure eruption. (At a spreading ridge, the magma has generally solidified before it can spread very far sideways at the surface, quenched by cold seawater.
- 14. Figures 5.7 a and b Flood basalts (A) A real extent of Columbia River flood basalts. (B) Multiple lava flows, one atop another, can be seen in an outcrop of these flows in Washington state.
- 16. Figures 5.8 Shield volcanoes and their characteristics (A) Schematic diagram of a shield volcano in cross section. (B) Very thin lava flows, like these of Kilauea in Hawaii, are characteristic of shield volcanoes. (C) Fluidity of Hawaiian lavas is evident even after they have solidified. This ropy-textured surface is termed pahoehoe (pronounded “pa-hoy-hoy).
- 17. Figures 5.9 Mauna Loa, an example of a shield volcano. (A) View from low altitudes, Note the gently sloping shape summit caldera has been enlarged by collapse. The peak of Mauna Kea rises at rear of photograph. (B) Bird’s-eye view of Hawaii, taken by Landsat satellite, shows its volcanic character more clearly. The large peak with abundant relatively fresh, dark lava flows surrounding it is Mauna Loa; the smaller one, above it, is Mauna Kea.
- 18. Figure 5.10 Volcanic dome formation. (A) Schematic of volcanic dome formation. (B) Novarupta dome, Katmai National Park, Alaska.
- 20. Figures 5.12 Paricutin (Mexico), a classic cinder cone. (A) Night view shows formation by accumulation of pyroclastics flung out of the vent. (B) Shape of the structure revealed by day is typical symmetric form of cinder cones.
- 21. Figures 5. 11 Include types of pyroclastics (which sometimes are produced even by the placid shield volcanoes). Bombs are molten, or at least hot enough to be plastic, when erupted, and may assume a streamlined shape in the air.. (A) Volcanic ash from Mount St. Helens (B) Bombs from Mauna Kea (C) Blocks from Kilauea (D) is volcanic breccia (at Mt. Lassen) formed of welded hot pyroclastics
- 23. Figures 5.13 (A) Schematic cross section of a stratovolcano (composite volcano), formed of alternating layers of lava and pyroclastics. (B) Two composite volcanoes of the Cascade Range: Mount St. Helens (foreground) and Mt. Rainier (rear); photograph predates 1980 explosion of Mount St. Helens.
- 25. Figure 5.14 Formation of “lava trees” near Kilauea illustrates the effect of quenching lava. As hot lava hits cooler trees – and moisture in trees evaporates, absorbing more heat – lava is quenched and hardened. Main mass of fluid lava flows on, leaving the lava trees.
- 26. Figures 5.15 Impact of lava flows on Heimaey, Iceland. (A) May showing extent of lava filling the harbor of Heimaey after 1973 eruption. (B) Lava flow control efforts on Heimaey.
- 27. Figure 5.16 Aftermath of Mount St. Helens eruption, 18 May, 1980
- 28. Figure 5.17 Volume of pyroclastics ejected during major explosive eruptions. (numbers of casualties, where available, are given in parentheses).
- 29. Figure 5.18 The combination of large volumes of ash and heavy typhoon rains at Mount Pinatubo in 1991 proved too much weight for many buildings to bear, In fact, roof collapse was responsible for most of the casualties.
- 30. Figure 5.19 Town of Amero was destroyed by lahars from Nevado del Ruiz in November 1985; more than 23,000 people died.
- 31. Figure 5.22 St. Pierre, Martinique, West Indies, was destroyed by a nuee ardente ( pyroclastic flow ) from Mont Pelee, 1902
- 32. Figure 5.23 (A) by the time this ash cloud loomed over Plymouth on 27 July 1996, the town had been evacuated; the potential for pyroclastic eruptions of Soufriere Hills volcano was well recognized.
- 33. Figure 5.25 Ash and gas from Mount Pinatubo was shot into the stratosphere, and had an impact of climate and atmospheric chemistry worldwide. Eruption of 12 June 1991
- 34. Figure 5.26 Satellites tracked the path of the airborne sulfuric-acid mist formed by SO 2 from Mount Pinatubo; winds slowly spread it into a belt encircling the earth
- 35. Figure 5.27 Effect of 191 eruption of Pinatubo on near-surface (lower-atmosphere) air temperatures. Removal of ash and dust from the air was relatively rapid; sulfate aerosols persisted longer. The major explosive eruption occurred in mid-June 1991.
- 37. Figure 5.28
- 39. Figure 5.21 Pyroclastic flow from Mount St. Helens
- 40. Figure 5.31 The cascade Range volcanoes and their spatial relationship to the subduction zone and to major cities. Shaded area is covered by young volcanic deposits less than 2 million years old. Volcanic symbols on chart at right indicate dates of significant eruptions.
- 41. Figure 5.29 Restricted-access zones established by the Washington Department of Emergency Services before 18 May 1980 eruption of Mount St. Helens. Red zone : No access except by scientist, law-enforcement officials, and search-and-rescue personnel. Blue zone : Logging permitted, and residents with permits allowed access, but no overnight stays. Shaded area is national forest land. Casualties would have been still fewer if unauthorized people had not sneaked into the restricted areas.
- 42. Figure 5.32 Over the last 5000 to 6000 years, huge mudflows have poured down stream valleys and into low-lying areas, tens of miles from Mount Rainier’s summit. Even Tacoma or Seattle might be threatened by renewed activity on a similar scale.
- 43. Figures 5.33 a and b The Aleutians are a region of active volcanism – fortunately, a rather sparsely populated one. (A) Map of southwestern Alaska showing major volcanic peaks. Mount Spurr is showing signs of renewed activity as this is written. (B) Mount Veniaminof in eruption; note lahars formed when hot ash meets snow.
- 44. Figure 5.34 Map of Mammoth Lakes area, showing Long Valley Caldera, site of recent earthquakes, and area of recent uplift beneath which magma is rising.
- 45. Figures 5.35 a and b (A) Continuing thermal activity at Yellowstone National Park is extensive, (B) The size of the caldera and scale of past eruptions cause concern about the future of the region.