Downloaded 103 times

![America’s Largest Energy Savers to Date* Appliance and Equipment Standards Energy Star Labeling Program Building Energy Codes Electric and Gas Utility Demand-Side Management (DSM) Programs [Also:] Tax incentives Public sector energy efficiency leadership * Excluding auto efficiency standards](https://image.slidesharecdn.com/va-coves-state-ee-policies-sept08-1224515524606924-9/85/Generating-Energy-Through-Efficiency-7-320.jpg)


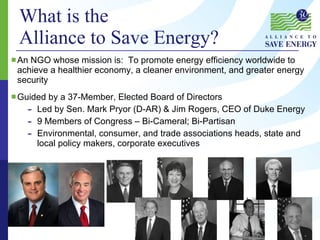
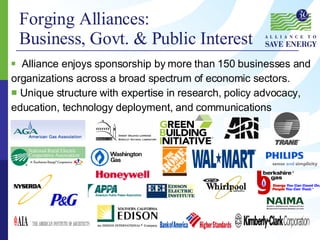
The document outlines the mission and activities of the Alliance to Save Energy, a non-governmental organization dedicated to promoting energy efficiency globally for a healthier economy and environment. It highlights the upcoming EE Global Forum in Paris, emphasizing the importance of energy efficiency in reducing demand, saving costs, and creating jobs, while also addressing Virginia's specific opportunities for enhancing energy efficiency through various policies and incentives. Additionally, it discusses future opportunities and current programs aimed at encouraging energy savings at both state and national levels.


