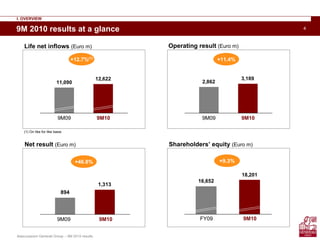
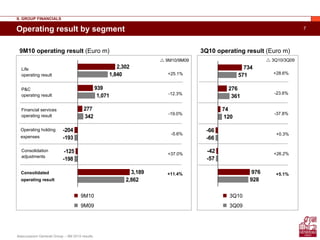
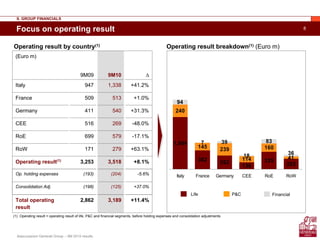
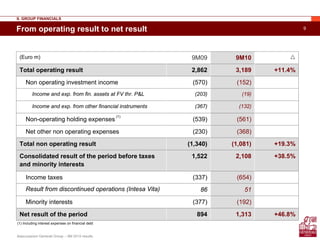
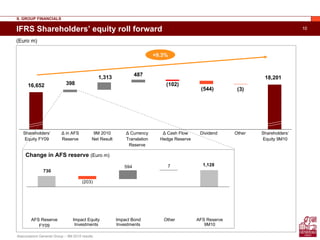
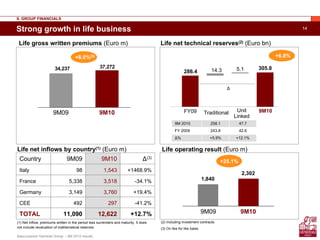
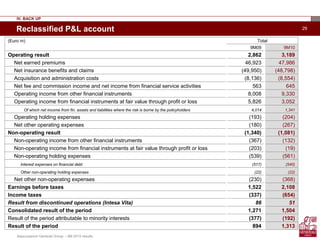
The Assicurazioni Generali Group reported strong results for the first nine months of 2010. Operating result increased 11.4% to €3.189 billion driven by growth in life insurance net inflows and premiums. Net income rose 46.8% to €1.313 billion. Shareholders' equity increased 12.7% to €12.622 billion reflecting higher unrealized gains on investments. The outlook for full year 2010 operating profit of €3.6-4.2 billion was confirmed.
4. Assicurazioni Generali Group – 9M 2010 results
4
Life net inflows (Euro m) Operating result (Euro m)
9M 2010 results at a glance
2,862
3,189
+11.4%
I. OVERVIEW
9M09 9M10
894
1,313
+46.8%
9M09 9M10
Net result (Euro m)
16,652
18,201
+9.3%
FY09 9M10
Shareholders’ equity (Euro m)
11,090
12,622
+12.7%(1)
9M09 9M10
(1) On like for like basis
5. Assicurazioni Generali Group – 9M 2010 results
5Agenda
II. Group financials
Profit & loss review
Shareholders’ equity
Life & P&C profitability
6. Assicurazioni Generali Group – 9M 2010 results
6Revenue development by segment
II. GROUP FINANCIALS
(1) Including investment contracts for Euro 3,750.7 m in 9M10
(2) APE amounts are calculated with end of period perimeter and exchange rates – like for like variations neutralise impacts of variations of perimeter and exchange rates
(Euro m) 9M10
∆ historical
9M10/9M09
∆ like for like
9M10/9M09 3Q10
∆ like for like
3Q10/3Q09
Gross written
premiums 53,829 +6.8% +5.8% 15,700 -1.6%
Life(1) 37,272 +8.9% +8.0% 10,921 -3.0%
P&C 16,557 +2.4% +1.0% 4,780 +1.7%
Life annual
premium
equivalent(2) 3,827 +13.4% +6.1% 1,056 -4.2%
7. Assicurazioni Generali Group – 9M 2010 results
7
Consolidation
adjustments
Consolidated
operating result
Financial services
operating result
P&C
operating result
Operating holding
expenses
Life
operating result
2,302
939
277
-204
-125
3,189
1,840
1,071
342
-193
-198
2,862
734
276
74
-66
-42
976
571
361
120
-66
-57
928
+26.2%
+5.1%
-37.8%
-23.6%
+0.3%
+28.6%
3Q10
3Q09
9M10 operating result (Euro m)
Operating result by segment
II. GROUP FINANCIALS
9M10
9M09
3Q10 operating result (Euro m)
3Q10/3Q09
+37.0%
+11.4%
-19.0%
-12.3%
-5.6%
+25.1%
9M10/9M09
8. Assicurazioni Generali Group – 9M 2010 results
8Focus on operating result
(Euro m)
9M09 9M10 ∆
Italy 947 1,338 +41.2%
France 509 513 +1.0%
Germany 411 540 +31.3%
CEE 516 269 -48.0%
RoE 699 579 -17.1%
RoW 171 279 +63.1%
Operating result(1)
3,253 3,518 +8.1%
Op. holding expenses (193) (204) -5.6%
Consolidation Adj. (198) (125) +37.0%
Total operating
result
2,862 3,189 +11.4%
II. GROUP FINANCIALS
Operating result by country(1)
1,004
362 262
136
335
202
240
145 239
114
160
41
94
7 39
18
83
36
Italy France Germany CEE RoE RoW
Life P&C Financial
Operating result breakdown(1) (Euro m)
(1) Operating result = operating result of life, P&C and financial segments, before holding expenses and consolidation adjustments
9. Assicurazioni Generali Group – 9M 2010 results
9From operating result to net result
(Euro m) 9M09 9M10
Total operating result 2,862 3,189 +11.4%
Non operating investment income (570) (152)
Income and exp. from fin. assets at FV thr. P&L (203) (19)
Income and exp. from other financial instruments (367) (132)
Non-operating holding expenses (539) (561)
Net other non operating expenses (230) (368)
Total non operating result (1,340) (1,081) +19.3%
Consolidated result of the period before taxes
and minority interests
1,522 2,108 +38.5%
Income taxes (337) (654)
Result from discontinued operations (Intesa Vita) 86 51
Minority interests (377) (192)
Net result of the period 894 1,313 +46.8%
II. GROUP FINANCIALS
(1) Including interest expenses on financial debt
(1)
10. Assicurazioni Generali Group – 9M 2010 results
10
16,652
18,201
(3)
398
1,313 487
(102)
(544)
IFRS Shareholders’ equity roll forward
Shareholders’
Equity FY09
Δ in AFS
Reserve
9M 2010
Net Result
Δ Currency
Translation
Reserve
Δ Cash Flow
Hedge Reserve
Dividend Other Shareholders’
Equity 9M10
+9.3%
II. GROUP FINANCIALS
(Euro m)
Change in AFS reserve (Euro m)
730
7 1,128
(203)
594
AFS Reserve
FY09
Impact Equity
Investments
Impact Bond
Investments
Other AFS Reserve
9M10
11. Assicurazioni Generali Group – 9M 2010 results
11
16.9
23.9
16.6
24.8
Solvency I update
II. GROUP FINANCIALS
Required margin Available margin
FY09
142%(1)
(Euro bn)
9M10
150%(1)
Solvency I ratio
(1) Including off balance sheet unrealized gains on real estate, 8%pts of which subject to authorities’ authorization
12. Assicurazioni Generali Group – 9M 2010 results
12
327.8
47.6
309.5
42.5
95.9
83.6
Investments(1)
435.6
Fixed income
instruments (3)
79.9%
Other (4)
4.1%
Real Estate (5)
4.6%
Equity
8.4%
Unit Linked
Third parties
AUM
“Own
Investments” (2)
FY09 9M10
(Euro bn)
471.3
+8.2%
II. GROUP FINANCIALS
(1) FY09 own investments restated in order to include cash and cash equivalents. The related weights of asset classes are: fixed income instruments 78.7%, real estate
4.7%, equity 9.0%, cash & cash equivalents 3.4%, other 4.2%
(2) “Own Investments” exclude real estate for own use. With this asset class “Own Investments” would amount to € 331.1 bn, compared to € 312.8 bn at FY09
(3) Including mortgage loans, policy loans, deposits under reinsurance business accepted, term deposits with credit institutions and other financial investments, other loans
(4) Including investments in subsidiaries, associated companies and JVs, derivatives, receivables from banks or customers
(5) Including real estate mutual funds
Cash & equival.
3.0%
13. Assicurazioni Generali Group – 9M 2010 results
13
Assicurazioni Generali Group – 9M 2010 results
Life New Business Annual Premium Equivalent
Solid growth of APE (+6.1%): significant progression of Unit Linked business (+16.9%)
coupled with positive development of traditional products (+2.9%)
II. GROUP FINANCIALS
(Euro m) APE
9M
2009
9M
2010
Historical Like for like
Italy 881 1,177 +33.6% +12.0%
France 984 899 -8.6% -8.6%
Germany 730 729 -0.2% -1.2%
CEE 117 122 +3.9% +0.9%
RoE 408 594 +45.6% +38.4%
RoW 256 307 +20.2% +7.9%
Total 3,375 3,827 +13.4% +6.1%
14. Assicurazioni Generali Group – 9M 2010 results
14Strong growth in life business
9M 2010 258.1 47.7
FY 2009 243.8 42.6
Δ% +5.9% +12.1%
II. GROUP FINANCIALS
Life net technical reserves(2) (Euro bn)Life gross written premiums (Euro m)
37,27234,237
9M109M09
Life net inflows by country(1) (Euro m)
+8.0%(3)
9M10FY09
286.4 14.3 5.1
Traditional Unit
Linked
Δ
305.8
Country 9M09 9M10 Δ(3)
Italy 98 1,543 +1468.9%
France 5,338 3,518 -34.1%
Germany 3,149 3,760 +19.4%
CEE 492 297 -41.2%
TOTAL 11,090 12,622 +12.7%
+6.8%
(2) Including investment contracts
(3) On like for like basis
(1) Net inflow: premiums written in the period less surrenders and maturity. It does
not include revaluation of mathematical reserves
1,840
2,302
+25.1%
9M09 9M10
Life operating result (Euro m)
15. Assicurazioni Generali Group – 9M 2010 results
15P&C Gross Written Premiums
II. GROUP FINANCIALS
(Euro m) 9M09 9M10
Historical Like for like(1)
Italy 4,925 4,969 +0.9% +0.9%
France 2,953 3,077 +4.2% +4.2%
Germany 2,490 2,468 -0.9% -0.9%
CEE 1,632 1,712 +4.9% -2.6%
RoE 3,308 3,330 +0.7% -0.5%
RoW 868 1,002 +15.5% +8.6%
Total 16,175 16,557 +2.4% +1.0%
(1) Calculated considering equivalent exchange rates and scope of consolidation
Light signs of P&C premium recovery, despite the challenging environment
Growth sustained by Non-Motor retail and Accident/Health
Motor recovering in Italy and France
Commercial still under pressure in several countries
16. Assicurazioni Generali Group – 9M 2010 results
16P&C profitability (1/2)
0.20.7
9M109M09
Combined ratio (%)
Expense
ratio
Loss
ratio
+0.9%pts.
II. GROUP FINANCIALS
Combined ratio by country (%)
9M09 9M10
Italy 101.8 98.9 -2.9%pts
France 99.0 100.3 +1.3%pts
Germany 95.2 95.7 +0.5%pts
CEE 87.7 95.2(*)
+7.5%pts
RoE 96.1 99.9 +3.8%pts
RoW 101.8 100.9 -0.9%pts
Total 97.9 98.8 +0.9%pts
27.3
71.5
26.6
71.3
98.897.9
Loss ratio Expense ratio
(1) Excluding nat cat, the ratio would be 87.6%
17. Assicurazioni Generali Group – 9M 2010 results
17
6.0
20.4
-0.2 0.9
6.2
21.3
P&C profitability (2/2)
9M10 2.1 69.4 71.5
9M09 1.7 69.6 71.3
II. GROUP FINANCIALS
Loss ratio (%)
9M109M09
71.3
71.5
0.4
(0.2)
Nat
CAT
Loss ratio w/o
NAT CAT
9M109M09 Δ Admin Δ Acq.
Acq. costs
Adm. costs
27.3
Expense ratio (%)
Δ%pts
Reserving ratio (%)
-1.0%pts
26.6
201.7% 200.7%
1,071 939
-12.3%
9M09 9M10
P&C operating result (Euro m)
9M09 9M10
19. Assicurazioni Generali Group – 9M 2010 results
19Final remarks
III. FINAL REMARKS
Robust life performance both in terms of volumes and profitability
Non life business in progress but hit by natural catastrophes
Confirmed focus on cost efficiency improvement
2010 total operating profit outlook (range: Euro 3.6 – 4.2 bn) confirmed
21. Assicurazioni Generali Group – 9M 2010 results
219M10 total gross written premiums
(Euro m) Total Gross Written Premiums
Country GWP ∆%(2) % weight
Italy 14,482 +10.0% 26.9%
France 11,769 -9.0% 21.9%
Germany 12,423 +9.4% 23.1%
Eastern Europe 2,937 -2.2% 5.5%
RoE 8,432 +16.2% 15.7%
Of which:
Spain 1,733 -13.2% 3.2%
Austria 1,975 +4.0% 3.7%
Switzerland 1,208 +2.2% 2.2%
RoW 3,786 +19.8% 7.0%
Total 53,829 +5.8% 100.0%
Gross Life Written Premiums(1)
GWP ∆%(2) % weight
9,513 +15.4% 17.7%
8,692 -12.9% 16.1%
9,955 +12.3% 18.5%
1,225 -1.5% 2.3%
5,102 +30.6% 9.5%
Of which:
675 -22.6% 1.3%
894 +8.8% 1.7%
682 +1.2% 1.3%
2,785 +24.4% 5.2%
37,272 +8.0% 69.2%
Gross P&C Written Premiums
GWP ∆%(2) % weight
4,969 +0.9% 9.2%
3,077 +4.2% 5.7%
2,468 -0.9% 4.6%
1,712 -2.6% 3.2%
3,330 -0.5% 6.2%
Of which:
1,058 -5.9% 2.0%
1,081 +0.4% 2.0%
526 +3.5% 1.0%
1,002 +8.6% 1.9%
16,557 +1.0% 30.8%
(2) Calculated considering equivalent exchange rates and scope of consolidation
(1) Including investment contracts
IV. BACK UP
22. Assicurazioni Generali Group – 9M 2010 results
22Life Premiums by Country & Business Line
Life 9M10
(Euro m)
Traditional
Unit/index
linked Health Group Total
Italy 86.4% 1.8% 0.0% 11.8% 9,324
France 71.2% 15.3% 7.2% 6.3% 8,538
Germany 50.2% 24.0% 17.8% 7.9% 9,955
CEE 66.3% 22.0% 10.5% 1.2% 1,225
RoE 26.5% 58.1% 3.8% 11.5% 5,090
Of which:
Spain 57.3% 1.8% 0.0% 40.9% 675
Austria 55.5% 25.5% 19.0% 0.0% 888
Switzerland 20.8% 78.1% 0.9% 0.2% 682
RoW 35.8% 0.6% 10.2% 53.5% 2,244
Total life gross
direct premiums
60.8% 19.5% 8.1% 11.6% 36,377
IV. BACK UP
23. Assicurazioni Generali Group – 9M 2010 results
23P&C Premiums by Country & Business Line
P&C 9M10
(Euro m)
Motor(1)
Accident/
Health Personal Commercial Total
Italy 47.5% 17.5% 11.5% 23.5% 4,913
France 29.6% 12.5% 36.1% 21.7% 2,888
Germany 39.4% 14.1% 37.4% 9.1% 2,465
CEE 51.2% 12.8% 14.7% 21.3% 1,685
RoE 37.1% 15.2% 21.4% 26.3% 3,214
Of which:
Spain 26.7% 12.7% 25.9% 34.7% 1,032
Austria 40.0% 10.7% 19.8% 29.5% 1,056
Switzerland 51.5% 23.5% 24.6% 0.4% 525
RoW 60.1% 6.2% 3.9% 29.8% 974
Total P&C gross
direct premiums
42.1% 14.5% 21.7% 21.7% 16,139
(1) Including fleets
IV. BACK UP
24. Assicurazioni Generali Group – 9M 2010 results
24
Assicurazioni Generali Group – 9M 2010 results
Life & Health: New Business APE
(Euro m) New Business APE
9M09 9M10 ∆ historical ∆ like for like
Italy 881 1,177 +33.6% +12.0%
France 984 899 -8.6% -8.6%
Germany 730 729 -0.2% -1.2%
CEE 117 122 +3.9% +0.9%
RoE 408 594 +45.6% +38.4%
of which Spain 86 84 -2.0% -2.1%
of which Austria 54 74 +38.0% +10.9%
of which Switzerland 59 61 +3.5% -9.0%
RoW 256 307 +20.2% +7.9%
Total 3,375 3,827 +13.4% +6.1%
IV. BACK UP
25. Assicurazioni Generali Group – 9M 2010 results
25
Loss
ratio
Expense
ratio
Life – Expense ratio (%) P&C – Combined ratio (%)
Total – Expense ratio (%)
71.571.3
26.6 27.3
15.7 15.4
10.8 10.4
9M109M09
9M109M09
9M109M09
97.9 98.8
Ratios
IV. BACK UP
26. Assicurazioni Generali Group – 9M 2010 results
26Ratios by country
P&C ratios by
country (%)
ITA FRA GER CEE SPA AUT SWI Consolidated
Loss ratio
9M10 77.6 71.7 66.5 63.8 70.6 68.2 70.2 71.5
9M09 80.1 71.0 65.7 59.6 68.5 69.0 66.9 71.3
Expense ratio
9M10 21.3 28.6 29.2 31.5 26.6 27.7 26.1 27.3
9M09 21.7 28.0 29.5 28.1 24.6 27.5 27.5 26.6
Combined ratio
9M10 98.9 100.3 95.7 95.2 97.2 95.9 96.3 98.8
9M09 101.8 99.0 95.2 87.7 93.1 96.5 94.3 97.9
Life expense ratios by country (%)
9M10 9.1 8.1 12.4 17.6 7.1 13.0 20.8 10.4
9M09 9.9 6.4 14.3 18.8 5.1 13.3 17.3 10.8
IV. BACK UP
27. Assicurazioni Generali Group – 9M 2010 results
27Combined ratio reconciliation
9M09 9M10
A Net earned premiums (net of consolidation adjustments) 14,856.9 15,130.9
B Consolidated net claims 10,590.1 10,812.6
Consolidated acquisition costs 3,029.7 3,216.7
Consolidated administration costs 971.7 962.3
Non insurance activity related administration costs(1) 49.2 47.5
Insurance activity related consolidated administration costs 922.5 914.8
C Total acquisition and administration costs 3,952.3 4,131.5
B/A Loss ratio 71.3% 71.5%
C/A Expense ratio 26.6% 27.3%
(B+C)/A Combined ratio 97.9% 98.8%
(1) Administration expenses related to service companies, real estate and other companies not belonging to P&C segment
(Euro m)
IV. BACK UP
28. Assicurazioni Generali Group – 9M 2010 results
28Operating result by country
P&C operating result by market (Euro m)Life operating result by market (Euro m)
9M09 9M10
Italy 755 1,004 +32.9%
France 316 362 +14.8%
Germany 144 262 +82.3%
CEE 254 136 -46.4%
RoE 263 335 +27.6%
Of which:
Spain 79 83 +3.9%
Austria 26 64 +143.3%
Switzerland 92 89 -3.0%
RoW 109 202 +86.3%
Total 1,840 2,302 +25.1%
9M09 9M10
Italy 114 240 +110.2%
France 190 145 -23.8%
Germany 223 239 +7.2%
CEE 247 115 -53.8%
RoE 262 160 -38.9%
Of which:
Spain 133 86 -35.5%
Austria 56 67 +18.1%
Switzerland 35 40 +15.2%
RoW 35 41 +18.1%
Total 1,071 939 -12.3%
IV. BACK UP
29. Assicurazioni Generali Group – 9M 2010 results
29Reclassified P&L account
(Euro m) Total
9M09 9M10
Operating result 2,862 3,189
Net earned premiums 46,923 47,986
Net insurance benefits and claims (49,950) (48,798)
Acquisition and administration costs (8,136) (8,554)
Net fee and commission income and net income from financial service activities 563 645
Operating income from other financial instruments 8,008 9,330
Operating income from financial instruments at fair value through profit or loss 5,826 3,052
Of which net income from fin. assets and liabilities where the risk is borne by the policyholders 4,014 1,341
Operating holding expenses (193) (204)
Net other operating expenses (180) (267)
Non-operating result (1,340) (1,081)
Non-operating income from other financial instruments (367) (132)
Non-operating income from financial instruments at fair value through profit or loss (203) (19)
Non-operating holding expenses (539) (561)
Interest expenses on financial debt (517) (540)
Other non-operating holding expenses (22) (22)
Net other non-operating expenses (230) (368)
Earnings before taxes 1,522 2,108
Income taxes (337) (654)
Result from discontinued operations (Intesa Vita) 86 51
Consolidated result of the period 1,271 1,504
Result of the period attributable to minority interests (377) (192)
Result of the period 894 1,313
IV. BACK UP
30. Assicurazioni Generali Group – 9M 2010 results
30
(Euro m) Life Non life Financial(1)
Unallocated holding
expenses
Consolidation
adjustments Total
Operating result 1,840 1,071 342 (193) (198) 2,862
Net earned premiums 32,067 14,857 0 - - 46,923
Net insurance benefits and claims (39,360) (10,590) 0 - - (49,950)
of which var. of provisions related to unit linked business (4,862) - - - (4,862)
Acquisition and administration costs (3,596) (3,970) (570) - - 8,136
Net fee and commission income and net income from
financial service activities 53 (1) 584 - (73) 563
Operating income from other fin. Instruments 7,030 866 238 - (125) 8,008
Operating income from fin. Instruments at fair value through
profit or loss 5,647 64 115 - - 5,826
of which net income from fin.assets and liabilities where the risk is
borne by the policyholders 4,014 - - - 4,014
Operating holding expenses - - - (193) - (193)
Net other operating expenses 0 (155) (25) - - (180)
Non-operating result (248) (505) (48) (539) - (1,340)
Non-operating income from other fin.instr. (142) (220) (5) - - (367)
Non-operating income from fin. instr.at fair value through
profit or loss 0 (203) - - - (203)
Non-operating holding expenses - - - (539) - (539)
Net other non-operating expenses (106) (82) (42) - - (230)
Earnings before taxes 1,592 566 294 (732) (198) 1,522
Reclassified P&L account by segment – 9M 2009
IV. BACK UP
(1) Not reclassified according to the new layout based on operating margins and presented in the Consolidated Report
31. Assicurazioni Generali Group – 9M 2010 results
31
(Euro m) Life Non life Financial(1)
Unallocated holding
expenses
Consolidation
adjustments Total
Operating result 2,302 939 277 (204) (125) 3,189
Net earned premiums 32,855 15,131 0 - - 47,986
Net insurance benefits and claims (37,985) (10,813) 0 - - (48,798)
of which var. of provisions related to unit linked business (2,693) - - - (2,693)
Acquisition and administration costs (3,747) (4,147) (660) - - (8,554)
Net fee and commission income and net income from
financial service activities 92 0 651 - (98) 645
Operating income from other fin. Instruments 8,279 863 216 - (28) 9,330
Operating income from fin. Instruments at fair value through
profit or loss 2,879 87 86 - - 3,052
of which net income from fin.assets and liabilities where the risk is
borne by the policyholders 1,341 - - - 1,341
Operating holding expenses - - - (204) - (204)
Net other operating expenses (70) (182) (16) - 1 (267)
Non-operating result (220) (257) (48) (561) 4 (1,081)
Non-operating income from other fin.instr. (88) (48) (1) - 4 (132)
Non-operating income from fin. instr.at fair value through
profit or loss 0 19 - - - (19)
Non-operating holding expenses - - - (561) - (561)
Net other non-operating expenses (132) (189) (47) - - (368)
Earnings before taxes 2,082 682 229 (765) (121) 2,108
Reclassified P&L account by segment – 9M 2010
IV. BACK UP
(1) Not reclassified according to the new layout based on operating margins and presented in the Consolidated Report
32. Assicurazioni Generali Group – 9M 2010 results
32Total comprehensive income(1)(2)
(1,031)
1,308
1,033
(245)
794
4591,916
(178)
(1,010)
181
(505)
1Q08 2Q08 3Q08 4Q08 1Q09 2Q09 3Q09 4Q09 1Q10 2Q10 3Q10
(Euro m)
IV. BACK UP
(1) Total Comprehensive Income = Change in shareholders’ equity during the period related to income and expenses recognized in profit or loss or directly in shareholders’
equity resulting from transactions and events other than transactions with equity owners
(2) According to new definition applied in annual report 2009, some residual change in equity components (FY09: Euro 11 m, FY08: Euro 28 m) were reclassified outside the
other comprehensive income as transactions with equity holders. Comparative information was restated accordingly
1Q08 1H08 9M08 FY08 1Q09 1H09 9M09 FY09 1Q10 1H10 9M10
(1,031) (1,536) (1,354) (2,365) (178) 616 2,532 2,990 1,308 1,063 2,096
+3,000 m
-3,000 m
33. Assicurazioni Generali Group – 9M 2010 results
33IFRS Shareholders’ equity roll forward
18,201
17,14616,652
23
(89)(140)
440
821
+6.2%
IFRS Shareholders’ equity roll forward (Euro m)
Shareholders’
Equity FY09
Shareholders‘
Equity 1H10
Δ in AFS
Reserve
3Q 2010
Net Result
Δ Currency
Translation
Reserve
Δ Cash Flow
Hedge
Reserve
Other Shareholders’
Equity 9M10
IV. BACK UP
Change in AFS reserve (Euro m)
89
307
1,128
273
459
AFS Reserve
1H10
Impact Equity
Investments
Impact Bond
Investments
Other AFS Reserve
9M10
35. Assicurazioni Generali Group – 9M 2010 results
35Investor Relations Team
Paola Buratti (Tel.: +39-040-671157)
Head of Investor Relations
Email: paola_buratti@generali.com
Stefano Burrino (Tel.: +39-040-671202)
Email: stefano_burrino@generali.com
Emanuele Marciante (Tel.: +39-040-671347)
Email: emanuele_marciante@generali.com
Veronica Cherini (Tel.: +39-040-671488)
Email: veronica_cherini@generali.com
Rodolfo Svara (Tel.: +39-040-671823)
Email: rodolfo_svara@generali.com
Marta Porczynska (Tel.: +39-040-671402)
IR Events
Email: marta_porczynska@generali.com
Assicurazioni Generali
P.za Duca degli Abruzzi 2
34132 Trieste, Italy
Fax: +39 040 671338
e-mail: generali_ir@generali.com
www.generali.com
36. Assicurazioni Generali Group – 9M 2010 results
36Disclaimer
Certain of the statements contained herein are statements of future expectations and
other forward-looking statements.
These expectations are based on management's current views and assumptions and
involve known and unknown risks and uncertainties.
The user of such information should recognise that actual results, performance or events
may differ materially from such expectations because they relate to future events and
circumstances which are beyond our control including, among other things, general
economic and sector conditions.
Neither Assicurazioni Generali S.p.A. nor any of its affiliates, directors, officers
employees or agents owe any duty of care towards any user of the information provided
herein nor any obligation to update any forward-looking information contained in this
document.
The manager charged with preparing the company’s financial reports, Raffaele Agrusti,
declares, pursuant to paragraph 2 of article 154-bis of the Consolidated Law on Financial
Intermediation, that the accounting information contained in this presentation
corresponds to document results, books and accounts records.