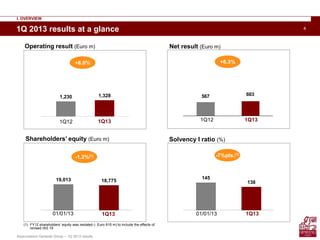
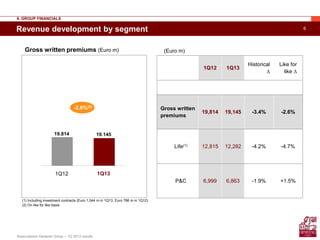
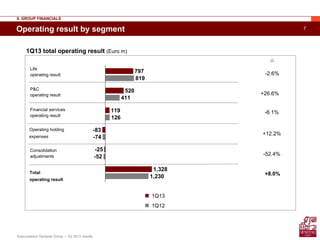
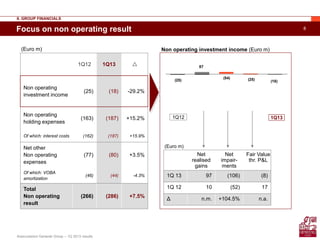
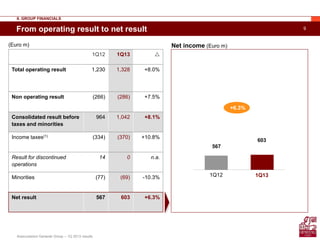
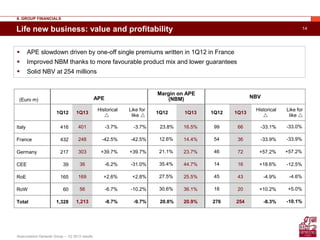
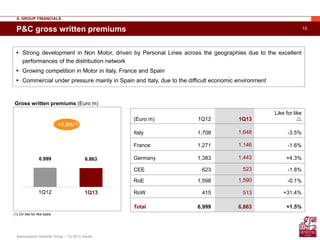
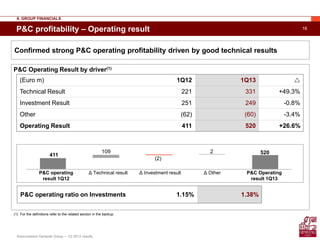
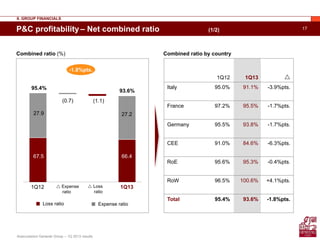
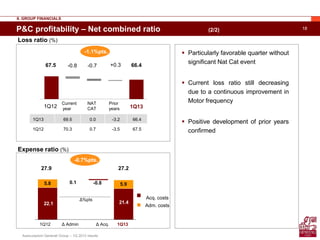
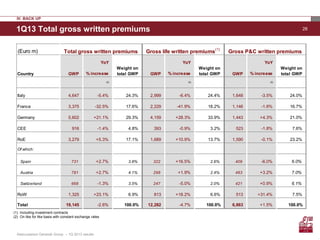
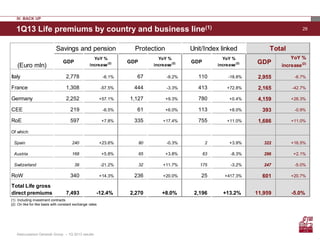
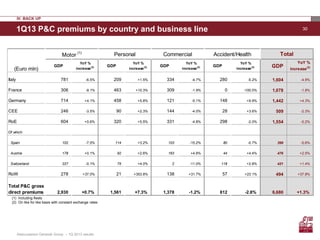
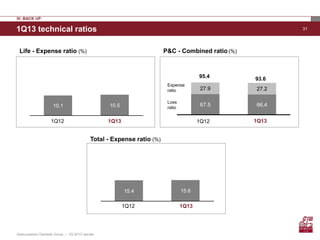
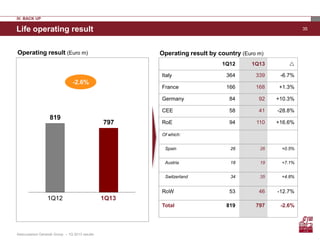
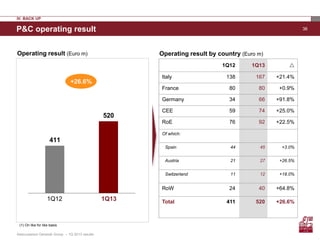
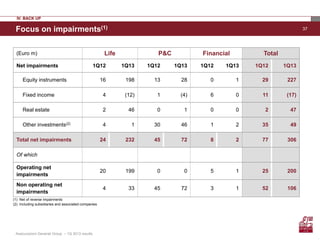
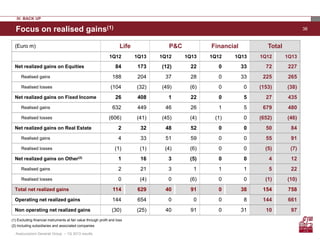
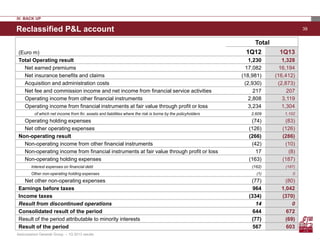
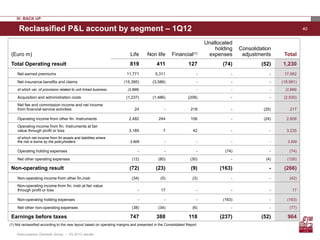
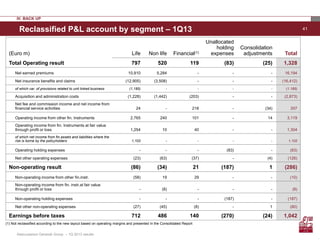
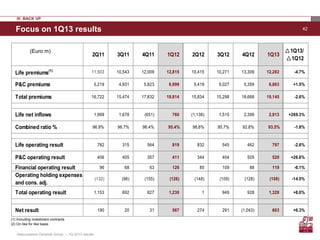
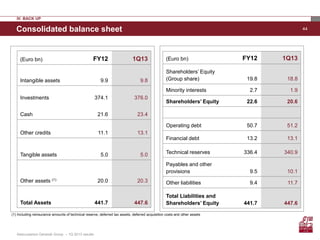
SlideShare a Scribd company logo
1 of 58
May 10, 2013
Generali Group
1Q 2013 Results
2
Assicurazioni Generali Group – 1Q 2013 results
Agenda
I. Overview
II. Group financials
III. Final remarks
IV. Backup
Page 3
Page 5
Page 24
Page 26
3Agenda
I. Overview
1Q 2013 results at a glance
Assicurazioni Generali Group – 1Q 2013 results
4
Assicurazioni Generali Group – 1Q 2013 results
Operating result (Euro m)
1,230 1,328
+8.0%
1Q12 1Q13 1Q12 1Q13
1Q 2013 results at a glance
I. OVERVIEW
Shareholders’ equity (Euro m)
19,013 18,775
-1.2%(1)
01/01/13 1Q13
Solvency I ratio (%)
1Q13
603567
+6.3%
Net result (Euro m)
145
138
-7%pts.(1)
(1) FY12 shareholders’ equity was restated (- Euro 815 m) to include the effects of
revised IAS 19
01/01/13
5
Assicurazioni Generali Group – 1Q 2013 results
Agenda
II. Group financials
Profit & loss review
Life and P&C segment profitability
Balance sheet and solvency I
6
Assicurazioni Generali Group – 1Q 2013 results
Revenue development by segment
II. GROUP FINANCIALS
(1) Including investment contracts (Euro 1,044 m in 1Q13, Euro 786 m in 1Q12)
(2) On like for like basis
1Q12 1Q13
Historical
∆
Like for
like ∆
Gross written
premiums
19,814 19,145 -3.4% -2.6%
Life(1) 12,815 12,282 -4.2% -4.7%
P&C 6,999 6,863 -1.9% +1.5%
(Euro m)
19.814 19.145
1Q131Q12
-2.6%(2)
Gross written premiums (Euro m)
7
Assicurazioni Generali Group – 1Q 2013 results
Consolidation
adjustments
Total
operating result
Financial services
operating result
P&C
operating result
Operating holding
expenses
Life
operating result
797
520
119
-83
-25
1,328
819
411
126
-74
-52
1,230
1Q13 total operating result (Euro m)
Operating result by segment
1Q13
1Q12
-52.4%
+8.0%
-6.1%
+26.6%
+12.2%
-2.6%

II. GROUP FINANCIALS
8
Assicurazioni Generali Group – 1Q 2013 results
Focus on non operating result
II. GROUP FINANCIALS
(25) (18)
87
(54) (25)
Non operating investment income (Euro m)
1Q131Q12
(Euro m)
Net
realised
gains
Net
impair-
ments
Fair Value
thr. P&L
1Q 13 97 (106) (8)
1Q 12 10 (52) 17
Δ n.m. +104.5% n.a.
(Euro m)
1Q12 1Q13 
Non operating
investment income
(25) (18) -29.2%
Non operating
holding expenses
(163) (187) +15.2%
Of which: interest costs (162) (187) +15.9%
Net other
Non operating
expenses
(77) (80) +3.5%
Of which: VOBA
amortization
(46) (44) -4.3%
Total
Non operating
result
(266) (286) +7.5%
9
Assicurazioni Generali Group – 1Q 2013 results
1Q12 1Q13 
Total operating result 1,230 1,328 +8.0%
Non operating result (266) (286) +7.5%
Consolidated result before
taxes and minorities
964 1,042 +8.1%
Income taxes(1) (334) (370) +10.8%
Result for discontinued
operations
14 0 n.a.
Minorities (77) (69) -10.3%
Net result 567 603 +6.3%
II. GROUP FINANCIALS
Net income (Euro m)
567
603
+6.3%
1Q131Q12
From operating result to net result
(Euro m)
10
Assicurazioni Generali Group – 1Q 2013 results
Agenda
II. Group financials
Profit & loss review
Life and P&C segment profitability
Balance sheet and solvency I
11
Assicurazioni Generali Group – 1Q 2013 results
Life business development
Gross written premiums (Euro m)
12.815 12.282
-4.7%(1)
II. GROUP FINANCIALS
1Q12 1Q13
(1) On like for like basis
(2) Including liabilities related to investment contracts
Net technical reserves(2) (Euro bn)
Country 1Q12 1Q13
Italy (235) 212
France (888) 70
Germany 994 1,494
CEE 106 143
RoE 534 683
RoW 250 310
TOTAL 760 2,913
Net inflows by country (Euro m)
 Italy: positive development thanks to both lower
maturities and surrenders
 France: positive trend thanks to Unit Linked and
Health & Protection vs. planned decrease in
traditional savings; decreasing outflows
 Germany: resilient growth triggered by positive
development in both saving single premiums
and protection regular premiums
1Q13FY12 Traditional Unit
Linked
+1.4%
Traditional Unit linked
260.2 263.1
53.6 55.1
1.62.9313.8 318.3
12
Assicurazioni Generali Group – 1Q 2013 results
Life profitability – Operating result
(Euro m) 1Q12 1Q13 
Technical Margin 1,543 1,544 +0.1%
Investment Result 554 517 -6.8%
Expenses (1,279) (1,264) -1.2%
Operating Result 819 797 -2.6%
Stable life operating profitability in a challenging financial environment
Life Operating Result by driver(1)
Life operating ratio on
Investments
0.26% 0.24%
II. GROUP FINANCIALS
(1) For the definitions refer to the related section in the backup
Life operating
result 1Q12
Δ Technical margin Δ Investment result Δ Expenses Life operating
result 1Q13
819 797151
(37)
13
Assicurazioni Generali Group – 1Q 2013 results
Life investment strategy and yields
Current
return
Fixed
income
Equity Real
Estate
1Q12 1Q13 1Q12 1Q13 1Q12 1Q13
Euro m 2,331 2,299 61 17 192 182
% 1.1 1.0 0.5 0.1 2.0 1.9
43,0% 42,1%
33,9% 34,7%
8,4% 8,0%
4,5% 4,3%
3,5% 3,5%
4,7% 5,4%
2,1% 2,0%
FY12 1Q13
Other
Cash & cash
equivalent
Real estate
Equity
Other fixed
income
Corporate
bonds
Government
bonds
Life segment own investments (%)
Euro 277.0 bn Euro 279.0 bn
II. GROUP FINANCIALS
 Increased attention to improve the diversification of the
investments, especially in corporate bonds
 Current profitability remains affected by a low
reinvestment yield environment
 Increased cash position ready to be deployed in
attractive assets
14Life new business: value and profitability
II. GROUP FINANCIALS
(Euro m) APE
Margin on APE
(NBM) NBV
1Q12 1Q13
Historical

Like for
like 
1Q12 1Q13 1Q12 1Q13
Historical

Like for
like 
Italy 416 401 -3.7% -3.7% 23.8% 16.5% 99 66 -33.1% -33.0%
France 432 248 -42.5% -42.5% 12.6% 14.4% 54 36 -33.9% -33.9%
Germany 217 303 +39.7% +39.7% 21.1% 23.7% 46 72 +57.2% +57.2%
CEE 39 36 -6.2% -31.0% 35.4% 44.7% 14 16 +18.6% -12.5%
RoE 165 169 +2.6% +2.8% 27.5% 25.5% 45 43 -4.9% -4.6%
RoW 60 56 -6.7% -10.2% 30.6% 36.1% 18 20 +10.2% +5.0%
Total 1,328 1,213 -8.7% -9.7% 20.8% 20.9% 276 254 -8.3% -10.1%
 APE slowdown driven by one-off single premiums written in 1Q12 in France
 Improved NBM thanks to more favourable product mix and lower guarantees
 Solid NBV at 254 millions
Assicurazioni Generali Group – 1Q 2013 results
15
Assicurazioni Generali Group – 1Q 2013 results
P&C gross written premiums
(Euro m) 1Q12 1Q13
Like for like

Italy 1,708 1,648 -3.5%
France 1,271 1,146 -1.6%
Germany 1,383 1,443 +4.3%
CEE 623 523 -1.8%
RoE 1,598 1,590 -0.1%
RoW 415 513 +31.4%
Total 6,999 6,863 +1.5%
II. GROUP FINANCIALS
(1) On like for like basis
Gross written premiums (Euro m)
6.999 6.863
1Q131Q12
+1.5%(1)
 Strong development in Non Motor, driven by Personal Lines across the geographies due to the excellent
performances of the distribution network
 Growing competition in Motor in Italy, France and Spain
 Commercial under pressure mainly in Spain and Italy, due to the difficult economic environment
16
Assicurazioni Generali Group – 1Q 2013 results
P&C profitability – Operating result
(Euro m) 1Q12 1Q13 
Technical Result 221 331 +49.3%
Investment Result 251 249 -0.8%
Other (62) (60) -3.4%
Operating Result 411 520 +26.6%
P&C Operating Result by driver(1)
P&C operating ratio on Investments 1.15% 1.38%
Confirmed strong P&C operating profitability driven by good technical results
II. GROUP FINANCIALS
(1) For the definitions refer to the related section in the backup
P&C operating
result 1Q12
Δ Technical result Δ Investment result Δ Other P&C Operating
result 1Q13
411
2 520109
(2)
17
Assicurazioni Generali Group – 1Q 2013 results
P&C profitability – Net combined ratio (1/2)
(0.7) (1.1)
1Q131Q12
Combined ratio (%)
 Expense
ratio
 Loss
ratio
-1.8%pts.
II. GROUP FINANCIALS
Combined ratio by country
1Q12 1Q13 
Italy 95.0% 91.1% -3.9%pts.
France 97.2% 95.5% -1.7%pts.
Germany 95.5% 93.8% -1.7%pts.
CEE 91.0% 84.6% -6.3%pts.
RoE 95.6% 95.3% -0.4%pts.
RoW 96.5% 100.6% +4.1%pts.
Total 95.4% 93.6% -1.8%pts.
27.2
66.4
27.9
67.5
93.6%
95.4%
Loss ratio Expense ratio
18
Assicurazioni Generali Group – FY 2009 results
5.9
22.1
0.1 -0.85.8
21.4
P&C profitability – Net combined ratio (2/2)
1Q13 69.5 0.0 -3.2 66.4
1Q12 70.3 0.7 -3.5 67.5
II. GROUP FINANCIALS
Loss ratio (%)
1Q131Q12
67.5 66.4-0.8 -0.7 +0.3
Current
year
NAT
CAT
Prior
years
1Q131Q12 Δ Admin Δ Acq.
Acq. costs
Adm. costs
27.2
Expense ratio (%)
Δ%pts
27.9
-1.1%pts.
-0.7%pts.
Assicurazioni Generali Group – 1Q 2013 results
 Particularly favorable quarter without
significant Nat Cat event
 Current loss ratio still decreasing
due to a continuous improvement in
Motor frequency
 Positive development of prior years
confirmed
19
Assicurazioni Generali Group – 1Q 2013 results
P&C investment strategy and yields
P&C segment own investments (%)
Euro 37.9 bn Euro 37.4 bn
Current
return
Fixed
income
Equity Real
Estate
1Q12 1Q13 1Q12 1Q13 1Q12 1Q13
Euro m 227 218 13 12 114 91
% 1.0 0.8 0.4 0.5 2.1 1.7
29,7% 31,0%
29,2%
30,3%
10,7% 8,4%
6,9% 7,1%
13,9% 14,0%
8,0% 7,8%
1,6% 1,4%
FY12 1Q13
Other
Cash & cash
equivalent
Real estate
Equity
Other fixed income
Corporate bonds
Government bonds
II. GROUP FINANCIALS
 Strong focus on deploying the existing cash in the portfolio
 Increased attention to improve the diversification of the
investments, especially in corporate bonds
 Slight increase of equity exposure
 Current profitability remains affected by a low reinvestment
yield environment
 Solid liquidity buffer maintained during the quarter
20
Assicurazioni Generali Group – 1Q 2013 results
64.5 66.6
Financial segment
Operating result (Euro m)
Third party AUM(1) (Euro bn)
Net fees and commissions (Euro m)
126 119
1Q131Q12
-6.1%
218 218
1Q131Q12
+0.2%
96,4 100.8
1Q13FY12
+4.4% +2.1%pts.
1Q131Q12
Cost/income ratio (%)
II. GROUP FINANCIALS
(1) Including only third party AUM related to financial segment companies
21
Assicurazioni Generali Group – 1Q 2013 results
Agenda
II. Group financials
Profit & loss review
Life and P&C segment profitability
Balance sheet and solvency I
22
Assicurazioni Generali Group – 1Q 2013 results
18,77519,013
(815)
19,828
(611)(45)
603
(184)
IFRS Shareholders’ equity roll forward
Shareholders’
Equity FY12
Impact from
revised IAS 19
01/01/2013 Δ in AFS
Reserve
1Q 2013
Net Result
Δ Currency
Translation
Reserve
Other (including
Euro 477 m
GPH 25%
minorities
buyout)
Shareholders’
Equity 1Q13
-1.2%
II. GROUP FINANCIALS
(Euro m)
Change in AFS reserve (Euro m)
2,591
46 2,406
28
(259)
AFS Reserve
FY12
Impact Equity
Investments
Impact Bond
Investments
Other AFS Reserve
1Q13
23
Assicurazioni Generali Group – 1Q 2013 results
17.9 17.9 18.2
26.9 26.1 25.0
Solvency I update
II. GROUP FINANCIALS
Required margin Available margin
01/01/13FY12
145%(1)
(Euro bn)
1Q13
138%
Solvency I ratio
(1) FY12 shareholders’ equity was restated including the effects of revised IAS 19
Main drivers of changeMain drivers of change
Available margin
 Consolidated result:
 Financial markets and other
elements:
 GPH 25% minorities buyout
 Eligible debt
Required Margin
+ 0.7
- 0.3
- 1.3
- 0.2
+ 0.3
150%
24
Assicurazioni Generali Group – 1Q 2013 results
III. Final Remarks
Agenda
25
Assicurazioni Generali Group – 1Q 2013 results
Final remarks
III. FINAL REMARKS
Excellent underlying P&C performance
Resilient Life profitability in a challenging market environment
Prioritising reinvestment of excess cash
26
IV. Backup
Agenda
P&L
Balance sheet
Life
Definitions
Assicurazioni Generali Group – 1Q 2013 results
27
IV. Backup
Agenda
P&L
Balance sheet
Life
Definitions
Assicurazioni Generali Group – 1Q 2013 results
281Q13 Total gross written premiums
IV. BACK UP
(1) Including investment contracts
(2) On like for like basis with constant exchange rates
(Euro m)
YoY YoY YoY
% increase % increase % increase
(2) (2) (2)
Italy 4,647 -5.4% 24.3% 2,999 -6.4% 24.4% 1,648 -3.5% 24.0%
France 3,375 -32.5% 17.6% 2,229 -41.9% 18.2% 1,146 -1.6% 16.7%
Germany 5,602 +21.1% 29.3% 4,159 +28.3% 33.9% 1,443 +4.3% 21.0%
CEE 916 -1.4% 4.8% 393 -0.9% 3.2% 523 -1.8% 7.6%
RoE 3,279 +5.3% 17.1% 1,689 +10.9% 13.7% 1,590 -0.1% 23.2%
Of which:
Spain 731 +2.7% 3.8% 322 +16.5% 2.6% 409 -6.0% 6.0%
Austria 781 +2.7% 4.1% 298 +1.9% 2.4% 483 +3.2% 7.0%
Switzerland 668 -1.3% 3.5% 247 -5.0% 2.0% 421 +0.9% 6.1%
RoW 1,325 +23.1% 6.9% 813 +18.2% 6.6% 513 +31.4% 7.5%
Total 19,145 -2.6% 100.0% 12,282 -4.7% 100.0% 6,863 +1.5% 100.0%
Total gross written premiums Gross life written premiums
(1)
Gross P&C written premiums
Country GWP
Weight on
total GWP GWP
Weight on
total GWP GWP
Weight on
total GWP
Assicurazioni Generali Group – 1Q 2013 results
291Q13 Life premiums by country and business line(1)
IV. BACK UP
(1) Including investment contracts
(2) On like for like basis with constant exchange rates
GDP
YoY %
increase(2) GDP
YoY %
increase(2) GDP
YoY %
increase(2) GDP
YoY %
increase(2)
Italy 2,778 -6.1% 67 -9.2% 110 -18.8% 2,955 -6.7%
France 1,308 -57.5% 444 -3.3% 413 +72.8% 2,165 -42.7%
Germany 2,252 +57.1% 1,127 +9.3% 780 +0.4% 4,159 +28.3%
CEE 219 -6.5% 61 +6.0% 113 +8.0% 393 -0.9%
RoE 597 +7.8% 335 +17.4% 755 +11.0% 1,686 +11.0%
Of which:
Spain 240 +23.6% 80 -0.3% 2 +3.9% 322 +16.5%
Austria 168 +5.8% 65 +3.8% 63 -8.3% 296 +2.1%
Switzerland 39 -21.2% 32 +11.7% 175 -3.2% 247 -5.0%
RoW 340 +14.3% 236 +20.0% 25 +417.3% 601 +20.7%
Total Life gross
direct premiums 7,493 -12.4% 2,270 +8.0% 2,196 +13.2% 11,959 -5.0%
(Euro mln)
Protection Unit/Index linkedSavings and pension Total
Assicurazioni Generali Group – 1Q 2013 results
301Q13 P&C premiums by country and business line
IV. BACK UP
(1) Including fleets
(2) On like for like basis with constant exchange rates
GDP
YoY %
increase(2) GDP
YoY %
increase(2) GDP
YoY %
increase(2) GDP
YoY %
increase(2) GDP
YoY %
increase(2)
Italy 781 -6.5% 209 +1.5% 334 -4.7% 280 -5.2% 1,604 -4.9%
France 306 -9.1% 463 +10.3% 309 -1.9% 0 -100.0% 1,078 -1.8%
Germany 714 +4.1% 458 +5.8% 121 -5.1% 148 +9.9% 1,442 +4.3%
CEE 246 -3.5% 90 +2.3% 144 -4.0% 28 +3.6% 509 -2.3%
RoE 604 +0.6% 320 +5.5% 331 -4.8% 298 -2.0% 1,554 -0.2%
Of which:
Spain 102 -7.5% 114 +3.2% 103 -15.2% 80 -0.7% 399 -5.6%
Austria 178 +0.1% 92 +2.6% 163 +4.6% 44 +4.4% 476 +2.5%
Switzerland 227 -0.1% 75 +4.0% 2 -11.0% 118 +2.8% 421 +1.4%
RoW 278 +37.0% 21 +353.8% 138 +31.7% 57 +23.1% 494 +37.8%
Total P&C gross
direct premiums 2,930 +0.7% 1,561 +7.3% 1,378 -1.2% 812 -2.8% 6,680 +1.3%
TotalAccident/Health
(Euro mln)
Motor
(1)
Personal Commercial
Assicurazioni Generali Group – 1Q 2013 results
31
Loss
ratio
Expense
ratio
P&C - Combined ratio(%)
Total - Expense ratio (%)
67.5 66.4
27.9 27.2
1Q131Q12
1Q131Q12
1Q131Q12
95.4 93.6
1Q13 technical ratios
IV. BACK UP
Life - Expense ratio (%)
15.4 15.6
10.510.1
Assicurazioni Generali Group – 1Q 2013 results
321Q13 combined ratio reconciliation
(1) Administration expenses related to service companies, real estates and other companies not belonging to P&C segment
(Euro m)
IV. BACK UP
1Q12 1Q13
A Net earned premiums (net of consolidation adjustments) 5,311 5,284
B Consolidated net claims 3,586 3,508
Consolidated acquisition costs 1,175 1,129
Consolidated administration costs 320 319
Non insurance activity related administration costs(1)
14 9
Insurance activity related consolidated administration costs 307 310
C Total acquisition and administration costs 1,481 1,439
B/A Loss ratio 67.5% 66.4%
C/A Expense ratio 27.9% 27.2%
(B+C)/A Combined ratio 95.4% 93.6%
D Other technical items 22 6
A-B-C-D Technical result 221 331
Assicurazioni Generali Group – 1Q 2013 results
331Q13 technical ratios by country
IV. BACK UP
(%) ITA FRA GER CEE RoE SPA AUT SWI RoW Consolidated
1Q13 71.2% 69.3% 65.3% 52.7% 65.7% 63.6% 64.4% 70.3% 63.8% 66.4%
1Q12 74.5% 71.4% 66.7% 53.9% 66.4% 64.9% 65.1% 71.8% 56.8% 67.5%
1Q13 19.9% 26.1% 28.5% 31.9% 29.6% 28.0% 30.5% 25.2% 36.8% 27.2%
1Q12 20.5% 25.8% 28.8% 37.1% 29.2% 26.9% 31.1% 25.0% 39.7% 27.9%
1Q13 91.1% 95.5% 93.8% 84.6% 95.3% 91.6% 94.9% 95.5% 100.6% 93.6%
1Q12 95.0% 97.2% 95.5% 91.0% 95.6% 91.7% 96.2% 96.8% 96.5% 95.4%
1Q13 10.1% 11.2% 9.9% 18.4% 9.9% 3.7% 13.7% 17.7% 13.9% 10.5%
1Q12 9.7% 6.4% 12.7% 19.1% 11.9% 4.5% 14.7% 20.4% 14.3% 10.1%
P&C Loss ratio
P&C Expense ratio
P&C Combined ratio
Life expense ratio by country
Assicurazioni Generali Group – 1Q 2013 results
34Focus on operating result
1Q12 1Q13 ∆
Italy 562 568 +1.0%
France 246 249 +1.2%
Germany 130 172 +32.0%
CEE 122 121 -0.3%
RoE 219 241 +9.9%
RoW 76 85 +11.1%
Operating result(1) 1,356 1,436 +5.9%
Op. holding expenses (74) (83) +12.2%
Consolidation Adj. (52) (25) -52.4%
Total operating
result
1,230 1,328 +8.0%
Operating result by country(1) (Euro m)
339
168
92
41
110
46
167
80
66
74
92
40
61
14
7
38
-1
Italy France Germany CEE RoE RoW
Life P&C Financial
Operating result breakdown(1) (Euro m)
(1) Operating result = operating result of life, P&C and financial segments, before holding expenses and consolidation adjustments
568
249
172
121
241
85
IV. BACK UP
Assicurazioni Generali Group – 1Q 2013 results
35
819
797
Life operating result
Operating result (Euro m)
1Q131Q12
-2.6%
Operating result by country (Euro m)
IV. BACK UP
1Q12 1Q13 
Italy 364 339 -6.7%
France 166 168 +1.3%
Germany 84 92 +10.3%
CEE 58 41 -28.8%
RoE 94 110 +16.6%
Of which:
Spain 26 26 +0.5%
Austria 18 19 +7.1%
Switzerland 34 35 +4.8%
RoW 53 46 -12.7%
Total 819 797 -2.6%
Assicurazioni Generali Group – 1Q 2013 results
36
411
520
P&C operating result
1Q131Q12
+26.6%
IV. BACK UP
1Q12 1Q13 
Italy 138 167 +21.4%
France 80 80 +0.9%
Germany 34 66 +91.8%
CEE 59 74 +25.0%
RoE 76 92 +22.5%
Of which:
Spain 44 45 +3.0%
Austria 21 27 +26.5%
Switzerland 11 12 +18.0%
RoW 24 40 +64.8%
Total 411 520 +26.6%
Operating result (Euro m) Operating result by country (Euro m)
(1) On like for like basis
Assicurazioni Generali Group – 1Q 2013 results
37
Assicurazioni Generali Group – 1Q 2013 results
(Euro m) Life P&C Financial Total
Net impairments 1Q12 1Q13 1Q12 1Q13 1Q12 1Q13 1Q12 1Q13
Equity instruments 16 198 13 28 0 1 29 227
Fixed income 4 (12) 1 (4) 6 0 11 (17)
Real estate 2 46 0 1 0 0 2 47
Other investments(2) 4 1 30 46 1 2 35 49
Total net impairments 24 232 45 72 8 2 77 306
Of which
Operating net
impairments
20 199 0 0 5 1 25 200
Non operating net
impairments
4 33 45 72 3 1 52 106
Focus on impairments(1)
(1) Net of reverse impairments
(2) Including subsidiaries and associated companies
IV. BACK UP
38
Assicurazioni Generali Group – 1Q 2013 results
(Euro m) Life P&C Financial Total
1Q12 1Q13 1Q12 1Q13 1Q12 1Q13 1Q12 1Q13
Net realized gains on Equities 84 173 (12) 22 0 33 72 227
Realised gains 188 204 37 28 0 33 225 265
Realised losses (104 (32) (49) (6) 0 0 (153) (38)
Net realized gains on Fixed Income 26 408 1 22 0 5 27 435
Realised gains 632 449 46 26 1 5 679 480
Realised losses (606) (41) (45) (4) (1) 0 (652) (46)
Net realized gains on Real Estate 2 32 48 52 0 0 50 84
Realised gains 4 33 51 59 0 0 55 91
Realised losses (1) (1) (4) (6) 0 0 (5) (7)
Net realized gains on Other(2) 1 16 3 (5) 0 0 4 12
Realised gains 2 21 3 1 1 1 5 22
Realised losses 0 (4) 0 (6) 0 0 (1) (10)
Total net realized gains 114 629 40 91 0 38 154 758
Operating net realized gains 144 654 0 0 0 8 144 661
Non operating net realized gains (30) (25) 40 91 0 31 10 97
Focus on realised gains(1)
(1) Excluding financial instruments at fair value through profit and loss
(2) Including subsidiaries and associated companies
IV. BACK UP
39Reclassified P&L account
Total
(Euro m) 1Q12 1Q13
Total Operating result 1,230 1,328
Net earned premiums 17,082 16,194
Net insurance benefits and claims (18,981) (16,412)
Acquisition and administration costs (2,930) (2,873)
Net fee and commission income and net income from financial service activities 217 207
Operating income from other financial instruments 2,808 3,119
Operating income from financial instruments at fair value through profit or loss 3,234 1,304
of which net income from fin. assets and liabilities where the risk is borne by the policyholders 2,609 1,102
Operating holding expenses (74) (83)
Net other operating expenses (126) (126)
Non-operating result (266) (286)
Non-operating income from other financial instruments (42) (10)
Non-operating income from financial instruments at fair value through profit or loss 17 (8)
Non-operating holding expenses (163) (187)
Interest expenses on financial debt (162) (187)
Other non-operating holding expenses (1) 0
Net other non-operating expenses (77) (80)
Earnings before taxes 964 1,042
Income taxes (334) (370)
Result from discontinued operations 14 0
Consolidated result of the period 644 672
Result of the period attributable to minority interests (77) (69)
Result of the period 567 603
IV. BACK UP
Assicurazioni Generali Group – 1Q 2013 results
40
(Euro m) Life Non life Financial(1)
Unallocated
holding
expenses
Consolidation
adjustments Total
Total Operating result 819 411 127 (74) (52) 1,230
Net earned premiums 11,771 5,311 - - - 17,082
Net insurance benefits and claims (15,395) (3,586) - - - (18,981)
of which var. of provisions related to unit linked business (2,666) - - - - (2,666)
Acquisition and administration costs (1,237) (1,486) (208) - - (2,930)
Net fee and commission income and net income
from financial service activities 24 - 218 - (25) 217
Operating income from other fin. Instruments 2,482 244 106 - (24) 2,808
Operating income from fin. Instruments at fair
value through profit or loss 3,185 7 42 - - 3,235
of which net income from fin.assets and liabilities where
the risk is borne by the policyholders 2,609 - - - - 2,609
Operating holding expenses - - - (74) - (74)
Net other operating expenses (12) (80) (30) - (4) (126)
Non-operating result (72) (23) (9) (163) - (266)
Non-operating income from other fin.instr. (34) (5) (3) - - (42)
Non-operating income from fin. instr.at fair value
through profit or loss - 17 - - - 17
Non-operating holding expenses - - - (163) - (163)
Net other non-operating expenses (38) (34) (6) - - (77)
Earnings before taxes 747 388 118 (237) (52) 964
Reclassified P&L account by segment – 1Q12
IV. BACK UP
(1) Not reclassified according to the new layout based on operating margins and presented in the Consolidated Report
Assicurazioni Generali Group – 1Q 2013 results
41
(Euro m) Life Non life Financial(1)
Unallocated
holding
expenses
Consolidation
adjustments Total
Total Operating result 797 520 119 (83) (25) 1,328
Net earned premiums 10,910 5,284 - - - 16,194
Net insurance benefits and claims (12,905) (3,508) - - - (16,412)
of which var. of provisions related to unit linked business (1,185) - - - - (1,185)
Acquisition and administration costs (1,228) (1,442) (203) - - (2,873)
Net fee and commission income and net income from
financial service activities 24 - 218 - (34) 207
Operating income from other fin. Instruments 2,765 240 101 - 14 3,119
Operating income from fin. Instruments at fair value
through profit or loss 1,254 10 40 - - 1,304
of which net income from fin.assets and liabilities where the
risk is borne by the policyholders 1,102 - - - - 1,102
Operating holding expenses - - - (83) - (83)
Net other operating expenses (23) (63) (37) - (4) (126)
Non-operating result (86) (34) 21 (187) 1 (286)
Non-operating income from other fin.instr. (58) 19 29 - - (10)
Non-operating income from fin. instr.at fair value
through profit or loss - (8) - - - (8)
Non-operating holding expenses - - - (187) - (187)
Net other non-operating expenses (27) (45) (8) - 1 (80)
Earnings before taxes 712 486 140 (270) (24) 1,042
Reclassified P&L account by segment – 1Q13
IV. BACK UP
(1) Not reclassified according to the new layout based on operating margins and presented in the Consolidated Report
Assicurazioni Generali Group – 1Q 2013 results
42
IV. BACK UP
Focus on 1Q13 results
(1) Including investment contracts
(2) On like for like basis
(Euro m)
2Q11 3Q11 4Q11 1Q12 2Q12 3Q12 4Q12 1Q13
1Q13/
1Q12
Life premiums(1) 11,503 10,543 12,009 12,815 10,415 10,271 13,309 12,282 -4.7%
P&C premiums 5,219 4,931 5,823 6,999 5,419 5,027 5,359 6,863 +1.5%
Total premiums 16,722 15,474 17,832 19,814 15,834 15,298 18,668 19,145 -2.6%
Life net inflows 1,999 1,678 (651) 760 (1,138) 1,515 2,399 2,913 +269.3%
Combined ratio % 96.9% 96.7% 96.4% 95.4% 98.8% 95.7% 92.8% 93.5% -1.8%
Life operating result 782 315 564 819 832 545 462 797 -2.6%
P&C operating result 406 405 357 411 344 404 505 520 +26.6%
Financial operating result 96 68 63 126 85 109 88 119 -6.1%
Operating holding expenses
and cons. adj.
(132) (96) (155) (126) (148) (109) (128) (108) -14.5%
Total operating result 1,153 692 827 1,230 1 949 928 1,328 +8.0%
Net result 190 20 31 567 274 291 (1,043) 603 +6.3%
Assicurazioni Generali Group – 1Q 2013 results
43
IV. Backup
Agenda
P&L
Balance sheet
Life
Definitions
Assicurazioni Generali Group – 1Q 2013 results
44Consolidated balance sheet
(1) Including reinsurance amounts of technical reserve, deferred tax assets, deferred acquisition costs and other assets
(Euro bn) FY12 1Q13
Intangible assets 9.9 9.8
Investments
Cash
374.1
21.6
376.0
23.4
Other credits 11.1 13.1
Tangible assets 5.0 5.0
Other assets (1) 20.0 20.3
Total Assets 441.7 447.6
(Euro bn) FY12 1Q13
Shareholders’ Equity
(Group share) 19.8 18.8
Minority interests 2.7 1.9
Shareholders’ Equity 22.6 20.6
Operating debt 50.7 51.2
Financial debt 13.2 13.1
Technical reserves 336.4 340.9
Payables and other
provisions 9.5 10.1
Other liabilities 9.4 11.7
Total Liabilities and
Shareholders’ Equity 441.7 447.6
IV. BACK UP
Assicurazioni Generali Group – 1Q 2013 results
451Q13 Assets under management
Total
Euro 498.2 bn
Fixed income
instruments
Other
Real Estate
Equity
Available for sale Loans
Real Estate
Group
participations
Held to maturity
Fin. Instr. at fair
value thr. P&L
Unit Linked
Third parties AUM
“Own Investments”(1)
IV. BACK UP
(1) For definitions refer to the related section in the backup
Cash & equival.
Cash & equival.
101.9
62.9% 20.1%
3.7%
0.5%
2.3%
4.1% 6.4%
340.7
55.6
4.5%
3.6%
81.2%
4.4%
6.4%
Assicurazioni Generali Group – 1Q 2013 results
46Investment yields(1)
(1) For definitions refer to the related section in the backup.
IV. BACK UP
Return (%) 1Q12 1Q13 1Q12 1Q13 1Q12 1Q13 1Q12 1Q13 1Q12 1Q13
LIFE
Current 1.1 1.0 0.5 0.1 2.0 1.9 0.3 0.4 1.0 0.9
Total P&L 1.2 1.2 1.9 1.0 1.4 1.1 0.8 -0.4 1.2 1.1
Comprehensive 5.2 0.8 8.3 1.4 2.3 1.0 0.8 -0.4 4.8 0.7
NON LIFE
Current 1.0 0.8 0.4 0.5 2.1 1.7 0.2 0.6 1.0 0.9
Total P&L 1.1 0.9 -0.3 0.2 1.8 1.8 0.6 -0.9 0.9 0.9
Comprehensive 4.2 0.6 5.2 2.4 1.8 1.8 0.6 -0.8 3.4 0.8
TOTAL
Current 1.1 0.9 0.5 0.2 2.0 1.8 0.3 0.4 1.0 0.9
Total P&L 1.2 1.1 1.6 1.2 1.6 1.4 0.6 -0.3 1.1 1.0
Comprehensive 4.9 0.7 7.6 1.8 2.1 1.3 0.6 -0.3 4.4 0.7
Fixed Income Equities
Investment
Properties
Other Total
Assicurazioni Generali Group – 1Q 2013 results
47
425
681
1,850
(344)
2,530
(307)
(1,326)
196
270
(644)
1,032
(244)
1,308
1Q134Q123Q122Q121Q124Q113Q112Q111Q114Q103Q102Q101Q10
Total comprehensive income(1)
(Euro m)
3M10 6M10 9M10 12M10 3M11 6M11 9M11 12M11 3M12 6M12 9M12 12M12 3M13
1,308 1,064 2,096 1,452 270 466 (860) (1,166) 2,530 2,186 4,036 4,717 425
+4,000 m
-1,000 m
IV. BACK UP
(1) For definitions refer to the related section in the backup
Assicurazioni Generali Group – 1Q 2013 results
48AFS reserve breakdown
IV. BACK UP
(Euro m) FY11 FY12 1Q13
Fixed income instruments (1,780) 1,889 1,631
Government (1,216) 1,111 860
Corporate (564) 778 770
Equity (382) 549 578
Investment funds and other 7 152 198
TOTAL (2,156) 2,591 2,406
Assicurazioni Generali Group – 1Q 2013 results
49
IV. Backup
Agenda
P&L
Balance sheet
Life
Definitions
Assicurazioni Generali Group – 1Q 2013 results
50
Assicurazioni Generali Group – 1Q 2013 results
Life new business: APE
(Euro m) APE Annual Premiums Single Premiums
1Q12 1Q13
Like for like
 1Q12 1Q13
Like for like
 1Q12 1Q13
Like for like

Italy 416 401 -3.7% 258 261 +1.4% 1,584 1,395 -11.9%
France 432 248 -42.5% 134 112 -16.4% 2,983 1,367 -54.2%
Germany 217 303 +39.7% 168 173 +3.4% 494 1,299 +162.8%
CEE 39 36 -31.0% 34 34 -27.2% 45 23 -61.1%
RoE 165 169 +2.8% 109 99 -9.2% 554 699 +26.2%
Austria 24 25 +2.8% 19 19 +0.0% 44 51 +15.1%
Spain 29 38 +28.3% 13 14 +7.3% 159 233 +46.0%
Switzerland 24 18 -25.0% 22 17 -21.1% 19 6 -68.9%
RoW 60 56 -10.2% 50 43 -18.0% 97 133 +29.5%
Total 1,328 1,213 -9.7% 752 722 -5.8% 5,757 4,916 -14.9%
IV. BACK UP
51
Assicurazioni Generali Group – 1Q 2013 results
IV. Backup
P&L
Balance sheet
Life
Definitions
52
Assicurazioni Generali Group – 1Q 2013 results
Definitions: P&L and balance sheet (1/2)
IV. BACK UP
Investments Returns are calculated on quarterly average asset base at IFRS book value and are defined as follows:
Current return: interests, dividends and similar income (gross of investments related expenses)
Total P&L return: = current return + harvesting return (net realized gains, net impairments and net unrealized
gains reported in P&L) – investments related expenses
Comprehensive return:
i) for fair value investment (AFS, FVthPL) = current return + total change in fair value;
ii) for investment at amortised cost (Real estates, loans, HtM) = Total P&L return
Investment returns for Life segment include income from bonds and loans issued by Group companies and
investments in consolidated subsidiaries backing policyholders’ liabilities
Life Net Inflows Premiums inflows in the period less benefits paid to the policyholders. It does not include revaluation of
mathematical reserves
Life Operating Result consists of the following elements:
i) "Technical Margin" includes loadings, risk result, surrender result; it is gross of acquisition and administration costs
ii) "Investment Result" includes interests and dividends, interest expenses on operating debt, G/L on foreign currency
and investment expenses, net of policyholder benefits; it includes also operating realised and unrealised G/L, net of
policyholder benefits
iii) "Expenses" include acquisition and administration costs and other net operating items (it does not consider any
loading charged to policyholders)
“Operating ratio on Investments” is calculated as Operating result on the average of Investments at book
value
Like for Like changes The change of written premiums, net cash inflow, APE and NBV is on equivalent terms (on equivalent
exchange rates and consolidation area).
Operating Result Operating result of life, P&C and financial segments, before holding expenses and consolidation adjustments
53
Assicurazioni Generali Group – 1Q 2013 results
Own Investments do not include unit/index linked investments and consist of the following asset class (*):
i) Fixed income instruments as quoted and unquoted bonds, loans including deposits under reinsurance business
accepted and term deposits with credit institutions
ii) Equity-like instruments as quoted and unquoted equities and alternative investments
iii) Real estate investments excluding own used properties
iv) Cash and cash equivalent including Repo and Reverse repo
v) Other investments as investments in non-consolidated subsidiaries, derivatives, receivables from banks or customers
(*) Investment fund units are allocated to each asset class on a look through basis
Own investments for life segment include bonds and loans issued by Group companies and investments in
consolidated subsidiaries backing policyholders’ liabilities.
P&C Operating Result consists of the following elements:
I) "Technical Result" is net of acquisition and administration costs
ii) "Investment Result" includes interests and dividends, interest expenses on operating debt and investment expenses
iii) “Other" includes other net operating items not considered in Technical Result and in Investment Result
“Operating ratio on Investments” is calculated as Operating result on the average of Investments at book
value
Total Comprehensive
Income
Change in shareholders’ equity during the period related to income and expenses recognized in profit or loss
or directly in shareholders’ equity resulting from transactions and events other than transactions with equity
Owners.
Total Operating Result Operating result of life, P&C and financial segments, after holding expenses and consolidation adjustments.
Operating result is a non-GAAP indicator and may differ from similar measure presented by other companies.
Management uses this non-GAAP measure as key indicator in assessing Generali’s performance and believes
that the presentation of these KPI provide useful and relevant information's to shareholders and users on
Generali’s performance. Please refer to the ‘Methodological note on alternative performance measures’
included in the Management Report for details on operating result methodology.”
Definitions: P&L and balance sheet (2/2)
IV. BACK UP
54
Assicurazioni Generali Group – 1Q 2013 results
Definitions: Life new business value and profitability
IV. BACK UP
Annual Premium
Equivalent (APE)
is defined as new business annualised regular premiums plus 10% of single premiums
New Business Value
(NBV)
is the present value, at point of sale, of the projected stream of after tax industrial profits expected to be
generated by the covered new business written in the quarter, taking into account the actual acquisition costs,
after allowance for:
 the cost of financial guarantees and options granted to policyholders;
 the frictional costs of setting up and holding the required capital;
 the cost of non hedgeable risks.
Each quarterly NBV is calculated using beginning of period economic and operating assumptions.
Full-year NBV is calculated as the algebraic sum of the NBV of each quarter.
Margin on APE
(NBM)
is defined as the NBV divided by the APE
55
Assicurazioni Generali Group – 1Q 2013 results
What’s next
August 2, 2013 - 1H 2013 Results
November 8, 2013 - 9M 2013 Results
November 27, 2013 - Investor Day
56Investor Relations Team
Spencer Horgan (Tel.: +44-20-72656480)
Head of Investor Relations
Email: spencer_horgan@generali.com
Stefano Burrino (Tel.: +39-040-671202)
Email: stefano_burrino@generali.com
Emanuele Marciante (Tel.: +39-040-671347)
Email: emanuele_marciante@generali.com
Veronica Cherini (Tel.: +39-040-671488)
Email: veronica_cherini@generali.com
Rodolfo Svara (Tel.: +39-040-671823)
Email: rodolfo_svara@generali.com
Martina Vono (Tel.: +39-040-671402)
IR Events
Email: martina_vono@generali.com
Assicurazioni Generali
P.za Duca degli Abruzzi 2
34132 Trieste, Italy
Fax: +39 040 671338
e-mail: generali_ir@generali.com
www.generali.com
Assicurazioni Generali Group – 1Q 2013 results
57Disclaimer
Certain of the statements contained herein are statements of future expectations and
other forward-looking statements.
These expectations are based on management's current views and assumptions and
involve known and unknown risks and uncertainties.
The user of such information should recognise that actual results, performance or events
may differ materially from such expectations because they relate to future events and
circumstances which are beyond our control including, among other things, general
economic and sector conditions.
Neither Assicurazioni Generali S.p.A. nor any of its affiliates, directors, officers
employees or agents owe any duty of care towards any user of the information provided
herein nor any obligation to update any forward-looking information contained in this
document.
The manager charged with preparing the company’s financial reports, Alberto Minali,
declares, pursuant to paragraph 2 of article 154-bis of the Consolidated Law on Financial
Intermediation, that the accounting information contained in this presentation
corresponds to document results, books and accounts records.
Assicurazioni Generali Group – 1Q 2013 results
March 2006
May 10, 2013
Generali Group
1Q 2013 Results

More Related Content

What's hot

Generali Group 2015 First Half Results
Generali Group 2015 First Half ResultsGenerali Group 2015 First Half Results
Generali Group 2015 First Half ResultsGenerali
 
1 q12 results presentation
1 q12 results presentation1 q12 results presentation
1 q12 results presentationTriunfoRi
 
Generali Group 9M Results 2014
Generali Group 9M Results 2014Generali Group 9M Results 2014
Generali Group 9M Results 2014Generali
 
TenCate annual results 2012
TenCate annual results 2012TenCate annual results 2012
TenCate annual results 2012TenCate
 
Generali Group 2013 Full Year Results
Generali Group 2013 Full Year ResultsGenerali Group 2013 Full Year Results
Generali Group 2013 Full Year ResultsGenerali
 
Generali Group Results at 31 December 2015
Generali Group Results at 31 December 2015Generali Group Results at 31 December 2015
Generali Group Results at 31 December 2015Generali
 
ERG - Fourth Quarter and 2013 Results
ERG - Fourth Quarter and 2013 Results ERG - Fourth Quarter and 2013 Results
ERG - Fourth Quarter and 2013 Results ERG S.p.A.
 
2016 Investor Day Presentation
2016 Investor Day Presentation2016 Investor Day Presentation
2016 Investor Day PresentationGenerali
 
Palfinger 2013 Interim Presentation
Palfinger 2013 Interim PresentationPalfinger 2013 Interim Presentation
Palfinger 2013 Interim PresentationCompany Spotlight
 
Altran_20110314_PR_EN_01
Altran_20110314_PR_EN_01Altran_20110314_PR_EN_01
Altran_20110314_PR_EN_01David NICOLAS
 
2015 Investor Day Presentation
2015 Investor Day Presentation2015 Investor Day Presentation
2015 Investor Day PresentationGenerali
 
KlĂśckner & Co - Credit Suisse Global Steel and Mining Conference, September 1...
KlĂśckner & Co - Credit Suisse Global Steel and Mining Conference, September 1...KlĂśckner & Co - Credit Suisse Global Steel and Mining Conference, September 1...
KlĂśckner & Co - Credit Suisse Global Steel and Mining Conference, September 1...KlĂśckner & Co SE
 
credit-suisse Slides - Presentation to analysts and media
credit-suisse Slides - Presentation to analysts and mediacredit-suisse Slides - Presentation to analysts and media
credit-suisse Slides - Presentation to analysts and mediaQuarterlyEarningsReports2
 
ERG - First Quarter 2013 Results
ERG - First Quarter 2013 ResultsERG - First Quarter 2013 Results
ERG - First Quarter 2013 ResultsERG S.p.A.
 
KlĂśckner & Co - UBS Best of Germany Conference, September 17, 2013
KlĂśckner & Co - UBS Best of Germany Conference, September 17, 2013KlĂśckner & Co - UBS Best of Germany Conference, September 17, 2013
KlĂśckner & Co - UBS Best of Germany Conference, September 17, 2013KlĂśckner & Co SE
 
Full Year Results - Infographic
Full Year Results - InfographicFull Year Results - Infographic
Full Year Results - InfographicGenerali
 

What's hot (17)

Generali Group 2015 First Half Results
Generali Group 2015 First Half ResultsGenerali Group 2015 First Half Results
Generali Group 2015 First Half Results
 
1 q12 results presentation
1 q12 results presentation1 q12 results presentation
1 q12 results presentation
 
Generali Group 9M Results 2014
Generali Group 9M Results 2014Generali Group 9M Results 2014
Generali Group 9M Results 2014
 
TenCate annual results 2012
TenCate annual results 2012TenCate annual results 2012
TenCate annual results 2012
 
Generali Group 2013 Full Year Results
Generali Group 2013 Full Year ResultsGenerali Group 2013 Full Year Results
Generali Group 2013 Full Year Results
 
Generali Group Results at 31 December 2015
Generali Group Results at 31 December 2015Generali Group Results at 31 December 2015
Generali Group Results at 31 December 2015
 
ERG - Fourth Quarter and 2013 Results
ERG - Fourth Quarter and 2013 Results ERG - Fourth Quarter and 2013 Results
ERG - Fourth Quarter and 2013 Results
 
2016 Investor Day Presentation
2016 Investor Day Presentation2016 Investor Day Presentation
2016 Investor Day Presentation
 
Palfinger 2013 Interim Presentation
Palfinger 2013 Interim PresentationPalfinger 2013 Interim Presentation
Palfinger 2013 Interim Presentation
 
Altran_20110314_PR_EN_01
Altran_20110314_PR_EN_01Altran_20110314_PR_EN_01
Altran_20110314_PR_EN_01
 
2015 Investor Day Presentation
2015 Investor Day Presentation2015 Investor Day Presentation
2015 Investor Day Presentation
 
KlĂśckner & Co - Credit Suisse Global Steel and Mining Conference, September 1...
KlĂśckner & Co - Credit Suisse Global Steel and Mining Conference, September 1...KlĂśckner & Co - Credit Suisse Global Steel and Mining Conference, September 1...
KlĂśckner & Co - Credit Suisse Global Steel and Mining Conference, September 1...
 
credit-suisse Slides - Presentation to analysts and media
credit-suisse Slides - Presentation to analysts and mediacredit-suisse Slides - Presentation to analysts and media
credit-suisse Slides - Presentation to analysts and media
 
credit-suisse Presentation slides
 credit-suisse Presentation slides credit-suisse Presentation slides
credit-suisse Presentation slides
 
ERG - First Quarter 2013 Results
ERG - First Quarter 2013 ResultsERG - First Quarter 2013 Results
ERG - First Quarter 2013 Results
 
KlĂśckner & Co - UBS Best of Germany Conference, September 17, 2013
KlĂśckner & Co - UBS Best of Germany Conference, September 17, 2013KlĂśckner & Co - UBS Best of Germany Conference, September 17, 2013
KlĂśckner & Co - UBS Best of Germany Conference, September 17, 2013
 
Full Year Results - Infographic
Full Year Results - InfographicFull Year Results - Infographic
Full Year Results - Infographic
 

Viewers also liked

2014 Generali Full Year Results
2014 Generali Full Year Results2014 Generali Full Year Results
2014 Generali Full Year ResultsGenerali
 
Generali Group 2012 Results
Generali Group 2012 ResultsGenerali Group 2012 Results
Generali Group 2012 ResultsGenerali
 
Investor Day
Investor DayInvestor Day
Investor DayGenerali
 
Generali Group 2014 First Half Results
Generali Group 2014 First Half ResultsGenerali Group 2014 First Half Results
Generali Group 2014 First Half ResultsGenerali
 
Investor Day
Investor DayInvestor Day
Investor DayGenerali
 
Generali Group 2013 First Half Results
Generali Group 2013 First Half ResultsGenerali Group 2013 First Half Results
Generali Group 2013 First Half ResultsGenerali
 
Reshaping Generali: Discipline, simplicity and focus
Reshaping Generali: Discipline, simplicity and focus Reshaping Generali: Discipline, simplicity and focus
Reshaping Generali: Discipline, simplicity and focus Generali
 

Viewers also liked (7)

2014 Generali Full Year Results
2014 Generali Full Year Results2014 Generali Full Year Results
2014 Generali Full Year Results
 
Generali Group 2012 Results
Generali Group 2012 ResultsGenerali Group 2012 Results
Generali Group 2012 Results
 
Investor Day
Investor DayInvestor Day
Investor Day
 
Generali Group 2014 First Half Results
Generali Group 2014 First Half ResultsGenerali Group 2014 First Half Results
Generali Group 2014 First Half Results
 
Investor Day
Investor DayInvestor Day
Investor Day
 
Generali Group 2013 First Half Results
Generali Group 2013 First Half ResultsGenerali Group 2013 First Half Results
Generali Group 2013 First Half Results
 
Reshaping Generali: Discipline, simplicity and focus
Reshaping Generali: Discipline, simplicity and focus Reshaping Generali: Discipline, simplicity and focus
Reshaping Generali: Discipline, simplicity and focus
 

Similar to How to Optimize Your Website for Search Engines

Generali Grup 9M 2010 Results
Generali Grup 9M 2010 ResultsGenerali Grup 9M 2010 Results
Generali Grup 9M 2010 ResultsGenerali
 
Generali Group 2010 first half results
Generali Group 2010 first half resultsGenerali Group 2010 first half results
Generali Group 2010 first half resultsGenerali
 
Full year results 2012
Full year results 2012Full year results 2012
Full year results 2012Ageas
 
Telecom Italia - Interim Report at March 31, 2013
Telecom Italia - Interim Report at March 31, 2013Telecom Italia - Interim Report at March 31, 2013
Telecom Italia - Interim Report at March 31, 2013Gruppo TIM
 
Presentation Q2 2013 for SpareBank 1 Gruppen - English version
Presentation Q2 2013 for SpareBank 1 Gruppen - English versionPresentation Q2 2013 for SpareBank 1 Gruppen - English version
Presentation Q2 2013 for SpareBank 1 Gruppen - English versionSpareBank 1 Gruppen AS
 
3M results 2013
3M results 20133M results 2013
3M results 2013Ageas
 
Morgan Stanley European Financials conference 2013
Morgan Stanley European Financials conference 2013Morgan Stanley European Financials conference 2013
Morgan Stanley European Financials conference 2013Ageas
 
9M results 2012
9M results 20129M results 2012
9M results 2012Ageas
 
RECTICEL Analyst Meeting 1H2013 Results
RECTICEL Analyst Meeting 1H2013 ResultsRECTICEL Analyst Meeting 1H2013 Results
RECTICEL Analyst Meeting 1H2013 ResultsRecticel NV/SA
 
Q1 2013 Results
Q1 2013 ResultsQ1 2013 Results
Q1 2013 Resultsacciona
 
9M results 2014 - press presentation
9M results 2014 - press presentation 9M results 2014 - press presentation
9M results 2014 - press presentation Ageas
 
9M 2015 Results - Periodical Financials Information
9M 2015 Results - Periodical Financials Information9M 2015 Results - Periodical Financials Information
9M 2015 Results - Periodical Financials InformationAgeas
 
ACCIONA H1 2015 results
ACCIONA H1 2015 resultsACCIONA H1 2015 results
ACCIONA H1 2015 resultsacciona
 
Elringklinger - Conference Call Q1 2014 Presentation
Elringklinger - Conference Call Q1 2014 Presentation Elringklinger - Conference Call Q1 2014 Presentation
Elringklinger - Conference Call Q1 2014 Presentation Company Spotlight
 
6M results 2013
6M results 20136M results 2013
6M results 2013Ageas
 

Similar to How to Optimize Your Website for Search Engines (20)

Allianz: Group Financial Results 2013
Allianz: Group Financial Results 2013Allianz: Group Financial Results 2013
Allianz: Group Financial Results 2013
 
Generali Grup 9M 2010 Results
Generali Grup 9M 2010 ResultsGenerali Grup 9M 2010 Results
Generali Grup 9M 2010 Results
 
Generali Group 2010 first half results
Generali Group 2010 first half resultsGenerali Group 2010 first half results
Generali Group 2010 first half results
 
1 h2013 results 29_7
1 h2013 results 29_71 h2013 results 29_7
1 h2013 results 29_7
 
Full year results 2012
Full year results 2012Full year results 2012
Full year results 2012
 
Telecom Italia - Interim Report at March 31, 2013
Telecom Italia - Interim Report at March 31, 2013Telecom Italia - Interim Report at March 31, 2013
Telecom Italia - Interim Report at March 31, 2013
 
Presentation Q2 2013 for SpareBank 1 Gruppen - English version
Presentation Q2 2013 for SpareBank 1 Gruppen - English versionPresentation Q2 2013 for SpareBank 1 Gruppen - English version
Presentation Q2 2013 for SpareBank 1 Gruppen - English version
 
3M results 2013
3M results 20133M results 2013
3M results 2013
 
CIR Fy 2013 results
CIR Fy 2013 resultsCIR Fy 2013 results
CIR Fy 2013 results
 
Morgan Stanley European Financials conference 2013
Morgan Stanley European Financials conference 2013Morgan Stanley European Financials conference 2013
Morgan Stanley European Financials conference 2013
 
Risultati 2013 Generali
Risultati 2013 GeneraliRisultati 2013 Generali
Risultati 2013 Generali
 
9M results 2012
9M results 20129M results 2012
9M results 2012
 
RECTICEL Analyst Meeting 1H2013 Results
RECTICEL Analyst Meeting 1H2013 ResultsRECTICEL Analyst Meeting 1H2013 Results
RECTICEL Analyst Meeting 1H2013 Results
 
Q1 2013 Results
Q1 2013 ResultsQ1 2013 Results
Q1 2013 Results
 
9M results 2014 - press presentation
9M results 2014 - press presentation 9M results 2014 - press presentation
9M results 2014 - press presentation
 
9M 2015 Results - Periodical Financials Information
9M 2015 Results - Periodical Financials Information9M 2015 Results - Periodical Financials Information
9M 2015 Results - Periodical Financials Information
 
ACCIONA H1 2015 results
ACCIONA H1 2015 resultsACCIONA H1 2015 results
ACCIONA H1 2015 results
 
CIR 1Q 2014 Results
CIR 1Q 2014 ResultsCIR 1Q 2014 Results
CIR 1Q 2014 Results
 
Elringklinger - Conference Call Q1 2014 Presentation
Elringklinger - Conference Call Q1 2014 Presentation Elringklinger - Conference Call Q1 2014 Presentation
Elringklinger - Conference Call Q1 2014 Presentation
 
6M results 2013
6M results 20136M results 2013
6M results 2013
 

More from Generali

2017 First Half Results - Infographics
2017 First Half Results - Infographics 2017 First Half Results - Infographics
2017 First Half Results - Infographics Generali
 
Generali Group 2017 First Half Results
Generali Group 2017 First Half ResultsGenerali Group 2017 First Half Results
Generali Group 2017 First Half ResultsGenerali
 
Asset Management Strategy for Generali in Europe - Presentation
Asset Management Strategy for Generali in Europe - PresentationAsset Management Strategy for Generali in Europe - Presentation
Asset Management Strategy for Generali in Europe - PresentationGenerali
 
2016 Full Years Results - Infographics
2016 Full Years Results - Infographics2016 Full Years Results - Infographics
2016 Full Years Results - InfographicsGenerali
 
Generali Group Results at 31 December 2016
Generali Group Results at 31 December 2016Generali Group Results at 31 December 2016
Generali Group Results at 31 December 2016Generali
 
2016 Nine Month Results - Infographics
2016 Nine Month Results - Infographics2016 Nine Month Results - Infographics
2016 Nine Month Results - InfographicsGenerali
 
2016 First Half Results - Infographics
2016 First Half Results - Infographics2016 First Half Results - Infographics
2016 First Half Results - InfographicsGenerali
 
2015 Full Years Results - Infographics
2015 Full Years Results - Infographics 2015 Full Years Results - Infographics
2015 Full Years Results - Infographics Generali
 
9M 2015 Results – Infographics
9M 2015 Results – Infographics 9M 2015 Results – Infographics
9M 2015 Results – Infographics Generali
 
1Q 2015 results - Infographic
1Q 2015 results - Infographic1Q 2015 results - Infographic
1Q 2015 results - InfographicGenerali
 
9M Results – Infographics
9M Results – Infographics9M Results – Infographics
9M Results – InfographicsGenerali
 
The Image - The Generali Group and the Art of Advertising - I
The Image - The Generali Group and the Art of Advertising - IThe Image - The Generali Group and the Art of Advertising - I
The Image - The Generali Group and the Art of Advertising - IGenerali
 
The Image - The Generali Group and the Art of Advertising - II
The Image - The Generali Group and the Art of Advertising - IIThe Image - The Generali Group and the Art of Advertising - II
The Image - The Generali Group and the Art of Advertising - IIGenerali
 

More from Generali (13)

2017 First Half Results - Infographics
2017 First Half Results - Infographics 2017 First Half Results - Infographics
2017 First Half Results - Infographics
 
Generali Group 2017 First Half Results
Generali Group 2017 First Half ResultsGenerali Group 2017 First Half Results
Generali Group 2017 First Half Results
 
Asset Management Strategy for Generali in Europe - Presentation
Asset Management Strategy for Generali in Europe - PresentationAsset Management Strategy for Generali in Europe - Presentation
Asset Management Strategy for Generali in Europe - Presentation
 
2016 Full Years Results - Infographics
2016 Full Years Results - Infographics2016 Full Years Results - Infographics
2016 Full Years Results - Infographics
 
Generali Group Results at 31 December 2016
Generali Group Results at 31 December 2016Generali Group Results at 31 December 2016
Generali Group Results at 31 December 2016
 
2016 Nine Month Results - Infographics
2016 Nine Month Results - Infographics2016 Nine Month Results - Infographics
2016 Nine Month Results - Infographics
 
2016 First Half Results - Infographics
2016 First Half Results - Infographics2016 First Half Results - Infographics
2016 First Half Results - Infographics
 
2015 Full Years Results - Infographics
2015 Full Years Results - Infographics 2015 Full Years Results - Infographics
2015 Full Years Results - Infographics
 
9M 2015 Results – Infographics
9M 2015 Results – Infographics 9M 2015 Results – Infographics
9M 2015 Results – Infographics
 
1Q 2015 results - Infographic
1Q 2015 results - Infographic1Q 2015 results - Infographic
1Q 2015 results - Infographic
 
9M Results – Infographics
9M Results – Infographics9M Results – Infographics
9M Results – Infographics
 
The Image - The Generali Group and the Art of Advertising - I
The Image - The Generali Group and the Art of Advertising - IThe Image - The Generali Group and the Art of Advertising - I
The Image - The Generali Group and the Art of Advertising - I
 
The Image - The Generali Group and the Art of Advertising - II
The Image - The Generali Group and the Art of Advertising - IIThe Image - The Generali Group and the Art of Advertising - II
The Image - The Generali Group and the Art of Advertising - II
 

Recently uploaded

The CMO Survey - Highlights and Insights Report - Spring 2024
The CMO Survey - Highlights and Insights Report - Spring 2024The CMO Survey - Highlights and Insights Report - Spring 2024
The CMO Survey - Highlights and Insights Report - Spring 2024christinemoorman
 
Vip Female Escorts Noida 9711199171 Greater Noida Escorts Service
Vip Female Escorts Noida 9711199171 Greater Noida Escorts ServiceVip Female Escorts Noida 9711199171 Greater Noida Escorts Service
Vip Female Escorts Noida 9711199171 Greater Noida Escorts Serviceankitnayak356677
 
Lucknow 💋 Escorts in Lucknow - 450+ Call Girl Cash Payment 8923113531 Neha Th...
Lucknow 💋 Escorts in Lucknow - 450+ Call Girl Cash Payment 8923113531 Neha Th...Lucknow 💋 Escorts in Lucknow - 450+ Call Girl Cash Payment 8923113531 Neha Th...
Lucknow 💋 Escorts in Lucknow - 450+ Call Girl Cash Payment 8923113531 Neha Th...anilsa9823
 
Grateful 7 speech thanking everyone that has helped.pdf
Grateful 7 speech thanking everyone that has helped.pdfGrateful 7 speech thanking everyone that has helped.pdf
Grateful 7 speech thanking everyone that has helped.pdfPaul Menig
 
Keppel Ltd. 1Q 2024 Business Update Presentation Slides
Keppel Ltd. 1Q 2024 Business Update  Presentation SlidesKeppel Ltd. 1Q 2024 Business Update  Presentation Slides
Keppel Ltd. 1Q 2024 Business Update Presentation SlidesKeppelCorporation
 
0183760ssssssssssssssssssssssssssss00101011 (27).pdf
0183760ssssssssssssssssssssssssssss00101011 (27).pdf0183760ssssssssssssssssssssssssssss00101011 (27).pdf
0183760ssssssssssssssssssssssssssss00101011 (27).pdfRenandantas16
 
VIP Call Girl Jamshedpur Aashi 8250192130 Independent Escort Service Jamshedpur
VIP Call Girl Jamshedpur Aashi 8250192130 Independent Escort Service JamshedpurVIP Call Girl Jamshedpur Aashi 8250192130 Independent Escort Service Jamshedpur
VIP Call Girl Jamshedpur Aashi 8250192130 Independent Escort Service JamshedpurSuhani Kapoor
 
Sales & Marketing Alignment: How to Synergize for Success
Sales & Marketing Alignment: How to Synergize for SuccessSales & Marketing Alignment: How to Synergize for Success
Sales & Marketing Alignment: How to Synergize for SuccessAggregage
 
Insurers' journeys to build a mastery in the IoT usage
Insurers' journeys to build a mastery in the IoT usageInsurers' journeys to build a mastery in the IoT usage
Insurers' journeys to build a mastery in the IoT usageMatteo Carbone
 
Call Girls In Connaught Place Delhi ❤️88604**77959_Russian 100% Genuine Escor...
Call Girls In Connaught Place Delhi ❤️88604**77959_Russian 100% Genuine Escor...Call Girls In Connaught Place Delhi ❤️88604**77959_Russian 100% Genuine Escor...
Call Girls In Connaught Place Delhi ❤️88604**77959_Russian 100% Genuine Escor...lizamodels9
 
Intro to BCG's Carbon Emissions Benchmark_vF.pdf
Intro to BCG's Carbon Emissions Benchmark_vF.pdfIntro to BCG's Carbon Emissions Benchmark_vF.pdf
Intro to BCG's Carbon Emissions Benchmark_vF.pdfpollardmorgan
 
Call Girls In Sikandarpur Gurgaon ❤️8860477959_Russian 100% Genuine Escorts I...
Call Girls In Sikandarpur Gurgaon ❤️8860477959_Russian 100% Genuine Escorts I...Call Girls In Sikandarpur Gurgaon ❤️8860477959_Russian 100% Genuine Escorts I...
Call Girls In Sikandarpur Gurgaon ❤️8860477959_Russian 100% Genuine Escorts I...lizamodels9
 
A DAY IN THE LIFE OF A SALESMAN / WOMAN
A DAY IN THE LIFE OF A  SALESMAN / WOMANA DAY IN THE LIFE OF A  SALESMAN / WOMAN
A DAY IN THE LIFE OF A SALESMAN / WOMANIlamathiKannappan
 
Mondelez State of Snacking and Future Trends 2023
Mondelez State of Snacking and Future Trends 2023Mondelez State of Snacking and Future Trends 2023
Mondelez State of Snacking and Future Trends 2023Neil Kimberley
 
Forklift Operations: Safety through Cartoons
Forklift Operations: Safety through CartoonsForklift Operations: Safety through Cartoons
Forklift Operations: Safety through CartoonsForklift Trucks in Minnesota
 
Call Girls In Sikandarpur Gurgaon ❤️8860477959_Russian 100% Genuine Escorts I...
Call Girls In Sikandarpur Gurgaon ❤️8860477959_Russian 100% Genuine Escorts I...Call Girls In Sikandarpur Gurgaon ❤️8860477959_Russian 100% Genuine Escorts I...
Call Girls In Sikandarpur Gurgaon ❤️8860477959_Russian 100% Genuine Escorts I...lizamodels9
 
Progress Report - Oracle Database Analyst Summit
Progress  Report - Oracle Database Analyst SummitProgress  Report - Oracle Database Analyst Summit
Progress Report - Oracle Database Analyst SummitHolger Mueller
 
Lowrate Call Girls In Sector 18 Noida ❤️8860477959 Escorts 100% Genuine Servi...
Lowrate Call Girls In Sector 18 Noida ❤️8860477959 Escorts 100% Genuine Servi...Lowrate Call Girls In Sector 18 Noida ❤️8860477959 Escorts 100% Genuine Servi...
Lowrate Call Girls In Sector 18 Noida ❤️8860477959 Escorts 100% Genuine Servi...lizamodels9
 
Cash Payment 9602870969 Escort Service in Udaipur Call Girls
Cash Payment 9602870969 Escort Service in Udaipur Call GirlsCash Payment 9602870969 Escort Service in Udaipur Call Girls
Cash Payment 9602870969 Escort Service in Udaipur Call GirlsApsara Of India
 
BEST Call Girls In Old Faridabad ✨ 9773824855 ✨ Escorts Service In Delhi Ncr,
BEST Call Girls In Old Faridabad ✨ 9773824855 ✨ Escorts Service In Delhi Ncr,BEST Call Girls In Old Faridabad ✨ 9773824855 ✨ Escorts Service In Delhi Ncr,
BEST Call Girls In Old Faridabad ✨ 9773824855 ✨ Escorts Service In Delhi Ncr,noida100girls
 

Recently uploaded (20)

The CMO Survey - Highlights and Insights Report - Spring 2024
The CMO Survey - Highlights and Insights Report - Spring 2024The CMO Survey - Highlights and Insights Report - Spring 2024
The CMO Survey - Highlights and Insights Report - Spring 2024
 
Vip Female Escorts Noida 9711199171 Greater Noida Escorts Service
Vip Female Escorts Noida 9711199171 Greater Noida Escorts ServiceVip Female Escorts Noida 9711199171 Greater Noida Escorts Service
Vip Female Escorts Noida 9711199171 Greater Noida Escorts Service
 
Lucknow 💋 Escorts in Lucknow - 450+ Call Girl Cash Payment 8923113531 Neha Th...
Lucknow 💋 Escorts in Lucknow - 450+ Call Girl Cash Payment 8923113531 Neha Th...Lucknow 💋 Escorts in Lucknow - 450+ Call Girl Cash Payment 8923113531 Neha Th...
Lucknow 💋 Escorts in Lucknow - 450+ Call Girl Cash Payment 8923113531 Neha Th...
 
Grateful 7 speech thanking everyone that has helped.pdf
Grateful 7 speech thanking everyone that has helped.pdfGrateful 7 speech thanking everyone that has helped.pdf
Grateful 7 speech thanking everyone that has helped.pdf
 
Keppel Ltd. 1Q 2024 Business Update Presentation Slides
Keppel Ltd. 1Q 2024 Business Update  Presentation SlidesKeppel Ltd. 1Q 2024 Business Update  Presentation Slides
Keppel Ltd. 1Q 2024 Business Update Presentation Slides
 
0183760ssssssssssssssssssssssssssss00101011 (27).pdf
0183760ssssssssssssssssssssssssssss00101011 (27).pdf0183760ssssssssssssssssssssssssssss00101011 (27).pdf
0183760ssssssssssssssssssssssssssss00101011 (27).pdf
 
VIP Call Girl Jamshedpur Aashi 8250192130 Independent Escort Service Jamshedpur
VIP Call Girl Jamshedpur Aashi 8250192130 Independent Escort Service JamshedpurVIP Call Girl Jamshedpur Aashi 8250192130 Independent Escort Service Jamshedpur
VIP Call Girl Jamshedpur Aashi 8250192130 Independent Escort Service Jamshedpur
 
Sales & Marketing Alignment: How to Synergize for Success
Sales & Marketing Alignment: How to Synergize for SuccessSales & Marketing Alignment: How to Synergize for Success
Sales & Marketing Alignment: How to Synergize for Success
 
Insurers' journeys to build a mastery in the IoT usage
Insurers' journeys to build a mastery in the IoT usageInsurers' journeys to build a mastery in the IoT usage
Insurers' journeys to build a mastery in the IoT usage
 
Call Girls In Connaught Place Delhi ❤️88604**77959_Russian 100% Genuine Escor...
Call Girls In Connaught Place Delhi ❤️88604**77959_Russian 100% Genuine Escor...Call Girls In Connaught Place Delhi ❤️88604**77959_Russian 100% Genuine Escor...
Call Girls In Connaught Place Delhi ❤️88604**77959_Russian 100% Genuine Escor...
 
Intro to BCG's Carbon Emissions Benchmark_vF.pdf
Intro to BCG's Carbon Emissions Benchmark_vF.pdfIntro to BCG's Carbon Emissions Benchmark_vF.pdf
Intro to BCG's Carbon Emissions Benchmark_vF.pdf
 
Call Girls In Sikandarpur Gurgaon ❤️8860477959_Russian 100% Genuine Escorts I...
Call Girls In Sikandarpur Gurgaon ❤️8860477959_Russian 100% Genuine Escorts I...Call Girls In Sikandarpur Gurgaon ❤️8860477959_Russian 100% Genuine Escorts I...
Call Girls In Sikandarpur Gurgaon ❤️8860477959_Russian 100% Genuine Escorts I...
 
A DAY IN THE LIFE OF A SALESMAN / WOMAN
A DAY IN THE LIFE OF A  SALESMAN / WOMANA DAY IN THE LIFE OF A  SALESMAN / WOMAN
A DAY IN THE LIFE OF A SALESMAN / WOMAN
 
Mondelez State of Snacking and Future Trends 2023
Mondelez State of Snacking and Future Trends 2023Mondelez State of Snacking and Future Trends 2023
Mondelez State of Snacking and Future Trends 2023
 
Forklift Operations: Safety through Cartoons
Forklift Operations: Safety through CartoonsForklift Operations: Safety through Cartoons
Forklift Operations: Safety through Cartoons
 
Call Girls In Sikandarpur Gurgaon ❤️8860477959_Russian 100% Genuine Escorts I...
Call Girls In Sikandarpur Gurgaon ❤️8860477959_Russian 100% Genuine Escorts I...Call Girls In Sikandarpur Gurgaon ❤️8860477959_Russian 100% Genuine Escorts I...
Call Girls In Sikandarpur Gurgaon ❤️8860477959_Russian 100% Genuine Escorts I...
 
Progress Report - Oracle Database Analyst Summit
Progress  Report - Oracle Database Analyst SummitProgress  Report - Oracle Database Analyst Summit
Progress Report - Oracle Database Analyst Summit
 
Lowrate Call Girls In Sector 18 Noida ❤️8860477959 Escorts 100% Genuine Servi...
Lowrate Call Girls In Sector 18 Noida ❤️8860477959 Escorts 100% Genuine Servi...Lowrate Call Girls In Sector 18 Noida ❤️8860477959 Escorts 100% Genuine Servi...
Lowrate Call Girls In Sector 18 Noida ❤️8860477959 Escorts 100% Genuine Servi...
 
Cash Payment 9602870969 Escort Service in Udaipur Call Girls
Cash Payment 9602870969 Escort Service in Udaipur Call GirlsCash Payment 9602870969 Escort Service in Udaipur Call Girls
Cash Payment 9602870969 Escort Service in Udaipur Call Girls
 
BEST Call Girls In Old Faridabad ✨ 9773824855 ✨ Escorts Service In Delhi Ncr,
BEST Call Girls In Old Faridabad ✨ 9773824855 ✨ Escorts Service In Delhi Ncr,BEST Call Girls In Old Faridabad ✨ 9773824855 ✨ Escorts Service In Delhi Ncr,
BEST Call Girls In Old Faridabad ✨ 9773824855 ✨ Escorts Service In Delhi Ncr,
 

How to Optimize Your Website for Search Engines

  • 1. May 10, 2013 Generali Group 1Q 2013 Results
  • 2. 2 Assicurazioni Generali Group – 1Q 2013 results Agenda I. Overview II. Group financials III. Final remarks IV. Backup Page 3 Page 5 Page 24 Page 26
  • 3. 3Agenda I. Overview 1Q 2013 results at a glance Assicurazioni Generali Group – 1Q 2013 results
  • 4. 4 Assicurazioni Generali Group – 1Q 2013 results Operating result (Euro m) 1,230 1,328 +8.0% 1Q12 1Q13 1Q12 1Q13 1Q 2013 results at a glance I. OVERVIEW Shareholders’ equity (Euro m) 19,013 18,775 -1.2%(1) 01/01/13 1Q13 Solvency I ratio (%) 1Q13 603567 +6.3% Net result (Euro m) 145 138 -7%pts.(1) (1) FY12 shareholders’ equity was restated (- Euro 815 m) to include the effects of revised IAS 19 01/01/13
  • 5. 5 Assicurazioni Generali Group – 1Q 2013 results Agenda II. Group financials Profit & loss review Life and P&C segment profitability Balance sheet and solvency I
  • 6. 6 Assicurazioni Generali Group – 1Q 2013 results Revenue development by segment II. GROUP FINANCIALS (1) Including investment contracts (Euro 1,044 m in 1Q13, Euro 786 m in 1Q12) (2) On like for like basis 1Q12 1Q13 Historical ∆ Like for like ∆ Gross written premiums 19,814 19,145 -3.4% -2.6% Life(1) 12,815 12,282 -4.2% -4.7% P&C 6,999 6,863 -1.9% +1.5% (Euro m) 19.814 19.145 1Q131Q12 -2.6%(2) Gross written premiums (Euro m)
  • 7. 7 Assicurazioni Generali Group – 1Q 2013 results Consolidation adjustments Total operating result Financial services operating result P&C operating result Operating holding expenses Life operating result 797 520 119 -83 -25 1,328 819 411 126 -74 -52 1,230 1Q13 total operating result (Euro m) Operating result by segment 1Q13 1Q12 -52.4% +8.0% -6.1% +26.6% +12.2% -2.6%  II. GROUP FINANCIALS
  • 8. 8 Assicurazioni Generali Group – 1Q 2013 results Focus on non operating result II. GROUP FINANCIALS (25) (18) 87 (54) (25) Non operating investment income (Euro m) 1Q131Q12 (Euro m) Net realised gains Net impair- ments Fair Value thr. P&L 1Q 13 97 (106) (8) 1Q 12 10 (52) 17 Δ n.m. +104.5% n.a. (Euro m) 1Q12 1Q13  Non operating investment income (25) (18) -29.2% Non operating holding expenses (163) (187) +15.2% Of which: interest costs (162) (187) +15.9% Net other Non operating expenses (77) (80) +3.5% Of which: VOBA amortization (46) (44) -4.3% Total Non operating result (266) (286) +7.5%
  • 9. 9 Assicurazioni Generali Group – 1Q 2013 results 1Q12 1Q13  Total operating result 1,230 1,328 +8.0% Non operating result (266) (286) +7.5% Consolidated result before taxes and minorities 964 1,042 +8.1% Income taxes(1) (334) (370) +10.8% Result for discontinued operations 14 0 n.a. Minorities (77) (69) -10.3% Net result 567 603 +6.3% II. GROUP FINANCIALS Net income (Euro m) 567 603 +6.3% 1Q131Q12 From operating result to net result (Euro m)
  • 10. 10 Assicurazioni Generali Group – 1Q 2013 results Agenda II. Group financials Profit & loss review Life and P&C segment profitability Balance sheet and solvency I
  • 11. 11 Assicurazioni Generali Group – 1Q 2013 results Life business development Gross written premiums (Euro m) 12.815 12.282 -4.7%(1) II. GROUP FINANCIALS 1Q12 1Q13 (1) On like for like basis (2) Including liabilities related to investment contracts Net technical reserves(2) (Euro bn) Country 1Q12 1Q13 Italy (235) 212 France (888) 70 Germany 994 1,494 CEE 106 143 RoE 534 683 RoW 250 310 TOTAL 760 2,913 Net inflows by country (Euro m)  Italy: positive development thanks to both lower maturities and surrenders  France: positive trend thanks to Unit Linked and Health & Protection vs. planned decrease in traditional savings; decreasing outflows  Germany: resilient growth triggered by positive development in both saving single premiums and protection regular premiums 1Q13FY12 Traditional Unit Linked +1.4% Traditional Unit linked 260.2 263.1 53.6 55.1 1.62.9313.8 318.3
  • 12. 12 Assicurazioni Generali Group – 1Q 2013 results Life profitability – Operating result (Euro m) 1Q12 1Q13  Technical Margin 1,543 1,544 +0.1% Investment Result 554 517 -6.8% Expenses (1,279) (1,264) -1.2% Operating Result 819 797 -2.6% Stable life operating profitability in a challenging financial environment Life Operating Result by driver(1) Life operating ratio on Investments 0.26% 0.24% II. GROUP FINANCIALS (1) For the definitions refer to the related section in the backup Life operating result 1Q12 Δ Technical margin Δ Investment result Δ Expenses Life operating result 1Q13 819 797151 (37)
  • 13. 13 Assicurazioni Generali Group – 1Q 2013 results Life investment strategy and yields Current return Fixed income Equity Real Estate 1Q12 1Q13 1Q12 1Q13 1Q12 1Q13 Euro m 2,331 2,299 61 17 192 182 % 1.1 1.0 0.5 0.1 2.0 1.9 43,0% 42,1% 33,9% 34,7% 8,4% 8,0% 4,5% 4,3% 3,5% 3,5% 4,7% 5,4% 2,1% 2,0% FY12 1Q13 Other Cash & cash equivalent Real estate Equity Other fixed income Corporate bonds Government bonds Life segment own investments (%) Euro 277.0 bn Euro 279.0 bn II. GROUP FINANCIALS  Increased attention to improve the diversification of the investments, especially in corporate bonds  Current profitability remains affected by a low reinvestment yield environment  Increased cash position ready to be deployed in attractive assets
  • 14. 14Life new business: value and profitability II. GROUP FINANCIALS (Euro m) APE Margin on APE (NBM) NBV 1Q12 1Q13 Historical  Like for like  1Q12 1Q13 1Q12 1Q13 Historical  Like for like  Italy 416 401 -3.7% -3.7% 23.8% 16.5% 99 66 -33.1% -33.0% France 432 248 -42.5% -42.5% 12.6% 14.4% 54 36 -33.9% -33.9% Germany 217 303 +39.7% +39.7% 21.1% 23.7% 46 72 +57.2% +57.2% CEE 39 36 -6.2% -31.0% 35.4% 44.7% 14 16 +18.6% -12.5% RoE 165 169 +2.6% +2.8% 27.5% 25.5% 45 43 -4.9% -4.6% RoW 60 56 -6.7% -10.2% 30.6% 36.1% 18 20 +10.2% +5.0% Total 1,328 1,213 -8.7% -9.7% 20.8% 20.9% 276 254 -8.3% -10.1%  APE slowdown driven by one-off single premiums written in 1Q12 in France  Improved NBM thanks to more favourable product mix and lower guarantees  Solid NBV at 254 millions Assicurazioni Generali Group – 1Q 2013 results
  • 15. 15 Assicurazioni Generali Group – 1Q 2013 results P&C gross written premiums (Euro m) 1Q12 1Q13 Like for like  Italy 1,708 1,648 -3.5% France 1,271 1,146 -1.6% Germany 1,383 1,443 +4.3% CEE 623 523 -1.8% RoE 1,598 1,590 -0.1% RoW 415 513 +31.4% Total 6,999 6,863 +1.5% II. GROUP FINANCIALS (1) On like for like basis Gross written premiums (Euro m) 6.999 6.863 1Q131Q12 +1.5%(1)  Strong development in Non Motor, driven by Personal Lines across the geographies due to the excellent performances of the distribution network  Growing competition in Motor in Italy, France and Spain  Commercial under pressure mainly in Spain and Italy, due to the difficult economic environment
  • 16. 16 Assicurazioni Generali Group – 1Q 2013 results P&C profitability – Operating result (Euro m) 1Q12 1Q13  Technical Result 221 331 +49.3% Investment Result 251 249 -0.8% Other (62) (60) -3.4% Operating Result 411 520 +26.6% P&C Operating Result by driver(1) P&C operating ratio on Investments 1.15% 1.38% Confirmed strong P&C operating profitability driven by good technical results II. GROUP FINANCIALS (1) For the definitions refer to the related section in the backup P&C operating result 1Q12 Δ Technical result Δ Investment result Δ Other P&C Operating result 1Q13 411 2 520109 (2)
  • 17. 17 Assicurazioni Generali Group – 1Q 2013 results P&C profitability – Net combined ratio (1/2) (0.7) (1.1) 1Q131Q12 Combined ratio (%)  Expense ratio  Loss ratio -1.8%pts. II. GROUP FINANCIALS Combined ratio by country 1Q12 1Q13  Italy 95.0% 91.1% -3.9%pts. France 97.2% 95.5% -1.7%pts. Germany 95.5% 93.8% -1.7%pts. CEE 91.0% 84.6% -6.3%pts. RoE 95.6% 95.3% -0.4%pts. RoW 96.5% 100.6% +4.1%pts. Total 95.4% 93.6% -1.8%pts. 27.2 66.4 27.9 67.5 93.6% 95.4% Loss ratio Expense ratio
  • 18. 18 Assicurazioni Generali Group – FY 2009 results 5.9 22.1 0.1 -0.85.8 21.4 P&C profitability – Net combined ratio (2/2) 1Q13 69.5 0.0 -3.2 66.4 1Q12 70.3 0.7 -3.5 67.5 II. GROUP FINANCIALS Loss ratio (%) 1Q131Q12 67.5 66.4-0.8 -0.7 +0.3 Current year NAT CAT Prior years 1Q131Q12 Δ Admin Δ Acq. Acq. costs Adm. costs 27.2 Expense ratio (%) Δ%pts 27.9 -1.1%pts. -0.7%pts. Assicurazioni Generali Group – 1Q 2013 results  Particularly favorable quarter without significant Nat Cat event  Current loss ratio still decreasing due to a continuous improvement in Motor frequency  Positive development of prior years confirmed
  • 19. 19 Assicurazioni Generali Group – 1Q 2013 results P&C investment strategy and yields P&C segment own investments (%) Euro 37.9 bn Euro 37.4 bn Current return Fixed income Equity Real Estate 1Q12 1Q13 1Q12 1Q13 1Q12 1Q13 Euro m 227 218 13 12 114 91 % 1.0 0.8 0.4 0.5 2.1 1.7 29,7% 31,0% 29,2% 30,3% 10,7% 8,4% 6,9% 7,1% 13,9% 14,0% 8,0% 7,8% 1,6% 1,4% FY12 1Q13 Other Cash & cash equivalent Real estate Equity Other fixed income Corporate bonds Government bonds II. GROUP FINANCIALS  Strong focus on deploying the existing cash in the portfolio  Increased attention to improve the diversification of the investments, especially in corporate bonds  Slight increase of equity exposure  Current profitability remains affected by a low reinvestment yield environment  Solid liquidity buffer maintained during the quarter
  • 20. 20 Assicurazioni Generali Group – 1Q 2013 results 64.5 66.6 Financial segment Operating result (Euro m) Third party AUM(1) (Euro bn) Net fees and commissions (Euro m) 126 119 1Q131Q12 -6.1% 218 218 1Q131Q12 +0.2% 96,4 100.8 1Q13FY12 +4.4% +2.1%pts. 1Q131Q12 Cost/income ratio (%) II. GROUP FINANCIALS (1) Including only third party AUM related to financial segment companies
  • 21. 21 Assicurazioni Generali Group – 1Q 2013 results Agenda II. Group financials Profit & loss review Life and P&C segment profitability Balance sheet and solvency I
  • 22. 22 Assicurazioni Generali Group – 1Q 2013 results 18,77519,013 (815) 19,828 (611)(45) 603 (184) IFRS Shareholders’ equity roll forward Shareholders’ Equity FY12 Impact from revised IAS 19 01/01/2013 Δ in AFS Reserve 1Q 2013 Net Result Δ Currency Translation Reserve Other (including Euro 477 m GPH 25% minorities buyout) Shareholders’ Equity 1Q13 -1.2% II. GROUP FINANCIALS (Euro m) Change in AFS reserve (Euro m) 2,591 46 2,406 28 (259) AFS Reserve FY12 Impact Equity Investments Impact Bond Investments Other AFS Reserve 1Q13
  • 23. 23 Assicurazioni Generali Group – 1Q 2013 results 17.9 17.9 18.2 26.9 26.1 25.0 Solvency I update II. GROUP FINANCIALS Required margin Available margin 01/01/13FY12 145%(1) (Euro bn) 1Q13 138% Solvency I ratio (1) FY12 shareholders’ equity was restated including the effects of revised IAS 19 Main drivers of changeMain drivers of change Available margin  Consolidated result:  Financial markets and other elements:  GPH 25% minorities buyout  Eligible debt Required Margin + 0.7 - 0.3 - 1.3 - 0.2 + 0.3 150%
  • 24. 24 Assicurazioni Generali Group – 1Q 2013 results III. Final Remarks Agenda
  • 25. 25 Assicurazioni Generali Group – 1Q 2013 results Final remarks III. FINAL REMARKS Excellent underlying P&C performance Resilient Life profitability in a challenging market environment Prioritising reinvestment of excess cash
  • 28. 281Q13 Total gross written premiums IV. BACK UP (1) Including investment contracts (2) On like for like basis with constant exchange rates (Euro m) YoY YoY YoY % increase % increase % increase (2) (2) (2) Italy 4,647 -5.4% 24.3% 2,999 -6.4% 24.4% 1,648 -3.5% 24.0% France 3,375 -32.5% 17.6% 2,229 -41.9% 18.2% 1,146 -1.6% 16.7% Germany 5,602 +21.1% 29.3% 4,159 +28.3% 33.9% 1,443 +4.3% 21.0% CEE 916 -1.4% 4.8% 393 -0.9% 3.2% 523 -1.8% 7.6% RoE 3,279 +5.3% 17.1% 1,689 +10.9% 13.7% 1,590 -0.1% 23.2% Of which: Spain 731 +2.7% 3.8% 322 +16.5% 2.6% 409 -6.0% 6.0% Austria 781 +2.7% 4.1% 298 +1.9% 2.4% 483 +3.2% 7.0% Switzerland 668 -1.3% 3.5% 247 -5.0% 2.0% 421 +0.9% 6.1% RoW 1,325 +23.1% 6.9% 813 +18.2% 6.6% 513 +31.4% 7.5% Total 19,145 -2.6% 100.0% 12,282 -4.7% 100.0% 6,863 +1.5% 100.0% Total gross written premiums Gross life written premiums (1) Gross P&C written premiums Country GWP Weight on total GWP GWP Weight on total GWP GWP Weight on total GWP Assicurazioni Generali Group – 1Q 2013 results
  • 29. 291Q13 Life premiums by country and business line(1) IV. BACK UP (1) Including investment contracts (2) On like for like basis with constant exchange rates GDP YoY % increase(2) GDP YoY % increase(2) GDP YoY % increase(2) GDP YoY % increase(2) Italy 2,778 -6.1% 67 -9.2% 110 -18.8% 2,955 -6.7% France 1,308 -57.5% 444 -3.3% 413 +72.8% 2,165 -42.7% Germany 2,252 +57.1% 1,127 +9.3% 780 +0.4% 4,159 +28.3% CEE 219 -6.5% 61 +6.0% 113 +8.0% 393 -0.9% RoE 597 +7.8% 335 +17.4% 755 +11.0% 1,686 +11.0% Of which: Spain 240 +23.6% 80 -0.3% 2 +3.9% 322 +16.5% Austria 168 +5.8% 65 +3.8% 63 -8.3% 296 +2.1% Switzerland 39 -21.2% 32 +11.7% 175 -3.2% 247 -5.0% RoW 340 +14.3% 236 +20.0% 25 +417.3% 601 +20.7% Total Life gross direct premiums 7,493 -12.4% 2,270 +8.0% 2,196 +13.2% 11,959 -5.0% (Euro mln) Protection Unit/Index linkedSavings and pension Total Assicurazioni Generali Group – 1Q 2013 results
  • 30. 301Q13 P&C premiums by country and business line IV. BACK UP (1) Including fleets (2) On like for like basis with constant exchange rates GDP YoY % increase(2) GDP YoY % increase(2) GDP YoY % increase(2) GDP YoY % increase(2) GDP YoY % increase(2) Italy 781 -6.5% 209 +1.5% 334 -4.7% 280 -5.2% 1,604 -4.9% France 306 -9.1% 463 +10.3% 309 -1.9% 0 -100.0% 1,078 -1.8% Germany 714 +4.1% 458 +5.8% 121 -5.1% 148 +9.9% 1,442 +4.3% CEE 246 -3.5% 90 +2.3% 144 -4.0% 28 +3.6% 509 -2.3% RoE 604 +0.6% 320 +5.5% 331 -4.8% 298 -2.0% 1,554 -0.2% Of which: Spain 102 -7.5% 114 +3.2% 103 -15.2% 80 -0.7% 399 -5.6% Austria 178 +0.1% 92 +2.6% 163 +4.6% 44 +4.4% 476 +2.5% Switzerland 227 -0.1% 75 +4.0% 2 -11.0% 118 +2.8% 421 +1.4% RoW 278 +37.0% 21 +353.8% 138 +31.7% 57 +23.1% 494 +37.8% Total P&C gross direct premiums 2,930 +0.7% 1,561 +7.3% 1,378 -1.2% 812 -2.8% 6,680 +1.3% TotalAccident/Health (Euro mln) Motor (1) Personal Commercial Assicurazioni Generali Group – 1Q 2013 results
  • 31. 31 Loss ratio Expense ratio P&C - Combined ratio(%) Total - Expense ratio (%) 67.5 66.4 27.9 27.2 1Q131Q12 1Q131Q12 1Q131Q12 95.4 93.6 1Q13 technical ratios IV. BACK UP Life - Expense ratio (%) 15.4 15.6 10.510.1 Assicurazioni Generali Group – 1Q 2013 results
  • 32. 321Q13 combined ratio reconciliation (1) Administration expenses related to service companies, real estates and other companies not belonging to P&C segment (Euro m) IV. BACK UP 1Q12 1Q13 A Net earned premiums (net of consolidation adjustments) 5,311 5,284 B Consolidated net claims 3,586 3,508 Consolidated acquisition costs 1,175 1,129 Consolidated administration costs 320 319 Non insurance activity related administration costs(1) 14 9 Insurance activity related consolidated administration costs 307 310 C Total acquisition and administration costs 1,481 1,439 B/A Loss ratio 67.5% 66.4% C/A Expense ratio 27.9% 27.2% (B+C)/A Combined ratio 95.4% 93.6% D Other technical items 22 6 A-B-C-D Technical result 221 331 Assicurazioni Generali Group – 1Q 2013 results
  • 33. 331Q13 technical ratios by country IV. BACK UP (%) ITA FRA GER CEE RoE SPA AUT SWI RoW Consolidated 1Q13 71.2% 69.3% 65.3% 52.7% 65.7% 63.6% 64.4% 70.3% 63.8% 66.4% 1Q12 74.5% 71.4% 66.7% 53.9% 66.4% 64.9% 65.1% 71.8% 56.8% 67.5% 1Q13 19.9% 26.1% 28.5% 31.9% 29.6% 28.0% 30.5% 25.2% 36.8% 27.2% 1Q12 20.5% 25.8% 28.8% 37.1% 29.2% 26.9% 31.1% 25.0% 39.7% 27.9% 1Q13 91.1% 95.5% 93.8% 84.6% 95.3% 91.6% 94.9% 95.5% 100.6% 93.6% 1Q12 95.0% 97.2% 95.5% 91.0% 95.6% 91.7% 96.2% 96.8% 96.5% 95.4% 1Q13 10.1% 11.2% 9.9% 18.4% 9.9% 3.7% 13.7% 17.7% 13.9% 10.5% 1Q12 9.7% 6.4% 12.7% 19.1% 11.9% 4.5% 14.7% 20.4% 14.3% 10.1% P&C Loss ratio P&C Expense ratio P&C Combined ratio Life expense ratio by country Assicurazioni Generali Group – 1Q 2013 results
  • 34. 34Focus on operating result 1Q12 1Q13 ∆ Italy 562 568 +1.0% France 246 249 +1.2% Germany 130 172 +32.0% CEE 122 121 -0.3% RoE 219 241 +9.9% RoW 76 85 +11.1% Operating result(1) 1,356 1,436 +5.9% Op. holding expenses (74) (83) +12.2% Consolidation Adj. (52) (25) -52.4% Total operating result 1,230 1,328 +8.0% Operating result by country(1) (Euro m) 339 168 92 41 110 46 167 80 66 74 92 40 61 14 7 38 -1 Italy France Germany CEE RoE RoW Life P&C Financial Operating result breakdown(1) (Euro m) (1) Operating result = operating result of life, P&C and financial segments, before holding expenses and consolidation adjustments 568 249 172 121 241 85 IV. BACK UP Assicurazioni Generali Group – 1Q 2013 results
  • 35. 35 819 797 Life operating result Operating result (Euro m) 1Q131Q12 -2.6% Operating result by country (Euro m) IV. BACK UP 1Q12 1Q13  Italy 364 339 -6.7% France 166 168 +1.3% Germany 84 92 +10.3% CEE 58 41 -28.8% RoE 94 110 +16.6% Of which: Spain 26 26 +0.5% Austria 18 19 +7.1% Switzerland 34 35 +4.8% RoW 53 46 -12.7% Total 819 797 -2.6% Assicurazioni Generali Group – 1Q 2013 results
  • 36. 36 411 520 P&C operating result 1Q131Q12 +26.6% IV. BACK UP 1Q12 1Q13  Italy 138 167 +21.4% France 80 80 +0.9% Germany 34 66 +91.8% CEE 59 74 +25.0% RoE 76 92 +22.5% Of which: Spain 44 45 +3.0% Austria 21 27 +26.5% Switzerland 11 12 +18.0% RoW 24 40 +64.8% Total 411 520 +26.6% Operating result (Euro m) Operating result by country (Euro m) (1) On like for like basis Assicurazioni Generali Group – 1Q 2013 results
  • 37. 37 Assicurazioni Generali Group – 1Q 2013 results (Euro m) Life P&C Financial Total Net impairments 1Q12 1Q13 1Q12 1Q13 1Q12 1Q13 1Q12 1Q13 Equity instruments 16 198 13 28 0 1 29 227 Fixed income 4 (12) 1 (4) 6 0 11 (17) Real estate 2 46 0 1 0 0 2 47 Other investments(2) 4 1 30 46 1 2 35 49 Total net impairments 24 232 45 72 8 2 77 306 Of which Operating net impairments 20 199 0 0 5 1 25 200 Non operating net impairments 4 33 45 72 3 1 52 106 Focus on impairments(1) (1) Net of reverse impairments (2) Including subsidiaries and associated companies IV. BACK UP
  • 38. 38 Assicurazioni Generali Group – 1Q 2013 results (Euro m) Life P&C Financial Total 1Q12 1Q13 1Q12 1Q13 1Q12 1Q13 1Q12 1Q13 Net realized gains on Equities 84 173 (12) 22 0 33 72 227 Realised gains 188 204 37 28 0 33 225 265 Realised losses (104 (32) (49) (6) 0 0 (153) (38) Net realized gains on Fixed Income 26 408 1 22 0 5 27 435 Realised gains 632 449 46 26 1 5 679 480 Realised losses (606) (41) (45) (4) (1) 0 (652) (46) Net realized gains on Real Estate 2 32 48 52 0 0 50 84 Realised gains 4 33 51 59 0 0 55 91 Realised losses (1) (1) (4) (6) 0 0 (5) (7) Net realized gains on Other(2) 1 16 3 (5) 0 0 4 12 Realised gains 2 21 3 1 1 1 5 22 Realised losses 0 (4) 0 (6) 0 0 (1) (10) Total net realized gains 114 629 40 91 0 38 154 758 Operating net realized gains 144 654 0 0 0 8 144 661 Non operating net realized gains (30) (25) 40 91 0 31 10 97 Focus on realised gains(1) (1) Excluding financial instruments at fair value through profit and loss (2) Including subsidiaries and associated companies IV. BACK UP
  • 39. 39Reclassified P&L account Total (Euro m) 1Q12 1Q13 Total Operating result 1,230 1,328 Net earned premiums 17,082 16,194 Net insurance benefits and claims (18,981) (16,412) Acquisition and administration costs (2,930) (2,873) Net fee and commission income and net income from financial service activities 217 207 Operating income from other financial instruments 2,808 3,119 Operating income from financial instruments at fair value through profit or loss 3,234 1,304 of which net income from fin. assets and liabilities where the risk is borne by the policyholders 2,609 1,102 Operating holding expenses (74) (83) Net other operating expenses (126) (126) Non-operating result (266) (286) Non-operating income from other financial instruments (42) (10) Non-operating income from financial instruments at fair value through profit or loss 17 (8) Non-operating holding expenses (163) (187) Interest expenses on financial debt (162) (187) Other non-operating holding expenses (1) 0 Net other non-operating expenses (77) (80) Earnings before taxes 964 1,042 Income taxes (334) (370) Result from discontinued operations 14 0 Consolidated result of the period 644 672 Result of the period attributable to minority interests (77) (69) Result of the period 567 603 IV. BACK UP Assicurazioni Generali Group – 1Q 2013 results
  • 40. 40 (Euro m) Life Non life Financial(1) Unallocated holding expenses Consolidation adjustments Total Total Operating result 819 411 127 (74) (52) 1,230 Net earned premiums 11,771 5,311 - - - 17,082 Net insurance benefits and claims (15,395) (3,586) - - - (18,981) of which var. of provisions related to unit linked business (2,666) - - - - (2,666) Acquisition and administration costs (1,237) (1,486) (208) - - (2,930) Net fee and commission income and net income from financial service activities 24 - 218 - (25) 217 Operating income from other fin. Instruments 2,482 244 106 - (24) 2,808 Operating income from fin. Instruments at fair value through profit or loss 3,185 7 42 - - 3,235 of which net income from fin.assets and liabilities where the risk is borne by the policyholders 2,609 - - - - 2,609 Operating holding expenses - - - (74) - (74) Net other operating expenses (12) (80) (30) - (4) (126) Non-operating result (72) (23) (9) (163) - (266) Non-operating income from other fin.instr. (34) (5) (3) - - (42) Non-operating income from fin. instr.at fair value through profit or loss - 17 - - - 17 Non-operating holding expenses - - - (163) - (163) Net other non-operating expenses (38) (34) (6) - - (77) Earnings before taxes 747 388 118 (237) (52) 964 Reclassified P&L account by segment – 1Q12 IV. BACK UP (1) Not reclassified according to the new layout based on operating margins and presented in the Consolidated Report Assicurazioni Generali Group – 1Q 2013 results
  • 41. 41 (Euro m) Life Non life Financial(1) Unallocated holding expenses Consolidation adjustments Total Total Operating result 797 520 119 (83) (25) 1,328 Net earned premiums 10,910 5,284 - - - 16,194 Net insurance benefits and claims (12,905) (3,508) - - - (16,412) of which var. of provisions related to unit linked business (1,185) - - - - (1,185) Acquisition and administration costs (1,228) (1,442) (203) - - (2,873) Net fee and commission income and net income from financial service activities 24 - 218 - (34) 207 Operating income from other fin. Instruments 2,765 240 101 - 14 3,119 Operating income from fin. Instruments at fair value through profit or loss 1,254 10 40 - - 1,304 of which net income from fin.assets and liabilities where the risk is borne by the policyholders 1,102 - - - - 1,102 Operating holding expenses - - - (83) - (83) Net other operating expenses (23) (63) (37) - (4) (126) Non-operating result (86) (34) 21 (187) 1 (286) Non-operating income from other fin.instr. (58) 19 29 - - (10) Non-operating income from fin. instr.at fair value through profit or loss - (8) - - - (8) Non-operating holding expenses - - - (187) - (187) Net other non-operating expenses (27) (45) (8) - 1 (80) Earnings before taxes 712 486 140 (270) (24) 1,042 Reclassified P&L account by segment – 1Q13 IV. BACK UP (1) Not reclassified according to the new layout based on operating margins and presented in the Consolidated Report Assicurazioni Generali Group – 1Q 2013 results
  • 42. 42 IV. BACK UP Focus on 1Q13 results (1) Including investment contracts (2) On like for like basis (Euro m) 2Q11 3Q11 4Q11 1Q12 2Q12 3Q12 4Q12 1Q13 1Q13/ 1Q12 Life premiums(1) 11,503 10,543 12,009 12,815 10,415 10,271 13,309 12,282 -4.7% P&C premiums 5,219 4,931 5,823 6,999 5,419 5,027 5,359 6,863 +1.5% Total premiums 16,722 15,474 17,832 19,814 15,834 15,298 18,668 19,145 -2.6% Life net inflows 1,999 1,678 (651) 760 (1,138) 1,515 2,399 2,913 +269.3% Combined ratio % 96.9% 96.7% 96.4% 95.4% 98.8% 95.7% 92.8% 93.5% -1.8% Life operating result 782 315 564 819 832 545 462 797 -2.6% P&C operating result 406 405 357 411 344 404 505 520 +26.6% Financial operating result 96 68 63 126 85 109 88 119 -6.1% Operating holding expenses and cons. adj. (132) (96) (155) (126) (148) (109) (128) (108) -14.5% Total operating result 1,153 692 827 1,230 1 949 928 1,328 +8.0% Net result 190 20 31 567 274 291 (1,043) 603 +6.3% Assicurazioni Generali Group – 1Q 2013 results
  • 44. 44Consolidated balance sheet (1) Including reinsurance amounts of technical reserve, deferred tax assets, deferred acquisition costs and other assets (Euro bn) FY12 1Q13 Intangible assets 9.9 9.8 Investments Cash 374.1 21.6 376.0 23.4 Other credits 11.1 13.1 Tangible assets 5.0 5.0 Other assets (1) 20.0 20.3 Total Assets 441.7 447.6 (Euro bn) FY12 1Q13 Shareholders’ Equity (Group share) 19.8 18.8 Minority interests 2.7 1.9 Shareholders’ Equity 22.6 20.6 Operating debt 50.7 51.2 Financial debt 13.2 13.1 Technical reserves 336.4 340.9 Payables and other provisions 9.5 10.1 Other liabilities 9.4 11.7 Total Liabilities and Shareholders’ Equity 441.7 447.6 IV. BACK UP Assicurazioni Generali Group – 1Q 2013 results
  • 45. 451Q13 Assets under management Total Euro 498.2 bn Fixed income instruments Other Real Estate Equity Available for sale Loans Real Estate Group participations Held to maturity Fin. Instr. at fair value thr. P&L Unit Linked Third parties AUM “Own Investments”(1) IV. BACK UP (1) For definitions refer to the related section in the backup Cash & equival. Cash & equival. 101.9 62.9% 20.1% 3.7% 0.5% 2.3% 4.1% 6.4% 340.7 55.6 4.5% 3.6% 81.2% 4.4% 6.4% Assicurazioni Generali Group – 1Q 2013 results
  • 46. 46Investment yields(1) (1) For definitions refer to the related section in the backup. IV. BACK UP Return (%) 1Q12 1Q13 1Q12 1Q13 1Q12 1Q13 1Q12 1Q13 1Q12 1Q13 LIFE Current 1.1 1.0 0.5 0.1 2.0 1.9 0.3 0.4 1.0 0.9 Total P&L 1.2 1.2 1.9 1.0 1.4 1.1 0.8 -0.4 1.2 1.1 Comprehensive 5.2 0.8 8.3 1.4 2.3 1.0 0.8 -0.4 4.8 0.7 NON LIFE Current 1.0 0.8 0.4 0.5 2.1 1.7 0.2 0.6 1.0 0.9 Total P&L 1.1 0.9 -0.3 0.2 1.8 1.8 0.6 -0.9 0.9 0.9 Comprehensive 4.2 0.6 5.2 2.4 1.8 1.8 0.6 -0.8 3.4 0.8 TOTAL Current 1.1 0.9 0.5 0.2 2.0 1.8 0.3 0.4 1.0 0.9 Total P&L 1.2 1.1 1.6 1.2 1.6 1.4 0.6 -0.3 1.1 1.0 Comprehensive 4.9 0.7 7.6 1.8 2.1 1.3 0.6 -0.3 4.4 0.7 Fixed Income Equities Investment Properties Other Total Assicurazioni Generali Group – 1Q 2013 results
  • 47. 47 425 681 1,850 (344) 2,530 (307) (1,326) 196 270 (644) 1,032 (244) 1,308 1Q134Q123Q122Q121Q124Q113Q112Q111Q114Q103Q102Q101Q10 Total comprehensive income(1) (Euro m) 3M10 6M10 9M10 12M10 3M11 6M11 9M11 12M11 3M12 6M12 9M12 12M12 3M13 1,308 1,064 2,096 1,452 270 466 (860) (1,166) 2,530 2,186 4,036 4,717 425 +4,000 m -1,000 m IV. BACK UP (1) For definitions refer to the related section in the backup Assicurazioni Generali Group – 1Q 2013 results
  • 48. 48AFS reserve breakdown IV. BACK UP (Euro m) FY11 FY12 1Q13 Fixed income instruments (1,780) 1,889 1,631 Government (1,216) 1,111 860 Corporate (564) 778 770 Equity (382) 549 578 Investment funds and other 7 152 198 TOTAL (2,156) 2,591 2,406 Assicurazioni Generali Group – 1Q 2013 results
  • 50. 50 Assicurazioni Generali Group – 1Q 2013 results Life new business: APE (Euro m) APE Annual Premiums Single Premiums 1Q12 1Q13 Like for like  1Q12 1Q13 Like for like  1Q12 1Q13 Like for like  Italy 416 401 -3.7% 258 261 +1.4% 1,584 1,395 -11.9% France 432 248 -42.5% 134 112 -16.4% 2,983 1,367 -54.2% Germany 217 303 +39.7% 168 173 +3.4% 494 1,299 +162.8% CEE 39 36 -31.0% 34 34 -27.2% 45 23 -61.1% RoE 165 169 +2.8% 109 99 -9.2% 554 699 +26.2% Austria 24 25 +2.8% 19 19 +0.0% 44 51 +15.1% Spain 29 38 +28.3% 13 14 +7.3% 159 233 +46.0% Switzerland 24 18 -25.0% 22 17 -21.1% 19 6 -68.9% RoW 60 56 -10.2% 50 43 -18.0% 97 133 +29.5% Total 1,328 1,213 -9.7% 752 722 -5.8% 5,757 4,916 -14.9% IV. BACK UP
  • 51. 51 Assicurazioni Generali Group – 1Q 2013 results IV. Backup P&L Balance sheet Life Definitions
  • 52. 52 Assicurazioni Generali Group – 1Q 2013 results Definitions: P&L and balance sheet (1/2) IV. BACK UP Investments Returns are calculated on quarterly average asset base at IFRS book value and are defined as follows: Current return: interests, dividends and similar income (gross of investments related expenses) Total P&L return: = current return + harvesting return (net realized gains, net impairments and net unrealized gains reported in P&L) – investments related expenses Comprehensive return: i) for fair value investment (AFS, FVthPL) = current return + total change in fair value; ii) for investment at amortised cost (Real estates, loans, HtM) = Total P&L return Investment returns for Life segment include income from bonds and loans issued by Group companies and investments in consolidated subsidiaries backing policyholders’ liabilities Life Net Inflows Premiums inflows in the period less benefits paid to the policyholders. It does not include revaluation of mathematical reserves Life Operating Result consists of the following elements: i) "Technical Margin" includes loadings, risk result, surrender result; it is gross of acquisition and administration costs ii) "Investment Result" includes interests and dividends, interest expenses on operating debt, G/L on foreign currency and investment expenses, net of policyholder benefits; it includes also operating realised and unrealised G/L, net of policyholder benefits iii) "Expenses" include acquisition and administration costs and other net operating items (it does not consider any loading charged to policyholders) “Operating ratio on Investments” is calculated as Operating result on the average of Investments at book value Like for Like changes The change of written premiums, net cash inflow, APE and NBV is on equivalent terms (on equivalent exchange rates and consolidation area). Operating Result Operating result of life, P&C and financial segments, before holding expenses and consolidation adjustments
  • 53. 53 Assicurazioni Generali Group – 1Q 2013 results Own Investments do not include unit/index linked investments and consist of the following asset class (*): i) Fixed income instruments as quoted and unquoted bonds, loans including deposits under reinsurance business accepted and term deposits with credit institutions ii) Equity-like instruments as quoted and unquoted equities and alternative investments iii) Real estate investments excluding own used properties iv) Cash and cash equivalent including Repo and Reverse repo v) Other investments as investments in non-consolidated subsidiaries, derivatives, receivables from banks or customers (*) Investment fund units are allocated to each asset class on a look through basis Own investments for life segment include bonds and loans issued by Group companies and investments in consolidated subsidiaries backing policyholders’ liabilities. P&C Operating Result consists of the following elements: I) "Technical Result" is net of acquisition and administration costs ii) "Investment Result" includes interests and dividends, interest expenses on operating debt and investment expenses iii) “Other" includes other net operating items not considered in Technical Result and in Investment Result “Operating ratio on Investments” is calculated as Operating result on the average of Investments at book value Total Comprehensive Income Change in shareholders’ equity during the period related to income and expenses recognized in profit or loss or directly in shareholders’ equity resulting from transactions and events other than transactions with equity Owners. Total Operating Result Operating result of life, P&C and financial segments, after holding expenses and consolidation adjustments. Operating result is a non-GAAP indicator and may differ from similar measure presented by other companies. Management uses this non-GAAP measure as key indicator in assessing Generali’s performance and believes that the presentation of these KPI provide useful and relevant information's to shareholders and users on Generali’s performance. Please refer to the ‘Methodological note on alternative performance measures’ included in the Management Report for details on operating result methodology.” Definitions: P&L and balance sheet (2/2) IV. BACK UP
  • 54. 54 Assicurazioni Generali Group – 1Q 2013 results Definitions: Life new business value and profitability IV. BACK UP Annual Premium Equivalent (APE) is defined as new business annualised regular premiums plus 10% of single premiums New Business Value (NBV) is the present value, at point of sale, of the projected stream of after tax industrial profits expected to be generated by the covered new business written in the quarter, taking into account the actual acquisition costs, after allowance for:  the cost of financial guarantees and options granted to policyholders;  the frictional costs of setting up and holding the required capital;  the cost of non hedgeable risks. Each quarterly NBV is calculated using beginning of period economic and operating assumptions. Full-year NBV is calculated as the algebraic sum of the NBV of each quarter. Margin on APE (NBM) is defined as the NBV divided by the APE
  • 55. 55 Assicurazioni Generali Group – 1Q 2013 results What’s next August 2, 2013 - 1H 2013 Results November 8, 2013 - 9M 2013 Results November 27, 2013 - Investor Day
  • 56. 56Investor Relations Team Spencer Horgan (Tel.: +44-20-72656480) Head of Investor Relations Email: spencer_horgan@generali.com Stefano Burrino (Tel.: +39-040-671202) Email: stefano_burrino@generali.com Emanuele Marciante (Tel.: +39-040-671347) Email: emanuele_marciante@generali.com Veronica Cherini (Tel.: +39-040-671488) Email: veronica_cherini@generali.com Rodolfo Svara (Tel.: +39-040-671823) Email: rodolfo_svara@generali.com Martina Vono (Tel.: +39-040-671402) IR Events Email: martina_vono@generali.com Assicurazioni Generali P.za Duca degli Abruzzi 2 34132 Trieste, Italy Fax: +39 040 671338 e-mail: generali_ir@generali.com www.generali.com Assicurazioni Generali Group – 1Q 2013 results
  • 57. 57Disclaimer Certain of the statements contained herein are statements of future expectations and other forward-looking statements. These expectations are based on management's current views and assumptions and involve known and unknown risks and uncertainties. The user of such information should recognise that actual results, performance or events may differ materially from such expectations because they relate to future events and circumstances which are beyond our control including, among other things, general economic and sector conditions. Neither Assicurazioni Generali S.p.A. nor any of its affiliates, directors, officers employees or agents owe any duty of care towards any user of the information provided herein nor any obligation to update any forward-looking information contained in this document. The manager charged with preparing the company’s financial reports, Alberto Minali, declares, pursuant to paragraph 2 of article 154-bis of the Consolidated Law on Financial Intermediation, that the accounting information contained in this presentation corresponds to document results, books and accounts records. Assicurazioni Generali Group – 1Q 2013 results
  • 58. March 2006 May 10, 2013 Generali Group 1Q 2013 Results