GENE PATTERN
GenePattern
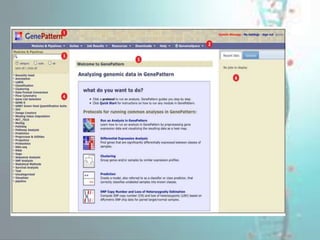
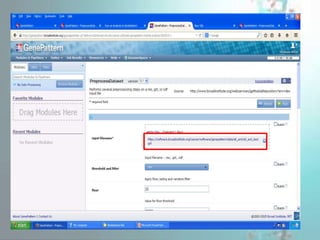
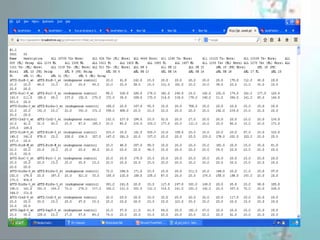
• GenePattern is a freely available software
package that provides access to a wide range
of computational methods used to analyze
genomic data.
• It was first released in 2004.
• Designed to enable researchers to develop,
capture, and reproduce genomic analysis
methodologies,
USAGE
It provides access to more than 250 genomic
analysis tools.
 Use the analysis tools as building blocks to
design sophisticated analysis pipelines that
capture the methods, parameters and data used
to produce analysis results.
Pipelines can be used to create, edit and share
reproducible in silico results.
Features
• Regularly updated repository of computational analysis
modules that support data preprocessing, gene expression
analysis, proteomics, single nucleotide polymorphism (SNP)
analysis, flow cytometry, and next-generation sequencing
• Pipelines that allow you to chain modules together to create
analysis workflows
• Tools to support easy creation and integration of new analysis
modules
• Versioning of modules and pipelines to ensure reproducible
research
• Web browser, application, and programmatic interfaces to
make analysis modules and pipelines available to a broad
range of users
Run an Analysis in GenePattern
• Learn how to run an analysis in GenePattern
by preprocessing gene expression data and
visualizing the resulting data as a heat map.
• Step 1: PreprocessDataset(Preprocess gene
expression data to remove platform noise and
genes that have little variation.)
• Step 2: HeatMapViewer (Display a heat map
of the preprocessed gene expression data. )
Step 1: PreprocessDataset
Step 2: HeatMapViewer: it provides users with several
options for manipulating and visualizing array-based data
Samples
Name
Gene
Name
By Using GenePattern We Can Also
Find:
• ComparativeMarkerSelection analysis to
find marker genes the genes in the dataset
that are most closely correlated with the two
phenotypes (ALL and AML) in the dataset.
• ComparativeMarkerSelectionViewer to
examine the ComparativeMarkerSelection
analysis result
• ExtractComparativeResults analysis to
create a smaller dataset that contains only the
marker genes
Gene pattern tool working

Gene pattern tool working

  • 1.
  • 2.
    GenePattern • GenePattern isa freely available software package that provides access to a wide range of computational methods used to analyze genomic data. • It was first released in 2004. • Designed to enable researchers to develop, capture, and reproduce genomic analysis methodologies,
  • 3.
    USAGE It provides accessto more than 250 genomic analysis tools.  Use the analysis tools as building blocks to design sophisticated analysis pipelines that capture the methods, parameters and data used to produce analysis results. Pipelines can be used to create, edit and share reproducible in silico results.
  • 4.
    Features • Regularly updatedrepository of computational analysis modules that support data preprocessing, gene expression analysis, proteomics, single nucleotide polymorphism (SNP) analysis, flow cytometry, and next-generation sequencing • Pipelines that allow you to chain modules together to create analysis workflows • Tools to support easy creation and integration of new analysis modules • Versioning of modules and pipelines to ensure reproducible research • Web browser, application, and programmatic interfaces to make analysis modules and pipelines available to a broad range of users
  • 9.
    Run an Analysisin GenePattern • Learn how to run an analysis in GenePattern by preprocessing gene expression data and visualizing the resulting data as a heat map. • Step 1: PreprocessDataset(Preprocess gene expression data to remove platform noise and genes that have little variation.) • Step 2: HeatMapViewer (Display a heat map of the preprocessed gene expression data. )
  • 10.
  • 17.
    Step 2: HeatMapViewer:it provides users with several options for manipulating and visualizing array-based data
  • 22.
  • 23.
    By Using GenePatternWe Can Also Find: • ComparativeMarkerSelection analysis to find marker genes the genes in the dataset that are most closely correlated with the two phenotypes (ALL and AML) in the dataset. • ComparativeMarkerSelectionViewer to examine the ComparativeMarkerSelection analysis result • ExtractComparativeResults analysis to create a smaller dataset that contains only the marker genes

Editor's Notes

  • #9 The title bar includes: GenePattern icon: Click the icon to return to this page. My Settings: Click this link to modify your GenePattern account settings (see My Settings). Sign Out: Click this link to exit from GenePattern. Your username: The username of the person currently logged into GenePattern. The navigation bar provides access to other GenePattern pages (see Navigation Bar). Use the search box to quickly find a module or pipeline. The Modules & Pipelines pane lists the analysis modules and pipelines that you can run. Modules and pipelines not installed from the Broad repository are shown in red. Use the radio buttons to organize the modules and pipelines as you prefer: Category (default): Organizes analysis modules by functional category; pipelines are in the pipeline category. Each module is assigned to a category when it is created. To change the category, you must edit the module definition. Suite: Organizes modules and pipelines by suite. Suites are arbitrary collections of modules and pipelines. You can install suites from the Broad repository or create your own. All: Organizes modules and pipelines alphabetically by name. The center pane is the main display pane. GenePattern uses this pane to display information and to prompt you for input. Initially, the center pane contains a welcome page, which provides instructions for running common analysis protocols. To redisplay the welcome page, click the GenePattern icon in the title bar. The far right pane provides access to several tabs: The Recent Jobs tab lists the most recent analyses that you have run and the result files generated by those analyses, as well as any currently running analyses. Click the icon next to a job or file name to display a menu of commands for working with the job or file (see Job Menu and File Menu). Click My Settings to modify the History setting, which controls the number of analyses displayed in the Recent Jobs pane. The Uploads tab lists the files in your uploads directory on the GenePattern server. Click the icon next to a directory or file name to display a menu of commands for working with the uploaded files (see Upload Menu). (Please note that as of GenePattern 3.8.0 this is now the Files tab) A GenomeSpace-enabled GenePattern installation (such as the public server) includes a GenomeSpace tab that can be used to help move data files from GenomeSpace and analysis results to GenomeSpace.
  • #22 displays gene expression data as a heat map which makes it easier to see patterns in the numeric data. the largest values are displayed as the reddest (hot), the smallest values are displayed as the bluest (cool), and intermediate values are a lighter color of either blue or red Row Relative and Global color schemes. When the relative choice is selected, the heat map converts values to colors using the mean, minimum, and maximum values in each row. When the global choice is selected the heat map converts values to colors using the mean, minimum, and maximum values in the entire dataset. You can choose between the radio buttons Use Color Gradient and Use Discrete Colors. The heat map uses linear color gradient to convert values to colors when the Use Color Gradient button is selected, while a discrete color map is used if the Use Discrete Colors button is selected. A color picker is provided for selecting colors. When specifying discrete colors there is no limit on the number of colors that can added.