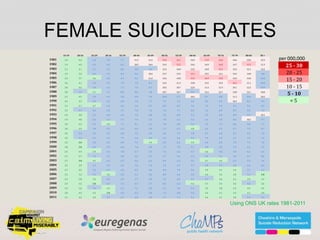
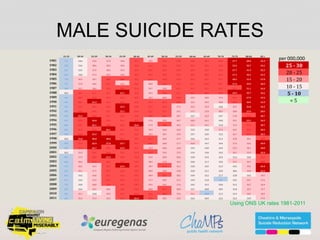
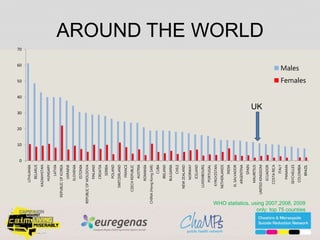
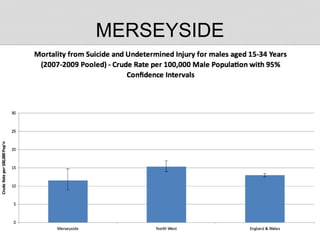
GENDER & SUICIDE
Jane Powell & Simon Howes
NW Suicide Reduction Summit 2013
Depression occurs as often in
men as in women but women
are twice as likely to be
diagnosed and treated
FEMALE SUICIDE RATES
15-19 20-24 25-29 30-34 35-39 40-44 45-49 50-54 55-59 60-64 65-69 70-74 75-79 80-84 85 +
1981 2.4 4.4 5.4 7.0 7.7 11.5 11.4 15.4 16.1 14.9 17.0 16.8 14.6 13.0 12.3
1982 1.9 4.9 6.1 6.9 8.2 10.5 10.4 14.3 15.2 14.6 14.9 16.8 14.7 15.3 11.3
1983 2.1 4.1 5.1 5.7 8.6 9.8 9.6 12.4 14.8 14.2 14.8 15.5 14.2 12.1 13.2
1984 1.9 3.3 5.6 5.5 8.4 9.4 10.4 13.7 13.5 15.3 13.5 14.1 14.2 14.8 9.8
1985 2.2 3.7 4.6 6.8 6.7 9.2 11.0 13.6 14.8 15.2 16.9 15.8 14.9 14.0 10.0
1986 2.6 4.1 5.5 5.9 7.9 7.0 8.1 13.2 11.3 13.8 13.5 14.3 16.3 11.1 10.0
1987 3.0 4.6 5.8 6.1 7.1 7.9 8.7 10.5 10.7 12.0 11.4 11.9 10.1 12.3 10.0
1988 3.0 5.2 4.7 7.2 8.0 8.0 7.8 10.7 10.7 9.5 11.6 12.7 13.8 12.1 10.8
1989 3.1 4.5 5.9 6.4 5.8 6.8 7.0 10.0 8.7 10.3 8.7 8.8 11.2 10.0 10.2
1990 2.4 4.3 5.6 6.5 6.8 7.0 7.7 7.7 7.5 9.2 9.6 9.6 10.2 8.5 9.5
1991 3.1 4.7 4.7 6.4 6.0 6.6 6.7 8.6 8.7 7.6 7.3 9.5 9.1 9.3 8.5
1992 2.3 5.1 6.5 6.0 5.7 7.0 7.4 7.6 7.7 8.6 7.6 8.9 8.5 8.9 7.2
1993 2.3 4.8 6.1 6.0 6.4 7.6 6.0 7.6 8.0 6.3 7.9 6.8 8.9 9.7 10.1
1994 1.9 4.8 5.6 6.1 5.7 7.4 5.1 7.8 6.3 7.2 6.3 7.8 8.2 10.2 9.7
1995 3.0 4.2 5.3 4.8 7.1 8.1 6.1 7.0 6.8 6.6 5.2 7.3 8.6 9.0 7.1
1996 3.6 4.9 5.8 6.3 6.2 6.6 5.6 7.2 6.5 4.8 6.3 6.3 6.7 7.5 8.7
1997 2.6 5.4 5.5 5.5 6.8 7.5 6.5 6.6 7.2 5.8 6.7 6.6 5.1 6.2 7.0
1998 3.5 5.5 6.1 6.5 7.3 6.6 5.8 6.5 6.6 5.2 7.4 6.9 6.7 6.9 7.2
1999 3.2 5.0 6.0 6.2 6.8 7.2 4.9 6.9 6.3 4.9 6.6 6.5 7.0 7.1 7.0
2000 3.8 5.0 6.4 5.9 6.4 7.0 6.8 7.3 7.0 5.1 5.9 5.8 5.9 6.2 7.6
2001 2.3 4.9 4.9 6.3 7.0 6.7 5.2 7.2 6.6 6.7 4.6 5.8 5.9 6.2 6.5
2002 2.7 4.7 7.4 5.2 6.8 6.2 5.5 6.7 6.4 5.4 5.6 5.1 5.6 6.7 8.6
2003 2.7 5.0 4.5 6.5 6.5 6.6 6.1 8.1 6.1 5.2 4.7 4.6 6.3 5.3 7.6
2004 3.3 3.9 5.3 5.9 6.3 7.6 7.3 7.2 6.7 5.7 6.0 5.9 6.8 5.9 8.6
2005 2.7 4.5 5.2 5.9 6.3 6.5 6.6 8.4 7.0 5.6 4.9 4.1 4.4 5.7 6.7
2006 2.3 3.4 5.1 4.6 6.0 5.1 6.6 8.0 6.6 6.6 4.6 3.4 4.0 5.3 5.0
2007 2.3 2.8 3.5 5.6 5.2 5.7 6.0 7.2 6.0 5.3 5.3 4.6 4.1 4.9 4.4
2008 2.4 3.5 5.0 6.2 5.5 6.7 5.7 8.2 6.3 4.6 4.7 3.6 4.3 5.6 3.6
2009 2.4 3.6 5.6 4.3 6.1 7.2 5.8 6.1 6.6 5.3 4.5 3.8 4.5 4.9 4.9
2010 2.8 4.5 4.2 5.0 6.4 6.2 5.8 7.3 6.0 5.4 4.5 4.1 4.3 4.3 4.0
2011 3.1 4.3 4.9 5.7 6.7 6.8 5.9 7.7 7.1 5.1 4.4 4.1 4.0 5.3 5.3
per 000,000
25 - 30
20 - 25
15 - 20
10 - 15
5 - 10
< 5
Using ONS UK rates 1981-2011
MALE SUICIDE RATES
15-19 20-24 25-29 30-34 35-39 40-44 45-49 50-54 55-59 60-64 65-69 70-74 75-79 80-84 85 +
1981 7.1 14.6 19.4 17.9 19.6 21.5 19.5 23.5 23.8 23.0 20.1 23.0 27.7 28.9 31.9
1982 5.8 13.6 18.6 18.5 18.4 20.2 21.7 21.8 24.9 20.7 22.9 22.8 25.6 30.7 34.2
1983 6.1 13.5 17.4 18.4 19.3 21.9 20.5 22.7 21.8 22.9 22.4 22.0 27.7 31.9 25.3
1984 6.5 14.0 17.3 19.5 19.6 22.4 20.3 22.5 23.9 20.3 20.1 24.3 27.3 30.1 25.2
1985 7.0 16.5 18.7 20.9 20.8 23.2 21.4 22.8 23.0 23.2 22.5 21.7 28.1 31.5 27.8
1986 7.7 17.8 18.4 21.2 19.2 22.6 20.0 23.2 21.9 23.1 22.8 24.7 27.4 39.9 28.9
1987 9.0 19.1 18.0 21.8 20.2 21.0 19.7 19.9 21.5 22.1 21.3 20.7 23.7 31.1 36.4
1988 10.5 22.5 21.1 23.7 25.1 23.4 19.2 21.0 21.1 22.1 20.2 23.4 29.9 39.7 36.6
1989 9.4 20.7 21.2 21.5 22.2 20.7 18.3 20.0 22.8 15.5 18.0 17.4 24.8 27.9 32.2
1990 9.1 24.1 25.3 21.6 24.2 23.1 21.1 21.2 20.8 16.3 19.3 18.8 20.1 30.5 33.9
1991 9.6 21.9 24.4 24.5 25.5 25.0 23.2 21.0 17.2 16.5 15.9 14.0 19.7 26.0 34.9
1992 9.6 23.6 24.5 22.7 25.2 25.0 21.1 21.7 19.1 17.5 15.8 18.7 18.8 25.9 28.6
1993 9.5 25.5 24.0 22.1 22.9 25.0 21.4 20.2 19.7 14.7 16.3 14.7 17.8 22.5 28.7
1994 9.1 23.9 26.0 25.0 21.4 22.3 17.6 19.3 16.7 16.0 16.1 14.0 19.1 25.1 36.2
1995 8.4 23.3 26.1 24.8 23.2 26.6 17.5 20.8 18.2 15.1 15.5 11.8 17.6 21.4 30.7
1996 8.3 21.2 24.6 26.1 21.1 23.5 19.5 16.8 16.9 12.9 13.0 17.3 16.5 25.0 28.2
1997 9.8 23.9 25.2 24.3 21.5 20.2 19.5 18.1 15.5 13.7 12.0 13.2 16.7 20.5 28.3
1998 10.4 25.8 30.0 30.0 23.7 24.0 21.2 18.9 17.7 14.6 14.3 11.3 15.8 18.1 22.9
1999 9.9 22.4 26.9 27.8 25.7 23.1 20.6 18.8 17.7 16.0 14.7 14.4 17.4 19.6 30.9
2000 9.6 23.3 26.7 24.8 25.9 22.3 19.9 18.6 16.8 13.5 13.0 14.4 15.3 18.1 28.8
2001 10.2 19.3 23.1 24.6 23.1 22.4 21.5 19.4 17.9 13.4 13.0 14.3 16.1 15.9 26.9
2002 8.5 17.9 23.8 25.9 23.8 23.0 19.5 18.9 16.6 13.0 13.4 12.4 11.6 14.0 21.3
2003 6.6 18.4 21.2 24.2 24.2 23.1 18.5 17.8 16.2 14.0 11.7 13.4 15.1 16.7 20.8
2004 7.1 16.5 19.3 22.7 25.9 22.5 18.7 20.6 16.1 13.0 13.5 11.3 14.2 19.3 26.4
2005 6.7 15.1 17.3 22.7 23.6 23.1 20.0 19.0 15.8 15.0 12.1 12.0 10.6 19.0 25.2
2006 6.5 14.5 16.8 21.5 23.2 23.7 18.9 20.1 18.2 14.9 12.2 11.7 12.8 14.5 19.5
2007 6.7 14.4 17.0 21.9 23.5 21.9 17.7 18.3 17.1 13.9 11.8 9.4 13.2 16.7 17.6
2008 7.2 15.0 18.8 21.6 24.0 24.9 19.2 19.5 17.6 14.5 11.5 12.0 11.3 16.7 16.4
2009 6.5 14.4 19.2 18.6 24.9 24.2 20.0 21.5 18.8 13.1 10.8 10.5 11.8 15.1 15.7
2010 5.6 15.1 14.8 19.3 21.5 23.9 20.1 20.9 19.4 15.1 10.0 11.3 11.9 16.5 18.3
2011 6.6 15.4 17.3 19.2 24.2 26.9 22.0 18.5 15.4 14.4 10.9 12.2 12.2 13.9 17.0
per 000,000
25 - 30
20 - 25
15 - 20
10 - 15
5 - 10
< 5
Using ONS UK rates 1981-2011
AROUND THE WORLD
0
10
20
30
40
50
60
70
LITHUANIA
BELARUS
KAZAKHSTAN
HUNGARY
LATVIA
REPUBLICOFKOREA
UKRAINE
SLOVENIA
ESTONIA
REPUBLICOFMOLDOVA
FINLAND
CROATIA
SERBIA
POLAND
SWITZERLAND
FRANCE
CZECHREPUBLIC
AUSTRIA
ROMANIA
CHINA(HongKongSAR)
CUBA
IRELAND
BULGARIA
CHILE
NEWZEALAND
NORWAY
ICELAND
LUXEMBOURG
PORTUGAL
KYRGYZSTAN
NETHERLANDS
INDIA
ELSALVADOR
ARGENTINA
SPAIN
MAURITIUS
UNITEDKINGDOM
ECUADOR
COSTARICA
ITALY
PANAMA
SEYCHELLES
COLOMBIA
BRAZIL
Males
Females
UK
WHO statistics, using 2007,2008, 2009
only: top 75 counties
What’s Expected
BE RICH, FAMOUS, HANSOME
STRONG & SILENT
MEN & DEPRESSION / CRISIS
Pride
Anger
Irritability
Self Medication
Lack of libido
Lack of sleep
Risk taking
Sleeping too much
MEN
 Men are far less likely than women to seek help with
medical problems
 Men are three times more likely than women to be
alcohol dependent
 Men make up 94 per cent of the UK prison population
 Men represent 85% of people who sleep rough
 Men represent 73% of people who go missing each year
Sources: BBC News & MIND
LONDON PCTS
• 32 PCTs were asked how much they paid for services they commissioned
outside the NHS, broken down by gender. Our of with gender-based
services that replied:
• 4 borough PCTs commissioned specifically men’s services at a cost of
£11,135,291
• 15 PCTs commissioned women’s services, at a cost of between £13,156,785
and £13,429,785.
• Women’s health services received between £1,775,766-£2,048,766
more funding than men’s over the past five years.
Sources: BBC News & MIND
The Bureau of Investigative Journalism –
June 2012
LONDON COUNCILS
• Were asked for information relating to third sector services, which
although not directly related to health are focused on wellbeing.
• Of those that responded, three times more was spent on services
aimed at or predominantly used by women.
• £20,111,866 was spent on services aimed at women.
• £6,022,289 was spent on services aimed at men.
The Bureau of Investigative Journalism –
June 2012
MOVING AHEAD
…
Awareness vs. Credibility
Chose credibility
Build a reputation
Get peer-to-peer recommendation
CURRENCY
Mens
Magazine
Ad.
MERSEYSIDE
MERSEYSIDE
MERSEYSIDE
1. What is perceived as acceptable
“manly” behaviour
 Requires societal change & personal change – CULTURE
2. The current shape of services that
could help men
 Requires changes in practice and delivery
The problem…
Welcome to…
North West
Reducing Suicide Summit 2013

Gender and Suicide

  • 1.
    GENDER & SUICIDE JanePowell & Simon Howes NW Suicide Reduction Summit 2013
  • 2.
    Depression occurs asoften in men as in women but women are twice as likely to be diagnosed and treated
  • 3.
    FEMALE SUICIDE RATES 15-1920-24 25-29 30-34 35-39 40-44 45-49 50-54 55-59 60-64 65-69 70-74 75-79 80-84 85 + 1981 2.4 4.4 5.4 7.0 7.7 11.5 11.4 15.4 16.1 14.9 17.0 16.8 14.6 13.0 12.3 1982 1.9 4.9 6.1 6.9 8.2 10.5 10.4 14.3 15.2 14.6 14.9 16.8 14.7 15.3 11.3 1983 2.1 4.1 5.1 5.7 8.6 9.8 9.6 12.4 14.8 14.2 14.8 15.5 14.2 12.1 13.2 1984 1.9 3.3 5.6 5.5 8.4 9.4 10.4 13.7 13.5 15.3 13.5 14.1 14.2 14.8 9.8 1985 2.2 3.7 4.6 6.8 6.7 9.2 11.0 13.6 14.8 15.2 16.9 15.8 14.9 14.0 10.0 1986 2.6 4.1 5.5 5.9 7.9 7.0 8.1 13.2 11.3 13.8 13.5 14.3 16.3 11.1 10.0 1987 3.0 4.6 5.8 6.1 7.1 7.9 8.7 10.5 10.7 12.0 11.4 11.9 10.1 12.3 10.0 1988 3.0 5.2 4.7 7.2 8.0 8.0 7.8 10.7 10.7 9.5 11.6 12.7 13.8 12.1 10.8 1989 3.1 4.5 5.9 6.4 5.8 6.8 7.0 10.0 8.7 10.3 8.7 8.8 11.2 10.0 10.2 1990 2.4 4.3 5.6 6.5 6.8 7.0 7.7 7.7 7.5 9.2 9.6 9.6 10.2 8.5 9.5 1991 3.1 4.7 4.7 6.4 6.0 6.6 6.7 8.6 8.7 7.6 7.3 9.5 9.1 9.3 8.5 1992 2.3 5.1 6.5 6.0 5.7 7.0 7.4 7.6 7.7 8.6 7.6 8.9 8.5 8.9 7.2 1993 2.3 4.8 6.1 6.0 6.4 7.6 6.0 7.6 8.0 6.3 7.9 6.8 8.9 9.7 10.1 1994 1.9 4.8 5.6 6.1 5.7 7.4 5.1 7.8 6.3 7.2 6.3 7.8 8.2 10.2 9.7 1995 3.0 4.2 5.3 4.8 7.1 8.1 6.1 7.0 6.8 6.6 5.2 7.3 8.6 9.0 7.1 1996 3.6 4.9 5.8 6.3 6.2 6.6 5.6 7.2 6.5 4.8 6.3 6.3 6.7 7.5 8.7 1997 2.6 5.4 5.5 5.5 6.8 7.5 6.5 6.6 7.2 5.8 6.7 6.6 5.1 6.2 7.0 1998 3.5 5.5 6.1 6.5 7.3 6.6 5.8 6.5 6.6 5.2 7.4 6.9 6.7 6.9 7.2 1999 3.2 5.0 6.0 6.2 6.8 7.2 4.9 6.9 6.3 4.9 6.6 6.5 7.0 7.1 7.0 2000 3.8 5.0 6.4 5.9 6.4 7.0 6.8 7.3 7.0 5.1 5.9 5.8 5.9 6.2 7.6 2001 2.3 4.9 4.9 6.3 7.0 6.7 5.2 7.2 6.6 6.7 4.6 5.8 5.9 6.2 6.5 2002 2.7 4.7 7.4 5.2 6.8 6.2 5.5 6.7 6.4 5.4 5.6 5.1 5.6 6.7 8.6 2003 2.7 5.0 4.5 6.5 6.5 6.6 6.1 8.1 6.1 5.2 4.7 4.6 6.3 5.3 7.6 2004 3.3 3.9 5.3 5.9 6.3 7.6 7.3 7.2 6.7 5.7 6.0 5.9 6.8 5.9 8.6 2005 2.7 4.5 5.2 5.9 6.3 6.5 6.6 8.4 7.0 5.6 4.9 4.1 4.4 5.7 6.7 2006 2.3 3.4 5.1 4.6 6.0 5.1 6.6 8.0 6.6 6.6 4.6 3.4 4.0 5.3 5.0 2007 2.3 2.8 3.5 5.6 5.2 5.7 6.0 7.2 6.0 5.3 5.3 4.6 4.1 4.9 4.4 2008 2.4 3.5 5.0 6.2 5.5 6.7 5.7 8.2 6.3 4.6 4.7 3.6 4.3 5.6 3.6 2009 2.4 3.6 5.6 4.3 6.1 7.2 5.8 6.1 6.6 5.3 4.5 3.8 4.5 4.9 4.9 2010 2.8 4.5 4.2 5.0 6.4 6.2 5.8 7.3 6.0 5.4 4.5 4.1 4.3 4.3 4.0 2011 3.1 4.3 4.9 5.7 6.7 6.8 5.9 7.7 7.1 5.1 4.4 4.1 4.0 5.3 5.3 per 000,000 25 - 30 20 - 25 15 - 20 10 - 15 5 - 10 < 5 Using ONS UK rates 1981-2011
  • 4.
    MALE SUICIDE RATES 15-1920-24 25-29 30-34 35-39 40-44 45-49 50-54 55-59 60-64 65-69 70-74 75-79 80-84 85 + 1981 7.1 14.6 19.4 17.9 19.6 21.5 19.5 23.5 23.8 23.0 20.1 23.0 27.7 28.9 31.9 1982 5.8 13.6 18.6 18.5 18.4 20.2 21.7 21.8 24.9 20.7 22.9 22.8 25.6 30.7 34.2 1983 6.1 13.5 17.4 18.4 19.3 21.9 20.5 22.7 21.8 22.9 22.4 22.0 27.7 31.9 25.3 1984 6.5 14.0 17.3 19.5 19.6 22.4 20.3 22.5 23.9 20.3 20.1 24.3 27.3 30.1 25.2 1985 7.0 16.5 18.7 20.9 20.8 23.2 21.4 22.8 23.0 23.2 22.5 21.7 28.1 31.5 27.8 1986 7.7 17.8 18.4 21.2 19.2 22.6 20.0 23.2 21.9 23.1 22.8 24.7 27.4 39.9 28.9 1987 9.0 19.1 18.0 21.8 20.2 21.0 19.7 19.9 21.5 22.1 21.3 20.7 23.7 31.1 36.4 1988 10.5 22.5 21.1 23.7 25.1 23.4 19.2 21.0 21.1 22.1 20.2 23.4 29.9 39.7 36.6 1989 9.4 20.7 21.2 21.5 22.2 20.7 18.3 20.0 22.8 15.5 18.0 17.4 24.8 27.9 32.2 1990 9.1 24.1 25.3 21.6 24.2 23.1 21.1 21.2 20.8 16.3 19.3 18.8 20.1 30.5 33.9 1991 9.6 21.9 24.4 24.5 25.5 25.0 23.2 21.0 17.2 16.5 15.9 14.0 19.7 26.0 34.9 1992 9.6 23.6 24.5 22.7 25.2 25.0 21.1 21.7 19.1 17.5 15.8 18.7 18.8 25.9 28.6 1993 9.5 25.5 24.0 22.1 22.9 25.0 21.4 20.2 19.7 14.7 16.3 14.7 17.8 22.5 28.7 1994 9.1 23.9 26.0 25.0 21.4 22.3 17.6 19.3 16.7 16.0 16.1 14.0 19.1 25.1 36.2 1995 8.4 23.3 26.1 24.8 23.2 26.6 17.5 20.8 18.2 15.1 15.5 11.8 17.6 21.4 30.7 1996 8.3 21.2 24.6 26.1 21.1 23.5 19.5 16.8 16.9 12.9 13.0 17.3 16.5 25.0 28.2 1997 9.8 23.9 25.2 24.3 21.5 20.2 19.5 18.1 15.5 13.7 12.0 13.2 16.7 20.5 28.3 1998 10.4 25.8 30.0 30.0 23.7 24.0 21.2 18.9 17.7 14.6 14.3 11.3 15.8 18.1 22.9 1999 9.9 22.4 26.9 27.8 25.7 23.1 20.6 18.8 17.7 16.0 14.7 14.4 17.4 19.6 30.9 2000 9.6 23.3 26.7 24.8 25.9 22.3 19.9 18.6 16.8 13.5 13.0 14.4 15.3 18.1 28.8 2001 10.2 19.3 23.1 24.6 23.1 22.4 21.5 19.4 17.9 13.4 13.0 14.3 16.1 15.9 26.9 2002 8.5 17.9 23.8 25.9 23.8 23.0 19.5 18.9 16.6 13.0 13.4 12.4 11.6 14.0 21.3 2003 6.6 18.4 21.2 24.2 24.2 23.1 18.5 17.8 16.2 14.0 11.7 13.4 15.1 16.7 20.8 2004 7.1 16.5 19.3 22.7 25.9 22.5 18.7 20.6 16.1 13.0 13.5 11.3 14.2 19.3 26.4 2005 6.7 15.1 17.3 22.7 23.6 23.1 20.0 19.0 15.8 15.0 12.1 12.0 10.6 19.0 25.2 2006 6.5 14.5 16.8 21.5 23.2 23.7 18.9 20.1 18.2 14.9 12.2 11.7 12.8 14.5 19.5 2007 6.7 14.4 17.0 21.9 23.5 21.9 17.7 18.3 17.1 13.9 11.8 9.4 13.2 16.7 17.6 2008 7.2 15.0 18.8 21.6 24.0 24.9 19.2 19.5 17.6 14.5 11.5 12.0 11.3 16.7 16.4 2009 6.5 14.4 19.2 18.6 24.9 24.2 20.0 21.5 18.8 13.1 10.8 10.5 11.8 15.1 15.7 2010 5.6 15.1 14.8 19.3 21.5 23.9 20.1 20.9 19.4 15.1 10.0 11.3 11.9 16.5 18.3 2011 6.6 15.4 17.3 19.2 24.2 26.9 22.0 18.5 15.4 14.4 10.9 12.2 12.2 13.9 17.0 per 000,000 25 - 30 20 - 25 15 - 20 10 - 15 5 - 10 < 5 Using ONS UK rates 1981-2011
  • 5.
  • 6.
  • 9.
  • 10.
  • 12.
    MEN & DEPRESSION/ CRISIS Pride Anger Irritability Self Medication Lack of libido Lack of sleep Risk taking Sleeping too much
  • 17.
    MEN  Men arefar less likely than women to seek help with medical problems  Men are three times more likely than women to be alcohol dependent  Men make up 94 per cent of the UK prison population  Men represent 85% of people who sleep rough  Men represent 73% of people who go missing each year Sources: BBC News & MIND
  • 18.
    LONDON PCTS • 32PCTs were asked how much they paid for services they commissioned outside the NHS, broken down by gender. Our of with gender-based services that replied: • 4 borough PCTs commissioned specifically men’s services at a cost of £11,135,291 • 15 PCTs commissioned women’s services, at a cost of between £13,156,785 and £13,429,785. • Women’s health services received between £1,775,766-£2,048,766 more funding than men’s over the past five years. Sources: BBC News & MIND The Bureau of Investigative Journalism – June 2012
  • 19.
    LONDON COUNCILS • Wereasked for information relating to third sector services, which although not directly related to health are focused on wellbeing. • Of those that responded, three times more was spent on services aimed at or predominantly used by women. • £20,111,866 was spent on services aimed at women. • £6,022,289 was spent on services aimed at men. The Bureau of Investigative Journalism – June 2012
  • 20.
  • 21.
  • 22.
    Awareness vs. Credibility Chosecredibility Build a reputation Get peer-to-peer recommendation CURRENCY
  • 24.
  • 25.
  • 26.
  • 27.
  • 28.
    1. What isperceived as acceptable “manly” behaviour  Requires societal change & personal change – CULTURE 2. The current shape of services that could help men  Requires changes in practice and delivery The problem…
  • 29.

Editor's Notes

  • #4 Here we can clearly see that it’s gender.We can see from the late 90’s that the problem started to increase in young men. And we can see that track down, with the suicide rate staying with each age cohort.The other thing that this graph shows is that to an extent, what’s happening in society impacts upon both genders. The early 80s were clearly a tought time for both older men and older women.But the big, over takeaway message, is that it’s gender. No matter how we salami slice other issues – poverty, employment, relationships, mental health issues – we see predominantly more men taking their lives than women.DATA source: ONS, table one, suicide rates in the UK. http://www.ons.gov.uk/ons/rel/subnational-health4/suicides-in-the-united-kingdom/2011/stb-suicide-bulletin.html
  • #5 In 2011 there were 4,871 suicides in England and Wales.  3,701 of them (76%) were maleAbout 900 young men kill themselves each year – the biggest killer of young menSuicide is increasing significantly in men aged 35-50.
  • #24 If we want to attract men, then we need to speak their language.Gillette don’t aim their ads at ‘the public’, they focus them upon their audience.We should do no less.