Download as PDF, PPTX


The document provides various templates for conducting a gap analysis within a company, detailing current and target states, corrective actions, and prioritizations. It highlights different aspects such as data processes, team training, and KPIs to identify and address gaps effectively. Additionally, it emphasizes that all slides are editable to adapt the content to specific needs.
Introduction to Gap Analysis for assessing the company's current state versus target state.
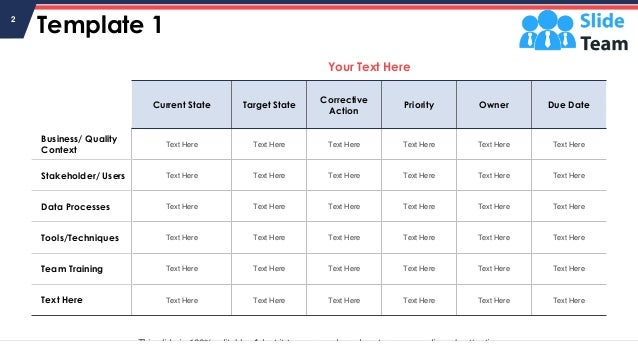
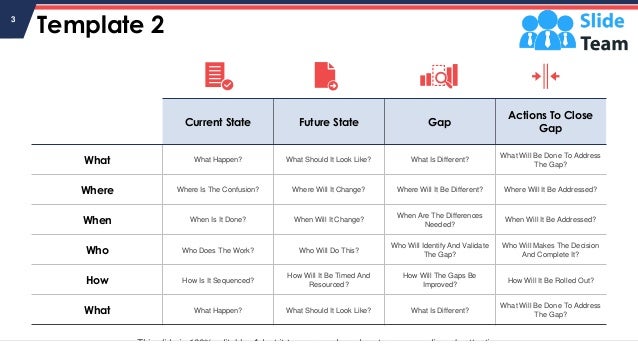
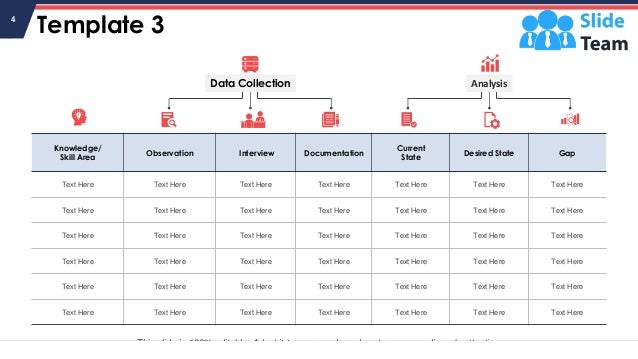
Various templates for gap analysis including corrective actions, phases, state assessments, and categories.
Discussion on KPIs across phases with numerical targets for transaction processing, market share, sales, and gross margins.
Use of icons and additional slides to support gap analysis presentations.
Details about the company's mission and presentation of team members involved.
Information about target audiences and branding strategy.
Visualization of gender demographics and financial comparisons through charts.
Use of linked graphs for dynamic data visualization on product performance across years.
Final slide with contact information and concluding remarks.


![CleanMyMac X v5.2.8 Crack for MacOS Full Version [Latest] pptx](https://cdn.slidesharecdn.com/ss_thumbnails/softwareoverview-251207194121-a81f0142-thumbnail.jpg?width=640&height=640&fit=bounds)
![AnyTrans for iOS 8.9.14.20251127 With Crack for MacOS [Latest] pptx](https://cdn.slidesharecdn.com/ss_thumbnails/softwareoverview-251207190907-2316965f-thumbnail.jpg?width=640&height=640&fit=bounds)
![iStat Menus 7.20 Crack for MacOS 2026 Full Version [Latest] pptx](https://cdn.slidesharecdn.com/ss_thumbnails/softwareoverview-251207191544-22b737dc-thumbnail.jpg?width=640&height=640&fit=bounds)
![Soundtoys Mac v5.5.5.0 Crack for MacOS Full Version [Latest] pptx](https://cdn.slidesharecdn.com/ss_thumbnails/softwareoverview-251207193711-91d8ae6b-thumbnail.jpg?width=640&height=640&fit=bounds)
![WinRAR Crack 7.13 Final Mac Keygen 2026 Download [Latest] Software.pptx](https://cdn.slidesharecdn.com/ss_thumbnails/software-251207185858-eb450678-thumbnail.jpg?width=640&height=640&fit=bounds)


