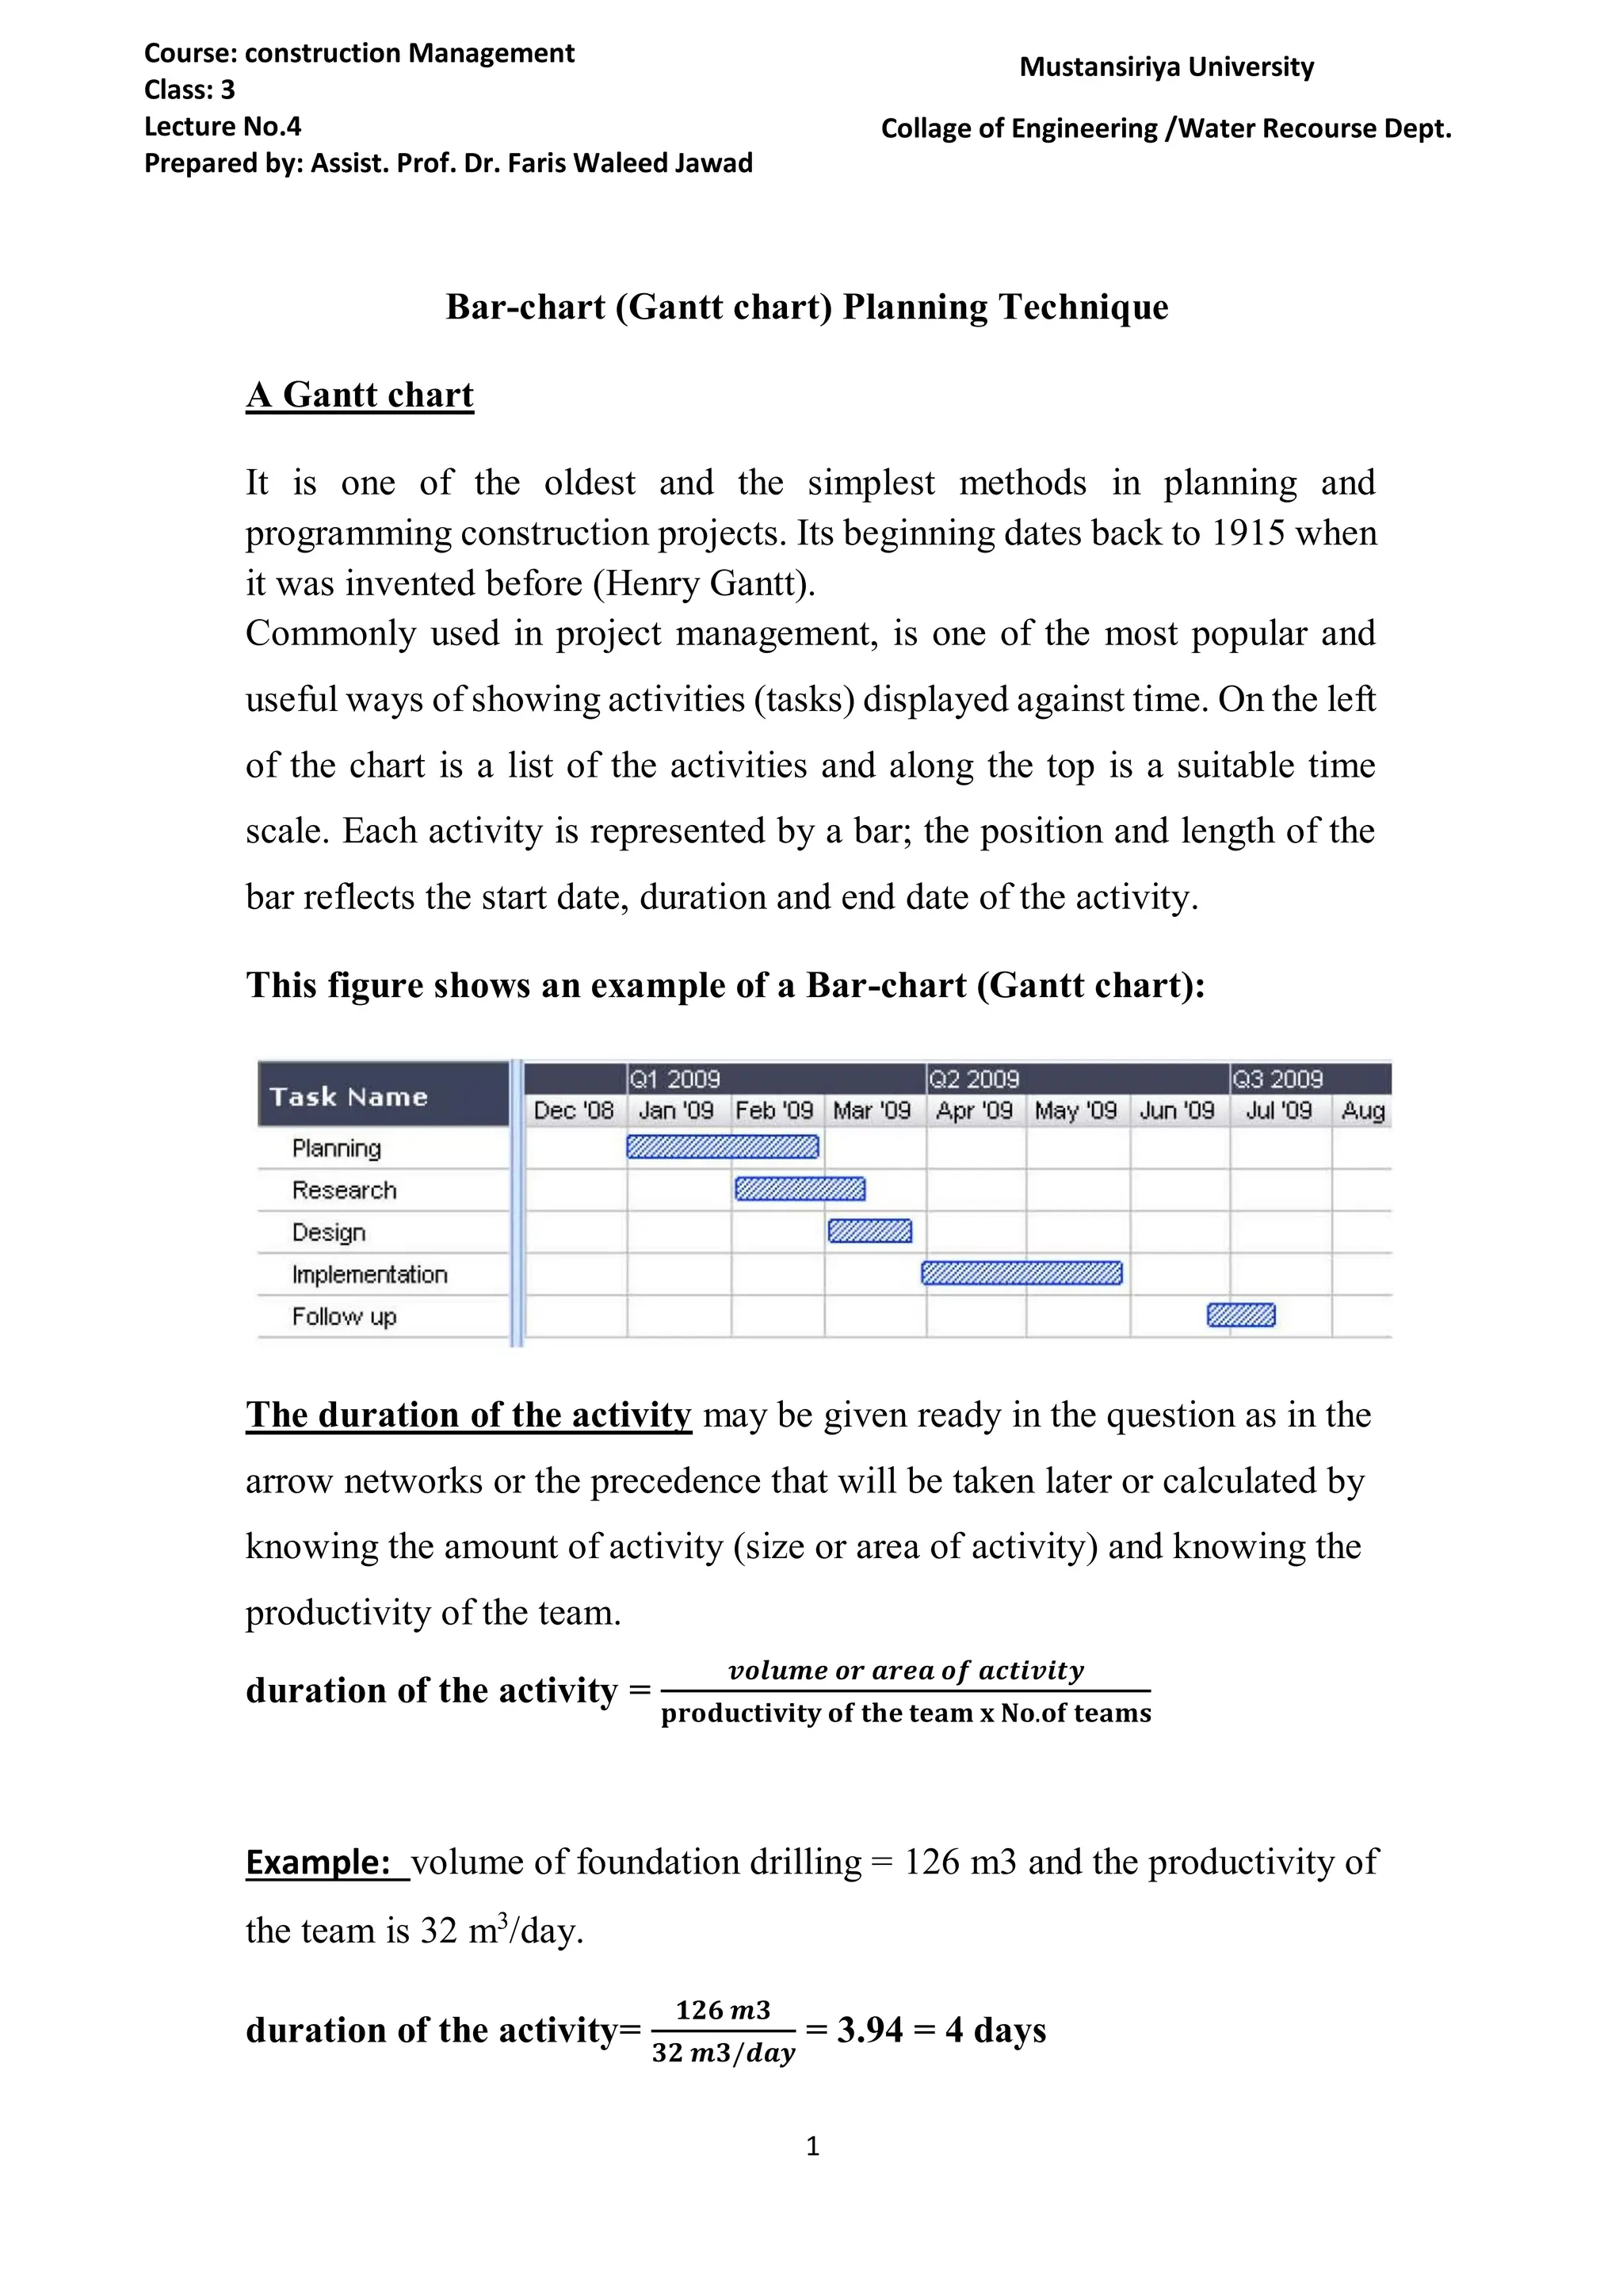
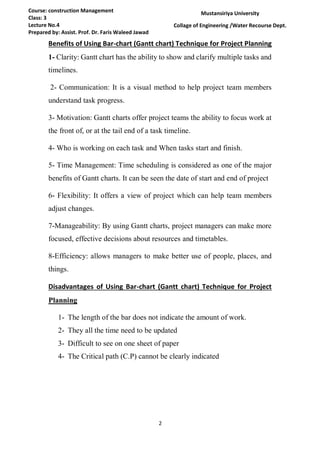
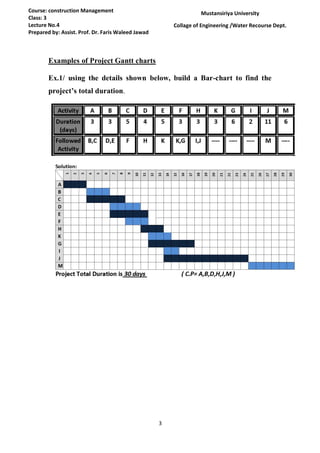
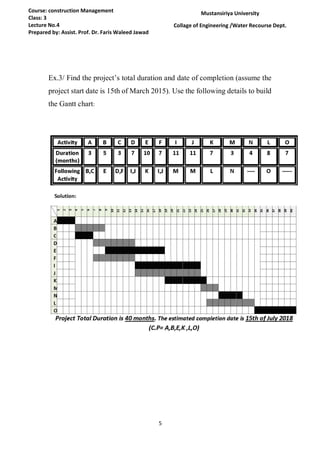
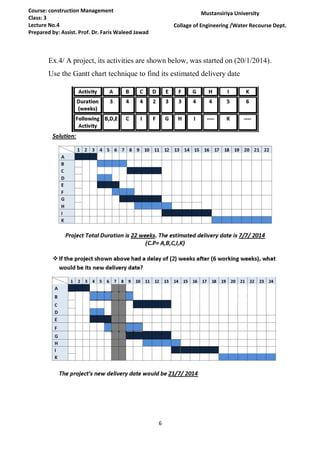
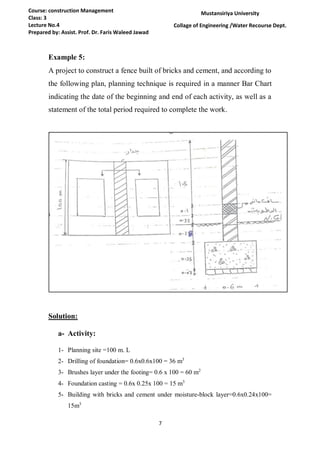
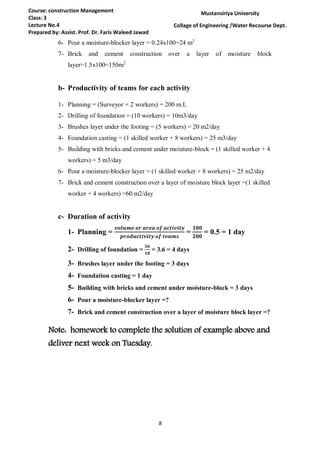
1
Course: construction Management
Class: 3
Lecture No.4
Prepared by: Assist. Prof. Dr. Faris Waleed Jawad
Mustansiriya University
Collage of Engineering /Water Recourse Dept.
Bar-chart (Gantt chart) Planning Technique
A Gantt chart
It is one of the oldest and the simplest methods in planning and
programming construction projects. Its beginning dates back to 1915 when
it was invented before (Henry Gantt).
Commonly used in project management, is one of the most popular and
useful ways of showing activities (tasks) displayed against time. On the left
of the chart is a list of the activities and along the top is a suitable time
scale. Each activity is represented by a bar; the position and length of the
bar reflects the start date, duration and end date of the activity.
This figure shows an example of a Bar-chart (Gantt chart):
The duration of the activity may be given ready in the question as in the
arrow networks or the precedence that will be taken later or calculated by
knowing the amount of activity (size or area of activity) and knowing the
productivity of the team.
duration of the activity =
𝒗𝒐𝒍𝒖𝒎𝒆 𝒐𝒓 𝒂𝒓𝒆𝒂 𝒐𝒇 𝒂𝒄𝒕𝒊𝒗𝒊𝒕𝒚
𝐩𝐫𝐨𝐝𝐮𝐜𝐭𝐢𝐯𝐢𝐭𝐲 𝐨𝐟 𝐭𝐡𝐞 𝐭𝐞𝐚𝐦 𝐱 𝐍𝐨.𝐨𝐟 𝐭𝐞𝐚𝐦𝐬
Example: volume of foundation drilling = 126 m3 and the productivity of
the team is 32 m3
/day.
duration of the activity=
𝟏𝟐𝟔 𝒎𝟑
𝟑𝟐 𝒎𝟑/𝒅𝒂𝒚
= 3.94 = 4 days
2
Course: construction Management
Class: 3
Lecture No.4
Prepared by: Assist. Prof. Dr. Faris Waleed Jawad
Mustansiriya University
Collage of Engineering /Water Recourse Dept.
Benefits of Using Bar-chart (Gantt chart) Technique for Project Planning
1- Clarity: Gantt chart has the ability to show and clarify multiple tasks and
timelines.
2- Communication: It is a visual method to help project team members
understand task progress.
3- Motivation: Gantt charts offer project teams the ability to focus work at
the front of, or at the tail end of a task timeline.
4- Who is working on each task and When tasks start and finish.
5- Time Management: Time scheduling is considered as one of the major
benefits of Gantt charts. It can be seen the date of start and end of project
6- Flexibility: It offers a view of project which can help team members
adjust changes.
7-Manageability: By using Gantt charts, project managers can make more
focused, effective decisions about resources and timetables.
8-Efficiency: allows managers to make better use of people, places, and
things.
Disadvantages of Using Bar-chart (Gantt chart) Technique for Project
Planning
1- The length of the bar does not indicate the amount of work.
2- They all the time need to be updated
3- Difficult to see on one sheet of paper
4- The Critical path (C.P) cannot be clearly indicated
3
Course: construction Management
Class: 3
Lecture No.4
Prepared by: Assist. Prof. Dr. Faris Waleed Jawad
Mustansiriya University
Collage of Engineering /Water Recourse Dept.
Examples of Project Gantt charts
Ex.1/ using the details shown below, build a Bar-chart to find the
project’s total duration.
4
Course: construction Management
Class: 3
Lecture No.4
Prepared by: Assist. Prof. Dr. Faris Waleed Jawad
Mustansiriya University
Collage of Engineering /Water Recourse Dept.
Ex.2/ Find the project’s total duration and date of completion (assume
the project start date is 1 st of December 2014). Use the following
details to build the Gantt chart:
5
Course: construction Management
Class: 3
Lecture No.4
Prepared by: Assist. Prof. Dr. Faris Waleed Jawad
Mustansiriya University
Collage of Engineering /Water Recourse Dept.
Ex.3/ Find the project’s total duration and date of completion (assume the
project start date is 15th of March 2015). Use the following details to build
the Gantt chart:
6
Course: construction Management
Class: 3
Lecture No.4
Prepared by: Assist. Prof. Dr. Faris Waleed Jawad
Mustansiriya University
Collage of Engineering /Water Recourse Dept.
Ex.4/ A project, its activities are shown below, was started on (20/1/2014).
Use the Gantt chart technique to find its estimated delivery date
7
Course: construction Management
Class: 3
Lecture No.4
Prepared by: Assist. Prof. Dr. Faris Waleed Jawad
Mustansiriya University
Collage of Engineering /Water Recourse Dept.
Example 5:
A project to construct a fence built of bricks and cement, and according to
the following plan, planning technique is required in a manner Bar Chart
indicating the date of the beginning and end of each activity, as well as a
statement of the total period required to complete the work.
Solution:
a- Activity:
1- Planning site =100 m. L
2- Drilling of foundation= 0.6x0.6x100 = 36 m3
3- Brushes layer under the footing= 0.6 x 100 = 60 m2
4- Foundation casting = 0.6x 0.25x 100 = 15 m3
5- Building with bricks and cement under moisture-block layer=0.6x0.24x100=
15m3
8
Course: construction Management
Class: 3
Lecture No.4
Prepared by: Assist. Prof. Dr. Faris Waleed Jawad
Mustansiriya University
Collage of Engineering /Water Recourse Dept.
6- Pour a moisture-blocker layer = 0.24x100=24 m2
7- Brick and cement construction over a layer of moisture block
layer=1.5x100=150m2
b- Productivity of teams for each activity
1- Planning = (Surveyor + 2 workers) = 200 m.L
2- Drilling of foundation = (10 workers) = 10m3/day
3- Brushes layer under the footing = (5 workers) = 20 m2/day
4- Foundation casting = (1 skilled worker + 8 workers) = 25 m3/day
5- Building with bricks and cement under moisture-block = (1 skilled worker + 4
workers) = 5 m3/day
6- Pour a moisture-blocker layer = (1 skilled worker + 8 workers) = 25 m2/day
7- Brick and cement construction over a layer of moisture block layer =(1 skilled
worker + 4 workers) =60 m2/day
c- Duration of activity
1- Planning =
𝒗𝒐𝒍𝒖𝒎𝒆 𝒐𝒓 𝒂𝒓𝒆𝒂 𝒐𝒇 𝒂𝒄𝒕𝒊𝒗𝒊𝒕𝒚
𝒑𝒓𝒐𝒅𝒖𝒄𝒕𝒊𝒗𝒊𝒕𝒚 𝒐𝒇 𝒕𝒆𝒂𝒎𝒔
=
𝟏𝟎𝟎
𝟐𝟎𝟎
= 0.5 = 1 day
2- Drilling of foundation =
𝟑𝟔
𝟏𝟎
= 3.6 = 4 days
3- Brushes layer under the footing = 3 days
4- Foundation casting = 1 day
5- Building with bricks and cement under moisture-block = 3 days
6- Pour a moisture-blocker layer =?
7- Brick and cement construction over a layer of moisture block layer =?
Note: homework to complete the solution of example above and
deliver next week on Tuesday.
9
Course: construction Management
Class: 3
Lecture No.4
Prepared by: Assist. Prof. Dr. Faris Waleed Jawad
Mustansiriya University
Collage of Engineering /Water Recourse Dept.
References
 Clark, Wallace (1922). The Gantt Chart: A Working Tool of Management. New
York, NY: Ronald Press.
 Flouris, Triant G.; Lock, Dennis (2012). Managing Aviation Projects from Concept
to Completion. Ashgate Publishing Limited. ISBN 978-1-4094-8613-8.
 Gantt, H.L. (1910). "Work, Wages and Profit". Engineering Magazine. New York.;
republished as Work, Wages and Profits. Easton, Pennsylvania: Hive Publishing
Company. 1974. ISBN 0-87960-048-9.
 Klein, R. (1999). Scheduling of Resource-Constrained Projects. Operations
Research/Computer Science Interfaces Series. Springer US. ISBN 978-0-7923-
8637-7

GANTT CHART- schedule management.pdf

  • 1.
    1 Course: construction Management Class:3 Lecture No.4 Prepared by: Assist. Prof. Dr. Faris Waleed Jawad Mustansiriya University Collage of Engineering /Water Recourse Dept. Bar-chart (Gantt chart) Planning Technique A Gantt chart It is one of the oldest and the simplest methods in planning and programming construction projects. Its beginning dates back to 1915 when it was invented before (Henry Gantt). Commonly used in project management, is one of the most popular and useful ways of showing activities (tasks) displayed against time. On the left of the chart is a list of the activities and along the top is a suitable time scale. Each activity is represented by a bar; the position and length of the bar reflects the start date, duration and end date of the activity. This figure shows an example of a Bar-chart (Gantt chart): The duration of the activity may be given ready in the question as in the arrow networks or the precedence that will be taken later or calculated by knowing the amount of activity (size or area of activity) and knowing the productivity of the team. duration of the activity = 𝒗𝒐𝒍𝒖𝒎𝒆 𝒐𝒓 𝒂𝒓𝒆𝒂 𝒐𝒇 𝒂𝒄𝒕𝒊𝒗𝒊𝒕𝒚 𝐩𝐫𝐨𝐝𝐮𝐜𝐭𝐢𝐯𝐢𝐭𝐲 𝐨𝐟 𝐭𝐡𝐞 𝐭𝐞𝐚𝐦 𝐱 𝐍𝐨.𝐨𝐟 𝐭𝐞𝐚𝐦𝐬 Example: volume of foundation drilling = 126 m3 and the productivity of the team is 32 m3 /day. duration of the activity= 𝟏𝟐𝟔 𝒎𝟑 𝟑𝟐 𝒎𝟑/𝒅𝒂𝒚 = 3.94 = 4 days
  • 2.
    2 Course: construction Management Class:3 Lecture No.4 Prepared by: Assist. Prof. Dr. Faris Waleed Jawad Mustansiriya University Collage of Engineering /Water Recourse Dept. Benefits of Using Bar-chart (Gantt chart) Technique for Project Planning 1- Clarity: Gantt chart has the ability to show and clarify multiple tasks and timelines. 2- Communication: It is a visual method to help project team members understand task progress. 3- Motivation: Gantt charts offer project teams the ability to focus work at the front of, or at the tail end of a task timeline. 4- Who is working on each task and When tasks start and finish. 5- Time Management: Time scheduling is considered as one of the major benefits of Gantt charts. It can be seen the date of start and end of project 6- Flexibility: It offers a view of project which can help team members adjust changes. 7-Manageability: By using Gantt charts, project managers can make more focused, effective decisions about resources and timetables. 8-Efficiency: allows managers to make better use of people, places, and things. Disadvantages of Using Bar-chart (Gantt chart) Technique for Project Planning 1- The length of the bar does not indicate the amount of work. 2- They all the time need to be updated 3- Difficult to see on one sheet of paper 4- The Critical path (C.P) cannot be clearly indicated
  • 3.
    3 Course: construction Management Class:3 Lecture No.4 Prepared by: Assist. Prof. Dr. Faris Waleed Jawad Mustansiriya University Collage of Engineering /Water Recourse Dept. Examples of Project Gantt charts Ex.1/ using the details shown below, build a Bar-chart to find the project’s total duration.
  • 4.
    4 Course: construction Management Class:3 Lecture No.4 Prepared by: Assist. Prof. Dr. Faris Waleed Jawad Mustansiriya University Collage of Engineering /Water Recourse Dept. Ex.2/ Find the project’s total duration and date of completion (assume the project start date is 1 st of December 2014). Use the following details to build the Gantt chart:
  • 5.
    5 Course: construction Management Class:3 Lecture No.4 Prepared by: Assist. Prof. Dr. Faris Waleed Jawad Mustansiriya University Collage of Engineering /Water Recourse Dept. Ex.3/ Find the project’s total duration and date of completion (assume the project start date is 15th of March 2015). Use the following details to build the Gantt chart:
  • 6.
    6 Course: construction Management Class:3 Lecture No.4 Prepared by: Assist. Prof. Dr. Faris Waleed Jawad Mustansiriya University Collage of Engineering /Water Recourse Dept. Ex.4/ A project, its activities are shown below, was started on (20/1/2014). Use the Gantt chart technique to find its estimated delivery date
  • 7.
    7 Course: construction Management Class:3 Lecture No.4 Prepared by: Assist. Prof. Dr. Faris Waleed Jawad Mustansiriya University Collage of Engineering /Water Recourse Dept. Example 5: A project to construct a fence built of bricks and cement, and according to the following plan, planning technique is required in a manner Bar Chart indicating the date of the beginning and end of each activity, as well as a statement of the total period required to complete the work. Solution: a- Activity: 1- Planning site =100 m. L 2- Drilling of foundation= 0.6x0.6x100 = 36 m3 3- Brushes layer under the footing= 0.6 x 100 = 60 m2 4- Foundation casting = 0.6x 0.25x 100 = 15 m3 5- Building with bricks and cement under moisture-block layer=0.6x0.24x100= 15m3
  • 8.
    8 Course: construction Management Class:3 Lecture No.4 Prepared by: Assist. Prof. Dr. Faris Waleed Jawad Mustansiriya University Collage of Engineering /Water Recourse Dept. 6- Pour a moisture-blocker layer = 0.24x100=24 m2 7- Brick and cement construction over a layer of moisture block layer=1.5x100=150m2 b- Productivity of teams for each activity 1- Planning = (Surveyor + 2 workers) = 200 m.L 2- Drilling of foundation = (10 workers) = 10m3/day 3- Brushes layer under the footing = (5 workers) = 20 m2/day 4- Foundation casting = (1 skilled worker + 8 workers) = 25 m3/day 5- Building with bricks and cement under moisture-block = (1 skilled worker + 4 workers) = 5 m3/day 6- Pour a moisture-blocker layer = (1 skilled worker + 8 workers) = 25 m2/day 7- Brick and cement construction over a layer of moisture block layer =(1 skilled worker + 4 workers) =60 m2/day c- Duration of activity 1- Planning = 𝒗𝒐𝒍𝒖𝒎𝒆 𝒐𝒓 𝒂𝒓𝒆𝒂 𝒐𝒇 𝒂𝒄𝒕𝒊𝒗𝒊𝒕𝒚 𝒑𝒓𝒐𝒅𝒖𝒄𝒕𝒊𝒗𝒊𝒕𝒚 𝒐𝒇 𝒕𝒆𝒂𝒎𝒔 = 𝟏𝟎𝟎 𝟐𝟎𝟎 = 0.5 = 1 day 2- Drilling of foundation = 𝟑𝟔 𝟏𝟎 = 3.6 = 4 days 3- Brushes layer under the footing = 3 days 4- Foundation casting = 1 day 5- Building with bricks and cement under moisture-block = 3 days 6- Pour a moisture-blocker layer =? 7- Brick and cement construction over a layer of moisture block layer =? Note: homework to complete the solution of example above and deliver next week on Tuesday.
  • 9.
    9 Course: construction Management Class:3 Lecture No.4 Prepared by: Assist. Prof. Dr. Faris Waleed Jawad Mustansiriya University Collage of Engineering /Water Recourse Dept. References  Clark, Wallace (1922). The Gantt Chart: A Working Tool of Management. New York, NY: Ronald Press.  Flouris, Triant G.; Lock, Dennis (2012). Managing Aviation Projects from Concept to Completion. Ashgate Publishing Limited. ISBN 978-1-4094-8613-8.  Gantt, H.L. (1910). "Work, Wages and Profit". Engineering Magazine. New York.; republished as Work, Wages and Profits. Easton, Pennsylvania: Hive Publishing Company. 1974. ISBN 0-87960-048-9.  Klein, R. (1999). Scheduling of Resource-Constrained Projects. Operations Research/Computer Science Interfaces Series. Springer US. ISBN 978-0-7923- 8637-7