Business Cycles Synchronization Assessment Using EBA and Wavelets
•
0 likes•102 views

International Journal of Engineering Research and Applications (IJERA) is an open access online peer reviewed international journal that publishes research and review articles in the fields of Computer Science, Neural Networks, Electrical Engineering, Software Engineering, Information Technology, Mechanical Engineering, Chemical Engineering, Plastic Engineering, Food Technology, Textile Engineering, Nano Technology & science, Power Electronics, Electronics & Communication Engineering, Computational mathematics, Image processing, Civil Engineering, Structural Engineering, Environmental Engineering, VLSI Testing & Low Power VLSI Design etc.

Recommended
Recommended
More Related Content
What's hot
What's hot (17)
Viewers also liked
Similar to Business Cycles Synchronization Assessment Using EBA and Wavelets
Similar to Business Cycles Synchronization Assessment Using EBA and Wavelets (20)
Recently uploaded
Recently uploaded (20)
Business Cycles Synchronization Assessment Using EBA and Wavelets
- 1. Mohamed BENBOUZIANE, Mustapha DJENNAS, Nasradine CHERIF / International Journal of Engineering Research and Applications (IJERA) ISSN: 2248-9622 www.ijera.com Vol. 3, Issue 3, May-Jun 2013, pp.1071-1081 1071 | P a g e Business Cycles Synchronization Assessment: AnEBA-Wavelets Approach Mohamed BENBOUZIANE*, Mustapha DJENNAS**, Nasradine CHERIF*** *(Department of Economics, Tlemcen University, Algeria) ** (Department of Economics, Tlemcen University, Algeria) ***(Department of Economics, Tlemcen University, Algeria) ABSTRACT This paperuses an Extreme Bound Analysis (EBA) and Wavelet Transformation (WT) to provide a detailed characterization of the Business Cycle Synchronization (BCS) within the selected countries belonging to the Euro Area (EA) and Gulf Cooperation Council countries (GCC). In addition, a cross wavelets transformation and wavelets coherency transformation analysis is introduced in order to understand how wavelets could be used in BCS leading likely to achieve high levels of economic activity integration betweencountries or groups of countries. The analyses are conducted by introducing the main determinants of BCS existing in the literature in order to understand how they could evolve both in time and in scale as far as the difference phases of the economic system construction is concerned. Globally, and unlike the EA, the results show not only a considerable delay in creating an economic and financial integration in the GCC, but more importantly, a growing divergence in business cycles (BC) among the GCC countries. Keywords- Business Cycles, Extreme Bounds Analysis, Synchronization, Wavelets. I. INTRODUCTION For many years, there was a very thorough debate on issues in relation with the establishment of secure economic zones, or even single currency areas. As the BCS is widely related to the literature on optimal currency areas or economic unions, and despite the existence of many divergent points of view in both theoretical and empirical spheres, there was still a large consensus about the importance of BCS as a necessary condition of successful economic integration. This paper tries to investigates the underlying factors of BCS in the EA and GCC by considering a large number of BCS determinants inspired from the previous theoretical and empirical works in this research field. In addition, the most important contribution in this work is the use of a combination of relevant econometric and heuristic tools, to be more specific, the use of an efficient approach of regression, Extreme Bound Analysis (EBA) and Stationary Wavelets Transformation (SWT). The paper has many important objectives embodied in three fundamental axes. First, to demonstrate at what degree BCsare correlated across EA and GCC. In addition, the analysis is extended to understand the gap between the economic integration in the EA and the GCC. Therefore, the cyclical component of the Gross Domestic Product (GDP)is considered in order to assess the different degrees of synchronization in the BC obtained by the extraction process as proposed by Hodrick and Prescott (HP-Filter). Therefore, the analysis are not based only on the GDP data but on a very smoothed variable leading to a more strong framework determining the factors driving BC differentials among EA and GCC countries and how these factors can evolve through time. Second, the paper tries to give an answer to the following two questions: why inside an economic group of interest, the BC of different countries may be synchronous or asynchronous. Moreover, why they may converge or diverge. To do this, the analysis includes a set of common factors in the literature, and for which data are within our reach. They are supposed to have an impact on the BCS. Third, a wavelets model is introduced to measure BCS among countries in the EA and GCC countries and to justify its relevance in relation with the used variables. Moreover, this work tries to overcome some problems with the popular approach in BCS related to the robustness of tests. Thereby, the results present the difference in the case of EA countries (supposed to be a good example of the economic and financial integration) and GCC countries. The remainder of this paper is structured as follows. Section 2 provides a recent literature review in relation with the potential determinants of BCS. Section 3 outlines the empirical analysis, namely the used data, the statistical approach and wavelets techniques and finally the obtained results. Section 4 discusses the economic interpretation of the results in the context of EA and GCC countries.
- 2. Mohamed BENBOUZIANE, Mustapha DJENNAS, Nasradine CHERIF / International Journal of Engineering Research and Applications (IJERA) ISSN: 2248-9622 www.ijera.com Vol. 3, Issue 3, May-Jun 2013, pp.1071-1081 1072 | P a g e II. LITERATURE REVIEW The literature on BCS is evolving both theoretically and empirically. Because of its diversity, it can be subdivided in several categories. For instance, the used variables, the considered technical packages in the analysis, the research context, etc. Since theory is indeterminate upon which factors are behind synchronization, identifying the determinants of synchronization is thus a subjective matter left to the initiative of the researcher (Baxter and Kouparitsas, 2005). By considering the research context, the most important part of works on BCS is concentrated (in a descending order) on the Euro area, United States and South Asia. Because of a huge number of constraints, the works on GCC or Middle East & North Africa (MENA) region are still insufficient and need more developments. Among the various works on the BCS, the following ones are the most important:On the path of Frankel and Rose (1998) work mainly focused on the effects of international trade, Rose and Engel (2002) confirm this statement of fact argued by the intensified trade flows between currency union members. As a result, BC are more synchronized across currency union countries. Artise et al. (2004) have presented a Markov Switching VAR models to assess the synchronization process in the European Union and to identify a common unobserved component that determines the European BC dynamics.Camacho et al. (2006) and Harding and Pagan (2006) have discussed how the degree of synchronization between BC of different countries can be measured and tested. They conclude that there is no common BC across Europe.Clark and Wincoop (2001) have argueed that BCs of U.S. Census regions are substantially more synchronized than those of European countries.Baxter and Kouparitsas (2005), Imbs (2004) and Inklaar et al. (2008) have analyzed a set of key variables like international trade flows, specialization, and financial integration and their relation with the synchronization process in both developing and industrialized countries. Imbs conclude that economic regions with strong financial links are significantly more synchronized, Baxter and Kouparitsas argue that currency unions are not important determinants of BCS and Inklaar et al. conclude that convergence in monetary and fiscal policies have a significant impact on BCS.Stockmann (1988) has focused his work on the importance of sectorial shocks for the BC and conclude that the degree of differences in sectorial specialization is negatively related to cycle synchronization, i.e. the more dissimilar the economies, the less correlated the cycles.Kalemli- Ozcan et al. (2003) have argued that countries with a high degree of financial integration tend to have more specialized industrial patterns and less synchronized BC. They corroborate their conclusions with the contagion effect of the financial crises and put forward a direct and positive effect of capital flows on BCS.From another point of view, Selover and Jensen (1999) have adopted a mathematical modeling approach to conclude that the BCprocess may result from a mode-locking phenomenon (a nonlinear process by which weak coupling between oscillating systems tends to synchronize oscillations in the systems). Overall, all the works are concentrated on the two main blocks of variables: trade(or)economic specialization and financial integration. Therefore, the literature is ambiguous on the real effect of these blocks of variables on the BCS. This is quite understandable since different researchers relay on various research ways. Their results are, however, not unequivocal and seem to depend on the economic structure of the country, the chosen period of time, samples, etc. III. EMPIRICAL ANALYSIS III.1. DATA AND VARIABLES DESCRIPTION This paper follow fundamentally the work of Baxter and Kouparitsas (2005), and Imbs (2004) with some small modifications to analyze the relationship between BCS and the following variables: bilateral trade, trade openness, trade specialization, economic specialization, deposit interest rate differentials, official exchange rate fluctuations, fiscal deficit differential, financial openness, monetary policy, current account balance, gross national savings as % of GDP, oil imports (only for EA), oil exports (only for GCC). In addition, two gravity variables are considered in the regression equation, namely geographical distance and population density. As a dependent variable, the GDP data are used, as usual. Fifty-five (55) pairs among the eleven EA countries are constructed and fifteen (15) pairs among the six GCC countries over the period 1980- 2011. In order to extract the specifications and most important events in the considered period, it is spilled to three sub-periods: 1980-1989, 1990-1999 and 2000-2011. The used terminology in the following equations corresponds to the country indices i and j as well as the time index t. In what follow, a description of each used variable in the regression is given. The considered variables are classified into two sets; the first one concerns the most important determinants of BCS proposed by Baxter and Kouparitsas (2005), Imbs (2004) and Inklaar (2005). The second set consists in policy and structural indicators, which appear particularly relevant in the context of an economic and monetary union. III.1.1. BUSINESS CYCLES SYNCHRONIZATION MEASUREMENT The dependent variable in this study is expressed by the degree of BCS between countries i
- 3. Mohamed BENBOUZIANE, Mustapha DJENNAS, Nasradine CHERIF / International Journal of Engineering Research and Applications (IJERA) ISSN: 2248-9622 www.ijera.com Vol. 3, Issue 3, May-Jun 2013, pp.1071-1081 1073 | P a g e and j at time t. To measure this variable, the Inklaar et al (2005) methodology is followed to conduct regressions with Fisher’s z-transformations of the correlation coefficients as dependent variable. The transformed correlation coefficients are calculated as: 𝑆𝑦𝑛𝑖𝑗 = 𝐶𝑜𝑟𝑟𝑡𝑟𝑎𝑛 ,𝑖𝑗 = 1 2 ln 1 + 𝐶𝑜𝑟𝑟𝑖𝑗 1 − 𝐶𝑜𝑟𝑟𝑖𝑗 Where Corrij is the pair-wise correlation coefficient of the cyclical components of GDP data of country i and country j. Since a Pearson’s correlation coefficient is bounded at -1 and 1, the error terms in a regression model of the determinants of BCS are unlikely to be normally distributed if the untransformed correlation coefficients are used (Inklaar et al, 2005). This complicates reliable inference. The transformed correlations do not suffer from this problem, since the transformation ensures that they are normally distributed (David, 1949). III.1.2. BUSINESS CYCLE SYNCHRONIZATION: FUNDAMENTAL DETERMINANTS There is no doubt that the foremost among the determinants of BC is the trade intensification. To understand the effect of trade on BCS, one can invoke the Ricardo comparative advantage theory and trade specialization. Increased trade must results in increased sectorial specialization leading to increased BC correlation. In addition, trade may act as a conduit for the transmission of shocks that affect all industries (Baxter and Kouparitsas, 2005). In this case, increased trade would lead to increased BC correlation, which means a positive relationship between trade and BCS. In relation with trade, four variables are considered, namely bilateral trade, trade openness, trade specialization and economic specialization. Two essential bilateral trade measurements are included: the first one (BLTRt) is defined as the average of the sum of bilateral exports and imports in a pair of countries, divided over the sum of total exports and imports: 𝐵𝐿𝑇𝑅𝑡𝑖𝑗 = 1 𝑇 𝑋𝑖𝑗𝑡 + 𝑀𝑖𝑗𝑡 + 𝑋𝑗𝑖𝑡 + 𝑀𝑗𝑖𝑡 𝑋𝑖𝑡 + 𝑀𝑖𝑡 + 𝑋𝑗𝑡 + 𝑀𝑗𝑡 𝑇 𝑡=1 The second one (BLTRy), express bilateral trade as a fraction of aggregate GDP in the two countries: 𝐵𝐿𝑇𝑅𝑦𝑖𝑗 = 1 𝑇 𝑋𝑖𝑗𝑡 + 𝑀𝑖𝑗𝑡 + 𝑋𝑗𝑖𝑡 + 𝑀𝑗𝑖𝑡 𝑌𝑖𝑡 + 𝑌𝑗𝑡 𝑇 𝑡=1 The trade openness (TROP) measure is intended to capture the general openness in a pair of countries. According to Baxter and Kouparitsas (2005), this variable is a good measure of the extent to which the country is exposed to global shocks. Thus, it is possible that higher trade, in the aggregate, leads to more-highly correlated business cycles: 𝑇𝑅𝑂𝑃𝑖𝑗 = 1 𝑇 𝑋𝑖𝑡 + 𝑀𝑖𝑡 + 𝑋𝑗𝑡 + 𝑀𝑗𝑡 𝑌𝑖𝑡 + 𝑌𝑗𝑡 𝑇 𝑡=1 Where X, M and Y denote exports, imports and GDP respectively. In the theoretical literature, there is a wide common assent about the impact of bilateral trade and market openness on the BC. Supposed to be positive relationships, it is argued that the more intensive trade between two countries (or the more open to trade), the higher the trade variable, and the more synchronous the BC (Baxter and Kouparitsas, 2005). Hence, there are common factors that create spillover effects for more synchronized BC between country-pairs. Trade specialization (TRSP) is measured by the cross-country difference between the average shares across time of a particular sector in total exports. To obtain an overall sectorial distance measure for total exports, we can calculate de summation of the distances for all sectors. In thiswork, three sectors are considered: goods exports, merchandizes exports and services exports. The variable is calculated as follow: 𝑇𝑅𝑆𝑃𝑖𝑗 = 1 𝑇 𝑒𝑥𝑠𝑖𝑛𝑡 𝑇 𝑡=1 − 1 𝑇 𝑒𝑥𝑠𝑗𝑛𝑡 𝑇 𝑡=1 Where exsint is the share of the sector n in the total exports of country i, at time t. Logically, differences in trade specialization patterns should be negatively related to BC correlation. Similarly to trade specialization, economic specialization (ECSP) expresses the share of an economic sector in the total economic outputs. It is the sum of the differences of sector shares in the economy’s output. Here, the three main sectors (agriculture, industry and services) are considered. The corresponding variable is calculated as follow: 𝐸𝐶𝑆𝑃𝑖𝑗 = 1 𝑇 𝑒𝑐𝑠𝑖𝑛𝑡 𝑇 𝑡=1 − 1 𝑇 𝑒𝑐𝑠𝑗𝑛𝑡 𝑇 𝑡=1 Where ecsint is the share of the sector n in the total economy’s output of country i, at time t. Once again, it is expected to obtain a negative relationship for this variable with BCS.It is noted that exsint and ecsint are the time average of the discrepancies in the economic structures between two countries. For the trade and economic specialization, it is expected to have negative coefficients between these variables and BC. That is the more similar the trade and economic structures of two countries, the higher is BC correlation. III.1.3. BUSINESS CYCLE SYNCHRONIZATION: SPECIFIC DETERMINANTS OF ECONOMIC AND CURRENCY UNION
- 4. Mohamed BENBOUZIANE, Mustapha DJENNAS, Nasradine CHERIF / International Journal of Engineering Research and Applications (IJERA) ISSN: 2248-9622 www.ijera.com Vol. 3, Issue 3, May-Jun 2013, pp.1071-1081 1074 | P a g e The other set of variables included in the analysis concern those used to assess the available suitable conditions to create an economic and monetary union: Deposit interest rate differentials (DIRD) is used to determine whether differences in the monetary policy have an impact on BCS. According to Inklaar (2005), the relationship direction is not clear and is ultimately an empirical matter. This dissonance is justified by the fact that in ordinary periods, countries with similar monetary policy have more synchronized BC, but in the case of crisis or external shocks, BC may be less correlated due to the inability to respond by individual monetary policy in the presence of policy coordination (Inklaar, 2005). The variable is calculated bay taking the absolute value of the mean sample of pairwise differences: 𝐷𝐼𝑅𝐷𝑖𝑗 = 1 𝑇 𝐷𝐼𝑅𝑖𝑡 − 𝐷𝐼𝑅𝑗𝑡 𝑇 𝑡=1 Official exchange rate fluctuations(OEXR) is another important variable to evaluate the relationship between the monetary policy and BCS. The more the volatility of exchange rate is bigger, less is the synchronization in BC. Hence, one can expect a negative correlation in this case (Frankel and Rose, 2002). This variable is first calculated by using the standard deviations of the bilateral nominal exchange rates between two countries, and then the standard deviations are scaled by the mean of the bilateral exchange rates over the sample time period: 𝑂𝐸𝑋𝑅_𝑠𝑑𝑖𝑗 = 𝜎 𝑂𝐸𝑋𝑅𝑖𝑗𝑡 1 𝑇 𝑂𝐸𝑋𝑅𝑖𝑗𝑡 𝑇 𝑡=1 The literature suggests that deposit interest rate and official exchange rate are negatively correlated withBC, that is to say highly correlated cycles are recorded in the presence of more similar monetary policy. Another important variable which can be included is theFiscal deficit differential (FIDD). From a theoretical point of view, the direction of the correlation between the fiscal deficit differentials and BCS is, once again, not confirmed. Empirically, the variable is constructed as the mean sample of the bilateral differences of fiscal deficit (FD) ratios between two countries, and then taken as the absolute value: 𝐹𝐼𝐷𝐷𝑖𝑗 = 1 𝑇 𝐹𝐷𝑖𝑡 − 𝐹𝐷𝑗𝑡 𝑇 𝑡=1 In most cases, similar fiscal policies correspond to increased correlation between BC leading to a negative, that is, larger difference in fiscal deficit leads to less synchronized BC (Frankel and Rose, 2002). Financial openness (FIOP) is a measure of capital account openness. Usually, the Chinn and Ito (2002) is used to measure the capital account openness, constructed as the first standardized principal component of the inverse of the IMF binary indicators. Here, the bilateral capital account openness is measured as the period average of the sum of the Chinn and Ito’s indicators (Chinn and Ito, 2002): 𝐹𝐼𝑂𝑃𝑖𝑗 = 𝐾𝑎𝑜𝑝𝑒𝑛𝑖𝑗 = 1 𝑇 𝐾𝑎𝑜𝑝𝑒𝑛𝑖𝑡 + 𝐾𝑎𝑜𝑝𝑒𝑛𝑗𝑡 𝑇 𝑡=1 Where Kaopen is theChin and Ito’s measure of capital account openness. It goes without saying that more open capital account in a country lead to more vulnerable situation against global financial shocks or economic crisis. Therefore, countries with high financial openness are likely to have high correlated BC (positive coefficients). Monetary policy (MOPY), is expressed by the calculation of the Pearson coefficient of correlation calculated as the money and quasi money annual growth (M2 annual %): 𝑀𝑂𝑃𝑌𝑖𝑗 = 𝐶𝑜𝑟𝑟𝑖𝑗 (𝑀2𝑖𝑡 , 𝑀2𝑗𝑡 ) Current account balance (CUAB) as a percent of GDP is defined as the sum of net exports of goods, services, net income, and net current transfers. To capture the relation between current account balance and BCS, the Pearson correlation coefficient is calculated between two countries: 𝐶𝑈𝐴𝐵_𝑐𝑜𝑟𝑟𝑖𝑗 = 𝐶𝑜𝑟𝑟𝑖𝑗 (𝐶𝑈𝐴𝐵𝑖𝑡 , 𝐶𝑈𝐴𝐵𝑗𝑡 ) Gross national savings as % of GDP (GNSA) expressed as gross national income less total consumption, plus net transfers: 𝐺𝑁𝑆𝐴_𝑐𝑜𝑟𝑟𝑖𝑗 = 𝐶𝑜𝑟𝑟𝑖𝑗 (𝐺𝑁𝑆𝐴𝑖𝑡 , 𝐺𝑁𝑆𝐴𝑗𝑡 ) It is expected that countries with similar monetary policies, current account balance and gross national savings to experience similar BC. Consequently, the estimated regression coefficients on these variables must be positive as regards of BC. By considering trade in oil market, the nature of the economic structure for each country should be carefully analyzed. Because European countries are relatively classified as oil importers, oil importations (OIIM) are used as an exogenous variable in the regression model. In contrary, it is more logical to use the value of oil exportations (OIEX) for the GCC since their economies are widely dependent on the oil rents: 𝑂𝐼𝐼𝑀(𝐸𝑈)_𝑐𝑜𝑟𝑟𝑖𝑗 = 𝐶𝑜𝑟𝑟𝑖𝑗 (𝑂𝐼𝐼𝑀𝑖𝑡 , 𝑂𝐼𝐼𝑀𝑗𝑡 ) 𝑂𝐼𝐸𝑋(𝐺𝐶𝐶)_𝑐𝑜𝑟𝑟𝑖𝑗 = 𝐶𝑜𝑟𝑟𝑖𝑗 (𝑂𝐼𝐸𝑋𝑖𝑡 , 𝑂𝐼𝐸𝑋𝑗𝑡 ) Logically, countries with similar profile as for oil trading express more correlated BC. Then, one could expect a positive relationship between oil imports or exports and BCS within county-pairs. In addition, gravity variables are commonly included in the regression analysis. The two considered variables are the geographical distance and the population density. Geographical
- 5. Mohamed BENBOUZIANE, Mustapha DJENNAS, Nasradine CHERIF / International Journal of Engineering Research and Applications (IJERA) ISSN: 2248-9622 www.ijera.com Vol. 3, Issue 3, May-Jun 2013, pp.1071-1081 1075 | P a g e distance is expressed in terms of distance between national capitals in kilometer units and population density is midyear population divided by land area in square kilometers. It is well known that a large fraction of bilateral trade can be explained, in a statistical sense, by a set of gravity variables that include distance between countries, indicator variables for common language and adjacency, and variables that measure the difference between countries levels of GDP (Baxter and Kouparitsas, 2005). Therefore, the gravity variables are usually included in the analysis as a set of always-included variables. However, it would be necessary to investigate whether the gravity variables are robust explanatory variables for BCS in a first stage of analysis. III.2. EXTREME-BOUND ANALYSIS In order to identify more exactly the main determinants of BCS across EA and GCC, a special type of regression called Extreme Bound Analysis (EBA) is adopted as proposed by Leamer (1983) and developed by Levine and Renelt (1992), Levine and Zervos (1993), and Sala-i-Martin (1997). The principal is quite convincing, when we use a simple OLS regression, the estimated coefficients are often unstable and much conditional on the choice of information set. A variable may appear as significant in one combination of repressors and not significant in another. In others words, a variable is considered robust when its statistical significance is not conditional on the information set, namely on whether other economic variables are included in the equation or not. Consequently, and before deciding if a variable is a robust determinant of BCS or not, an important number of regression combination must be run. A determinant variable for the BCS must have the same behavior in all combinations (Baxter and Kouparitsas, 2005). The used criteria in robustness check of the entire variables are more discussed in the next paragraph. The regression is about a dependent variable Y with various sets of independent variables. In our case, Y is a vector of BC expressed as the cyclical component extracted by the Hodrick- Prescott Filter of the GDP correlations Yij between pairs of countries i and j. The general regression form as presented by Leamer (1983) based on the EBA is: 𝑌 = 𝛽𝑖(𝐼) + 𝛽 𝑚 (𝑀) + 𝛽𝑧(𝑍) + 𝜇 The independent variables are classified into three categories, I, M and Z. I denotes a set of always-included variables (The gravity variables geographical distance and population density may fall into that group). The M-variable is the candidate variable which is being tested for robustness. At the same time, the Z-variables contain other variables identified as potential determinants of BCS.The EBA is performed by the following algorithm: 1- Run a baseline bivariate regression for each M- variable without any Z variables. A necessary condition for a variable to be a meaningful determinant of BCS is that it should be first significant in a bivariate regression. Otherwise, it is excluded from the analysis. 2- Varying the set of Z-variables (for each possible combination) included in the regression for a particular M-variable. 3- From these regressions, the EBA determined the highest and lowest values of confidence intervals constructed from the estimated βm: The extreme upper bound (EUB) is equal to the maximum estimated βm plus two times its standard error: 𝐸𝑈𝐵 = 𝛽 𝑚 𝑀𝐴𝑋 + 2𝜎 𝛽 𝑚 𝑀𝐴𝑋 The extreme lower bound (ELB) is the minimum estimated βm, minus two times its standard error: 𝐸𝐿𝐵 = 𝛽 𝑚 𝑚𝑖𝑛 − 2𝜎 𝛽 𝑚 𝑚𝑖𝑛 4- An M-variable is robust if these highest and lowest values are of the same sign and if all estimated βm coefficients are significant. Tables 1 and 2 illustrate a summary of EBA applied for both EA and GCC. In parallel, figures 1, 2 and 3 represent the evolution of BCS over time based on the average correlation coefficient. According to figures 1, 2 and 3, many countries have experienced some interesting change in their degree of synchronization like Austria, Belgium and Ireland, which is not the case of other countries like Finland, Greece and Portugal. In addition, GCC countries are very weak and globally they are far from apossible horizon of constructing a common currency area. Even for the strongest economies, the BCS index is very low and there is no perspective for any latent predisposing factors for a monetary union. The best values of BCS are for the following countries: Qatar, Saudi Arabia and United Arab Emirates.Moreover, the European integration is well captured in the third period. It is seen as the period of preparation for European monetary union period.
- 6. Mohamed BENBOUZIANE, Mustapha DJENNAS, Nasradine CHERIF / International Journal of Engineering Research and Applications (IJERA) ISSN: 2248-9622 www.ijera.com Vol. 3, Issue 3, May-Jun 2013, pp.1071-1081 1076 | P a g e Table 1. EBA results in EA Variables 1980- 1989 1990-1999 2000- 2011 Fundamental determinants of business cycle synchronization Bilateral Trade BLTRt (Trade criteria) Robust (+) Robust (+) Robust (+) Bilateral trade BLTRy (GDP criteria) Robust (+) Robust (+) Robust (+) Trade openness TROP Quasi Robust(+) Robust (+) Robust (+) Trade specialization TRSP Quasi- Robust(-) Robust (-) Robust (-) Economic specialization ECSP Robust (-) Robust (-) Quasi- Robust(- ) Specific determinants of economic and currency union Deposit interest rates differentials DRID Robust (-) Robust (-) Fragile Official exchange rate fluctuations OEXR Robust (-) Robust (-) Fragile Fiscal deficit differentials FIDD Robust (-) Robust (-) Robust (-) Financial openness FIOP Fragile Quasi- Robust(+) Robust (+) Monetary policy MOPY Robust (+) Fragile Robust (+) Current Account Balance CUAB Robust (+) Robust (+) Robust (+) Gross national savings % of GDP GNSA Robust (+) Robust (+) Robust (+) Oil imports OIIM (only EA) Quasi- Robust(+) Robust (+) Robust (+) Oil exports OIEX (only GCC) -- -- -- Gravity variables Geographical distance GEOD Robust (-) Robust (-) Robust (-) Population density PODE Robust (+) Fragile Significant+ Robust (+) Fragile significant with + or – signs indicate that the variable is significant only in the bivariate regression Table 2. EBA results in GCC Variables 1980-1989 1990- 1999 2000- 2011 Fundamental determinants of business cycle synchronization Bilateral Trade BLTRt (Trade criteria) Fragile Fragile Fragile Significa nt+ Bilateral trade BLTRy (GDP criteria) Fragile Fragile Fragile Trade openness TROP Fragile Significan t+ Fragile Fragile Trade specialization TRSP Quasi- Robust(-) Robust (-) Fragile Economic specialization ECSP Fragile Fragile Fragile Specific determinants of economic and currency union Deposit interest rates differentials DRID Quasi- Robust (+) Fragile Fragile Official exchange rate fluctuations OEXR Fragile Significan t- Fragile Significa nt- Fragile Significa nt- Fiscal deficit differentials FIDD Quasi- Robust(-) Fragile Significa nt- Quasi- Robust(- ) Financial openness FIOP Fragile Fragile Fragile Monetary policy MOPY Quasi- Robust (+) Fragile Quasi- Robust (+) Current Account Balance CUAB Robust (+) Quasi- Robust (+) Quasi- Robust (+) Gross national savings % of GDP GNSA Fragile Significan t+ Fragile Fragile Oil imports OIIM (only EA) -- -- -- Oil exports OIEX (only GCC) Robust (+) Robust (+) Robust (+) Gravity variables Geographical distance GEOD Robust (-) Robust (-) Robust (-) Population density PODE Fragile Significan t+ Robust (+) Fragile Significa nt+ Fragile significant with + or – signs indicate that the variable is significant only in the bivariate regression
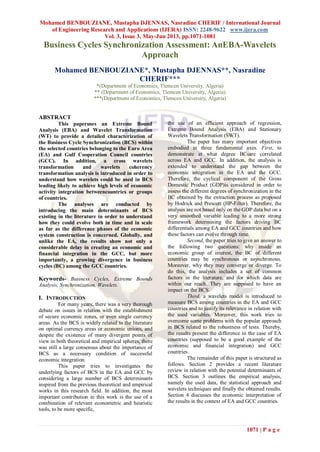
- 7. Mohamed BENBOUZIANE, Mustapha DJENNAS, Nasradine CHERIF / International Journal of Engineering Research and Applications (IJERA) ISSN: 2248-9622 www.ijera.com Vol. 3, Issue 3, May-Jun 2013, pp.1071-1081 1077 | P a g e 1980- 2011 1980- 1989 1990- 1999 2000- 2011 Euro Area 0.83 0.84 0.88 1.16 GCC countries 0.51 0.42 0.20 0.87 Euro Area (denoised signal) 0.55 0.59 0.64 0.72 GCC countries (denoised signal) 0.49 0.41 0.18 0.70 0.00 0.20 0.40 0.60 0.80 1.00 1.20 1.40 BCSIndexFigure 1. Business Cycle Correlation over Time -80.0000 -60.0000 -40.0000 -20.0000 0.0000 20.0000 40.0000 60.0000 80.0000 100.0000 120.0000 1980198219841986198819901992199419961998200020022004200620082010 C_GDP(Billiondollars) Figure 3. Business cycle synchronization in the GCC (1980-2011) BHR KWT OMN QAT SAU ARE III.3. WAVELETS IN BUSINESS CYCLES SYNCHRONIZATION Undoubtedly seen as a subject in progression, the application of wavelet theory in economics and finance is still in its beginning since wavelets models are not explored yet in finance and economic literature. Nevertheless, there is a growing interest in applying wavelet theory todeeply understand BCS. The following works are considered among the most important in relation with BC: Raihan, Wen and Zeng (2005); Crowley and Lee (2005); Crowley, Maraun and Mayes (2006); Gallegati and Gallegati (2007); Yogo (2008); Aguiar-Conraria and Soares (2009). Considered as a new engineering tool, wavelet analysis is widely related to applications of image processing, engineering, astronomy, meteorology and time series analysis since they can be used in order to unveil latent processes with changing cyclical patterns, trends and other non- stationary characteristics supposed to be very appropriate in studying synchronization in BC. This paperfocuses on two models of continuous discrete wavelets transformations: the Cross Wavelets model (XWT) and the wavelets coherence model (WCT). As continuous and discrete in time frequency (scales), these two wavelets models are very appropriate in studying BCS by offering the following advantages: - Wavelets permit to examine trends and seasonal time series without need to prior transformations. Therefore, there is no need of any pre-process to deal with deterministic and stochastic trends due to the fact that wavelet filtering usually embeds enough differencing operations. - Wavelets reduce computational complexity. All the wavelets models (even the most complex ones) can be computed with faster and efficient algorithms (Cohen and Walden, 2010a). - Wavelets offer a more precise timing of shocks causing and influencing BC. - Wavelets are nonparametric models and they are very suitable to examine nonlinear processes without loss of information. III.3.1. WAVELETS CROSSING AND WAVELETS COHERENCE The cross wavelets transform (XWT) and wavelets coherence (WCT) are wavelets models allowing analyzing the temporal evolution of the frequency content of a given signal or timing series. The application of XWT and WCT to two time series and the cross examination of the two decompositions can reveal localized similarities in time and scale. Areas in the time-frequency plane where two time series exhibit common power or consistent phase behavior indicate a relationship between the signals (Cohen and Walden, 2010a). In our case, these two models are very appropriate to compare BCS across a pair of countries both in terms of evolution in time and degree of synchronization. In the following two sections, the cross wavelets and wavelets coherence models are presented according to the works of Torrence and Compo (1998), Torrence and Webster (1998), and Grinsted et al. (2004). III.3.1.1. CROSS WAVELET TRANSFORM XWT Wavelets crossing and wavelets coherence are an extension of the Fourier Coherency Transform. The latter was often used to identify -150.0000 -100.0000 -50.0000 0.0000 50.0000 100.0000 C_GDP(Billionsdollars) Figure 2. Business cycle synchronization in the Euro Area (1980- 2011) AUT BEL FIN FRA DEU GRC IRL ITA NLD PRT ESP
- 8. Mohamed BENBOUZIANE, Mustapha DJENNAS, Nasradine CHERIF / International Journal of Engineering Research and Applications (IJERA) ISSN: 2248-9622 www.ijera.com Vol. 3, Issue 3, May-Jun 2013, pp.1071-1081 1078 | P a g e Figure 4. XWT and WCT between Austria and Belgium and between Austria and Italy common frequency brands between two time series. Therefore, it is possible to develop a wavelet coherency which could identify both frequency bands and time intervals when the time series were related (Liu 1994). Unfortunately, in Fourier analysis, it is necessary to smooth the cross spectrum before calculating coherency which is otherwise identically equal to 1. As a result, the used smoothing process in cross-wavelet spectrum was unclear and inadequate to define an appropriate wavelet coherency (Liu 1994). To avoid this shortcomings situation, the wavelet coherency is used to maintain a smoothing process in both time and scale, with the amount of smoothing dependent on both the choice of wavelet and the scale. The cross wavelet transform (XWT) of two time series Xn and Yn with wavelet transforms 𝑊𝑛 𝑋 𝑠 and 𝑊𝑛 𝑌 𝑠 is defined as: 𝑊𝑛 𝑋𝑌 𝑠 = 𝑊𝑛 𝑋 (𝑠)𝑊𝑛 𝑌∗ (𝑠). Where * is the complex conjugate of 𝑊𝑛 𝑌 (s), n is the time index and s is the scale. The cross-wavelet spectrum is complex, and hence one can define the cross-wavelet power as 𝑊𝑛 𝑋𝑌 (𝑠) . The complex argument 𝑎𝑟𝑔(𝑊 𝑋𝑌 ) can be interpreted as the local relative phase between Xn and Yn in time frequency space. The theoretical cross-wavelet distribution of two time series with theoretical Fourier spectra𝑃𝑘 𝑋 and 𝑃𝑘 𝑌 is given in Torrence and Compo (1998) as: 𝐷 𝑊𝑛 𝑋 𝑠 𝑊𝑛 𝑌∗ (𝑠) 𝜎𝑋 𝜎𝑌 < 𝑝 = 𝑍 𝜈 (𝑝) 𝜈 𝑃𝑘 𝑋 𝑃𝑘 𝑌 Where 𝑍 𝜈 (𝑝)is the confidence level associated with probability p, σX and σYare the respective standard deviations. If ν = 1 (real wavelets), Z1(95%) = 2.182, while if ν = 2 (complex wavelets), Z2(95%) = 3.999. III.3.1.2. WAVELETS COHERENCE TRANSFORM (WCT) As the cross wavelet power is used to reveal areas with high common power, the cross wavelets coherence transform is a second useful technique that can be adapted to evaluate coherency in time frequency space. According to Torrence and Webster (1998), the wavelet coherence of two time series is given by the following formula: 𝑅 𝑛 2 𝑠 = 𝑆 𝑠−1 𝑊𝑛 𝑋𝑌 𝑠 2 𝑆 𝑠−1 𝑊𝑛 𝑋(𝑠) 2 . 𝑆 𝑠−1 𝑊𝑛 𝑌(𝑠) 2 Where S is a smoothing operator in both time and scale. Here, the coherency parameter 𝑅 𝑛 2 𝑠 is always included between 0 and 1, (0 ≤ 𝑅 𝑛 2 𝑠 ≤ 1). Hence, wavelet coherence is often seen as a localized correlation coefficient in time frequency space. It is an accurate representation of the normalized covariance between the two time series. Therefore, to assess the statistical significance of the estimated wavelet coherency, the Monte Carlo simulation methods are used, and the confidence interval is defined as the probability that the true wavelet power at a certain time and scale lies within a certain interval about the estimated wavelet power (Torrence and Compo, 1998). The theoretical wavelet power σ2 Pk with the true wavelet power, is defined as Ψ 𝑆 2 (𝑠). The confidence interval for Ψ 𝑆 2 (𝑠) is then: 2 𝜒2 2 𝑝/2 𝑊𝑛 (𝑠) 2 ≤ Ψ 𝑛 2 (𝑠) ≤ 2 𝜒2 2 1 − 𝑝/2 𝑊𝑛 (𝑠) 2 Where p is the desired significance (p = 0.05 for the 95% confidence interval), 𝜒2 2 is a chi- square distributed variable with two DOFs (degree of freedom) (Jenkins and Watts 1968), and 𝜒2 2 (p/2) represents the value of χ2 at p/2. III.3.2. XWT AND WCT RESULTS In what follows, the XWT and WTC results are presented in a synthesized way. That is we will limit the discussion for both EA and GCC countries by taking only the highest and lowest coefficients of BCS between country-pairs. For instance, when considering the BCS between Austria and Belgium and between Austria and Italy, we can see more areas with red color in the first case than the second, which means a relative important correlation in term of BC between Austria and Belgium than Austria and Italy (figure 4). In addition, wavelets tell us much information about the correlation evolution in time. In the case of EA, the strongest similarities are likely common to the period slightly before 1999 (Euro adoption). As in (Torrence and Compo, 1998) and (Grinsted et al, 2004), both XWT and WCT figures have some decisive criteria that may be respected in the results interpretation.
- 9. Mohamed BENBOUZIANE, Mustapha DJENNAS, Nasradine CHERIF / International Journal of Engineering Research and Applications (IJERA) ISSN: 2248-9622 www.ijera.com Vol. 3, Issue 3, May-Jun 2013, pp.1071-1081 1079 | P a g e Figure 5. XWT and WCT between Bahrain and United Arab Emirates and between Kuwait and Oman In the XWT figures, the 5% significance level against red noise is shown as a thick contour. The black contour designates the 5% significance level estimated by Monte Carlo simulations beta surrogate series. The cone of influence, which indicates the region affected by edge effects, is shown with a thin black line. The relative phase relationship is shown as arrows (with in-phase pointing right, anti-phase pointing left. The color code for power ranges from blue (low power) to red (high power). In the WTC figures, expressing the coherence in the BC, the black thick contour designates the 5% significance level estimated by Monte Carlo simulations using beta surrogate series. The 5% significance level against red noise is shown as a thick contour. All significant sections show anti-phase behavior. The color code for coherency ranges from blue (low coherency — close to zero) to red (high coherency — close to one). Looking at figure 4, it can deducted that correlation in BC is not a preliminary condition for BC coherency and vice-versa. In the EA, high coherency in BC is recorded starting after the Euro currency adoption, even if BC where highly correlated before 1999. Wavelets correlation transformation and wavelets coherency transformation are two complementary techniques to assess BCS evolution in both time and scale. In addition, and as mentioned above, the cross-wavelets transformation gives information on the delay, or synchronization, between oscillations or scales between two time-series. Unfortunately, this information is sometimes incomplete because there is always some redundancy in the time-series (Torrence and Compo, 1998). Consequently, wavelets coherence are used to avoid this situation. As, the cross-wavelet transform will tell us if the correlation is significant or not, the wavelet coherence transformation has the advantage of being normalized by the power spectrum of the two time- series (Torrence and Compo, 1998). Hence, all the regions, which represent likely high coherency between two countries, are synonym of strong local correlation. In other words, countries with common high coherency areas represent strong possibilities of creating very similar BC. Looking at figure 5, one can observe that BC between GCC countries are not very synchronous, even for the neighboring countries. In addition, regions with high coherence are situated at low frequencies. When comparing figure 4 and 5, there is a deep difference between the two regions in terms of color code. Interestingly, for the GCC countries, the phases aligned at high frequencies are not numerous, the main part of them are rather occurred at low frequencies. In addition, coherency phases are notably scattered in a time interval of two years (in average). It is interesting to mention that in the case of EA and even after the last worldwide economic crisis, countries with strong correlation in BC have kept almost main correlation and coherency areas. Contrary to EA, it seems like GCC countries have started a new stage of divergence in terms of BCS. Furthermore, this divergence stages are situated at low levels frequency. Hence, GCC countries are likely far from constructing an economic and monetary union at least in the next 5 years. IV. SUMMARY AND CONCLUSIONS This paper tried to make a deeper understanding of the relationship between BC and the most important economic aggregates used in the literature in two economic groups, namely EA and GCC. The used variables were mainly based on the bilateral trade and economic specialization as basic determinants and other specific variables in relation with the financial integration and coherence between countries. It have tried in addition to understand the spillover effects of BC. The analyses have also include an Extreme Bound Analysis in order to evaluate the relative influence of every used variable. In addition, BCswere assessed by two wavelets techniques: the wavelets crossingtransformation and the wavelets coherency transformation. The first technique has identified the main intervals of correlation between country-pairs for both EA and GCC. The second technique was rather used to show the possible coherency andconvergence possibilities. The main results showed that the chosen determinants of BC were very appropriate for the EA but not for the GCC. The reason was confirmed by the recorded divergence in the economic structure between GCC countries. The only common point of convergence was the oil exportations.
- 10. Mohamed BENBOUZIANE, Mustapha DJENNAS, Nasradine CHERIF / International Journal of Engineering Research and Applications (IJERA) ISSN: 2248-9622 www.ijera.com Vol. 3, Issue 3, May-Jun 2013, pp.1071-1081 1080 | P a g e In addition, by considering the wavelets analysis, the GCC countries have still represent divergence either in time or in scale. Paradoxically, the divergence is more increasing after the last worldwide economic crisis. The use of wavelets in BC offer the advantage to deal with more smoothed parameters. The technique is more suitable in the case were BC indexes contain a very important part of noise. Overall, the global results figure out some interesting remarks: GCC could not be compared to EA in terms of BSC. The latter has expressed very high correlation in BC in some country-pairs contrary to GCC. In addition, most of the countries in the EA that were characterized by low index of BC have improved their synchronization process over the time, especially after 1999. EA countries represent many possibilities for synchronizing their BC both in time and scale. However, GCC countries are still far from approaching an economic and monetary union. REFERENCES [1] Aguiar-Conraria L. and Soares M.J.: Business Cycle Synchronisation across the Euro Area: A Wavelet Analysis. University of Minho, NIPE Working Papers 8, 2009. http://www3.eeg.uminho.pt/economia/nipe/ docs/2009/NIPE_WP_8_2009.pdf [2] Artis M., Krolzig H. M. and Toro J.: The European business cycle, Oxford Economic Papers, vol. 56, pp1-44, 2004. [3] Baxter M. and Kouparitsas M.: Determinants of business cycle comovement: a robust analysis, Journal of Monetary Economics, vol. 52, pp113-157, 2005. [4] Bradley. P.: Shift-invariance in the discrete wavelet transform. Proceedings of the Seventh International Conference on Digital Image Computing: Techniques and Applications, pp29-38, 2003. [5] Camacho M., Perez-Quiros G. and Saiz L.: Are European business cycles close enough to be just one? Journal of Economics Dynamics and Control, vol. 30, pp1687- 1706, 2006. [6] Chinn M. and Ito H.: Capital Account Liberalization, Institutions and Financial Development: Cross Country Evidence, National Bureau of Economic Research, Working Paper No 9867, 2002. [7] Clark T.E. and Wincoop E.: Borders and business cycles, Journal of International Economics, vol. 55, pp59-85, 2001. [8] Cohen E. A. K. and Walden A. T.: A Statistical Analysis of Morse Wavelet Coherence, IEEE Transactions of Signal Processing, vol. 58(3), pp980-989, 2010a. [9] Crowley P.M. and Lee J.: Decomposing the Co-movement of the Business Cycle: A Time-Frequency Analysis of Growth Cycles in the Euro Area. Bank of Finland, Bank of Finland Research Discussion Papers 12, 2005. http://www.suomenpankki.fi/en/julkaisut/tu tkimukset/keskustelualoitteet/Documents/0 512netti.pdf [10] Crowley P.M., Maraun D. and Mayes D.: How Hard Is the Euro Area Core? An Evaluation of Growth Cycles Using Wavelet Analysis. Bank of Finland, Bank of Finland Research Discussion Papers 18, 2006. http://www.suomenpankki.fi/en/julkaisut/tu tkimukset/keskustelualoitteet/Documents/0 618netti.pdf [11] David, F. N.: The Moments of the z and F Distributions, Biometrika vol. 36, pp394- 403, 1949. [12] Donoho D. and Johnstone I. M.: Adapting to unknown smoothness via wavelet shrinkage. Journal of the American Statistical Association, vol. 90, pp1200- 1224, 1995. [13] Donoho D. L.: Denoising via soft thresholding. IEEE Transactions on Information Theory, vol. 41, pp613-627, 1995. [14] Frankel J. and Rose A.: An estimate of the effect of common currencies on trade and income, Quarterly Journal of Economics vol. 117, pp437-466, 2002. [15] Frankel J., Rose A.: The endogeneity of the optimum currency area criteria. Economic Journal vol. 108, pp1009-1025, 1998. [16] Gallegati M. and Gallegati M.: Wavelet Variance Analysis of Output in G-7 Countries. Studies in Nonlinear Dynamics and Econometrics, 11(3): art. 6, 2007. http://ideas.repec.org/a/bpj/sndecm/v11y20 07i3n6.html [17] Gnanadurai D. and Sadasivam V.: An effcient adaptive thresholding technique for wavelet based image denoising. International Journal of Signal Processing, vol. 2, pp114-120, 2006. [18] Grinsted1 A., Moore1 J. C. and Jevrejeva S.: Application of the cross wavelet transform and wavelet coherence to geophysical time series, Nonlinear Processes in Geophysics in European Geosciences Union, vol. 11, pp561-566, 2004. [19] Guoxiang S. and Ruizhen Z.: Three novel models of threshold estimator for wavelet coefficients. WAA 2001, Lecture Notes in Computer Science, vol. 2251, pp145-150, 2001.
- 11. Mohamed BENBOUZIANE, Mustapha DJENNAS, Nasradine CHERIF / International Journal of Engineering Research and Applications (IJERA) ISSN: 2248-9622 www.ijera.com Vol. 3, Issue 3, May-Jun 2013, pp.1071-1081 1081 | P a g e [20] Harding D. and Pagan A.: Synchronization of cycles, Journal of Econometrics, vol. 132, pp59-79, 2006. [21] Imbs J.: Trade, finance, specialization, and synchronization, The Review of Economics and Statistics, vol. 86, pp723-734, 2004. [22] Inklaar R., Jong-A-Pin R. and de Haan J.: Trade and business cycle synchronization in OECD countries: A re-examination, European Economic Review, vol. 52, pp646-666, 2008. [23] Jenkins G. M. and Watts D. G.: “Spectral Analysis and Its Applications”. Holden- Day, p525, 1968. [24] Kalemli-Ozcan S, Sorensen B.E. and Yosha O.: Risk sharing and industrial specialization: regional and international evidence, American Economic Review, vol. 23, pp-15-21, 2003. [25] Keinert F.: Wavelets and multiwavelets, studies in advanced mathematics. Chapman & Hall/CRC Press, vol.5, pp25-29, 2004. [26] Kumar D.K., Pah N.D. and Bradley A.: Wavelet analysis of surface electromyography to determine muscle fatigue. IEEE Trans. Neural Syst. Rehabil. Eng., vol. 11(4), pp400-406, 2003. [27] Leamer E.: Let’s take the con out of econometrics. American Economic Review vol. 73, pp31-43, 1983. [28] Levine R. and Renelt D.: A sensitivity analysis of cross-country growth regressions. American Economic Review vol. 82, pp942-963, 1992. [29] Levine R. and Zervos S.: Looking at the Facts. What We Know about Policy and Growth from Cross-Country Analysis, World Bank Working Paper WPS 1115, 1993. [30] Liu P. C.: Wavelet spectrum analysis and ocean wind waves. Wavelets in Geophysics, E. Foufoula-Georgiou and P. Kumar, Eds., Academic Press, pp151-166, 1994. [31] Liu P.C.: Wavelet spectrum analysis and ocean wind waves. In: Foufoula-Georgiou, E. Kumar, P. (Eds.), Wavelets in Geophysics. Academic Press, pp151-166, 1994. [32] Matlab Mathworks wavelets user guide 2012: www.mathworks.com [33] Raihan S.M., Wen Y. and Zeng B.: Wavelet: A New Tool for Business Cycle Analysis. Federal Reserve Bank of St. Louis, Working Paper 050A, 2005. http://research.stlouisfed.org/wp/more/200 5-050/ [34] Rose A. and Engel C.: Currency unions and international integration. Journal of Money, Credit and Banking, vol. 34, pp1067-1089, 2002. [35] Sala-i-Martin X.: I just ran two millions regressions, American Economic Review vol. 87(2), pp178-183, 1997. [36] Selover D. and Jensen R.: Mode-locking’ and international business cycle transmission, Journal of Economic Dynamics and Control, vol. 23, pp591-618, 1999. [37] Stockman A.: Sectoral and National Aggregate Disturbances to Industrial Output in Seven European Countries, Journal of Monetary Economics vol. 21, pp387-409, 1988. Talukder K. H. and Harada K.: Haar wavelet based approach for image compression and quality assessment of compressed image. IAENG International Journal of Applied Mathematics, vol. 36, pp41-42, 2007. [38] Torrence C. and Compo G. P.: A practical guide to wavelet analysis, Bull. Am. Meteorol. Soc., vol. 79, pp61-78, 1998. [39] Torrence C. and Compo G. P.: A Practical Guide to Wavelet Analysis, Bulletin of the American Meteorological Society, vol. 79, 605-618, 1998. [40] Torrence C. and Webster P.: Interdecadal Changes in the ESNOMonsoon System, J. Clim. Vol. 12, pp2679-2690, 1999. [41] Torrence C. and Webster P.: Interdecadal Changes in the ESNOMonsoon System, J. Clim., vol.12, pp2679-2690, 1999. [42] Yogo M.: Measuring Business Cycles: A Wavelet Analysis of Economic Time Series. Economics Letters, vol. 100(2), pp208-212, 2008. http://ideas.repec.org/a/eee/ecolet/v100y20 08i2p208-212.html