Downloaded 139 times
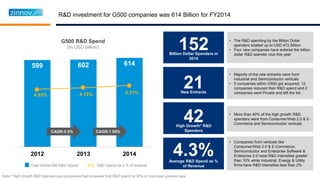
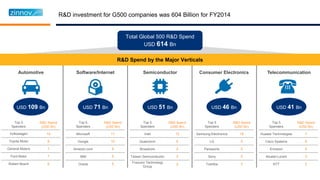
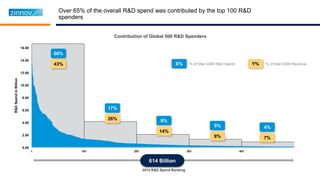
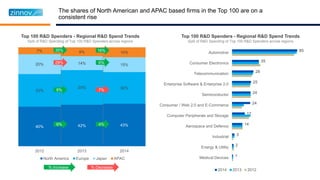
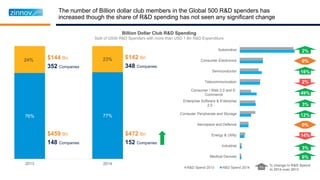
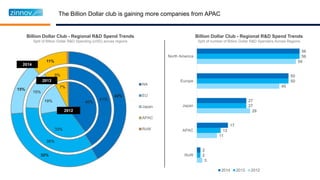
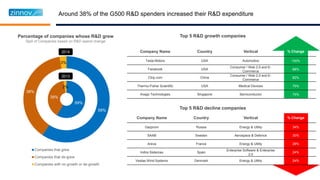
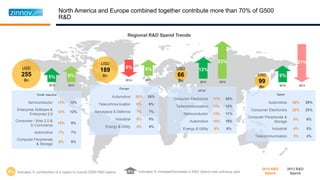
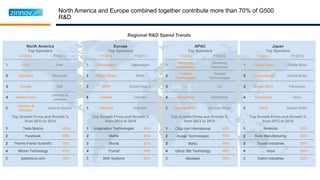
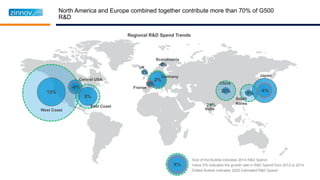
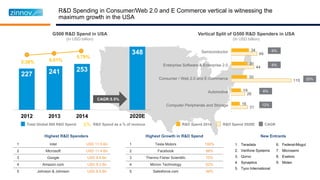
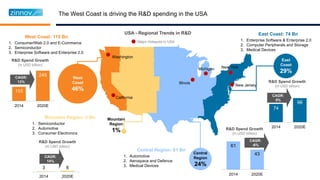
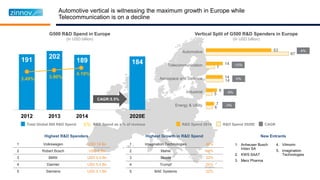
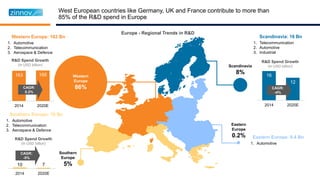
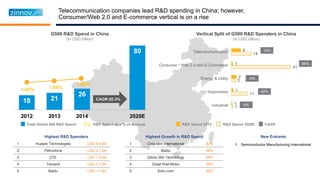
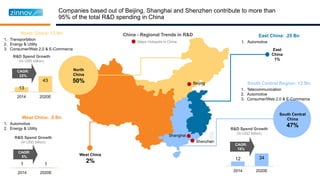
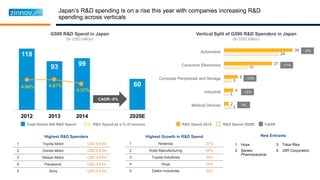
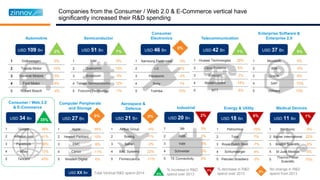
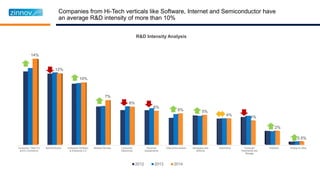
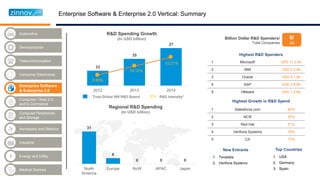
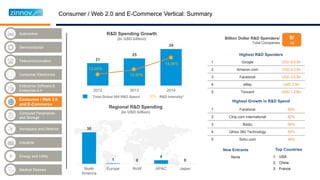
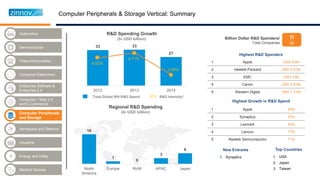
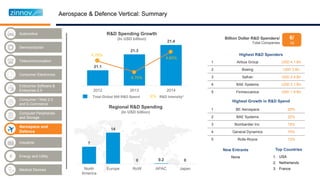
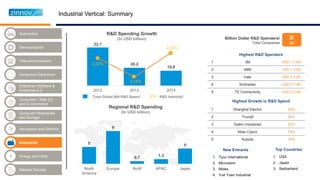
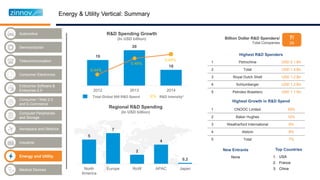
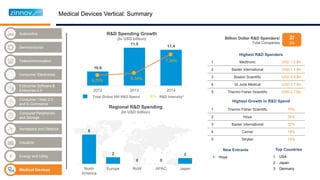


The document provides an overview of global R&D trends among the top 500 R&D spending companies from 2012-2014. Key findings include: - Total R&D spending by these companies was $614 billion in 2014, with North America and Europe contributing over 70%. - The number of companies spending over $1 billion on R&D increased to 152 in 2014, with many new entrants from industrial and semiconductor sectors. - Fast growing sectors for R&D included consumer/web 2.0, semiconductor, and enterprise software, while energy/utilities saw slower growth.


![5G Explained! A High Level Overview [Introduction]](https://cdn.slidesharecdn.com/ss_thumbnails/5gexplainedahighleveloverview-260119165306-cc137a3e-thumbnail.jpg?width=640&height=640&fit=bounds)


