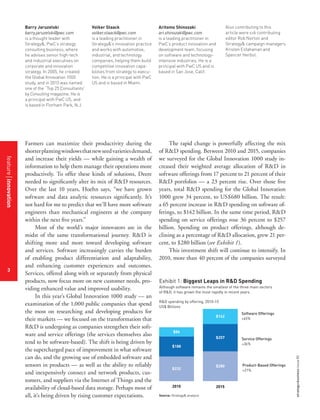
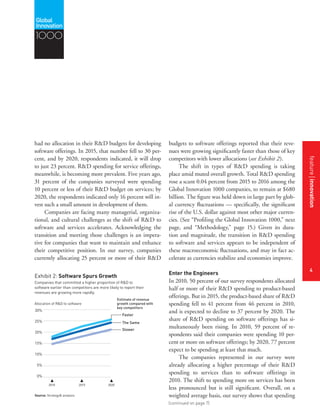
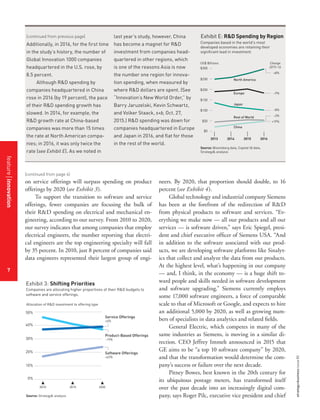
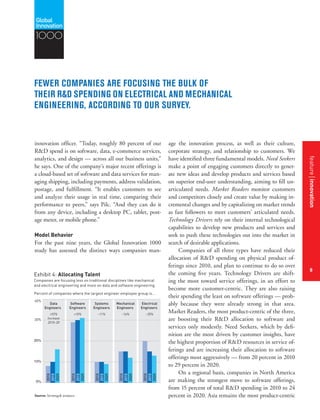
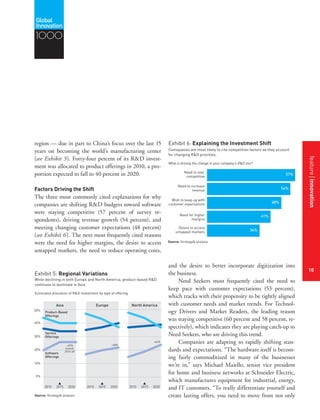
strategy+business
ISSUE 85 WINTER 2016
REPRINT 16409
BY BARRY JARUZELSKI, VOLKER STAACK,
AND ARITOMO SHINOZAKI
GLOBAL INNOVATION 1000
Software-as-a-Catalyst
The world’s largest innovators are shifting the focus of their
R&D investments from products to programming.
featureinnovation
1
IllustrationbyPatrickHruby
SOFTWARE-AS-
A-CATALYST
The world’s largest innovators
are shifting the focus of their
R&D investmentsfromproducts
toprogramming.
by Barry Jaruzelski,
Volker Staack, and
Aritomo Shinozaki
Throughout its nearly 180-year history, John Deere has
been an innovation leader. Its first product was a polished-
steel plow that outperformed existing tools. And over the
decades, the company’s research and development (R&D)
efforts were aimed squarely at improving the mechanical
and functional performance of its products. Today, Deere’s
iconic green machinery is recognized the world over for
quality and durability. But over the last decade, the focus of
the company’s R&D has been shifting to software and
service offerings.
“Our customers continue to expect the best equipment,”
says Klaus Hoehn, vice president of advanced technology
and engineering. “But on top of that, they want us to
provide solutions that address the pain points they’re
experiencing in their business.” Deere’s newest generationof
corn planters not only run at twice the speed of previous
models, but also feature monitors, sensors, and software
that optimize the planting process and generate detailed
computerized data about how and where seeds are sown.
featureinnovation
2
1000
strategy+businessissue85
3
Barry Jaruzelski
barry.jaruzelski@pwc.com
is a thought leader with
Strategy&, PwC’s strategy
consulting business, where
he advises senior high-tech
and industrial executives on
corporate and innovation
strategy. In 2005, he created
the Global Innovation 1000
study, and in 2013 was named
one of the “Top 25 Consultants”
by Consulting magazine. He is
a principal with PwC US, and
is based in Florham Park, N.J.
Volker Staack
volker.staack@pwc.com
is a leading practitioner in
Strategy&’s innovation practice
and works with automotive,
industrial, and technology
companies, helping them build
competitive innovation capa-
bilities from strategy to execu-
tion. He is a principal with PwC
US and is based in Miami.
Aritomo Shinozaki
ari.shinozaki@pwc.com
is a leading practitioner in
PwC’s product innovation and
development team, focusing
on software and technology-
intensive industries. He is a
principal with PwC US and is
based in San Jose, Calif.
Also contributing to this
article were s+b contributing
editor Rob Norton and
Strategy& campaign managers
Kristen Esfahanian and
Spencer Herbst.
Farmers can maximize their productivity during the
shorterplantingwindowsthatnewseedvarietiesdemand,
and increase their yields — while gaining a wealth of
information to help them manage their operations more
productively. To offer these kinds of solutions, Deere
needed to significantly alter its mix of R&D resources.
Over the last 10 years, Hoehn says, “we have grown
software and data analytic resources significantly. It’s
not hard for me to predict that we’ll have more software
engineers than mechanical engineers at the company
within the next five years.”
Most of the world’s major innovators are in the
midst of the same transformational journey. R&D is
shifting more and more toward developing software
and services. Software increasingly carries the burden
of enabling product differentiation and adaptability,
and enhancing customer experiences and outcomes.
Services, offered along with or separately from physical
products, now focus more on new customer needs, pro-
viding enhanced value and improved usability.
In this year’s Global Innovation 1000 study — an
examination of the 1,000 public companies that spend
the most on researching and developing products for
their markets — we focused on the transformation that
R&D is undergoing as companies strengthen their soft-
ware and service offerings (the services themselves also
tend to be software-based). The shift is being driven by
the supercharged pace of improvement in what software
can do, and the growing use of embedded software and
sensors in products — as well as the ability to reliably
and inexpensively connect and network products, cus-
tomers, and suppliers via the Internet of Things and the
availability of cloud-based data storage. Perhaps most of
all, it’s being driven by rising customer expectations.
The rapid change is powerfully affecting the mix
of R&D spending. Between 2010 and 2015, companies
we surveyed for the Global Innovation 1000 study in-
creased their weighted average allocation of R&D in
software offerings from 17 percent to 21 percent of their
R&D portfolios — a 23 percent rise. Over those five
years, total R&D spending for the Global Innovation
1000 grew 34 percent, to US$680 billion. The result:
a 65 percent increase in R&D spending on software of-
ferings, to $142 billion. In the same time period, R&D
spending on service offerings rose 36 percent to $257
billion. Spending on product offerings, although de-
clining as a percentage of R&D allocation, grew 21 per-
cent, to $280 billion (see Exhibit 1).
This investment shift will continue to intensify. In
2010, more than 40 percent of the companies surveyed
Source: Strategy& analysis
Exhibit 1: Biggest Leaps in R&D Spending
Although software remains the smallest of the three main sectors
of R&D, it has grown the most rapidly in recent years.
R&D spending by offering, 2010–15
US$ Billions
Software Offerings
+65%
Service Offerings
+36%
Product-Based Offerings
+21%
2010
$86
$188
$232
2015
$142
$257
$280
featureinnovation
3
featurestitleofthearticle
4
had no allocation in their R&D budgets for developing
software offerings. In 2015, that number fell to 30 per-
cent, and by 2020, respondents indicated, it will drop
to just 23 percent. R&D spending for service offerings,
meanwhile, is becoming more prevalent. Five years ago,
31 percent of the companies surveyed were spending
10 percent or less of their R&D budget on services; by
2020, the respondents indicated only 16 percent will in-
vest such a small amount in development of them.
Companies are facing many managerial, organiza-
tional, and cultural challenges as the shift of R&D to
software and services accelerates. Acknowledging the
transition and meeting those challenges is an impera-
tive for companies that want to maintain and enhance
their competitive position. In our survey, companies
currently allocating 25 percent or more of their R&D
budgets to software offerings reported that their reve-
nues were growing significantly faster than those of key
competitors with lower allocations (see Exhibit 2).
The shift in types of R&D spending is taking
place amid muted overall growth. Total R&D spending
rose a scant 0.04 percent from 2015 to 2016 among the
Global Innovation 1000 companies, to remain at $680
billion. The figure was held down in large part by glob-
al currency fluctuations — specifically, the significant
rise of the U.S. dollar against most other major curren-
cies. (See “Profiling the Global Innovation 1000,” next
page, and “Methodology,” page 15.) Given its dura-
tion and magnitude, the transition in R&D spending
to software and services appears to be independent of
these macroeconomic fluctuations, and may in fact ac-
celerate as currencies stabilize and economies improve.
Enter the Engineers
In 2010, 50 percent of our survey respondents allocated
half or more of their R&D spending to product-based
offerings. But in 2015, the product-based share of R&D
spending fell to 41 percent from 46 percent in 2010,
and is expected to decline to 37 percent by 2020. The
share of R&D spending on software offerings has si-
multaneously been rising. In 2010, 59 percent of re-
spondents said their companies were spending 10 per-
cent or more on software offerings; by 2020, 77 percent
expect to be spending at least that much.
The companies represented in our survey were
already allocating a higher percentage of their R&D
spending to services than to software offerings in
2010. The shift to spending more on services has been
less pronounced but is still significant. Overall, on a
weighted average basis, our survey shows that spendingSource: Strategy& analysis
2010 2015 2020
0%
5%
10%
15%
20%
25%
30%
Slower
The Same
Faster
Exhibit 2: Software Spurs Growth
Companies that committed a higher proportion of R&D to
software earlier than competitors are more likely to report their
revenues are growing more rapidly.
Allocation of R&D to software
Estimate of revenue
growth compared with
key competitors
1000
(continued on page 7)
featureinnovation
4
strategy+businessissue85
5
but in 2016 most key currencies fell
against the U.S. dollar. If foreign ex-
change rates had remained roughly
at their 2015 levels, worldwide R&D
spending would have increased 6
percent — just above the long-term
compound annual growth rate for
R&D spending.
Revenue for the Global Innova-
tion 1000 companies fell nearly 12
percent in 2016, dragged down by
the chemicals and energy indus-
try, where falling oil prices and the
strong dollar resulted in a 31 percent
decline. As a result, R&D intensity
Worldwide R&D spending
among the Global Innova-
tion 1000 companies increased 0.04
percent in 2016, to US$680 billion,
essentially unchanged from the
previous year. Currency fluctuations
played an unusually large role in this
year’s results: Typically, exchange
rate changes cancel each other out,
Profiling the
Global Innovation
1000
2016 2015
Source: Bloomberg data, Capital IQ data, Strategy& analysis
Exhibit B: The Top 20 R&D Spenders
RANK
Company Industry2016
US$ Billions
Change
from 2015
% of
Revenue
Headquarters
R&D Spending
$13.2
$12.7
$12.5
$12.3
$12.1
$12.0
$10.0
$9.5
$9.0
$8.8
$8.1
$7.7
$7.5
$6.7
$6.7
$6.6
$6.2
$6.0
$5.9
$5.8
$179.4
Auto
Computing and Electronics
Software and Internet
Computing and Electronics
Software and Internet
Healthcare
Healthcare
Healthcare
Auto
Computing and Electronics
Healthcare
Auto
Healthcare
Auto
Auto
Computing and Electronics
Healthcare
Healthcare
Software and Internet
2.7%
–3.0%
35.2%
24.9%
5.1%
5.8%
–3.2%
–1.6%
6.5%
5.1%
33.5%
–8.4%
1.4%
–6.6%
0.0%
4.5%
–1.4%
7.5%
30.6%
4.8%
6.3%
5.6%
7.2%
11.7%
16.4%
21.9%
12.9%
19.9%
19.2%
12.9%
3.7%
3.5%
15.7%
4.9%
17.0%
4.5%
4.0%
12.6%
24.3%
35.7%
15.6%
8.7%
1
2
3
4
5
6
7
8
9
10
11
12
13
14
15
16
17
18
19
20
1
2
7
6
3
4
5
9
10
8
18
11
13
14
15
12
17
20
32
22
Volkswagen
Samsung
Amazon
Alphabet
Intel
Microsoft
Roche Holding
Novartis
Johnson & Johnson
Toyota
Apple
Pfizer
General Motors
Merck
Ford
Daimler
Cisco
AstraZeneca
Bristol-Myers Squibb
Oracle
Europe
South Korea
North America
North America
North America
North America
Europe
Europe
North America
Japan
North America
North America
North America
North America
North America
Europe
North America
Europe
North America
North America
TOP 20 TOTAL
Although some rankings shifted, the 2016 list of the 20 biggest R&D spenders features many of the same names as the previous year’s list (and in nine
cases, as lists from the last decade). However, there were two notable entrants to the top 20: Bristol-Myers Squibb and Oracle.
Companies in RED have been among the top 20 R&D spenders every year since 2005.
Indexed to 2005
1.8
1.6
1.4
1.2
1.0
0.8
0.6
2.0
2005 20152010
Revenue
R&D Spending
Exhibit A: R&D and Revenue
Flat spending and a decline in revenue led to an
increase in R&D intensity.
Source: Bloomberg data, Capital IQ data,
Strategy& analysis
R&D Spending
as a % of
Revenue
Indexed to 2005
1.8
1.6
1.4
1.2
1.0
0.8
0.6
2.0
2005 20152010
Revenue
R&D Spending
Exhibit A: R&D and Revenue
Flat spending and a decline in revenue led to an
increase in R&D intensity.
Source: Bloomberg data, Capital IQ data,
Strategy& analysis
R&D Spending
as a % of
Revenue
featureinnovation
5
featurestitleofthearticle
6
tive company (see “The 10 Most
Innovative Companies,” page 9).
Bristol-Myers Squibb (BMS) and
Oracle joined the top 20 this year in
the 19th and 20th slots. The largest
company on the top 20 spender list
is Volkswagen, with $236.9 billion in
sales, and the smallest is BMS,
with just $16.6 billion.
Only three of the nine industries
we track — software and Internet,
healthcare, and consumer — in-
creased their R&D spending in 2016.
Software and Internet had the biggest
gain by far; R&D spending was up
15.4 percent, compared with 2.6 per-
cent for healthcare and 0.7 percent
for consumer. The continued rapid
expansion of R&D investment by
the software industry does not even
reflect the increasing investments
in this technology made by other
industries, such as auto, computing
and electronics, and healthcare. The
sharpest declines in R&D spending
were in chemicals and energy (11.5
percent) and telecom (12.2 percent).
At current growth rates, health-
care remains on track to surpass
computing and electronics as the
largest industry in terms of R&D
(innovation spending
as a percentage of
revenues) returned to
its all-time high of 4.2
percent (see Exhibit A).
Volkswagen and Samsung re-
tained their positions as the number
one and number two R&D spenders
in 2016, with totals of $13.2 billion
and $12.7 billion, respectively (see
Exhibit B). Just over $1 billion, how-
ever, separated the top five compa-
nies. Amazon continued its ascent of
the top 20 R&D spenders list, moving
to third place from seventh. Alpha-
bet, the parent company of Google,
moved from sixth position in 2015 to
fourth in 2016. Apple made the big-
gest jump in position — from number
18 to number 11 — as it significantly
increased R&D spending. But Apple
also stands out for having the low-
est R&D intensity of any of the top
20 companies — at 3.5 percent, it
is about half the average intensity
of the computing and electronics
industry. Apple is extremely efficient
in translating its R&D spending into
popular products and continues to
be voted the world’s most innova-
spending in 2018. The industry with
the fastest R&D spending growth
trajectory, however, continues to be
software and Internet: R&D spend-
ing has grown faster in that category
than in any other since 2011. At cur-
rent growth rates, the software and
Internet sector will outpace auto to
become the third-largest R&D spend-
ing industry by 2017 (see Exhibit C).
Regionally, companies head-
quartered in North America — the
vast majority in the U.S. — had
the second-fastest growth in R&D
spending among all regions, and ac-
counted for nearly 44 percent of total
Global Innovation 1000 R&D spend-
ing. These results were influenced by
the dollar’s increased strength. But
there are other indications that North
American companies are flourishing
in the current innovation environ-
ment. U.S. firms are dominant in the
two industries where R&D is growing
the fastest: 62 percent of all software
and Internet companies are head-
quartered in North America, as are
56 percent of all healthcare compa-
nies (see Exhibit D).
Exhibit C: Leading Industries
By 2018, healthcare will spend more on R&D
than any other industry.
Source: Bloomberg data, Capital IQ data,
Strategy& analysis
$0
$50
$100
$150
$200
Auto
R&D spending, US$ billions
2005 2015 20182010
est.
Computing
and
Electronics
Software
and
Internet
Industrials
Healthcare
Exhibit D: The Geography of R&D
The two sectors in which R&D spending is growing most rapidly — healthcare and software and
Internet — are heavily weighted to companies headquartered in North America.
Rest of
World
China
Japan
Europe
North America
Auto
22%
20%
30%
18%
10%
93
Industrials
19%
26%
19%
29%
6%
175
Computing
and Electronics
43%
13%
15%
11%
18%
228TOTAL COMPANIES
Source: Bloomberg data, Capital IQ data, Strategy& analysis
Healthcare
56%
7%
24%
2%10%
164
Software
and Internet
62%
12%
18%
2%
6%
103
1000
(continued on next page)
featureinnovation
6
strategy+businessissue85
7
last year’s study, however, China
has become a magnet for R&D
investment from companies head-
quartered in other regions, which
is one of the reasons Asia is now
the number one region for innova-
tion spending, when measured by
where R&D dollars are spent. (See
“Innovation’s New World Order,” by
Barry Jaruzelski, Kevin Schwartz,
and Volker Staack, s+b, Oct. 27,
2015.) R&D spending was down for
companies headquartered in Europe
and Japan in 2016, and flat for those
in the rest of the world.
(continued from previous page)
Additionally, in 2016, for the first time
in the study’s history, the number of
Global Innovation 1000 companies
headquartered in the U.S. rose, by
8.5 percent.
Although R&D spending by
companies headquartered in China
rose in 2016 (by 19 percent), the pace
of their R&D spending growth has
slowed. In 2014, for example, the
R&D growth rate at China-based
companies was more than 15 times
the rate at North American compa-
nies; in 2016, it was only twice the
rate (see Exhibit E). As we noted in
Europe
Japan
North America
Change
2015–16
Rest of World
Exhibit E: R&D Spending by Region
Companies based in the world’s most
developed economies are retaining their
significant lead in investment.
Source: Bloomberg data, Capital IQ data,
Strategy& analysis
$0
$50
$100
$150
$200
$250
$300
US$ Billions
2013 2015 20162014
+8%
–9%
–8%
–3%
+19%
China
on service offerings will surpass spending on product
offerings by 2020 (see Exhibit 3).
To support the transition to software and service
offerings, fewer companies are focusing the bulk of
their R&D spending on electrical and mechanical en-
gineering, according to our survey. From 2010 to 2020,
our survey indicates that among companies that employ
electrical engineers, the number reporting that electri-
cal engineers are the top engineering specialty will fall
by 35 percent. In 2010, just 8 percent of companies said
data engineers represented their largest group of engi-
neers. By 2020, that proportion should double, to 16
percent (see Exhibit 4).
Global technology and industrial company Siemens
has been at the forefront of the redirection of R&D
from physical products to software and services. “Ev-
erything we make now — all our products and all our
services — is software driven,” says Eric Spiegel, presi-
dent and chief executive officer of Siemens USA. “And
in addition to the software associated with our prod-
ucts, we are developing software platforms like Sinalyt-
ics that collect and analyze the data from our products.
At the highest level, what’s happening in our company
— and, I think, in the economy — is a huge shift to-
ward people and skills needed in software development
and software upgrading.” Siemens currently employs
some 17,000 software engineers, a force of comparable
scale to that of Microsoft or Google, and expects to hire
an additional 5,000 by 2020, as well as growing num-
bers of specialists in data analytics and related fields.
General Electric, which competes in many of the
same industries as Siemens, is moving in a similar di-
rection. CEO Jeffrey Immelt announced in 2015 that
GE aims to be “a top 10 software company” by 2020,
and that the transformation would determine the com-
pany’s success or failure over the next decade.
Pitney Bowes, best known in the 20th century for
its ubiquitous postage meters, has transformed itself
over the past decade into an increasingly digital com-
pany, says Roger Pilc, executive vice president and chiefSource: Strategy& analysis
Exhibit 3: Shifting Priorities
Companies are allocating higher proportions of their R&D budgets to
software and service offerings.
Allocation of R&D investment to offering type
2010 2015 2020
0%
10%
20%
30%
40%
50%
Software Offerings
+43%
Product-Based Offerings
–19%
Service Offerings
+5%
(continued from page 4)
featureinnovation
7
featurestitleofthearticle
8
innovation officer. “Today, roughly 80 percent of our
R&D spend is on software, data, e-commerce services,
analytics, and design — across all our business units,”
he says. One of the company’s major recent offerings is
a cloud-based set of software and data services for man-
aging shipping, including payments, address validation,
postage, and fulfillment. “It enables customers to see
and analyze their usage in real time, comparing their
performance to peers,” says Pilc. “And they can do it
from any device, including a desktop PC, tablet, post-
age meter, or mobile phone.”
Model Behavior
For the past nine years, the Global Innovation 1000
study has assessed the distinct ways companies man-
age the innovation process, as well as their culture,
corporate strategy, and relationship to customers. We
have identified three fundamental models. Need Seekers
make a point of engaging customers directly to gener-
ate new ideas and develop products and services based
on superior end-user understanding, aiming to fill un-
articulated needs. Market Readers monitor customers
and competitors closely and create value by making in-
cremental changes and by capitalizing on market trends
as fast followers to meet customers’ articulated needs.
Technology Drivers rely on their internal technological
capabilities to develop new products and services and
seek to push these technologies out into the market in
search of desirable applications.
Companies of all three types have reduced their
allocation of R&D spending on physical product of-
ferings since 2010, and plan to continue to do so over
the coming five years. Technology Drivers are shift-
ing the most toward service offerings, in an effort to
become more customer-centric. They are also raising
their spending the least on software offerings — prob-
ably because they were already strong in that area.
Market Readers, the most product-centric of the three,
are boosting their R&D allocation to software and
services only modestly. Need Seekers, which by defi-
nition are the most driven by customer insights, have
the highest proportion of R&D resources in service of-
ferings and are increasing their allocation to software
offerings most aggressively — from 20 percent in 2010
to 29 percent in 2020.
On a regional basis, companies in North America
are making the strongest move to software offerings,
from 15 percent of total R&D spending in 2010 to 24
percent in 2020. Asia remains the most product-centric
Percent of companies where the largest engineer employee group is...
Source: Strategy& analysis
Exhibit 4: Allocating Talent
Companies are focusing less on traditional disciplines like mechanical
and electrical engineering and more on data and software engineering.
4 Changes in the R&D enginnering specialties
0%
10%
20%
30%
40%
Software
Engineers
+10%
Systems
Engineers
–11%
Mechanical
Engineers
–16%
Electrical
Engineers
–35%
Data
Engineers
2010
2015
2020
2010
2015
2020
2010
2015
2020
2010
2015
2020
2010
2015
2020
+92%
Increase
2010–20
1000
FEWER COMPANIES ARE FOCUSING THE BULK OF
THEIR R&D SPENDING ON ELECTRICAL AND MECHANICAL
ENGINEERING, ACCORDING TO OUR SURVEY.
featureinnovation
8
strategy+businessissue85
9
last year to third in 2016, proving that
the innovation executives who vote in
our survey value the steady, long-
term approach to innovation that the
Minnesota-based company has long
exemplified (see Exhibit F).
Tesla joined the most innovative
companies list in 2013 in ninth place,
and has ascended to the number four
position in 2016. It is the only auto
company voted onto this year’s list,
and that seems appropriate given the
focus of this year’s Global Innova-
tion 1000 study: the increasing shift
of R&D investment to software and
service offerings. Tesla has been
an innovator in both areas, with
such offerings as its Autopilot self-
driving feature, which was delivered
overnight — over the Internet — as a
software update to 60,000 customers
in October 2015.
Amazon has also moved quickly
up the list, first appearing in the 10th
position in 2012 and now residing at
number five. Amazon, of course, first
made its name by developing the
most successful B2C software offer-
For the seventh year running,
Apple and Alphabet (formerly
Google) were voted the two most
innovative companies in the Global
Innovation 1000 by the study par-
ticipants. Apple’s once substantial
margin, however, has narrowed, and
it edged out Alphabet this year by
only a handful of votes. Alphabet’s
Google continues to make waves with
initiatives such as its self-driving
car project, while Apple focuses on
its capabilities in gaining customer
insights to improve popular, profit-
able products such as the iPhone.
Interestingly, the two companies are
now competing directly in one of the
hot new software markets — con-
nectivity platforms for cars — with
the Apple CarPlay and Android Auto
offerings going head-to-head.
3M moved up from sixth position
ing in retail — however, B2B is likely
its larger future. While the company’s
efforts to develop drone delivery
for packages make headlines, its
Amazon Web Services cloud comput-
ing platform for businesses makes
money: The subsidiary is on track to
hit $10 billion in revenues for 2016,
and it currently accounts for more
than half of Amazon’s profits.
As has been the case for each
of the past seven years, the 10 most
innovative companies continue
to outperform the top 10 R&D
spenders on key performance
metrics. They surpassed their
competitors on five-year revenue
growth and did far better on EBITDA
as a percentage of revenue and
market capitalization growth — once
again proving one of our key findings
of the Global Innovation 1000 study:
How you spend on innovation is more
important than how much you spend
(see Exhibit G).
The 10
Most Innovative
Companies
Exhibit F: The 10 Most Innovative Companies
In recent years, 3M and Tesla have risen in the ranks of the most innovative companies, while
GE has fallen.
1
2
3
4
5
6
7
8
9
10
Apple
Alphabet
3M
GE
Microsoft
IBM
P&G
Intel
Samsung
Facebook
Amazon
Tesla
RANK
Toyota
2010 2011 2012 2013 2014 2015 2016
Source: Strategy& analysis
50
Exhibit G: Innovating vs.Spending
Companies ranked by their peers as most
innovative show better financial performance
than the top R&D spenders.
Source: Bloomberg data, Capital IQ data,
Strategy& analysis
Normalized performance
of industry peers
69
40
EBITDA as %
of Revenue
5-yr. Avg.
65
49
Market Cap
Growth
5-yr. CAGR
HIGHEST
POSSIBLE
SCORE: 100
LOWEST
POSSIBLE
SCORE: 0
Revenue
Growth
5-yr. CAGR
40
TOP10SPENDERS
50
TOP10INNOVATORS
featureinnovation
9
featurestitleofthearticle
10
Source: Strategy& analysis
Exhibit 6: Explaining the Investment Shift
Companies are most likely to cite competition factors as they account for
changing R&D priorities.
What is driving the change in your company’s R&D mix?
Need to stay
competitive
Need to increase
revenue
Wish to keep up with
customer expectations
Need for higher
margins
Desire to access
untapped markets
57%
54%
48%
41%
34%
Exhibit 5: Regional Variations
While declining in both Europe and North America, product-based R&D
continues to dominate in Asia.
Estimated allocation of R&D investment by type of offering
Asia
2010 20202015
Europe
2010 20202015
North America
2010 20202015
Source: Strategy& analysis
0%
10%
20%
30%
40%
50%
Software
Offerings
Product-Based
Offerings
+63%
+28%
Service
Offerings
+33%
Growth
2010–20
region — due in part to China’s focus over the last 15
years on becoming the world’s manufacturing center
(see Exhibit 5). Forty-four percent of its R&D invest-
ment was allocated to product offerings in 2010, a pro-
portion expected to fall to 40 percent in 2020.
Factors Driving the Shift
The three most commonly cited explanations for why
companies are shifting R&D budgets toward software
were staying competitive (57 percent of survey re-
spondents), driving revenue growth (54 percent), and
meeting changing customer expectations (48 percent)
(see Exhibit 6). The next most frequently cited reasons
were the need for higher margins, the desire to access
untapped markets, the need to reduce operating costs,
and the desire to better incorporate digitization into
the business.
Need Seekers most frequently cited the need to
keep pace with customer expectations (53 percent),
which tracks with their propensity to be tightly aligned
with customer needs and market trends. For Technol-
ogy Drivers and Market Readers, the leading reason
was staying competitive (60 percent and 58 percent, re-
spectively), which indicates they are playing catch-up to
Need Seekers, who are driving this trend.
Companies are adapting to rapidly shifting stan-
dards and expectations. “The hardware itself is becom-
ing fairly commoditized in many of the businesses
we’re in,” says Michael Maiello, senior vice president
for home and business networks at Schneider Electric,
which manufactures equipment for industrial, energy,
and IT customers. “To really differentiate yourself and
create lasting offers, you need to move from not only
1000
featureinnovation
10
strategy+businessissue85
11
best-in-class hardware products to a customer solution
that includes different product components and soft-
ware, with services wrapped around it. We’ve realized
that software and services are going to be a large part of
our needed competencies as we move forward.”
German automaker Daimler is focused on bringing
the best products to the market, with the best fuel econ-
omy. “But today much of what you do to improve fuel
economy is in the software,” says Heiko Noessler, direc-
tor of manufacturing at Daimler. “And software is hav-
ing more of an impact not only in the products them-
selves, but through what connectivity enables, such as
service diagnostics.” In the past, when a delivery truck
broke down, a driver would take it to a service station.
“Today, if the truck is breaking down, the driver can get
in contact with a service representative who guides him
through how to keep it running or what kind of a repair
will be needed,” Noessler notes. “This saves a lot of time
and keeps the product on the road, and that’s how the
customer makes his money.”
In many cases, companies are facing competition
from new market participants, or from different sec-
tors. “We have competitors we never thought we would
have,” says John Deere’s Hoehn. “They are coming
from a 180-degree different perspective, but they are
also trying to provide solutions that address our cus-
tomers’ pain points. We have seen this new variety
of competition coming from all directions in the last
five to eight years.” Seed companies, for example, have
service offerings that aim to deliver some of the same
analytical features that Deere is providing with its farm
machinery. “They might see our equipment as a com-
modity, and we might see their seed material as a com-
modity,” Hoehn says. “But they are trying to occupy
the same space we are, and in a broader sense, we’re
now in the same business.”
Companies seeking higher revenues are increasing
their R&D spending on software and services because
that’s where they see their growth opportunities. The
need to generate revenue and growth was the second
most important reason companies gave for their chang-
ing R&D portfolios. The pattern is especially pro-
nounced in the auto business. “What’s happening in the
automotive industry is as significant as the invention
of the internal combustion engine over 100 years ago,”
says Martin O’Brien, general manager of the integrated
electrical systems division of Mentor Graphics, which
supplies software and software tools to automotive,
aerospace, and other industries. “The car has gone from
being a largely mechanical device a decade ago to hav-
ing the most embedded software of almost any platform
in the world today. A modern car may have 80 different
computers controlling the different functions in the ve-
hicle, and perhaps 100 million lines of software code to
implement many of those functions. Function growth is
driven mostly by safety, consumerization, and connec-
tivity needs in this new era.”
Building Capabilities, Finding Opportunities
More than half of the companies surveyed are changing
their mix of talent because their changing customer of-
ferings require a different mix of engineering resources;
that was the case for Technology Drivers, Market Read-
ers, and Need Seekers alike. Other reasons frequently
cited were that companies had acquired a new set of
capabilities that required R&D support (28 percent) or
that there were changes in their industry (26 percent). A
quarter of respondents said they were relying on third-
featureinnovation
11
featurestitleofthearticle
12
party providers for software and service engineering.
Attracting and retaining R&D personnel with the
right talents is a challenge in most industries. “We are re-
cruiting for data analytics and digitalization-based roles
at the senior levels of the organization. We are looking
for leaders who can identify opportunities and create
business models to expand, optimize, and transform the
business deploying analytics platforms and tools,” says
Siemens’s Spiegel. The shift is already changing the way
business schools think about their course offerings, and
will have profound effects both on education and, more
generally, on the future of employment. (See “Jobs in
the Age of Digital Innovation,” next page.)
Companies that made an acquisition during the
past five years reported that 71 percent of the deals were
done to augment capabilities in software (33 percent) or
services (38 percent). Forty-one percent of the compa-
nies we surveyed either have acquired a services firm or
plan to do so in the next five years, and 38 percent have
acquired or plan to acquire a software firm. Need Seek-
ers and Market Readers said they were the most likely
to acquire a software firm over the next five years, and
Technology Drivers said they were the most likely to ac-
quire a services firm. And roughly one-third of the com-
panies surveyed said they had invested corporate funds
directly in external startups within the last five years.
These companies also anticipate making the biggest
change in the proportion of R&D spending to software
offerings. Between 2010 and 2020, they expect that
their allocation of R&D to software offerings will grow
57 percent — nearly twice the rate of companies that
have not invested in a startup.
For Polaris Industries, which designs, develops,
and manufactures power sports vehicles such as snow-
mobiles and motorcycles, the competition is mainly
focused on vehicle performance, says Ken Pucel, execu-
tive vice president of operations, engineering, and lean
manufacturing. Most of the company’s software R&D
involves improving performance, such as computerized
engine controls that can switch from “work” to “per-
formance” mode at the push of a button, and most
of the software for doing that work is available from
third-party vendors. In 2013, however, Polaris acquired
a software development company to build its RiderX
platform, which connects the vehicle to the driver’s
mobile phone. “It’s a navigation system for the off-road
enthusiast,” says Pucel. “You can see the turns on the
trail ahead. You don’t get lost. You can find a gas station
or a restaurant, and it connects you with your friends.
It enhances the whole riding experience, and I see our
platform as the industry standard.”
Culture and Management
The shift toward software and service offerings is pre-
senting new cultural and managerial challenges to com-
panies. Some companies with product-centered roots
are moving more of their R&D operations away from
their home base — which is often in an industrial re-
gion unattractive to young software engineers and data
specialists — toward Silicon Valley or to emerging tech
clusters such as Phoenix; Austin, Tex.; and North Car-
olina’s Research Triangle. Ford, for example, opened
a new research facility in Palo Alto, Calif., in 2015,
close to Stanford University (and Tesla’s headquarters),
with 125 employees. Most were locally hired, and the
facility is managed by a former Apple executive. In Au-
gust 2016, Ford CEO Mark Fields said the workforce
there was doubling — at the same time he announced
ROUGHLY ONE-THIRD OF THE COMPANIES SURVEYED
SAID THEY HAD INVESTED CORPORATE FUNDS DIRECTLY IN
EXTERNAL STARTUPS WITHIN THE LAST FIVE YEARS.
1000
featureinnovation
12
strategy+businessissue85
13
ded in it or requires using a software
product to create it in the first place.
Software has become a kind of basic
language, like mathematics, which
you need to know just to work suc-
cessfully as an engineer.”
Familiarity with software is
becoming a necessary skill for man-
agers as well. At Cornell’s Johnson
School, more MBA students are sign-
ing up for programming courses in
the engineering department. “They’re
not necessarily interested in pro-
gramming — though most of them do
program things themselves; they’re
taking these courses so they are
able to understand the language and
interact with professional software
engineers,” says Dutta. “We are also
seeing increasing interest in courses
focused on the service economy and
on technology.”
The shift toward software and
service offerings is also changing
the skill sets needed for other jobs
in a wide range of industries. For ex-
The rising trend line of R&D
investment in software and
service offerings suggests there
will be major changes in the kinds
of jobs that will be created — and in
the opportunities for those jobs that
will continue to exist — over the next
decade and beyond.
Companies are already feeling
the effects of the shift within their
R&D operations as they compete
to increase their ranks of software
engineers and other specialists. “It’s
very hard today to make a distinction
between an engineer and a software
engineer,” says Soumitra Dutta, dean
of the Samuel Curtis Johnson Gradu-
ate School of Management at Cornell
University. “Almost every product you
create either has software embed-
ample, in today’s advanced manufac-
turing workplaces, a factory worker
is more likely to be carrying a tablet
computer than a wrench, and may
have the skills to configure software
for new situations, or understand
how to program CNC (computer
numerical control) machines. To pre-
pare people for these jobs, compa-
nies and governments at the federal,
state, and local levels in the U.S.
have launched dozens of initiatives
to improve skills in science, technol-
ogy, engineering, and math (STEM)
subjects over the last decade, at
both secondary schools and commu-
nity colleges.
The rise of software and ser-
vices can be viewed as just the latest
effect of the computer age, which
has radically changed the nature
of employment in many industries
over the last 30 years. Welders have
been replaced by robots, bank tellers
by ATMs, and phone operators by
automated switchboards. The phe-
Jobs in the
Age of Digital
Innovation
that Ford would be manufacturing fully autonomous
cars by 2021.
General Electric opened a software center in San
Ramon, Calif. (not far from Silicon Valley), in 2011,
and has been expanding it as the central hub of GE
Digital, a new unit that combines the company’s soft-
ware and technology efforts. The company is also run-
ning a national TV advertising campaign in the U.S.
in which a young software developer tries to explain
to uncomprehending friends and family members why
he’s taking a job at GE. The tagline is: “The digital
company. That’s also an industrial company.”
Companies are also finding they must adapt their
innovation models to allow for the different cadences
at which hardware innovation, software innovation,
and service innovation run. “Another challenge is ap-
plying and coordinating management processes and
systems to the right types of innovation at different
stages of the product and technology life cycle, rather
than having a one-size-fits-all approach,” says Pitney
Bowes’s Pilc. For new, transformative, or disruptive
innovation, the company employs lean startup, de-
sign thinking, and highly agile data methodologies in
cloud-based, software-as-a-service distribution models.
“A large portion of our global development budget is
what we would describe as continuous innovation —
featureinnovation
13
featurestitleofthearticle
14
probability that computerization
will eliminate jobs for 702 detailed
occupations, including most workers
in office and administrative support,
production, and transportation and
logistics. Some of the job classifica-
tions with the highest degree of risk
are drivers, sales workers, loan
officers, and insurance underwriters.
Repetitive white-collar and service
vocations are most vulnerable to
digitization today.
Where will new jobs come
from to replace the many that will
disappear? The answer is not clear.
Modern society has experienced
employment shifts of this magnitude
before. In 1900, for example, more
than 40 percent of the U.S. work-
force was employed in agriculture.
Today the number is just 1.4 percent,
thanks to technological advances.
Manufacturing jobs took up some of
the slack for many decades, but their
numbers, too, have been falling since
the late 1940s, and they account for
nomenon was foretold — even given
a name — by the British economist
John Maynard Keynes in 1930: tech-
nological unemployment.
But as an increasing number of
the world’s leading innovators ac-
celerate the shift away from purely
physical products to software and
service offerings, the employment
effects will become much more
dramatic and far-reaching. Sev-
eral books and a welter of scholarly
papers and articles have argued the
pros and cons of the shift over the last
few years. In “The Future of Employ-
ment: How Susceptible Are Jobs to
Computerisation?” Oxford University
professors Carl Benedikt Frey and
Michael A. Osborne review this litera-
ture and employ a novel methodology
for quantifying the effects of digitiza-
tion. They come to a stark conclusion:
“According to our estimates,” they
write, “about 47 percent of total U.S.
employment is at risk.”
Frey and Osborne list the
only 9 percent of the workforce today.
As the first industrial robots were
being developed in the 1960s, U.S.
president John F. Kennedy warned
that preventing massive unemploy-
ment in an age of automation would
be the major economic issue of the
decade. Nearly all the net new job
growth in the country since the mid-
20th century has been in services,
and between 1950 and 2016, the U.S.
workforce increased from 62 million
to more than 160 million.
The sunniest outlook going for-
ward will be for employees who have
the skills and knowledge to manage
or orchestrate automation, and for
those who have the people skills and
experience to bridge the gap between
technology and the human needs of
customers. A key skill for innovative
companies in the future will be to
channel that creativity in ways that
create both business value and new
kinds of employment.
version five of a very, very good product, for example,
where there’s a certain requirement for predictability of
delivery because we’ve got hundreds of customers who
already use it and hundreds of salespeople and channel
partners who are counting on the next version,” Pilc
continues. “The final category is our long-term tech-
nology strategy, where we’re responding to our CEO’s
direction about what technologies we need to be great
at over the next five years. Like other companies, we
have to be ambidextrous and have those three types of
activities coexist and complement and work with each
other, but not stifle the inherent natural cadence of
each of them.”
The Path Forward
No matter what industry they are in, company lead-
ers need to know where they stand with respect to the
shift of the R&D portfolio to software and service
offerings. Are you discussing the changes you see at
the highest levels of the company, and are you prepared
to invest in new capabilities if you find you are out
of step with the times? As we noted earlier, the com-
panies that are transitioning the fastest are also the
companies that believe they are outperforming their
competitors. Companies that are reporting faster rev-
enue growth are allocating 25 percent more of their
R&D portfolio to software offerings than their slower-
1000
featureinnovation
14
strategy+businessissue85
15
growing peers, and they are also investing more in ser-
vice offerings. Companies that report slower revenue
growth than key competitors are those that have made
the smallest shift away from product-based offerings
and are allocating less of their R&D investment to
service offerings. Among the innovation models we
study, Need Seekers made the most aggressive move to
software offerings between 2010 and 2015, and they
were also significantly more likely to report that their
companies were outperforming competitors in both
revenue and profit growth.
Company leaders need to ensure that their innova-
tion operating models are tightly aligned with new soft-
ware and service offerings. Traditional research and de-
velopment approaches, such as stage-gate development
for products and technology, remain valid, but more
innovative approaches such as open innovation models,
design thinking, agile methodologies, co-creation, and
in-company incubators are becoming more important
as portfolios change. These advanced innovation ap-
proaches can help in bridging the development time
and time-to-market of software and software-enabled
As it has in each of the past 11
editions of the Global In-
novation 1000, this year Strategy&,
PwC’s strategy consulting business,
identified the 1,000 public companies
around the world that spent the most
on R&D during the last fiscal year,
as of June 30, 2016. To be included,
companies had to make their R&D
spending numbers public. Subsidiar-
ies that were more than 50 percent
owned by a single corporate parent
during the period were excluded if
their financial results were included
in the parent company’s financials.
The Global Innovation 1000 com-
panies collectively account for 40
percent of the world’s R&D spending,
from all sources, including corporate
and government sources.
In 2013, Strategy& made some
adjustments to the data collection
process in order to gain a more
accurate and complete picture of
innovation spending. In prior years,
both capitalized and amortized R&D
expenditures were excluded. Starting
in 2013, we included the most recent
fiscal year’s amortization of capital-
ized R&D expenditures for relevant
companies in calculating the total
R&D investment, while continuing to
exclude any non-amortized capital-
ized costs. We have now applied this
methodology to all previous years’
data; as a result, historical data
referenced in the studies from 2014
onward will not always align with
previously published figures for the
2005 through 2012 studies.
For each of the top 1,000 com-
panies, we obtained from Bloomberg
and Capital IQ the key financial met-
rics for 2011 through 2016, including
sales, gross profit, operating profit,
net profit, historical R&D expendi-
tures, and market capitalization. All
sales and R&D expenditure figures
in foreign currencies were converted
into U.S. dollars according to an
average of the exchange rate over
the relevant period; for data on share
prices, we used the exchange rate on
the last day of the period.
All companies were coded into
one of nine industry sectors (or
“other”) according to Bloomberg’s
industry designations, and into one of
five regional designations, as deter-
mined by their reported headquarters
locations. To enable meaningful com-
parisons across industries, the R&D
spending levels and financial perfor-
mance metrics of each company were
indexed against the average values in
its own industry.
Finally, to understand the ways in
which global R&D is and will be con-
ducted at companies across multiple
industries, Strategy& conducted an
online survey of 466 innovation lead-
ers around the world. The companies
participating represented more than
US$91 billion in R&D spending, or
13.5 percent of this year’s total Global
Innovation 1000 R&D spending, all
nine of the industry sectors, and all
five geographic regions.
Methodology
featureinnovation
15
featurestitleofthearticle
16
Resources
Marc Andreessen, “Why Software Is Eating the World,” Wall Street
Journal, Aug. 20, 2011: The Netscape founder and venture capitalist
presciently explains why more major businesses and industries are being
run on software and delivered as online services.
Carl Benedikt Frey and Michael A. Osborne, “The Future of Employment:
How Susceptible Are Jobs to Computerisation?” Oxford Martin School
Working Paper, Sept. 17, 2013: Describes which jobs are most likely to be
made obsolete by digitization.
Reinhard Giessbauer, Jesper Vedsø, and Stefan Schauf, “A Strategist’s
Guide to Industry 4.0,” s+b, May 9, 2016: The next step in the evolution
of industry will be for companies to integrate operations into a seamless
digital whole.
Daniel Gross, “Siemens CEO Joe Kaeser on the Next Industrial Revolu-
tion,” s+b, Feb. 9, 2016: The head of the German industrial giant describes
how it is using software, sensors, and savvy to create a 21st-century digital
manufacturer.
Links to all previous Global Innovation 1000 studies from 2005 to 2015,
as well as videos, infographics, and other articles: strategyand.pwc.com/
innovation1000.
Strategy&’s Innovation Strategy Profiler allows you to evaluate your com-
pany’s R&D strategy and the capabilities it requires: strategyand.pwc
.com/global/home/what_we_do/services/innovation/thought-leadership/
innovation-strategy-profiler.
More thought leadership on this topic: 
strategy-business.com/innovation
service offerings, which turn around much more quick-
ly than traditional products.
Leaders also need to monitor a broader competitive
environment closely to assess the ways the rise of soft-
ware and services is affecting their core businesses and
their industry. Are any of your product or service of-
ferings at risk as software becomes more powerful and
pervasive, and as it enables new kinds of service offer-
ings that better meet changing customer expectations?
One useful exercise is to think through how a software
startup might go about disrupting your business. Is one
of your offerings, your company, or even your entire
industry a potential victim of disruption from a new
entrant with an innovative software- or services-driven
business model?
On the positive side, software and services offer
fertile ground for reimagining your value proposition
and the business model that supports it in creative ways.
As in the case of many of the companies cited in this
article, increasing R&D in software and services can
enable you to meet or anticipate your customers’ needs
(and add new streams of revenue) in ways that weren’t
imaginable just a few years ago, as well as creating
greater stickiness with established customers.
The reason that the fastest adopters of software and
service offerings are outperforming others is simple:
They are simultaneously embracing the massive chang-
es that digitization is enabling in product capabilities
and usability and responding to rising customer expec-
tations. The embrace and the response are symbiotic,
each creating opportunities and pressures that drive the
other. Offering excellent physical products has become
table stakes for competing in today’s economy. More
and more, features that depend on software and the ser-
vices it provides are the factors that differentiate com-
panies, create competitive advantage, and launch new
revenue streams. +
Reprint No. 16409
1000
featureinnovation
16
strategy+business magazine
is published by certain member firms
of the PwC network.
To subscribe, visit strategy-business.com
or call 1-855-869-4862.
• strategy-business.com
• facebook.com/strategybusiness
• linkedin.com/company/strategy-business
• twitter.com/stratandbiz
Articles published in strategy+business do not necessarily represent the views of the member firms of the
PwC network. Reviews and mentions of publications, products, or services do not constitute endorsement
or recommendation for purchase.
© 2016 PwC. All rights reserved. PwC refers to the PwC network and/or one or more of its member firms,
each of which is a separate legal entity. Please see www.pwc.com/structure for further details. Mentions
of Strategy& refer to the global team of practical strategists that is integrated within the PwC network of
firms. For more about Strategy&, see www.strategyand.pwc.com. No reproduction is permitted in whole or
part without written permission of PwC. “strategy+business” is a trademark of PwC.

2016 Global Innovation 1000: Software-as-a-Catalyst

  • 1.
    strategy+business ISSUE 85 WINTER2016 REPRINT 16409 BY BARRY JARUZELSKI, VOLKER STAACK, AND ARITOMO SHINOZAKI GLOBAL INNOVATION 1000 Software-as-a-Catalyst The world’s largest innovators are shifting the focus of their R&D investments from products to programming.
  • 2.
  • 3.
    IllustrationbyPatrickHruby SOFTWARE-AS- A-CATALYST The world’s largestinnovators are shifting the focus of their R&D investmentsfromproducts toprogramming. by Barry Jaruzelski, Volker Staack, and Aritomo Shinozaki Throughout its nearly 180-year history, John Deere has been an innovation leader. Its first product was a polished- steel plow that outperformed existing tools. And over the decades, the company’s research and development (R&D) efforts were aimed squarely at improving the mechanical and functional performance of its products. Today, Deere’s iconic green machinery is recognized the world over for quality and durability. But over the last decade, the focus of the company’s R&D has been shifting to software and service offerings. “Our customers continue to expect the best equipment,” says Klaus Hoehn, vice president of advanced technology and engineering. “But on top of that, they want us to provide solutions that address the pain points they’re experiencing in their business.” Deere’s newest generationof corn planters not only run at twice the speed of previous models, but also feature monitors, sensors, and software that optimize the planting process and generate detailed computerized data about how and where seeds are sown. featureinnovation 2 1000
  • 4.
    strategy+businessissue85 3 Barry Jaruzelski barry.jaruzelski@pwc.com is athought leader with Strategy&, PwC’s strategy consulting business, where he advises senior high-tech and industrial executives on corporate and innovation strategy. In 2005, he created the Global Innovation 1000 study, and in 2013 was named one of the “Top 25 Consultants” by Consulting magazine. He is a principal with PwC US, and is based in Florham Park, N.J. Volker Staack volker.staack@pwc.com is a leading practitioner in Strategy&’s innovation practice and works with automotive, industrial, and technology companies, helping them build competitive innovation capa- bilities from strategy to execu- tion. He is a principal with PwC US and is based in Miami. Aritomo Shinozaki ari.shinozaki@pwc.com is a leading practitioner in PwC’s product innovation and development team, focusing on software and technology- intensive industries. He is a principal with PwC US and is based in San Jose, Calif. Also contributing to this article were s+b contributing editor Rob Norton and Strategy& campaign managers Kristen Esfahanian and Spencer Herbst. Farmers can maximize their productivity during the shorterplantingwindowsthatnewseedvarietiesdemand, and increase their yields — while gaining a wealth of information to help them manage their operations more productively. To offer these kinds of solutions, Deere needed to significantly alter its mix of R&D resources. Over the last 10 years, Hoehn says, “we have grown software and data analytic resources significantly. It’s not hard for me to predict that we’ll have more software engineers than mechanical engineers at the company within the next five years.” Most of the world’s major innovators are in the midst of the same transformational journey. R&D is shifting more and more toward developing software and services. Software increasingly carries the burden of enabling product differentiation and adaptability, and enhancing customer experiences and outcomes. Services, offered along with or separately from physical products, now focus more on new customer needs, pro- viding enhanced value and improved usability. In this year’s Global Innovation 1000 study — an examination of the 1,000 public companies that spend the most on researching and developing products for their markets — we focused on the transformation that R&D is undergoing as companies strengthen their soft- ware and service offerings (the services themselves also tend to be software-based). The shift is being driven by the supercharged pace of improvement in what software can do, and the growing use of embedded software and sensors in products — as well as the ability to reliably and inexpensively connect and network products, cus- tomers, and suppliers via the Internet of Things and the availability of cloud-based data storage. Perhaps most of all, it’s being driven by rising customer expectations. The rapid change is powerfully affecting the mix of R&D spending. Between 2010 and 2015, companies we surveyed for the Global Innovation 1000 study in- creased their weighted average allocation of R&D in software offerings from 17 percent to 21 percent of their R&D portfolios — a 23 percent rise. Over those five years, total R&D spending for the Global Innovation 1000 grew 34 percent, to US$680 billion. The result: a 65 percent increase in R&D spending on software of- ferings, to $142 billion. In the same time period, R&D spending on service offerings rose 36 percent to $257 billion. Spending on product offerings, although de- clining as a percentage of R&D allocation, grew 21 per- cent, to $280 billion (see Exhibit 1). This investment shift will continue to intensify. In 2010, more than 40 percent of the companies surveyed Source: Strategy& analysis Exhibit 1: Biggest Leaps in R&D Spending Although software remains the smallest of the three main sectors of R&D, it has grown the most rapidly in recent years. R&D spending by offering, 2010–15 US$ Billions Software Offerings +65% Service Offerings +36% Product-Based Offerings +21% 2010 $86 $188 $232 2015 $142 $257 $280 featureinnovation 3
  • 5.
    featurestitleofthearticle 4 had no allocationin their R&D budgets for developing software offerings. In 2015, that number fell to 30 per- cent, and by 2020, respondents indicated, it will drop to just 23 percent. R&D spending for service offerings, meanwhile, is becoming more prevalent. Five years ago, 31 percent of the companies surveyed were spending 10 percent or less of their R&D budget on services; by 2020, the respondents indicated only 16 percent will in- vest such a small amount in development of them. Companies are facing many managerial, organiza- tional, and cultural challenges as the shift of R&D to software and services accelerates. Acknowledging the transition and meeting those challenges is an impera- tive for companies that want to maintain and enhance their competitive position. In our survey, companies currently allocating 25 percent or more of their R&D budgets to software offerings reported that their reve- nues were growing significantly faster than those of key competitors with lower allocations (see Exhibit 2). The shift in types of R&D spending is taking place amid muted overall growth. Total R&D spending rose a scant 0.04 percent from 2015 to 2016 among the Global Innovation 1000 companies, to remain at $680 billion. The figure was held down in large part by glob- al currency fluctuations — specifically, the significant rise of the U.S. dollar against most other major curren- cies. (See “Profiling the Global Innovation 1000,” next page, and “Methodology,” page 15.) Given its dura- tion and magnitude, the transition in R&D spending to software and services appears to be independent of these macroeconomic fluctuations, and may in fact ac- celerate as currencies stabilize and economies improve. Enter the Engineers In 2010, 50 percent of our survey respondents allocated half or more of their R&D spending to product-based offerings. But in 2015, the product-based share of R&D spending fell to 41 percent from 46 percent in 2010, and is expected to decline to 37 percent by 2020. The share of R&D spending on software offerings has si- multaneously been rising. In 2010, 59 percent of re- spondents said their companies were spending 10 per- cent or more on software offerings; by 2020, 77 percent expect to be spending at least that much. The companies represented in our survey were already allocating a higher percentage of their R&D spending to services than to software offerings in 2010. The shift to spending more on services has been less pronounced but is still significant. Overall, on a weighted average basis, our survey shows that spendingSource: Strategy& analysis 2010 2015 2020 0% 5% 10% 15% 20% 25% 30% Slower The Same Faster Exhibit 2: Software Spurs Growth Companies that committed a higher proportion of R&D to software earlier than competitors are more likely to report their revenues are growing more rapidly. Allocation of R&D to software Estimate of revenue growth compared with key competitors 1000 (continued on page 7) featureinnovation 4
  • 6.
    strategy+businessissue85 5 but in 2016most key currencies fell against the U.S. dollar. If foreign ex- change rates had remained roughly at their 2015 levels, worldwide R&D spending would have increased 6 percent — just above the long-term compound annual growth rate for R&D spending. Revenue for the Global Innova- tion 1000 companies fell nearly 12 percent in 2016, dragged down by the chemicals and energy indus- try, where falling oil prices and the strong dollar resulted in a 31 percent decline. As a result, R&D intensity Worldwide R&D spending among the Global Innova- tion 1000 companies increased 0.04 percent in 2016, to US$680 billion, essentially unchanged from the previous year. Currency fluctuations played an unusually large role in this year’s results: Typically, exchange rate changes cancel each other out, Profiling the Global Innovation 1000 2016 2015 Source: Bloomberg data, Capital IQ data, Strategy& analysis Exhibit B: The Top 20 R&D Spenders RANK Company Industry2016 US$ Billions Change from 2015 % of Revenue Headquarters R&D Spending $13.2 $12.7 $12.5 $12.3 $12.1 $12.0 $10.0 $9.5 $9.0 $8.8 $8.1 $7.7 $7.5 $6.7 $6.7 $6.6 $6.2 $6.0 $5.9 $5.8 $179.4 Auto Computing and Electronics Software and Internet Software and Internet Computing and Electronics Software and Internet Healthcare Healthcare Healthcare Auto Computing and Electronics Healthcare Auto Healthcare Auto Auto Computing and Electronics Healthcare Healthcare Software and Internet 2.7% –3.0% 35.2% 24.9% 5.1% 5.8% –3.2% –1.6% 6.5% 5.1% 33.5% –8.4% 1.4% –6.6% 0.0% 4.5% –1.4% 7.5% 30.6% 4.8% 6.3% 5.6% 7.2% 11.7% 16.4% 21.9% 12.9% 19.9% 19.2% 12.9% 3.7% 3.5% 15.7% 4.9% 17.0% 4.5% 4.0% 12.6% 24.3% 35.7% 15.6% 8.7% 1 2 3 4 5 6 7 8 9 10 11 12 13 14 15 16 17 18 19 20 1 2 7 6 3 4 5 9 10 8 18 11 13 14 15 12 17 20 32 22 Volkswagen Samsung Amazon Alphabet Intel Microsoft Roche Holding Novartis Johnson & Johnson Toyota Apple Pfizer General Motors Merck Ford Daimler Cisco AstraZeneca Bristol-Myers Squibb Oracle Europe South Korea North America North America North America North America Europe Europe North America Japan North America North America North America North America North America Europe North America Europe North America North America TOP 20 TOTAL Although some rankings shifted, the 2016 list of the 20 biggest R&D spenders features many of the same names as the previous year’s list (and in nine cases, as lists from the last decade). However, there were two notable entrants to the top 20: Bristol-Myers Squibb and Oracle. Companies in RED have been among the top 20 R&D spenders every year since 2005. Indexed to 2005 1.8 1.6 1.4 1.2 1.0 0.8 0.6 2.0 2005 20152010 Revenue R&D Spending Exhibit A: R&D and Revenue Flat spending and a decline in revenue led to an increase in R&D intensity. Source: Bloomberg data, Capital IQ data, Strategy& analysis R&D Spending as a % of Revenue Indexed to 2005 1.8 1.6 1.4 1.2 1.0 0.8 0.6 2.0 2005 20152010 Revenue R&D Spending Exhibit A: R&D and Revenue Flat spending and a decline in revenue led to an increase in R&D intensity. Source: Bloomberg data, Capital IQ data, Strategy& analysis R&D Spending as a % of Revenue featureinnovation 5
  • 7.
    featurestitleofthearticle 6 tive company (see“The 10 Most Innovative Companies,” page 9). Bristol-Myers Squibb (BMS) and Oracle joined the top 20 this year in the 19th and 20th slots. The largest company on the top 20 spender list is Volkswagen, with $236.9 billion in sales, and the smallest is BMS, with just $16.6 billion. Only three of the nine industries we track — software and Internet, healthcare, and consumer — in- creased their R&D spending in 2016. Software and Internet had the biggest gain by far; R&D spending was up 15.4 percent, compared with 2.6 per- cent for healthcare and 0.7 percent for consumer. The continued rapid expansion of R&D investment by the software industry does not even reflect the increasing investments in this technology made by other industries, such as auto, computing and electronics, and healthcare. The sharpest declines in R&D spending were in chemicals and energy (11.5 percent) and telecom (12.2 percent). At current growth rates, health- care remains on track to surpass computing and electronics as the largest industry in terms of R&D (innovation spending as a percentage of revenues) returned to its all-time high of 4.2 percent (see Exhibit A). Volkswagen and Samsung re- tained their positions as the number one and number two R&D spenders in 2016, with totals of $13.2 billion and $12.7 billion, respectively (see Exhibit B). Just over $1 billion, how- ever, separated the top five compa- nies. Amazon continued its ascent of the top 20 R&D spenders list, moving to third place from seventh. Alpha- bet, the parent company of Google, moved from sixth position in 2015 to fourth in 2016. Apple made the big- gest jump in position — from number 18 to number 11 — as it significantly increased R&D spending. But Apple also stands out for having the low- est R&D intensity of any of the top 20 companies — at 3.5 percent, it is about half the average intensity of the computing and electronics industry. Apple is extremely efficient in translating its R&D spending into popular products and continues to be voted the world’s most innova- spending in 2018. The industry with the fastest R&D spending growth trajectory, however, continues to be software and Internet: R&D spend- ing has grown faster in that category than in any other since 2011. At cur- rent growth rates, the software and Internet sector will outpace auto to become the third-largest R&D spend- ing industry by 2017 (see Exhibit C). Regionally, companies head- quartered in North America — the vast majority in the U.S. — had the second-fastest growth in R&D spending among all regions, and ac- counted for nearly 44 percent of total Global Innovation 1000 R&D spend- ing. These results were influenced by the dollar’s increased strength. But there are other indications that North American companies are flourishing in the current innovation environ- ment. U.S. firms are dominant in the two industries where R&D is growing the fastest: 62 percent of all software and Internet companies are head- quartered in North America, as are 56 percent of all healthcare compa- nies (see Exhibit D). Exhibit C: Leading Industries By 2018, healthcare will spend more on R&D than any other industry. Source: Bloomberg data, Capital IQ data, Strategy& analysis $0 $50 $100 $150 $200 Auto R&D spending, US$ billions 2005 2015 20182010 est. Computing and Electronics Software and Internet Industrials Healthcare Exhibit D: The Geography of R&D The two sectors in which R&D spending is growing most rapidly — healthcare and software and Internet — are heavily weighted to companies headquartered in North America. Rest of World China Japan Europe North America Auto 22% 20% 30% 18% 10% 93 Industrials 19% 26% 19% 29% 6% 175 Computing and Electronics 43% 13% 15% 11% 18% 228TOTAL COMPANIES Source: Bloomberg data, Capital IQ data, Strategy& analysis Healthcare 56% 7% 24% 2%10% 164 Software and Internet 62% 12% 18% 2% 6% 103 1000 (continued on next page) featureinnovation 6
  • 8.
    strategy+businessissue85 7 last year’s study,however, China has become a magnet for R&D investment from companies head- quartered in other regions, which is one of the reasons Asia is now the number one region for innova- tion spending, when measured by where R&D dollars are spent. (See “Innovation’s New World Order,” by Barry Jaruzelski, Kevin Schwartz, and Volker Staack, s+b, Oct. 27, 2015.) R&D spending was down for companies headquartered in Europe and Japan in 2016, and flat for those in the rest of the world. (continued from previous page) Additionally, in 2016, for the first time in the study’s history, the number of Global Innovation 1000 companies headquartered in the U.S. rose, by 8.5 percent. Although R&D spending by companies headquartered in China rose in 2016 (by 19 percent), the pace of their R&D spending growth has slowed. In 2014, for example, the R&D growth rate at China-based companies was more than 15 times the rate at North American compa- nies; in 2016, it was only twice the rate (see Exhibit E). As we noted in Europe Japan North America Change 2015–16 Rest of World Exhibit E: R&D Spending by Region Companies based in the world’s most developed economies are retaining their significant lead in investment. Source: Bloomberg data, Capital IQ data, Strategy& analysis $0 $50 $100 $150 $200 $250 $300 US$ Billions 2013 2015 20162014 +8% –9% –8% –3% +19% China on service offerings will surpass spending on product offerings by 2020 (see Exhibit 3). To support the transition to software and service offerings, fewer companies are focusing the bulk of their R&D spending on electrical and mechanical en- gineering, according to our survey. From 2010 to 2020, our survey indicates that among companies that employ electrical engineers, the number reporting that electri- cal engineers are the top engineering specialty will fall by 35 percent. In 2010, just 8 percent of companies said data engineers represented their largest group of engi- neers. By 2020, that proportion should double, to 16 percent (see Exhibit 4). Global technology and industrial company Siemens has been at the forefront of the redirection of R&D from physical products to software and services. “Ev- erything we make now — all our products and all our services — is software driven,” says Eric Spiegel, presi- dent and chief executive officer of Siemens USA. “And in addition to the software associated with our prod- ucts, we are developing software platforms like Sinalyt- ics that collect and analyze the data from our products. At the highest level, what’s happening in our company — and, I think, in the economy — is a huge shift to- ward people and skills needed in software development and software upgrading.” Siemens currently employs some 17,000 software engineers, a force of comparable scale to that of Microsoft or Google, and expects to hire an additional 5,000 by 2020, as well as growing num- bers of specialists in data analytics and related fields. General Electric, which competes in many of the same industries as Siemens, is moving in a similar di- rection. CEO Jeffrey Immelt announced in 2015 that GE aims to be “a top 10 software company” by 2020, and that the transformation would determine the com- pany’s success or failure over the next decade. Pitney Bowes, best known in the 20th century for its ubiquitous postage meters, has transformed itself over the past decade into an increasingly digital com- pany, says Roger Pilc, executive vice president and chiefSource: Strategy& analysis Exhibit 3: Shifting Priorities Companies are allocating higher proportions of their R&D budgets to software and service offerings. Allocation of R&D investment to offering type 2010 2015 2020 0% 10% 20% 30% 40% 50% Software Offerings +43% Product-Based Offerings –19% Service Offerings +5% (continued from page 4) featureinnovation 7
  • 9.
    featurestitleofthearticle 8 innovation officer. “Today,roughly 80 percent of our R&D spend is on software, data, e-commerce services, analytics, and design — across all our business units,” he says. One of the company’s major recent offerings is a cloud-based set of software and data services for man- aging shipping, including payments, address validation, postage, and fulfillment. “It enables customers to see and analyze their usage in real time, comparing their performance to peers,” says Pilc. “And they can do it from any device, including a desktop PC, tablet, post- age meter, or mobile phone.” Model Behavior For the past nine years, the Global Innovation 1000 study has assessed the distinct ways companies man- age the innovation process, as well as their culture, corporate strategy, and relationship to customers. We have identified three fundamental models. Need Seekers make a point of engaging customers directly to gener- ate new ideas and develop products and services based on superior end-user understanding, aiming to fill un- articulated needs. Market Readers monitor customers and competitors closely and create value by making in- cremental changes and by capitalizing on market trends as fast followers to meet customers’ articulated needs. Technology Drivers rely on their internal technological capabilities to develop new products and services and seek to push these technologies out into the market in search of desirable applications. Companies of all three types have reduced their allocation of R&D spending on physical product of- ferings since 2010, and plan to continue to do so over the coming five years. Technology Drivers are shift- ing the most toward service offerings, in an effort to become more customer-centric. They are also raising their spending the least on software offerings — prob- ably because they were already strong in that area. Market Readers, the most product-centric of the three, are boosting their R&D allocation to software and services only modestly. Need Seekers, which by defi- nition are the most driven by customer insights, have the highest proportion of R&D resources in service of- ferings and are increasing their allocation to software offerings most aggressively — from 20 percent in 2010 to 29 percent in 2020. On a regional basis, companies in North America are making the strongest move to software offerings, from 15 percent of total R&D spending in 2010 to 24 percent in 2020. Asia remains the most product-centric Percent of companies where the largest engineer employee group is... Source: Strategy& analysis Exhibit 4: Allocating Talent Companies are focusing less on traditional disciplines like mechanical and electrical engineering and more on data and software engineering. 4 Changes in the R&D enginnering specialties 0% 10% 20% 30% 40% Software Engineers +10% Systems Engineers –11% Mechanical Engineers –16% Electrical Engineers –35% Data Engineers 2010 2015 2020 2010 2015 2020 2010 2015 2020 2010 2015 2020 2010 2015 2020 +92% Increase 2010–20 1000 FEWER COMPANIES ARE FOCUSING THE BULK OF THEIR R&D SPENDING ON ELECTRICAL AND MECHANICAL ENGINEERING, ACCORDING TO OUR SURVEY. featureinnovation 8
  • 10.
    strategy+businessissue85 9 last year tothird in 2016, proving that the innovation executives who vote in our survey value the steady, long- term approach to innovation that the Minnesota-based company has long exemplified (see Exhibit F). Tesla joined the most innovative companies list in 2013 in ninth place, and has ascended to the number four position in 2016. It is the only auto company voted onto this year’s list, and that seems appropriate given the focus of this year’s Global Innova- tion 1000 study: the increasing shift of R&D investment to software and service offerings. Tesla has been an innovator in both areas, with such offerings as its Autopilot self- driving feature, which was delivered overnight — over the Internet — as a software update to 60,000 customers in October 2015. Amazon has also moved quickly up the list, first appearing in the 10th position in 2012 and now residing at number five. Amazon, of course, first made its name by developing the most successful B2C software offer- For the seventh year running, Apple and Alphabet (formerly Google) were voted the two most innovative companies in the Global Innovation 1000 by the study par- ticipants. Apple’s once substantial margin, however, has narrowed, and it edged out Alphabet this year by only a handful of votes. Alphabet’s Google continues to make waves with initiatives such as its self-driving car project, while Apple focuses on its capabilities in gaining customer insights to improve popular, profit- able products such as the iPhone. Interestingly, the two companies are now competing directly in one of the hot new software markets — con- nectivity platforms for cars — with the Apple CarPlay and Android Auto offerings going head-to-head. 3M moved up from sixth position ing in retail — however, B2B is likely its larger future. While the company’s efforts to develop drone delivery for packages make headlines, its Amazon Web Services cloud comput- ing platform for businesses makes money: The subsidiary is on track to hit $10 billion in revenues for 2016, and it currently accounts for more than half of Amazon’s profits. As has been the case for each of the past seven years, the 10 most innovative companies continue to outperform the top 10 R&D spenders on key performance metrics. They surpassed their competitors on five-year revenue growth and did far better on EBITDA as a percentage of revenue and market capitalization growth — once again proving one of our key findings of the Global Innovation 1000 study: How you spend on innovation is more important than how much you spend (see Exhibit G). The 10 Most Innovative Companies Exhibit F: The 10 Most Innovative Companies In recent years, 3M and Tesla have risen in the ranks of the most innovative companies, while GE has fallen. 1 2 3 4 5 6 7 8 9 10 Apple Alphabet 3M GE Microsoft IBM P&G Intel Samsung Facebook Amazon Tesla RANK Toyota 2010 2011 2012 2013 2014 2015 2016 Source: Strategy& analysis 50 Exhibit G: Innovating vs.Spending Companies ranked by their peers as most innovative show better financial performance than the top R&D spenders. Source: Bloomberg data, Capital IQ data, Strategy& analysis Normalized performance of industry peers 69 40 EBITDA as % of Revenue 5-yr. Avg. 65 49 Market Cap Growth 5-yr. CAGR HIGHEST POSSIBLE SCORE: 100 LOWEST POSSIBLE SCORE: 0 Revenue Growth 5-yr. CAGR 40 TOP10SPENDERS 50 TOP10INNOVATORS featureinnovation 9
  • 11.
    featurestitleofthearticle 10 Source: Strategy& analysis Exhibit6: Explaining the Investment Shift Companies are most likely to cite competition factors as they account for changing R&D priorities. What is driving the change in your company’s R&D mix? Need to stay competitive Need to increase revenue Wish to keep up with customer expectations Need for higher margins Desire to access untapped markets 57% 54% 48% 41% 34% Exhibit 5: Regional Variations While declining in both Europe and North America, product-based R&D continues to dominate in Asia. Estimated allocation of R&D investment by type of offering Asia 2010 20202015 Europe 2010 20202015 North America 2010 20202015 Source: Strategy& analysis 0% 10% 20% 30% 40% 50% Software Offerings Product-Based Offerings +63% +28% Service Offerings +33% Growth 2010–20 region — due in part to China’s focus over the last 15 years on becoming the world’s manufacturing center (see Exhibit 5). Forty-four percent of its R&D invest- ment was allocated to product offerings in 2010, a pro- portion expected to fall to 40 percent in 2020. Factors Driving the Shift The three most commonly cited explanations for why companies are shifting R&D budgets toward software were staying competitive (57 percent of survey re- spondents), driving revenue growth (54 percent), and meeting changing customer expectations (48 percent) (see Exhibit 6). The next most frequently cited reasons were the need for higher margins, the desire to access untapped markets, the need to reduce operating costs, and the desire to better incorporate digitization into the business. Need Seekers most frequently cited the need to keep pace with customer expectations (53 percent), which tracks with their propensity to be tightly aligned with customer needs and market trends. For Technol- ogy Drivers and Market Readers, the leading reason was staying competitive (60 percent and 58 percent, re- spectively), which indicates they are playing catch-up to Need Seekers, who are driving this trend. Companies are adapting to rapidly shifting stan- dards and expectations. “The hardware itself is becom- ing fairly commoditized in many of the businesses we’re in,” says Michael Maiello, senior vice president for home and business networks at Schneider Electric, which manufactures equipment for industrial, energy, and IT customers. “To really differentiate yourself and create lasting offers, you need to move from not only 1000 featureinnovation 10
  • 12.
    strategy+businessissue85 11 best-in-class hardware productsto a customer solution that includes different product components and soft- ware, with services wrapped around it. We’ve realized that software and services are going to be a large part of our needed competencies as we move forward.” German automaker Daimler is focused on bringing the best products to the market, with the best fuel econ- omy. “But today much of what you do to improve fuel economy is in the software,” says Heiko Noessler, direc- tor of manufacturing at Daimler. “And software is hav- ing more of an impact not only in the products them- selves, but through what connectivity enables, such as service diagnostics.” In the past, when a delivery truck broke down, a driver would take it to a service station. “Today, if the truck is breaking down, the driver can get in contact with a service representative who guides him through how to keep it running or what kind of a repair will be needed,” Noessler notes. “This saves a lot of time and keeps the product on the road, and that’s how the customer makes his money.” In many cases, companies are facing competition from new market participants, or from different sec- tors. “We have competitors we never thought we would have,” says John Deere’s Hoehn. “They are coming from a 180-degree different perspective, but they are also trying to provide solutions that address our cus- tomers’ pain points. We have seen this new variety of competition coming from all directions in the last five to eight years.” Seed companies, for example, have service offerings that aim to deliver some of the same analytical features that Deere is providing with its farm machinery. “They might see our equipment as a com- modity, and we might see their seed material as a com- modity,” Hoehn says. “But they are trying to occupy the same space we are, and in a broader sense, we’re now in the same business.” Companies seeking higher revenues are increasing their R&D spending on software and services because that’s where they see their growth opportunities. The need to generate revenue and growth was the second most important reason companies gave for their chang- ing R&D portfolios. The pattern is especially pro- nounced in the auto business. “What’s happening in the automotive industry is as significant as the invention of the internal combustion engine over 100 years ago,” says Martin O’Brien, general manager of the integrated electrical systems division of Mentor Graphics, which supplies software and software tools to automotive, aerospace, and other industries. “The car has gone from being a largely mechanical device a decade ago to hav- ing the most embedded software of almost any platform in the world today. A modern car may have 80 different computers controlling the different functions in the ve- hicle, and perhaps 100 million lines of software code to implement many of those functions. Function growth is driven mostly by safety, consumerization, and connec- tivity needs in this new era.” Building Capabilities, Finding Opportunities More than half of the companies surveyed are changing their mix of talent because their changing customer of- ferings require a different mix of engineering resources; that was the case for Technology Drivers, Market Read- ers, and Need Seekers alike. Other reasons frequently cited were that companies had acquired a new set of capabilities that required R&D support (28 percent) or that there were changes in their industry (26 percent). A quarter of respondents said they were relying on third- featureinnovation 11
  • 13.
    featurestitleofthearticle 12 party providers forsoftware and service engineering. Attracting and retaining R&D personnel with the right talents is a challenge in most industries. “We are re- cruiting for data analytics and digitalization-based roles at the senior levels of the organization. We are looking for leaders who can identify opportunities and create business models to expand, optimize, and transform the business deploying analytics platforms and tools,” says Siemens’s Spiegel. The shift is already changing the way business schools think about their course offerings, and will have profound effects both on education and, more generally, on the future of employment. (See “Jobs in the Age of Digital Innovation,” next page.) Companies that made an acquisition during the past five years reported that 71 percent of the deals were done to augment capabilities in software (33 percent) or services (38 percent). Forty-one percent of the compa- nies we surveyed either have acquired a services firm or plan to do so in the next five years, and 38 percent have acquired or plan to acquire a software firm. Need Seek- ers and Market Readers said they were the most likely to acquire a software firm over the next five years, and Technology Drivers said they were the most likely to ac- quire a services firm. And roughly one-third of the com- panies surveyed said they had invested corporate funds directly in external startups within the last five years. These companies also anticipate making the biggest change in the proportion of R&D spending to software offerings. Between 2010 and 2020, they expect that their allocation of R&D to software offerings will grow 57 percent — nearly twice the rate of companies that have not invested in a startup. For Polaris Industries, which designs, develops, and manufactures power sports vehicles such as snow- mobiles and motorcycles, the competition is mainly focused on vehicle performance, says Ken Pucel, execu- tive vice president of operations, engineering, and lean manufacturing. Most of the company’s software R&D involves improving performance, such as computerized engine controls that can switch from “work” to “per- formance” mode at the push of a button, and most of the software for doing that work is available from third-party vendors. In 2013, however, Polaris acquired a software development company to build its RiderX platform, which connects the vehicle to the driver’s mobile phone. “It’s a navigation system for the off-road enthusiast,” says Pucel. “You can see the turns on the trail ahead. You don’t get lost. You can find a gas station or a restaurant, and it connects you with your friends. It enhances the whole riding experience, and I see our platform as the industry standard.” Culture and Management The shift toward software and service offerings is pre- senting new cultural and managerial challenges to com- panies. Some companies with product-centered roots are moving more of their R&D operations away from their home base — which is often in an industrial re- gion unattractive to young software engineers and data specialists — toward Silicon Valley or to emerging tech clusters such as Phoenix; Austin, Tex.; and North Car- olina’s Research Triangle. Ford, for example, opened a new research facility in Palo Alto, Calif., in 2015, close to Stanford University (and Tesla’s headquarters), with 125 employees. Most were locally hired, and the facility is managed by a former Apple executive. In Au- gust 2016, Ford CEO Mark Fields said the workforce there was doubling — at the same time he announced ROUGHLY ONE-THIRD OF THE COMPANIES SURVEYED SAID THEY HAD INVESTED CORPORATE FUNDS DIRECTLY IN EXTERNAL STARTUPS WITHIN THE LAST FIVE YEARS. 1000 featureinnovation 12
  • 14.
    strategy+businessissue85 13 ded in itor requires using a software product to create it in the first place. Software has become a kind of basic language, like mathematics, which you need to know just to work suc- cessfully as an engineer.” Familiarity with software is becoming a necessary skill for man- agers as well. At Cornell’s Johnson School, more MBA students are sign- ing up for programming courses in the engineering department. “They’re not necessarily interested in pro- gramming — though most of them do program things themselves; they’re taking these courses so they are able to understand the language and interact with professional software engineers,” says Dutta. “We are also seeing increasing interest in courses focused on the service economy and on technology.” The shift toward software and service offerings is also changing the skill sets needed for other jobs in a wide range of industries. For ex- The rising trend line of R&D investment in software and service offerings suggests there will be major changes in the kinds of jobs that will be created — and in the opportunities for those jobs that will continue to exist — over the next decade and beyond. Companies are already feeling the effects of the shift within their R&D operations as they compete to increase their ranks of software engineers and other specialists. “It’s very hard today to make a distinction between an engineer and a software engineer,” says Soumitra Dutta, dean of the Samuel Curtis Johnson Gradu- ate School of Management at Cornell University. “Almost every product you create either has software embed- ample, in today’s advanced manufac- turing workplaces, a factory worker is more likely to be carrying a tablet computer than a wrench, and may have the skills to configure software for new situations, or understand how to program CNC (computer numerical control) machines. To pre- pare people for these jobs, compa- nies and governments at the federal, state, and local levels in the U.S. have launched dozens of initiatives to improve skills in science, technol- ogy, engineering, and math (STEM) subjects over the last decade, at both secondary schools and commu- nity colleges. The rise of software and ser- vices can be viewed as just the latest effect of the computer age, which has radically changed the nature of employment in many industries over the last 30 years. Welders have been replaced by robots, bank tellers by ATMs, and phone operators by automated switchboards. The phe- Jobs in the Age of Digital Innovation that Ford would be manufacturing fully autonomous cars by 2021. General Electric opened a software center in San Ramon, Calif. (not far from Silicon Valley), in 2011, and has been expanding it as the central hub of GE Digital, a new unit that combines the company’s soft- ware and technology efforts. The company is also run- ning a national TV advertising campaign in the U.S. in which a young software developer tries to explain to uncomprehending friends and family members why he’s taking a job at GE. The tagline is: “The digital company. That’s also an industrial company.” Companies are also finding they must adapt their innovation models to allow for the different cadences at which hardware innovation, software innovation, and service innovation run. “Another challenge is ap- plying and coordinating management processes and systems to the right types of innovation at different stages of the product and technology life cycle, rather than having a one-size-fits-all approach,” says Pitney Bowes’s Pilc. For new, transformative, or disruptive innovation, the company employs lean startup, de- sign thinking, and highly agile data methodologies in cloud-based, software-as-a-service distribution models. “A large portion of our global development budget is what we would describe as continuous innovation — featureinnovation 13
  • 15.
    featurestitleofthearticle 14 probability that computerization willeliminate jobs for 702 detailed occupations, including most workers in office and administrative support, production, and transportation and logistics. Some of the job classifica- tions with the highest degree of risk are drivers, sales workers, loan officers, and insurance underwriters. Repetitive white-collar and service vocations are most vulnerable to digitization today. Where will new jobs come from to replace the many that will disappear? The answer is not clear. Modern society has experienced employment shifts of this magnitude before. In 1900, for example, more than 40 percent of the U.S. work- force was employed in agriculture. Today the number is just 1.4 percent, thanks to technological advances. Manufacturing jobs took up some of the slack for many decades, but their numbers, too, have been falling since the late 1940s, and they account for nomenon was foretold — even given a name — by the British economist John Maynard Keynes in 1930: tech- nological unemployment. But as an increasing number of the world’s leading innovators ac- celerate the shift away from purely physical products to software and service offerings, the employment effects will become much more dramatic and far-reaching. Sev- eral books and a welter of scholarly papers and articles have argued the pros and cons of the shift over the last few years. In “The Future of Employ- ment: How Susceptible Are Jobs to Computerisation?” Oxford University professors Carl Benedikt Frey and Michael A. Osborne review this litera- ture and employ a novel methodology for quantifying the effects of digitiza- tion. They come to a stark conclusion: “According to our estimates,” they write, “about 47 percent of total U.S. employment is at risk.” Frey and Osborne list the only 9 percent of the workforce today. As the first industrial robots were being developed in the 1960s, U.S. president John F. Kennedy warned that preventing massive unemploy- ment in an age of automation would be the major economic issue of the decade. Nearly all the net new job growth in the country since the mid- 20th century has been in services, and between 1950 and 2016, the U.S. workforce increased from 62 million to more than 160 million. The sunniest outlook going for- ward will be for employees who have the skills and knowledge to manage or orchestrate automation, and for those who have the people skills and experience to bridge the gap between technology and the human needs of customers. A key skill for innovative companies in the future will be to channel that creativity in ways that create both business value and new kinds of employment. version five of a very, very good product, for example, where there’s a certain requirement for predictability of delivery because we’ve got hundreds of customers who already use it and hundreds of salespeople and channel partners who are counting on the next version,” Pilc continues. “The final category is our long-term tech- nology strategy, where we’re responding to our CEO’s direction about what technologies we need to be great at over the next five years. Like other companies, we have to be ambidextrous and have those three types of activities coexist and complement and work with each other, but not stifle the inherent natural cadence of each of them.” The Path Forward No matter what industry they are in, company lead- ers need to know where they stand with respect to the shift of the R&D portfolio to software and service offerings. Are you discussing the changes you see at the highest levels of the company, and are you prepared to invest in new capabilities if you find you are out of step with the times? As we noted earlier, the com- panies that are transitioning the fastest are also the companies that believe they are outperforming their competitors. Companies that are reporting faster rev- enue growth are allocating 25 percent more of their R&D portfolio to software offerings than their slower- 1000 featureinnovation 14
  • 16.
    strategy+businessissue85 15 growing peers, andthey are also investing more in ser- vice offerings. Companies that report slower revenue growth than key competitors are those that have made the smallest shift away from product-based offerings and are allocating less of their R&D investment to service offerings. Among the innovation models we study, Need Seekers made the most aggressive move to software offerings between 2010 and 2015, and they were also significantly more likely to report that their companies were outperforming competitors in both revenue and profit growth. Company leaders need to ensure that their innova- tion operating models are tightly aligned with new soft- ware and service offerings. Traditional research and de- velopment approaches, such as stage-gate development for products and technology, remain valid, but more innovative approaches such as open innovation models, design thinking, agile methodologies, co-creation, and in-company incubators are becoming more important as portfolios change. These advanced innovation ap- proaches can help in bridging the development time and time-to-market of software and software-enabled As it has in each of the past 11 editions of the Global In- novation 1000, this year Strategy&, PwC’s strategy consulting business, identified the 1,000 public companies around the world that spent the most on R&D during the last fiscal year, as of June 30, 2016. To be included, companies had to make their R&D spending numbers public. Subsidiar- ies that were more than 50 percent owned by a single corporate parent during the period were excluded if their financial results were included in the parent company’s financials. The Global Innovation 1000 com- panies collectively account for 40 percent of the world’s R&D spending, from all sources, including corporate and government sources. In 2013, Strategy& made some adjustments to the data collection process in order to gain a more accurate and complete picture of innovation spending. In prior years, both capitalized and amortized R&D expenditures were excluded. Starting in 2013, we included the most recent fiscal year’s amortization of capital- ized R&D expenditures for relevant companies in calculating the total R&D investment, while continuing to exclude any non-amortized capital- ized costs. We have now applied this methodology to all previous years’ data; as a result, historical data referenced in the studies from 2014 onward will not always align with previously published figures for the 2005 through 2012 studies. For each of the top 1,000 com- panies, we obtained from Bloomberg and Capital IQ the key financial met- rics for 2011 through 2016, including sales, gross profit, operating profit, net profit, historical R&D expendi- tures, and market capitalization. All sales and R&D expenditure figures in foreign currencies were converted into U.S. dollars according to an average of the exchange rate over the relevant period; for data on share prices, we used the exchange rate on the last day of the period. All companies were coded into one of nine industry sectors (or “other”) according to Bloomberg’s industry designations, and into one of five regional designations, as deter- mined by their reported headquarters locations. To enable meaningful com- parisons across industries, the R&D spending levels and financial perfor- mance metrics of each company were indexed against the average values in its own industry. Finally, to understand the ways in which global R&D is and will be con- ducted at companies across multiple industries, Strategy& conducted an online survey of 466 innovation lead- ers around the world. The companies participating represented more than US$91 billion in R&D spending, or 13.5 percent of this year’s total Global Innovation 1000 R&D spending, all nine of the industry sectors, and all five geographic regions. Methodology featureinnovation 15
  • 17.
    featurestitleofthearticle 16 Resources Marc Andreessen, “WhySoftware Is Eating the World,” Wall Street Journal, Aug. 20, 2011: The Netscape founder and venture capitalist presciently explains why more major businesses and industries are being run on software and delivered as online services. Carl Benedikt Frey and Michael A. Osborne, “The Future of Employment: How Susceptible Are Jobs to Computerisation?” Oxford Martin School Working Paper, Sept. 17, 2013: Describes which jobs are most likely to be made obsolete by digitization. Reinhard Giessbauer, Jesper Vedsø, and Stefan Schauf, “A Strategist’s Guide to Industry 4.0,” s+b, May 9, 2016: The next step in the evolution of industry will be for companies to integrate operations into a seamless digital whole. Daniel Gross, “Siemens CEO Joe Kaeser on the Next Industrial Revolu- tion,” s+b, Feb. 9, 2016: The head of the German industrial giant describes how it is using software, sensors, and savvy to create a 21st-century digital manufacturer. Links to all previous Global Innovation 1000 studies from 2005 to 2015, as well as videos, infographics, and other articles: strategyand.pwc.com/ innovation1000. Strategy&’s Innovation Strategy Profiler allows you to evaluate your com- pany’s R&D strategy and the capabilities it requires: strategyand.pwc .com/global/home/what_we_do/services/innovation/thought-leadership/ innovation-strategy-profiler. More thought leadership on this topic:  strategy-business.com/innovation service offerings, which turn around much more quick- ly than traditional products. Leaders also need to monitor a broader competitive environment closely to assess the ways the rise of soft- ware and services is affecting their core businesses and their industry. Are any of your product or service of- ferings at risk as software becomes more powerful and pervasive, and as it enables new kinds of service offer- ings that better meet changing customer expectations? One useful exercise is to think through how a software startup might go about disrupting your business. Is one of your offerings, your company, or even your entire industry a potential victim of disruption from a new entrant with an innovative software- or services-driven business model? On the positive side, software and services offer fertile ground for reimagining your value proposition and the business model that supports it in creative ways. As in the case of many of the companies cited in this article, increasing R&D in software and services can enable you to meet or anticipate your customers’ needs (and add new streams of revenue) in ways that weren’t imaginable just a few years ago, as well as creating greater stickiness with established customers. The reason that the fastest adopters of software and service offerings are outperforming others is simple: They are simultaneously embracing the massive chang- es that digitization is enabling in product capabilities and usability and responding to rising customer expec- tations. The embrace and the response are symbiotic, each creating opportunities and pressures that drive the other. Offering excellent physical products has become table stakes for competing in today’s economy. More and more, features that depend on software and the ser- vices it provides are the factors that differentiate com- panies, create competitive advantage, and launch new revenue streams. + Reprint No. 16409 1000 featureinnovation 16
  • 18.
    strategy+business magazine is publishedby certain member firms of the PwC network. To subscribe, visit strategy-business.com or call 1-855-869-4862. • strategy-business.com • facebook.com/strategybusiness • linkedin.com/company/strategy-business • twitter.com/stratandbiz Articles published in strategy+business do not necessarily represent the views of the member firms of the PwC network. Reviews and mentions of publications, products, or services do not constitute endorsement or recommendation for purchase. © 2016 PwC. All rights reserved. PwC refers to the PwC network and/or one or more of its member firms, each of which is a separate legal entity. Please see www.pwc.com/structure for further details. Mentions of Strategy& refer to the global team of practical strategists that is integrated within the PwC network of firms. For more about Strategy&, see www.strategyand.pwc.com. No reproduction is permitted in whole or part without written permission of PwC. “strategy+business” is a trademark of PwC.