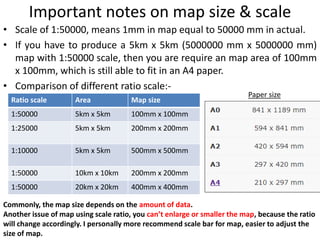
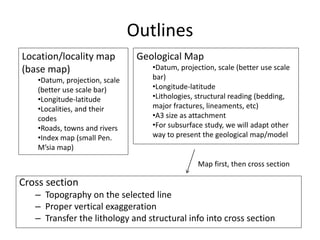
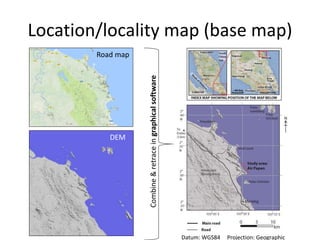
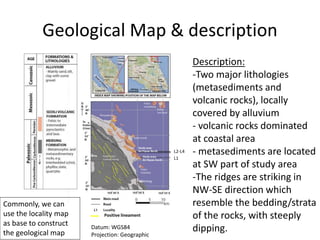
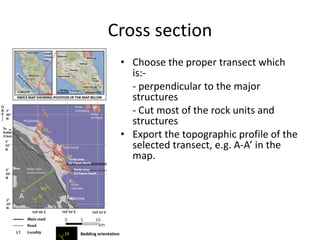
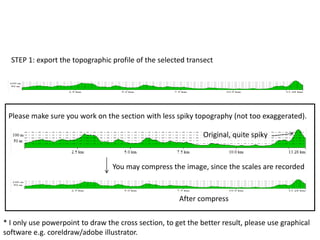
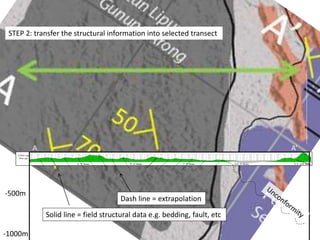
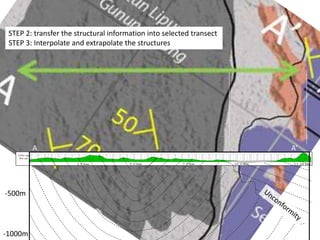
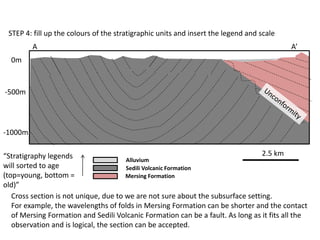
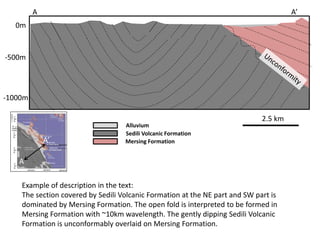
FYP II:
Map and cross section
2023-Sept semester
Important notes on map size & scale
• Scale of 1:50000, means 1mm in map equal to 50000 mm in actual.
• If you have to produce a 5km x 5km (5000000 mm x 5000000 mm)
map with 1:50000 scale, then you are require an map area of 100mm
x 100mm, which is still able to fit in an A4 paper.
• Comparison of different ratio scale:-
Ratio scale Area Map size
1:50000 5km x 5km 100mm x 100mm
1:25000 5km x 5km 200mm x 200mm
1:10000 5km x 5km 500mm x 500mm
1:50000 10km x 10km 200mm x 200mm
1:50000 20km x 20km 400mm x 400mm
Paper size
Commonly, the map size depends on the amount of data.
Another issue of map using scale ratio, you can’t enlarge or smaller the map, because the ratio
will change accordingly. I personally more recommend scale bar for map, easier to adjust the
size of map.
Outlines
Cross section
– Topography on the selected line
– Proper vertical exaggeration
– Transfer the lithology and structural info into cross section
Geological Map
•Datum, projection, scale (better use scale
bar)
•Longitude-latitude
•Lithologies, structural reading (bedding,
major fractures, lineaments, etc)
•A3 size as attachment
•For subsurface study, we will adapt other
way to present the geological map/model
Location/locality map
(base map)
•Datum, projection, scale
(better use scale bar)
•Longitude-latitude
•Localities, and their
codes
•Roads, towns and rivers
•Index map (small Pen.
M’sia map)
Map first, then cross section
Location/locality map (base map)
Road map
DEM
Combine
&
retrace
in
graphical
software
Datum: WGS84 Projection: Geographic
Geological Map & description
Description:
-Two major lithologies
(metasediments and
volcanic rocks), locally
covered by alluvium
- volcanic rocks dominated
at coastal area
- metasediments are located
at SW part of study area
-The ridges are striking in
NW-SE direction which
resemble the bedding/strata
of the rocks, with steeply
dipping.
L1
L2-L4
Datum: WGS84
Projection: Geographic
Positive lineament
Commonly, we can
use the locality map
as base to construct
the geological map
Cross section
• Choose the proper transect which
is:-
- perpendicular to the major
structures
- Cut most of the rock units and
structures
• Export the topographic profile of the
selected transect, e.g. A-A’ in the
map.
A
A’
70
50
20
10
10 Bedding orientation
STEP 1: export the topographic profile of the selected transect
Please make sure you work on the section with less spiky topography (not too exaggerated).
You may compress the image, since the scales are recorded
Original, quite spiky
After compress
* I only use powerpoint to draw the cross section, to get the better result, please use graphical
software e.g. coreldraw/adobe illustrator.
STEP 2: transfer the structural information into selected transect
-500m
-1000m
A A’
Solid line = field structural data e.g. bedding, fault, etc
Dash line = extrapolation
STEP 2: transfer the structural information into selected transect
STEP 3: Interpolate and extrapolate the structures
-500m
-1000m
A A’
STEP 4: fill up the colours of the stratigraphic units and insert the legend and scale
-500m
-1000m
A A’
Alluvium
Sedili Volcanic Formation
Mersing Formation
2.5 km
“Stratigraphy legends
will sorted to age
(top=young, bottom =
old)”
Cross section is not unique, due to we are not sure about the subsurface setting.
For example, the wavelengths of folds in Mersing Formation can be shorter and the contact
of Mersing Formation and Sedili Volcanic Formation can be a fault. As long as it fits all the
observation and is logical, the section can be accepted.
0m
-500m
-1000m
A A’
Alluvium
Sedili Volcanic Formation
Mersing Formation
2.5 km
A
A’
Example of description in the text:
The section covered by Sedili Volcanic Formation at the NE part and SW part is
dominated by Mersing Formation. The open fold is interpreted to be formed in
Mersing Formation with ~10km wavelength. The gently dipping Sedili Volcanic
Formation is unconformably overlaid on Mersing Formation.
0m

FYP II- map n cross section.pptx

  • 1.
    FYP II: Map andcross section 2023-Sept semester
  • 2.
    Important notes onmap size & scale • Scale of 1:50000, means 1mm in map equal to 50000 mm in actual. • If you have to produce a 5km x 5km (5000000 mm x 5000000 mm) map with 1:50000 scale, then you are require an map area of 100mm x 100mm, which is still able to fit in an A4 paper. • Comparison of different ratio scale:- Ratio scale Area Map size 1:50000 5km x 5km 100mm x 100mm 1:25000 5km x 5km 200mm x 200mm 1:10000 5km x 5km 500mm x 500mm 1:50000 10km x 10km 200mm x 200mm 1:50000 20km x 20km 400mm x 400mm Paper size Commonly, the map size depends on the amount of data. Another issue of map using scale ratio, you can’t enlarge or smaller the map, because the ratio will change accordingly. I personally more recommend scale bar for map, easier to adjust the size of map.
  • 3.
    Outlines Cross section – Topographyon the selected line – Proper vertical exaggeration – Transfer the lithology and structural info into cross section Geological Map •Datum, projection, scale (better use scale bar) •Longitude-latitude •Lithologies, structural reading (bedding, major fractures, lineaments, etc) •A3 size as attachment •For subsurface study, we will adapt other way to present the geological map/model Location/locality map (base map) •Datum, projection, scale (better use scale bar) •Longitude-latitude •Localities, and their codes •Roads, towns and rivers •Index map (small Pen. M’sia map) Map first, then cross section
  • 4.
    Location/locality map (basemap) Road map DEM Combine & retrace in graphical software Datum: WGS84 Projection: Geographic
  • 5.
    Geological Map &description Description: -Two major lithologies (metasediments and volcanic rocks), locally covered by alluvium - volcanic rocks dominated at coastal area - metasediments are located at SW part of study area -The ridges are striking in NW-SE direction which resemble the bedding/strata of the rocks, with steeply dipping. L1 L2-L4 Datum: WGS84 Projection: Geographic Positive lineament Commonly, we can use the locality map as base to construct the geological map
  • 6.
    Cross section • Choosethe proper transect which is:- - perpendicular to the major structures - Cut most of the rock units and structures • Export the topographic profile of the selected transect, e.g. A-A’ in the map. A A’ 70 50 20 10 10 Bedding orientation
  • 7.
    STEP 1: exportthe topographic profile of the selected transect Please make sure you work on the section with less spiky topography (not too exaggerated). You may compress the image, since the scales are recorded Original, quite spiky After compress * I only use powerpoint to draw the cross section, to get the better result, please use graphical software e.g. coreldraw/adobe illustrator.
  • 8.
    STEP 2: transferthe structural information into selected transect -500m -1000m A A’ Solid line = field structural data e.g. bedding, fault, etc Dash line = extrapolation
  • 9.
    STEP 2: transferthe structural information into selected transect STEP 3: Interpolate and extrapolate the structures -500m -1000m A A’
  • 10.
    STEP 4: fillup the colours of the stratigraphic units and insert the legend and scale -500m -1000m A A’ Alluvium Sedili Volcanic Formation Mersing Formation 2.5 km “Stratigraphy legends will sorted to age (top=young, bottom = old)” Cross section is not unique, due to we are not sure about the subsurface setting. For example, the wavelengths of folds in Mersing Formation can be shorter and the contact of Mersing Formation and Sedili Volcanic Formation can be a fault. As long as it fits all the observation and is logical, the section can be accepted. 0m
  • 11.
    -500m -1000m A A’ Alluvium Sedili VolcanicFormation Mersing Formation 2.5 km A A’ Example of description in the text: The section covered by Sedili Volcanic Formation at the NE part and SW part is dominated by Mersing Formation. The open fold is interpreted to be formed in Mersing Formation with ~10km wavelength. The gently dipping Sedili Volcanic Formation is unconformably overlaid on Mersing Formation. 0m