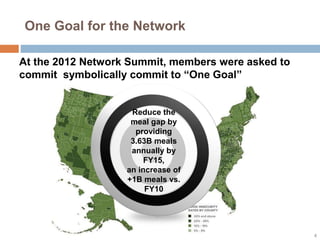
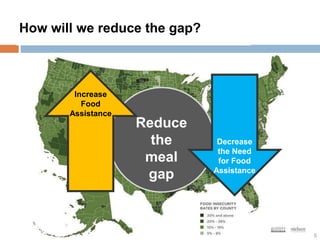
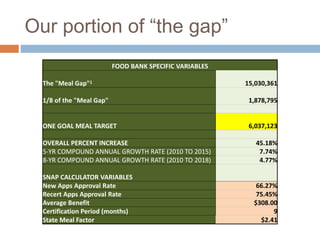
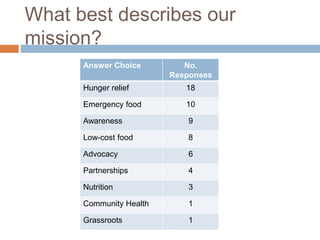
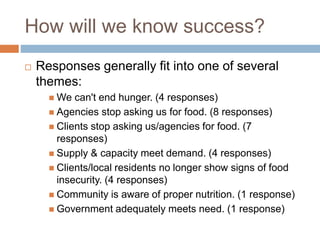
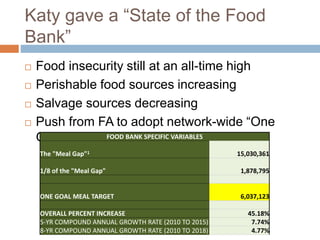
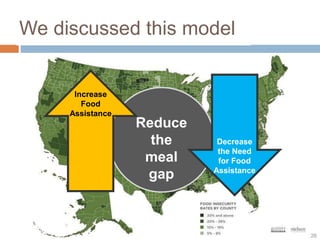
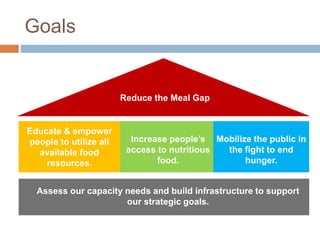
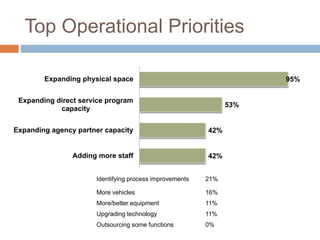
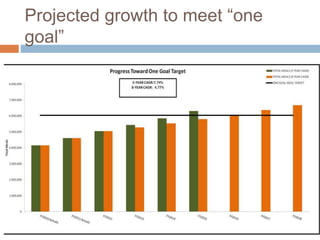
The document provides details on a food bank's strategic plan, including an analysis of its strengths, weaknesses, opportunities, and threats. It discusses the organization committing to a goal of reducing the meal gap in its service area by 45% by 2015. Staff and partners identified priorities like expanding programs and physical space to meet this goal. The food bank will need to balance strategies like increasing food assistance and decreasing demand to successfully achieve its mission of alleviating hunger.


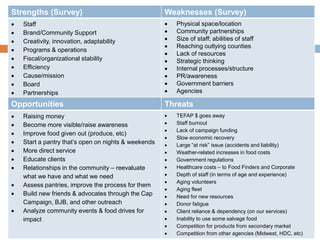
![SWOT: Strengths
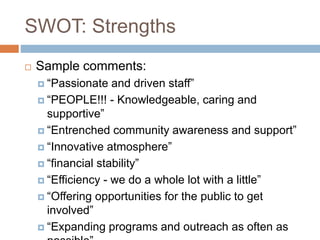
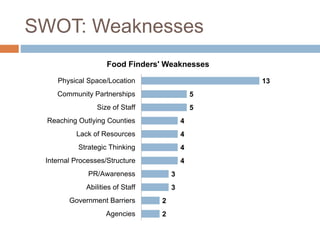
Sample comments:
“Location, location, location!”
“Lack of warehouse space”
“Small staff”
“No ‘heavy hitters’ [involved in work]”
“Flightiness - at times we seem to be jumping
from one project to another without full resolution”
“Communication between departments”
“low participation and input from outlying
counties”
“Relationships with Food Pantries & Soup
Kitchens (last place after Back Pack, Summer](https://image.slidesharecdn.com/6995e445-1b45-45fe-a11a-f84014c26a26-160512174246/85/FY14-16-Strategic-Planning-PPT-UPDATED-for-second-session-15-320.jpg)


![Fy05 07 Strategic Plan[1]](https://cdn.slidesharecdn.com/ss_thumbnails/FY0507StrategicPlan1-123620566527-phpapp01-thumbnail.jpg?width=640&height=640&fit=bounds)


