Download to read offline
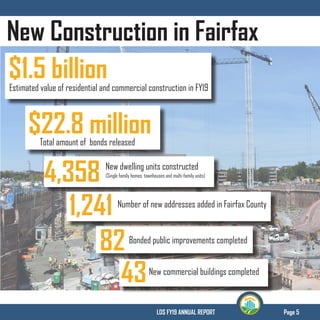
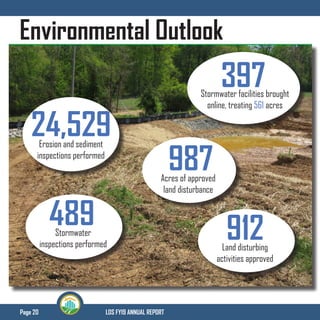
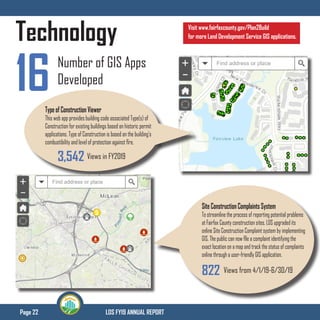

The annual report summarizes Land Development Services' (LDS) activities and accomplishments in fiscal year 2019. Key highlights include: - LDS facilitated over $1.5 billion in residential and commercial construction. Time to approval decreased for most project types such as single family homes and commercial buildings. - Over 213,000 inspections were conducted on building, sites and critical structures. Technology improvements included 16 new GIS applications and online permitting. - Environmental protection efforts included over 500 stormwater inspections and nearly 1,000 acres of approved land disturbance. Nearly 400 stormwater facilities were approved. - Moving forward, LDS will focus on partnering with industry, leveraging technology, responding to development


