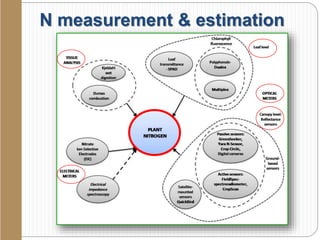
1. The document summarizes methods for measuring and estimating nitrogen (N) levels in crop canopies, including direct measurement through plant tissue testing and indirect estimation using chlorophyll meters, crop sensors, and drones.
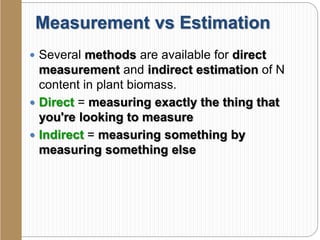
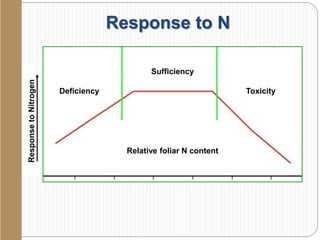
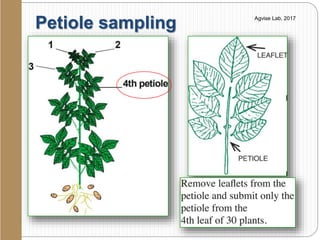
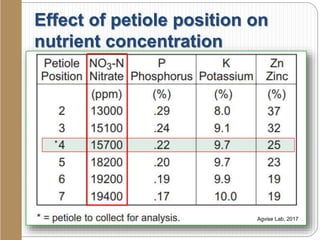
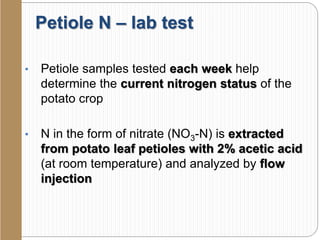
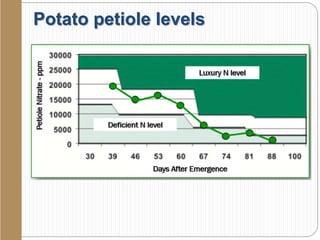
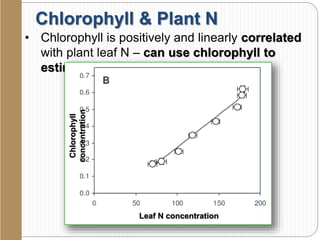
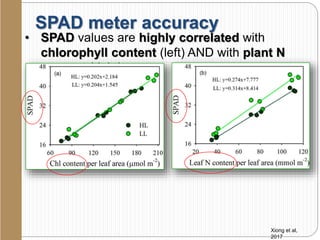
2. Direct measurement of N involves testing plant tissues like potato petioles in a lab to determine their nitrate levels, while indirect methods estimate N through relationships with chlorophyll or vegetation indices.
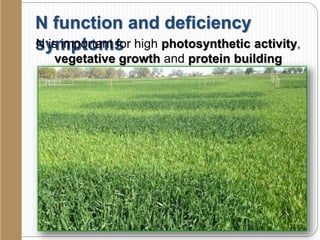
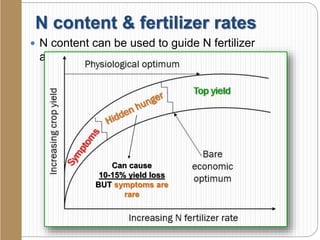
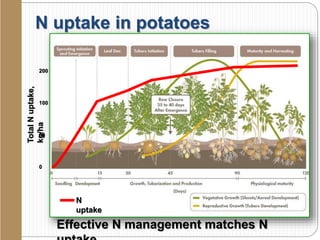
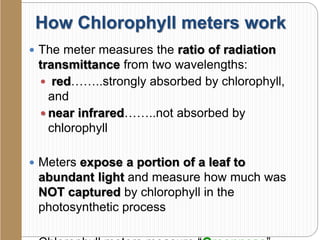
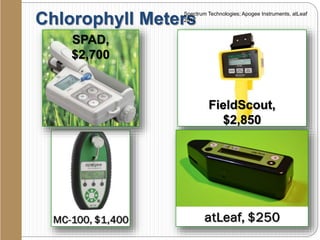
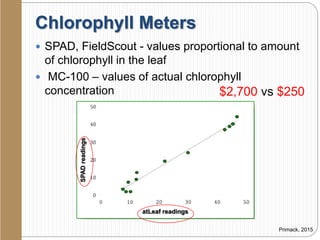
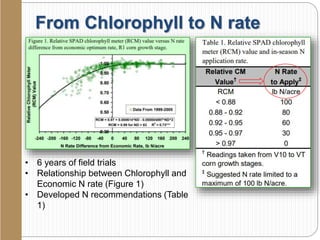
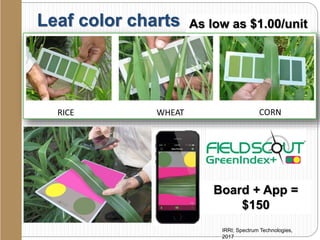
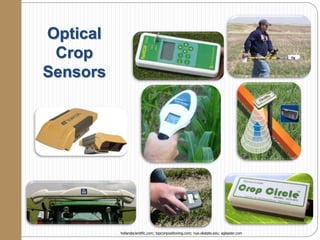
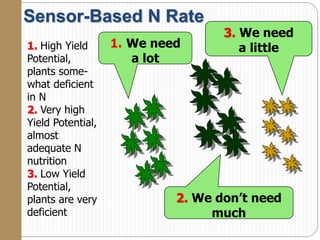
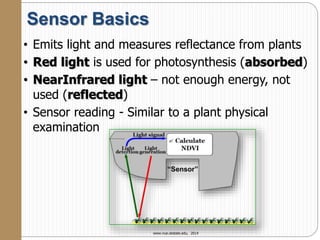
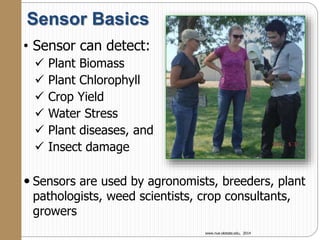
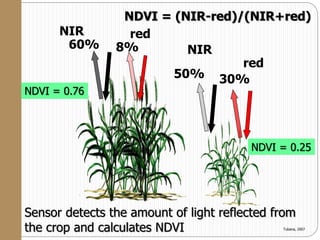
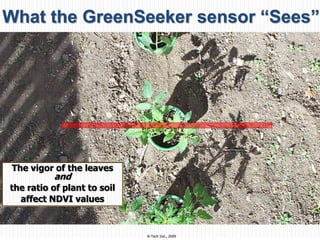
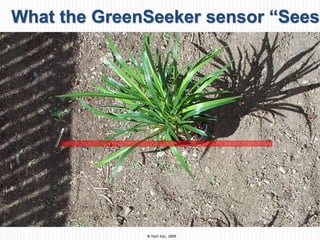
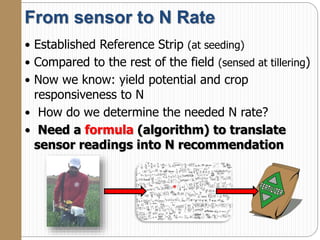
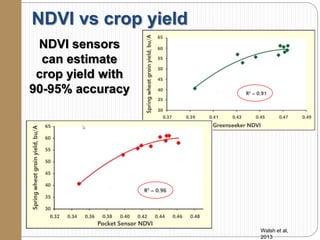
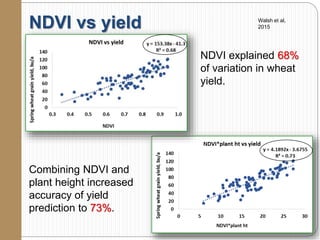
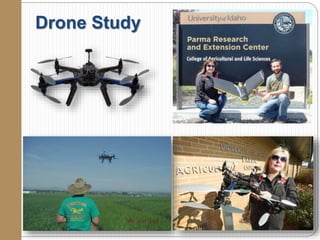
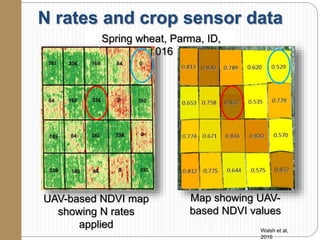
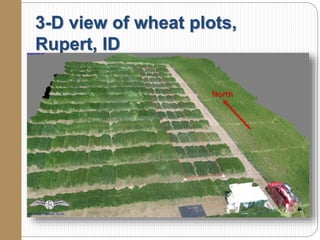
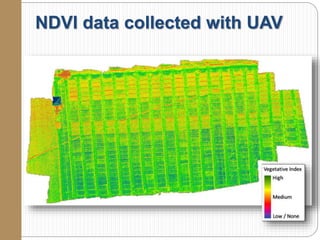
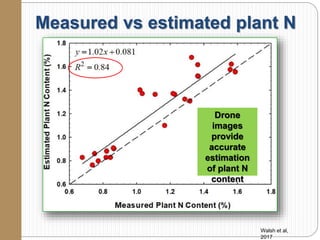
3. The presentation evaluates tools like SPAD meters, leaf color charts, optical sensors, and unmanned aerial vehicles (UAVs) that can help farmers estimate crop N levels and determine optimal nitrogen fertilization rates.