Download to read offline
![14
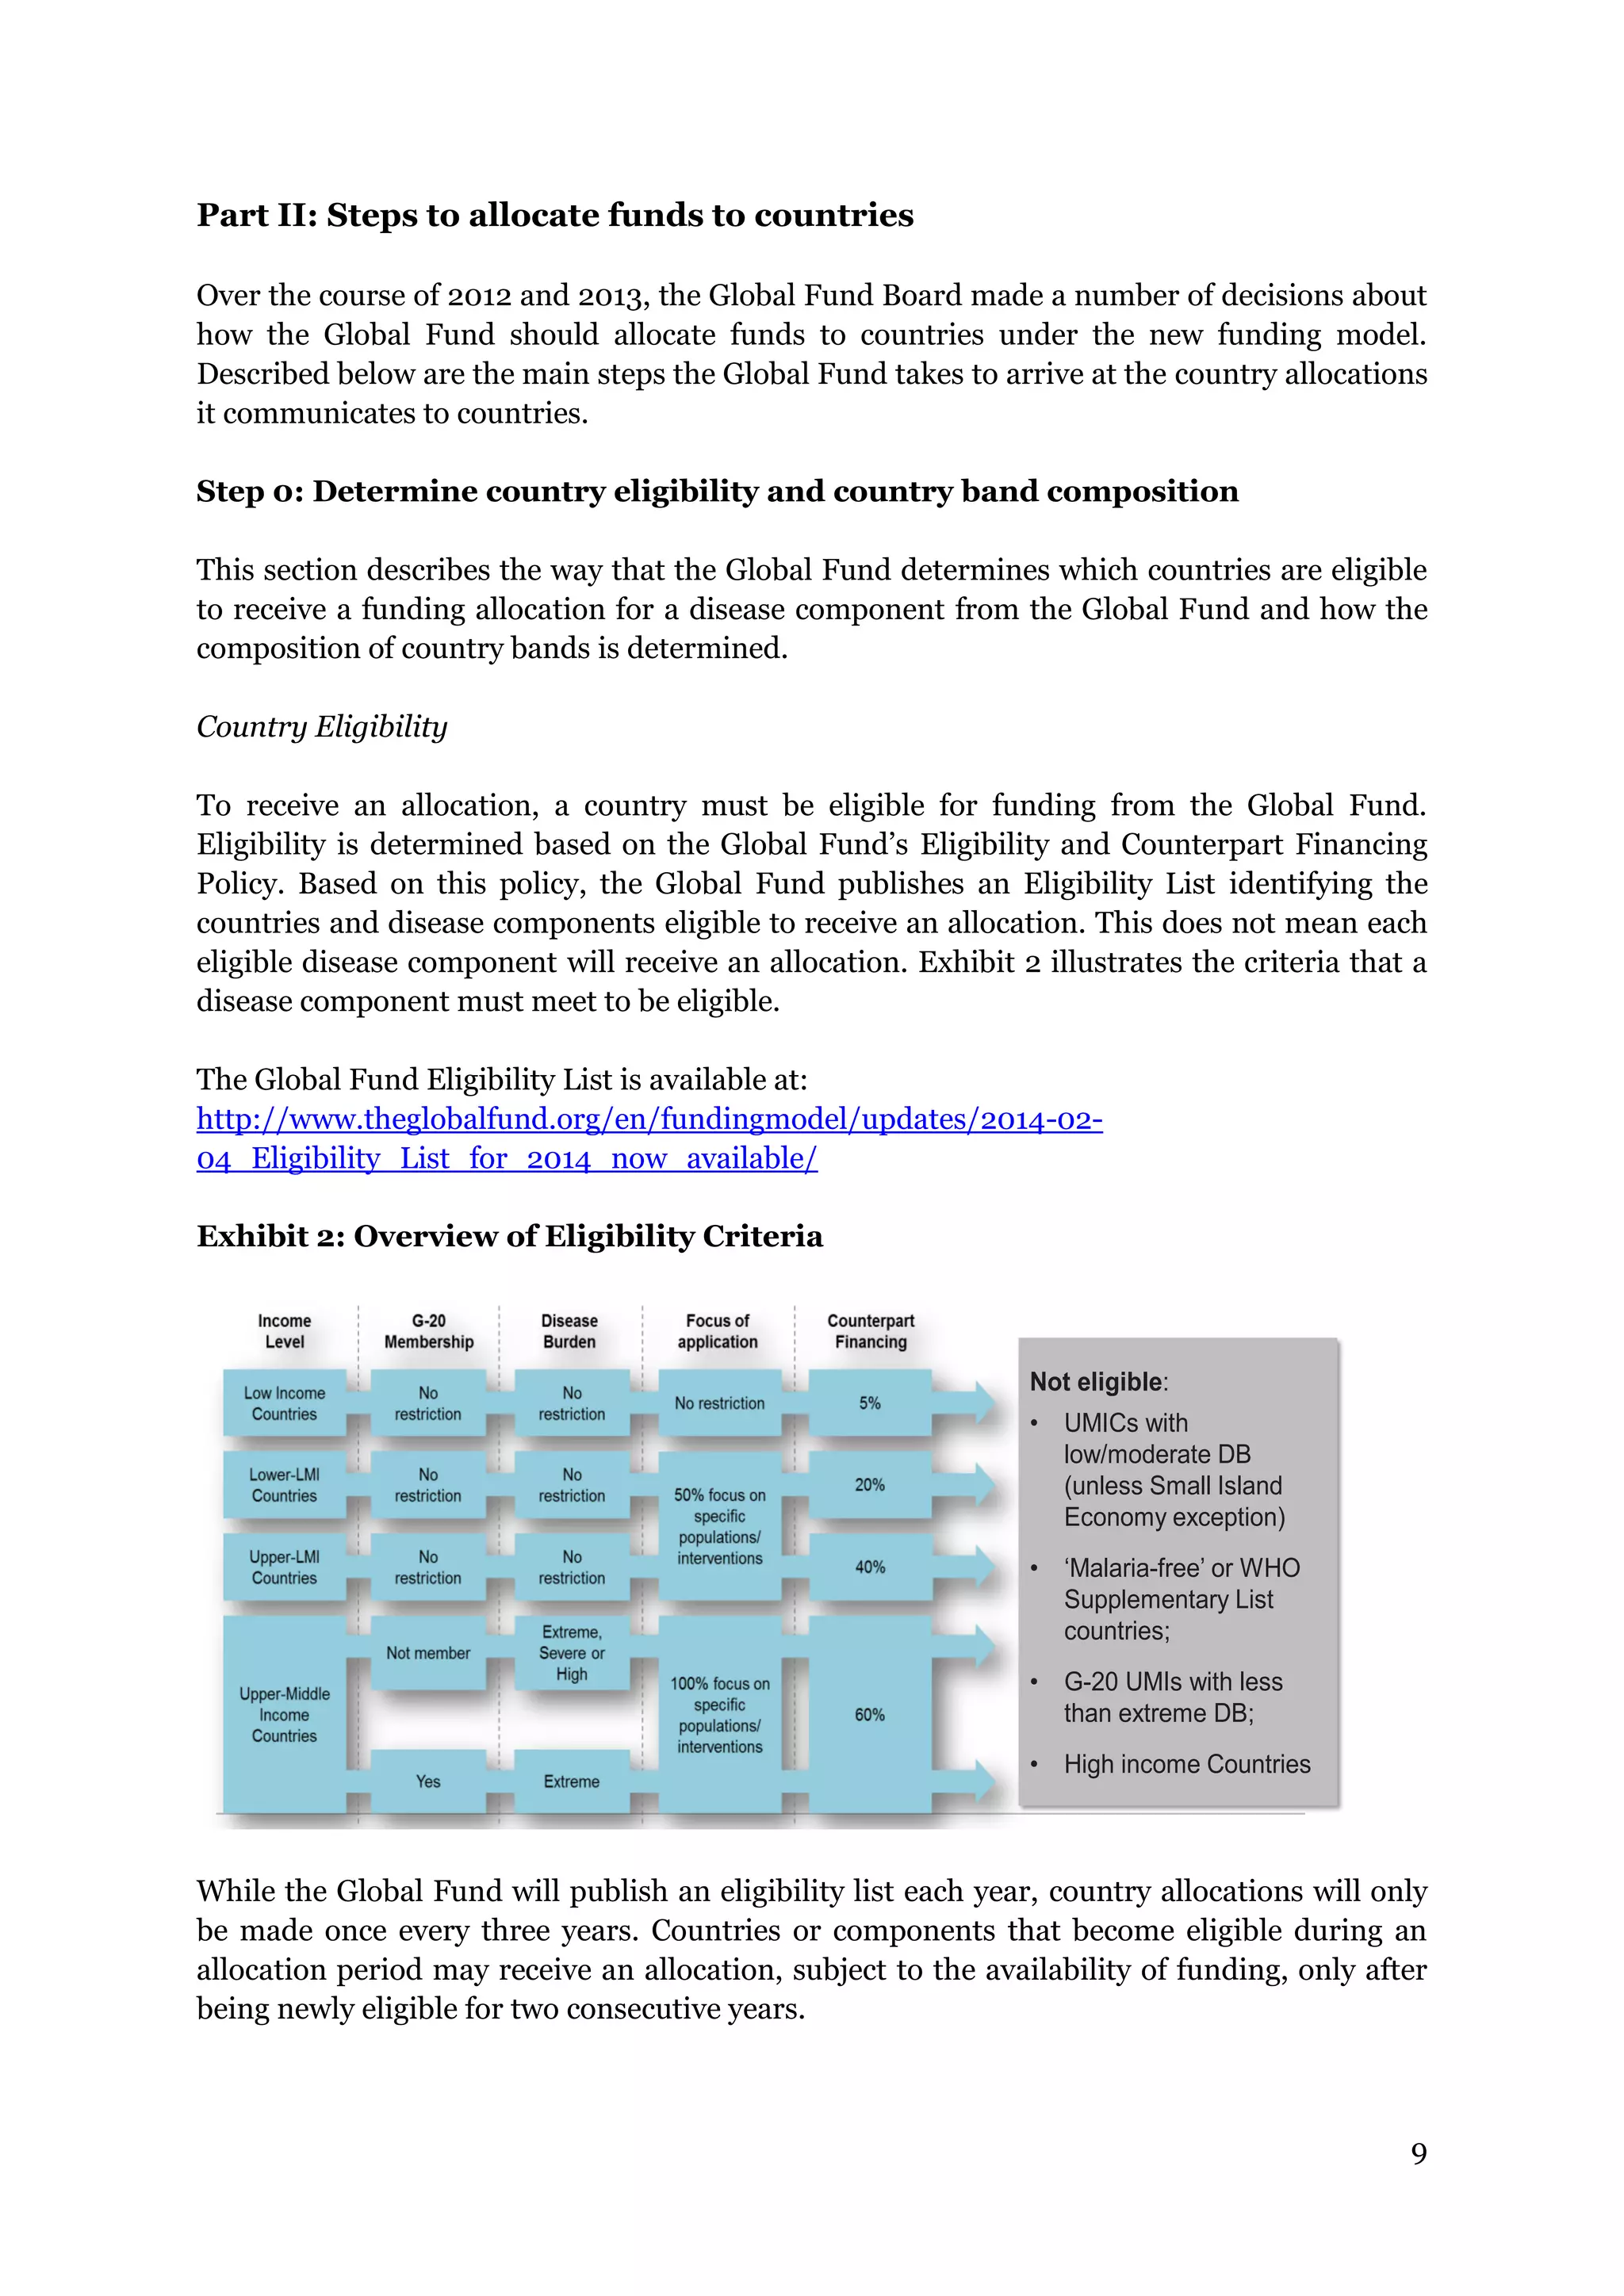
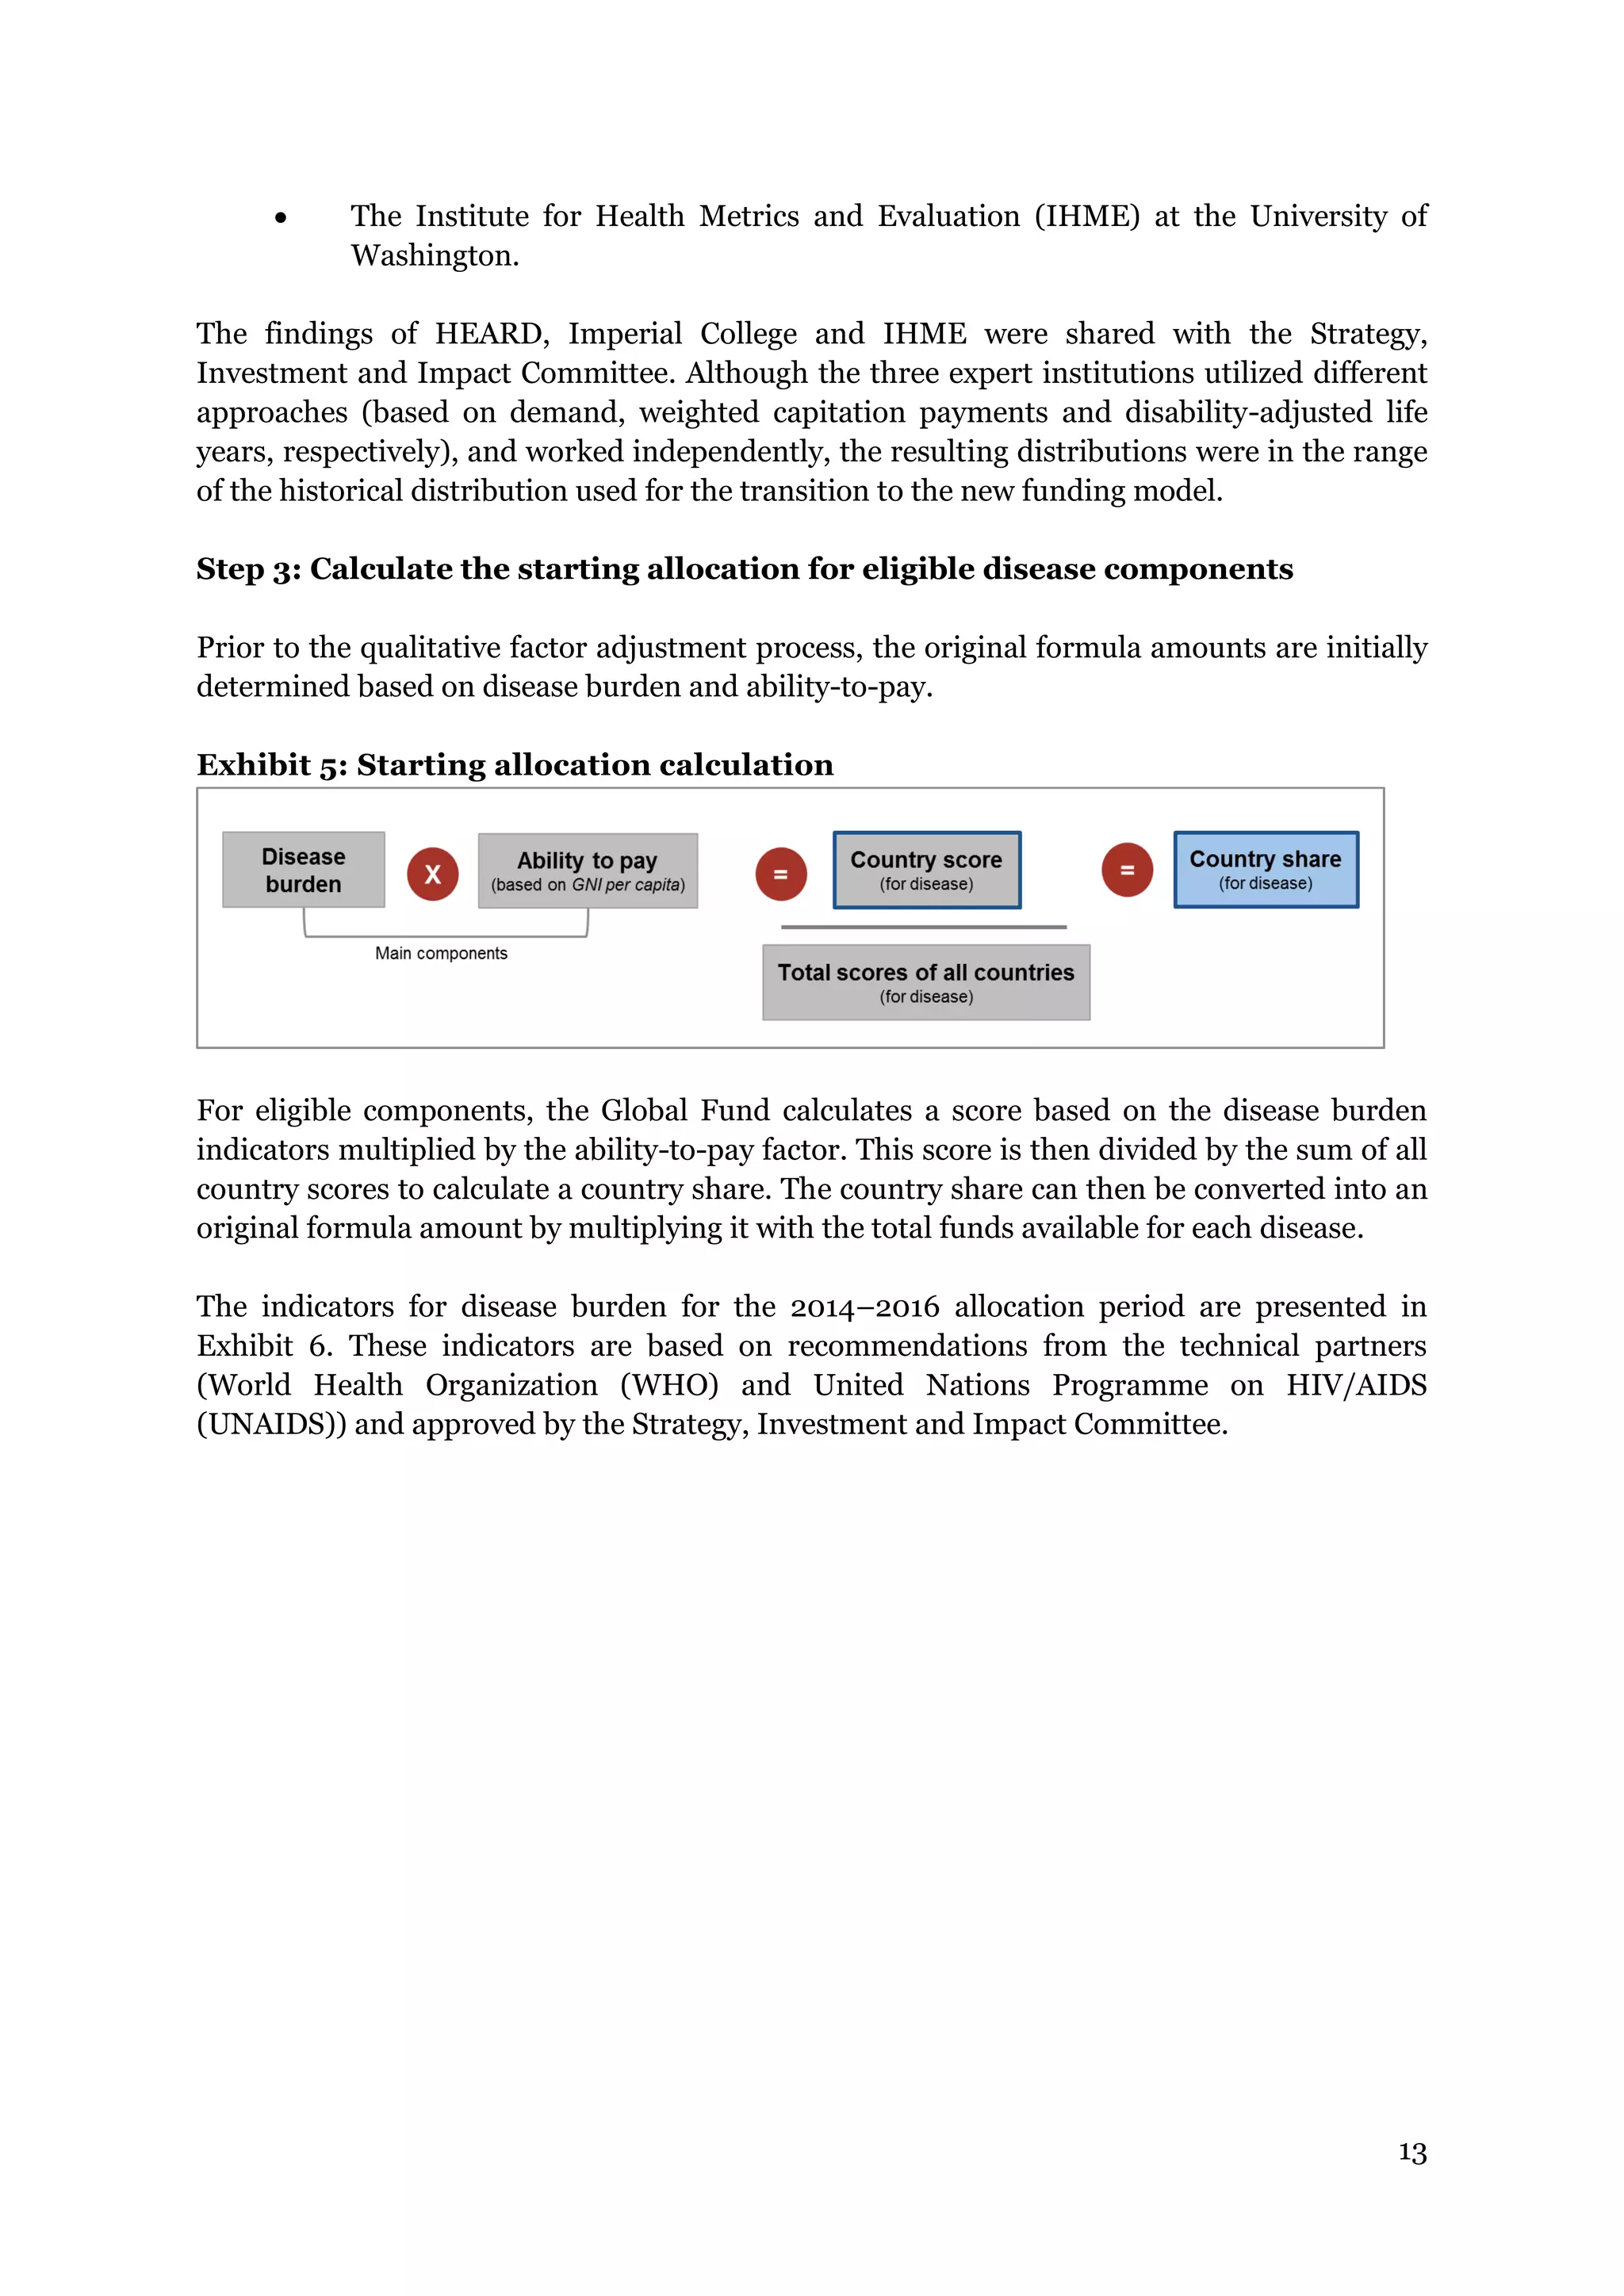
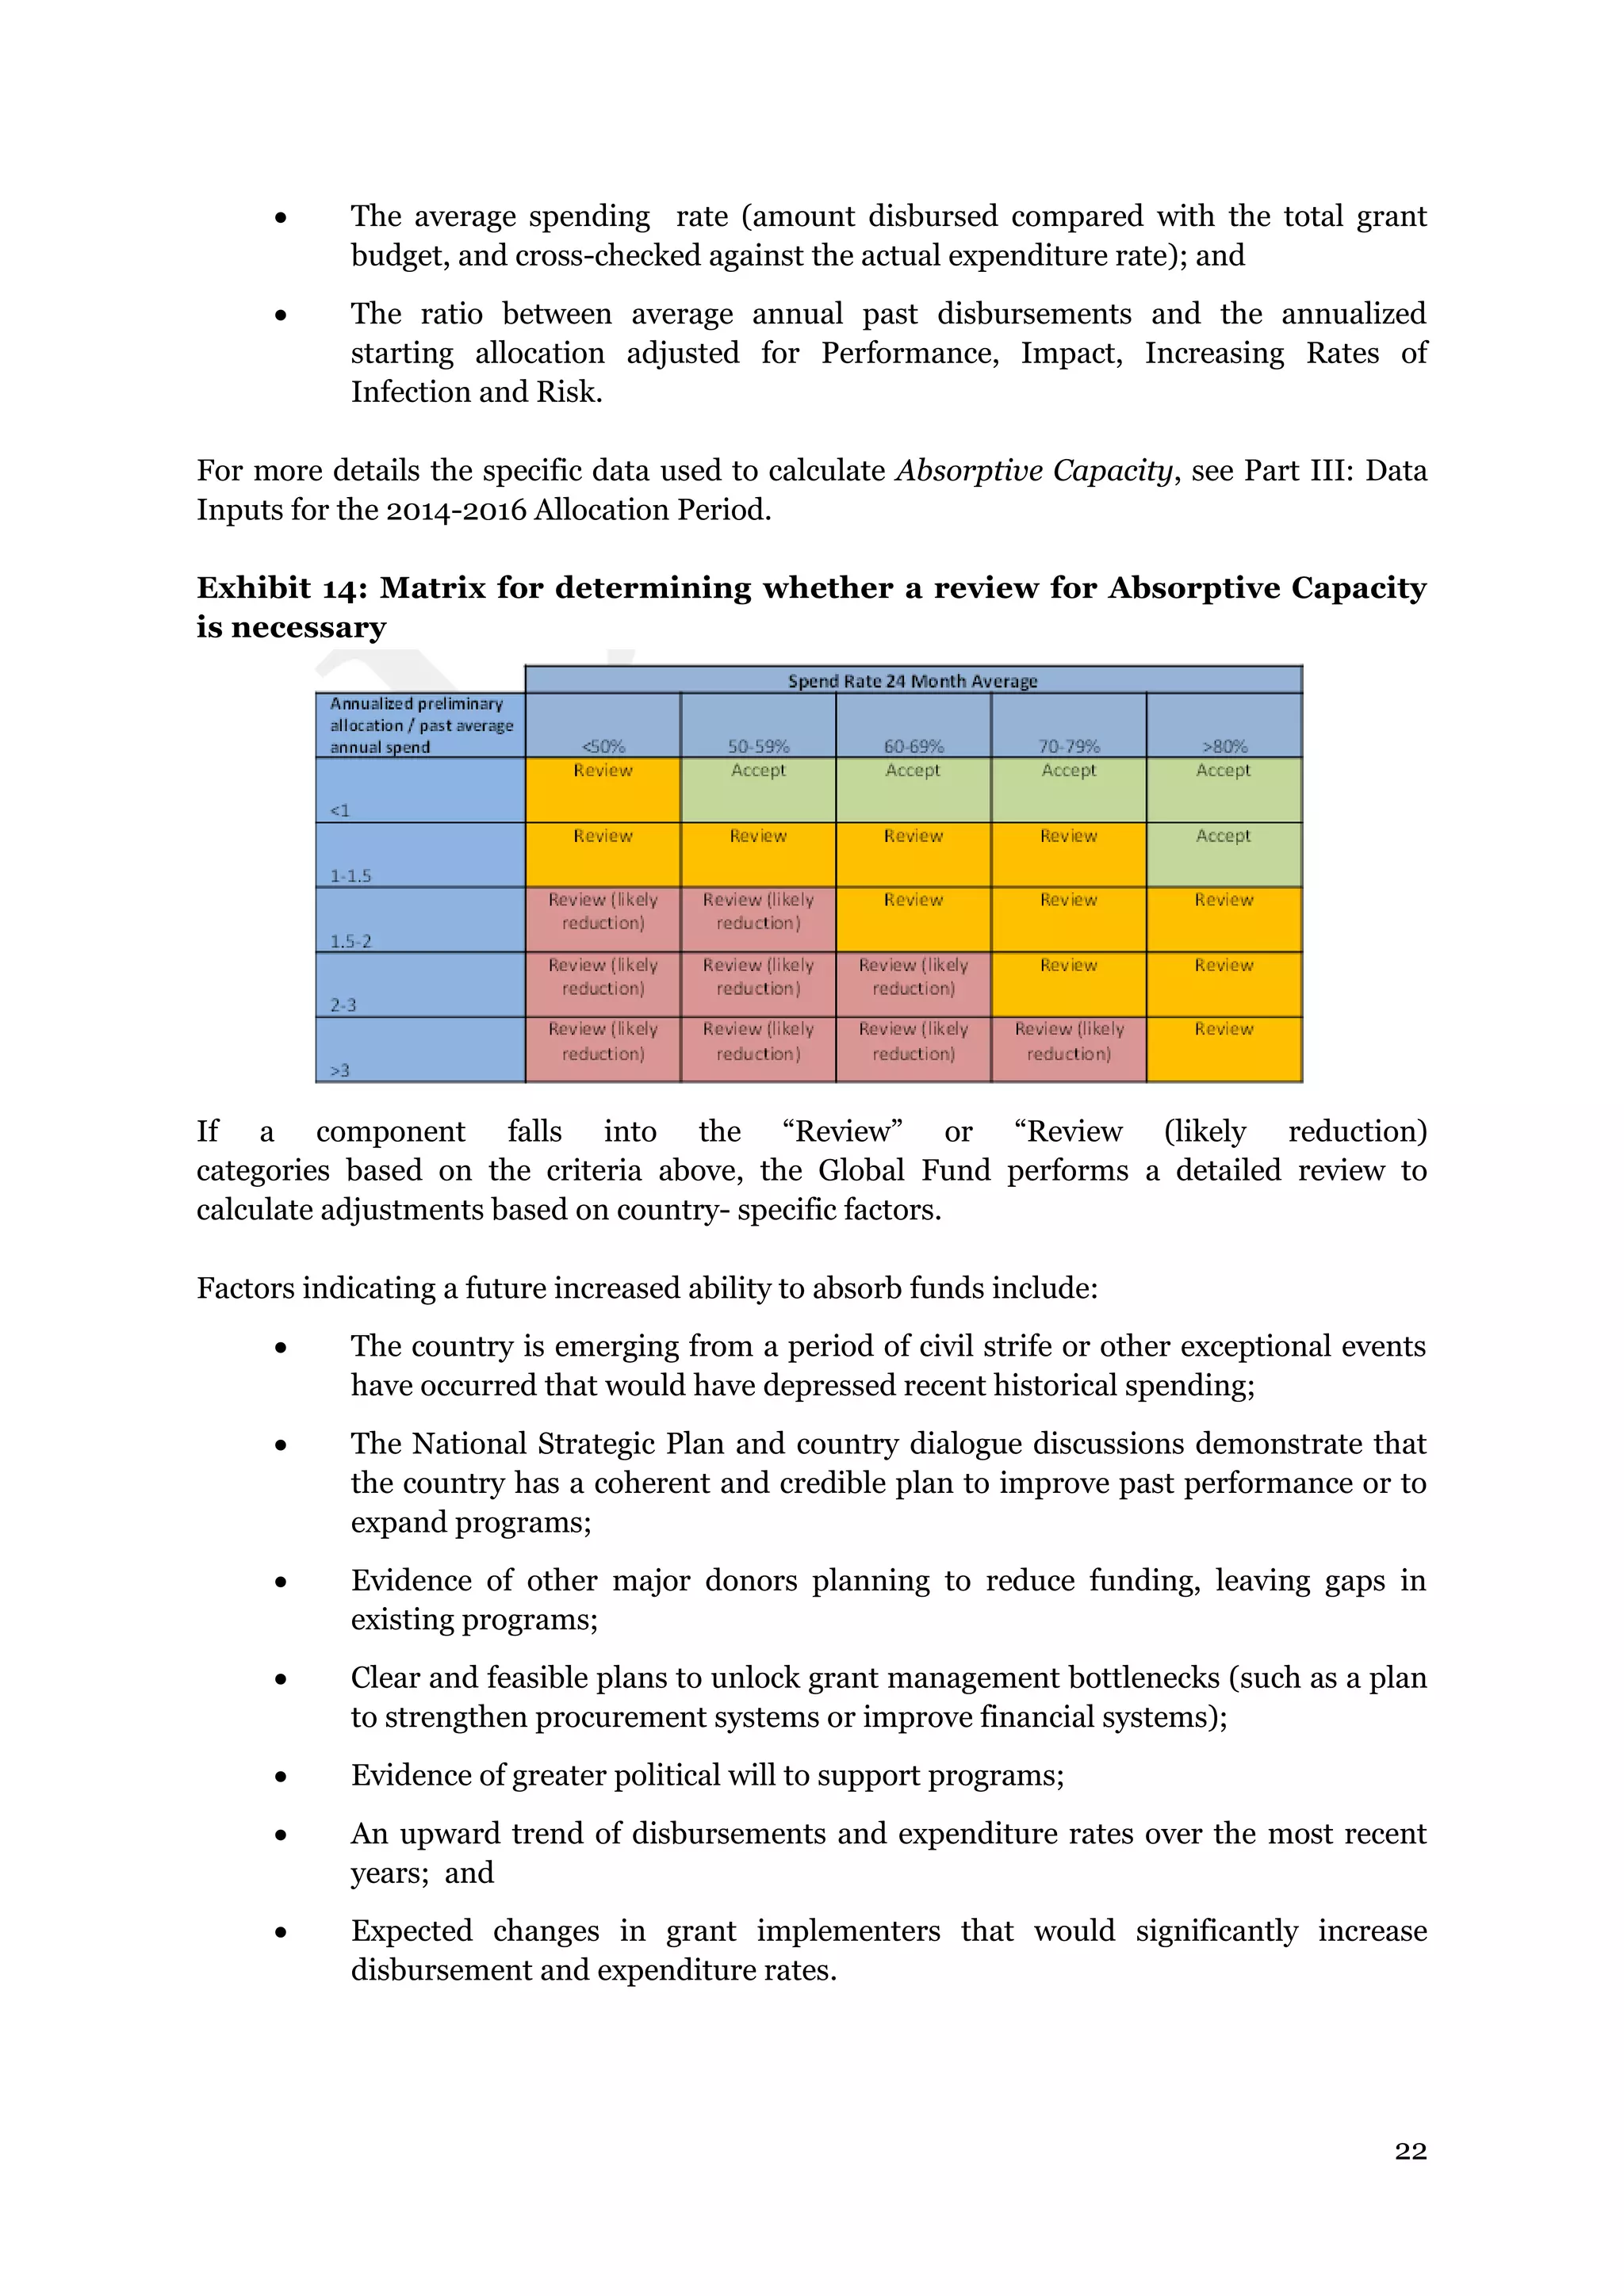
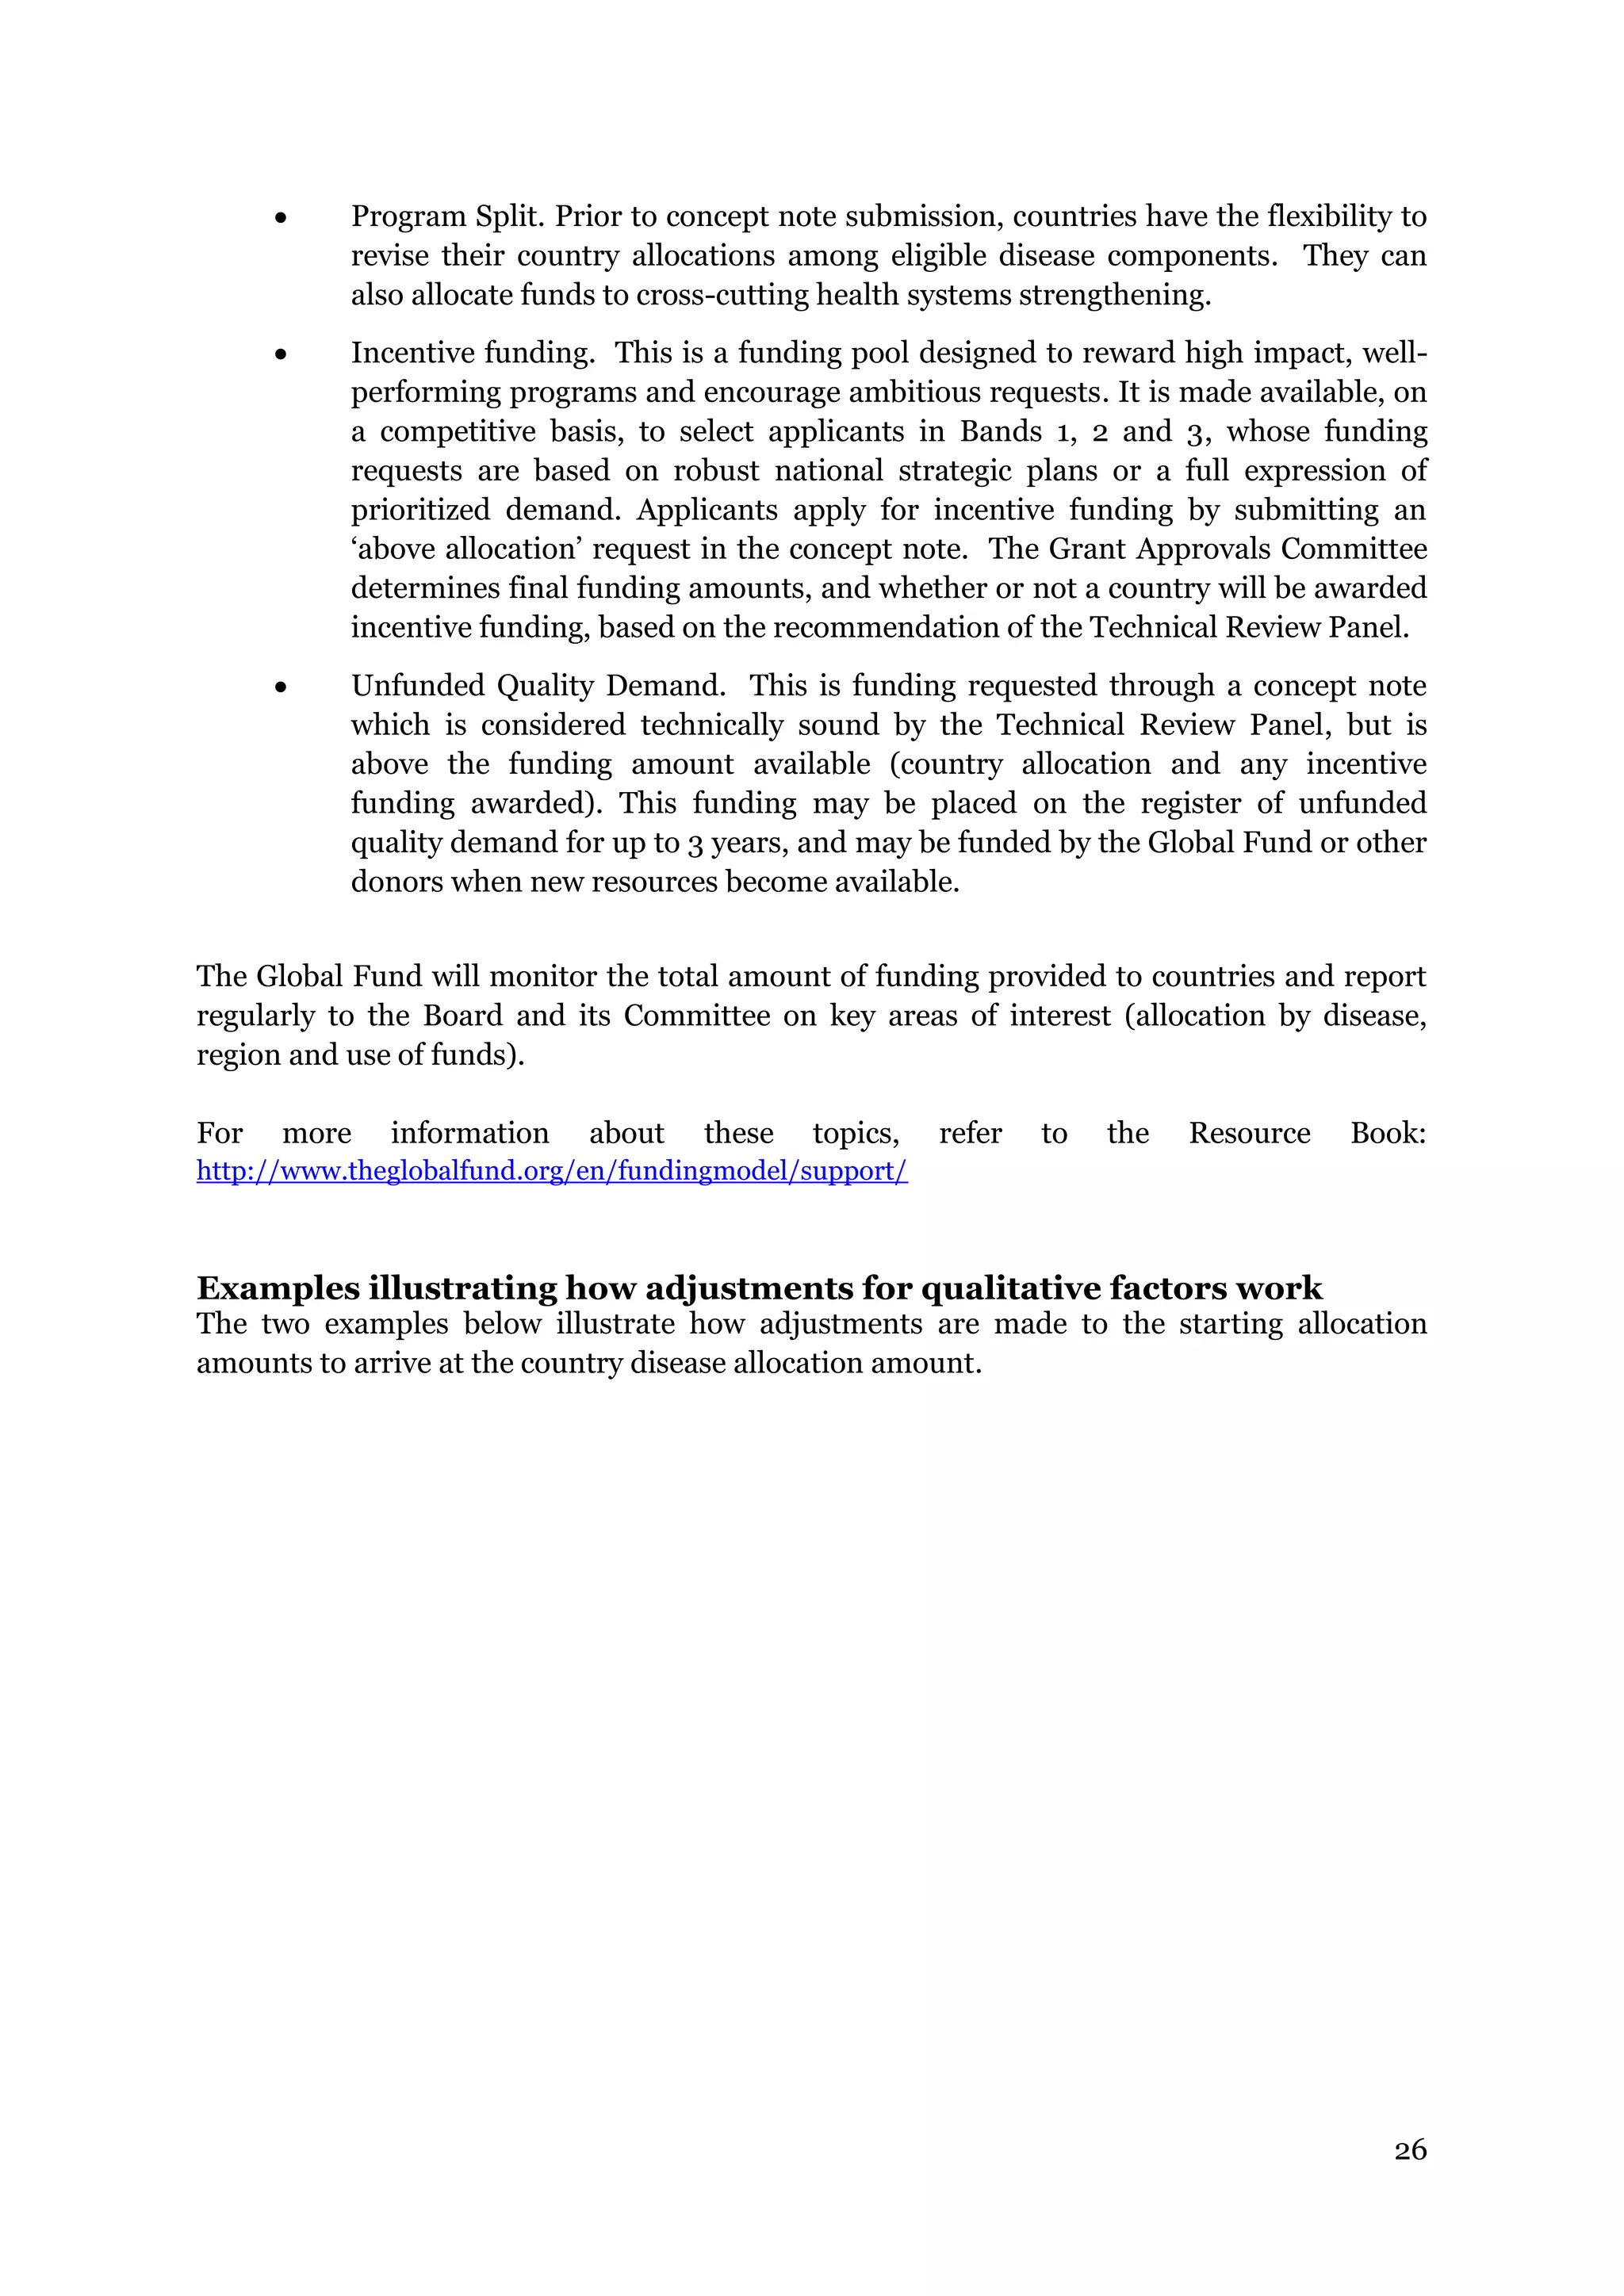
Exhibit 6: Parameters for disease burden indicators
Indicators Specifications
Estimated
HIV
burden
[People with HIV]
data from 2012 (if not available, then latest year)
Estimated
TB burden
[1 * HIV negative TB incident cases],
[1.2 * HIV positive TB incident cases],
[8 * MDR-TB incidence], and
[0.1 * 50% of estimated number of people with known HIV positive
status]
data from 2012 (if not available, then latest year)
Note: The TB indicator is based on the assumption that the entire budget
for ART for HIV positive TB patients should be included in the HIV budget;
all other TB/HIV interventions should be adequately budgeted and shared
between both programs.
Estimated
Malaria
burden
[1 * cases],
[1 * deaths],
[0.05 * incidence rate], and
[0.05 * mortality rate]
data from 2000, indicators normalized
For the 2014-2016 allocation period, the ability-to-pay factor is 0.95 for countries in the
World Bank’s low income classification; a linear decline from 0.95 at the beginning of the
lower-middle income classification to 0.4 at end of the lower-middle income classification;
and a linear decline from 0.4 at the beginning of the upper-middle income countries to 0.2 at
the end of the upper-middle income classification. These points are consistent with the
Global Fund’s Eligibility and Counterpart Financing Policy (see Exhibit 7 which shows the
ability-to-pay curve and the Global Fund’s counterpart financing thresholds).
Exhibit 7: Ability-to-pay factor](https://image.slidesharecdn.com/fundingmodeloverviewallocationmethodologyen-140610155150-phpapp01/75/Overview-allocation-methodology_en-14-2048.jpg)
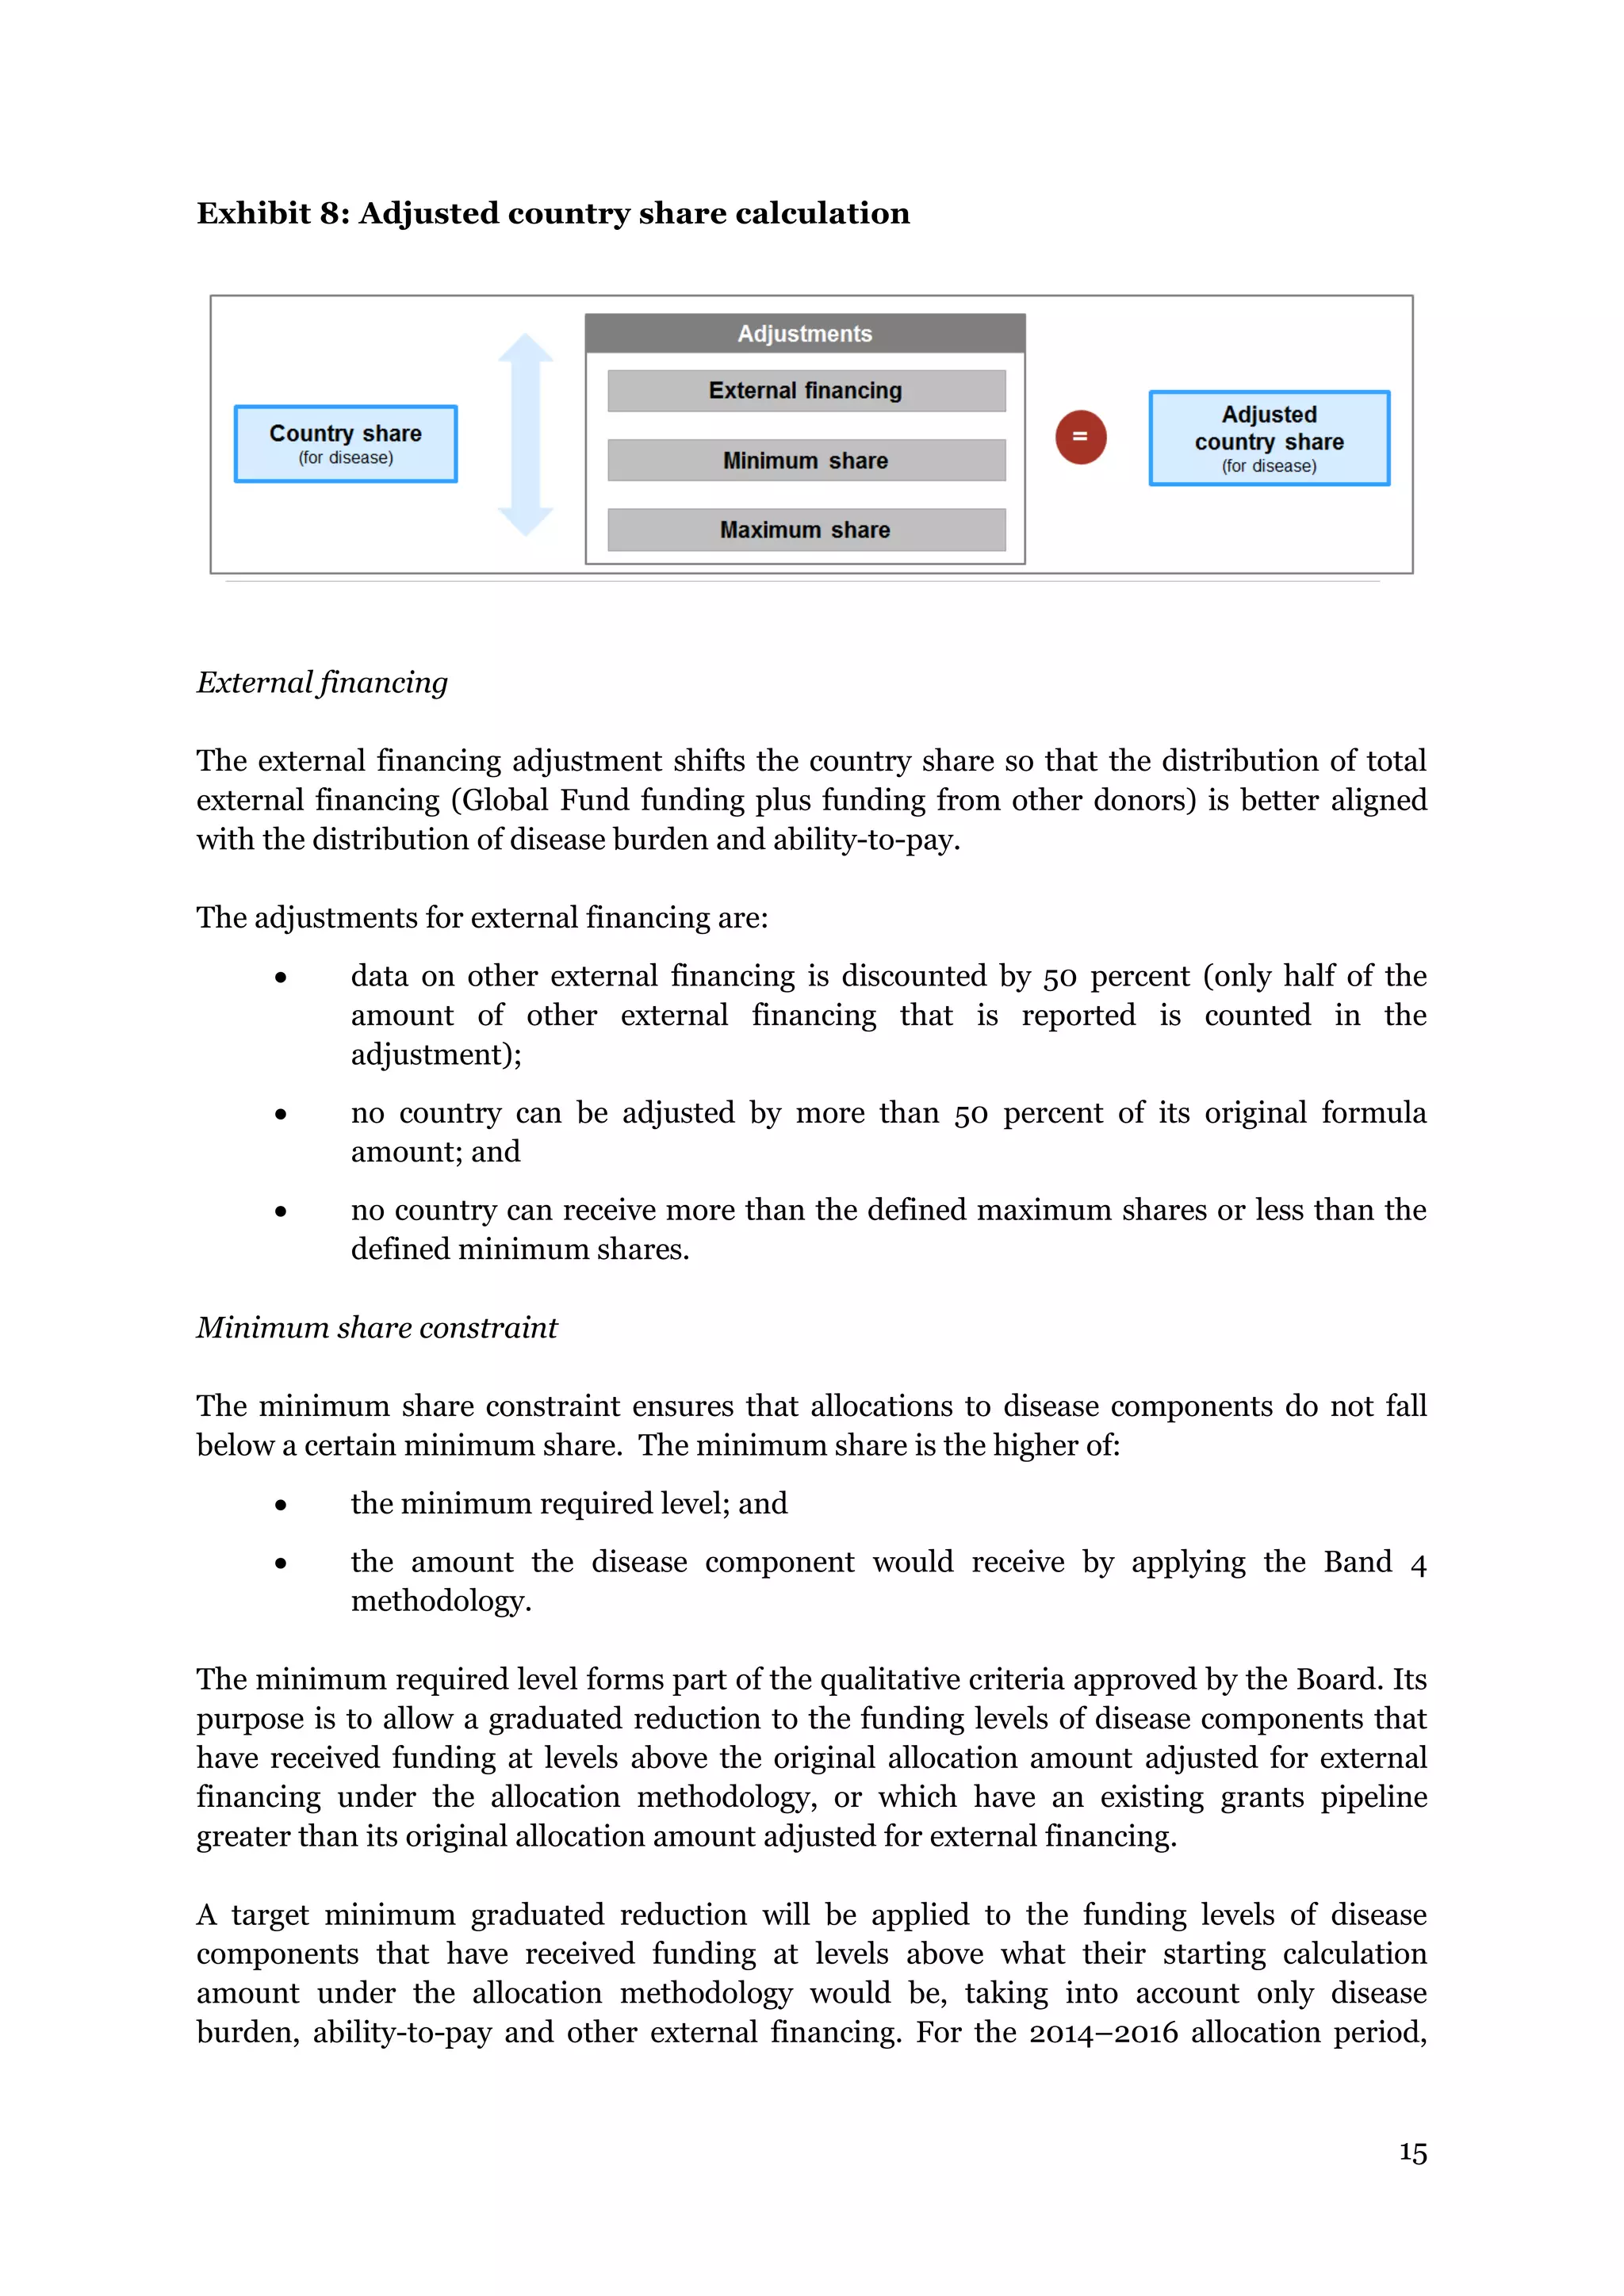
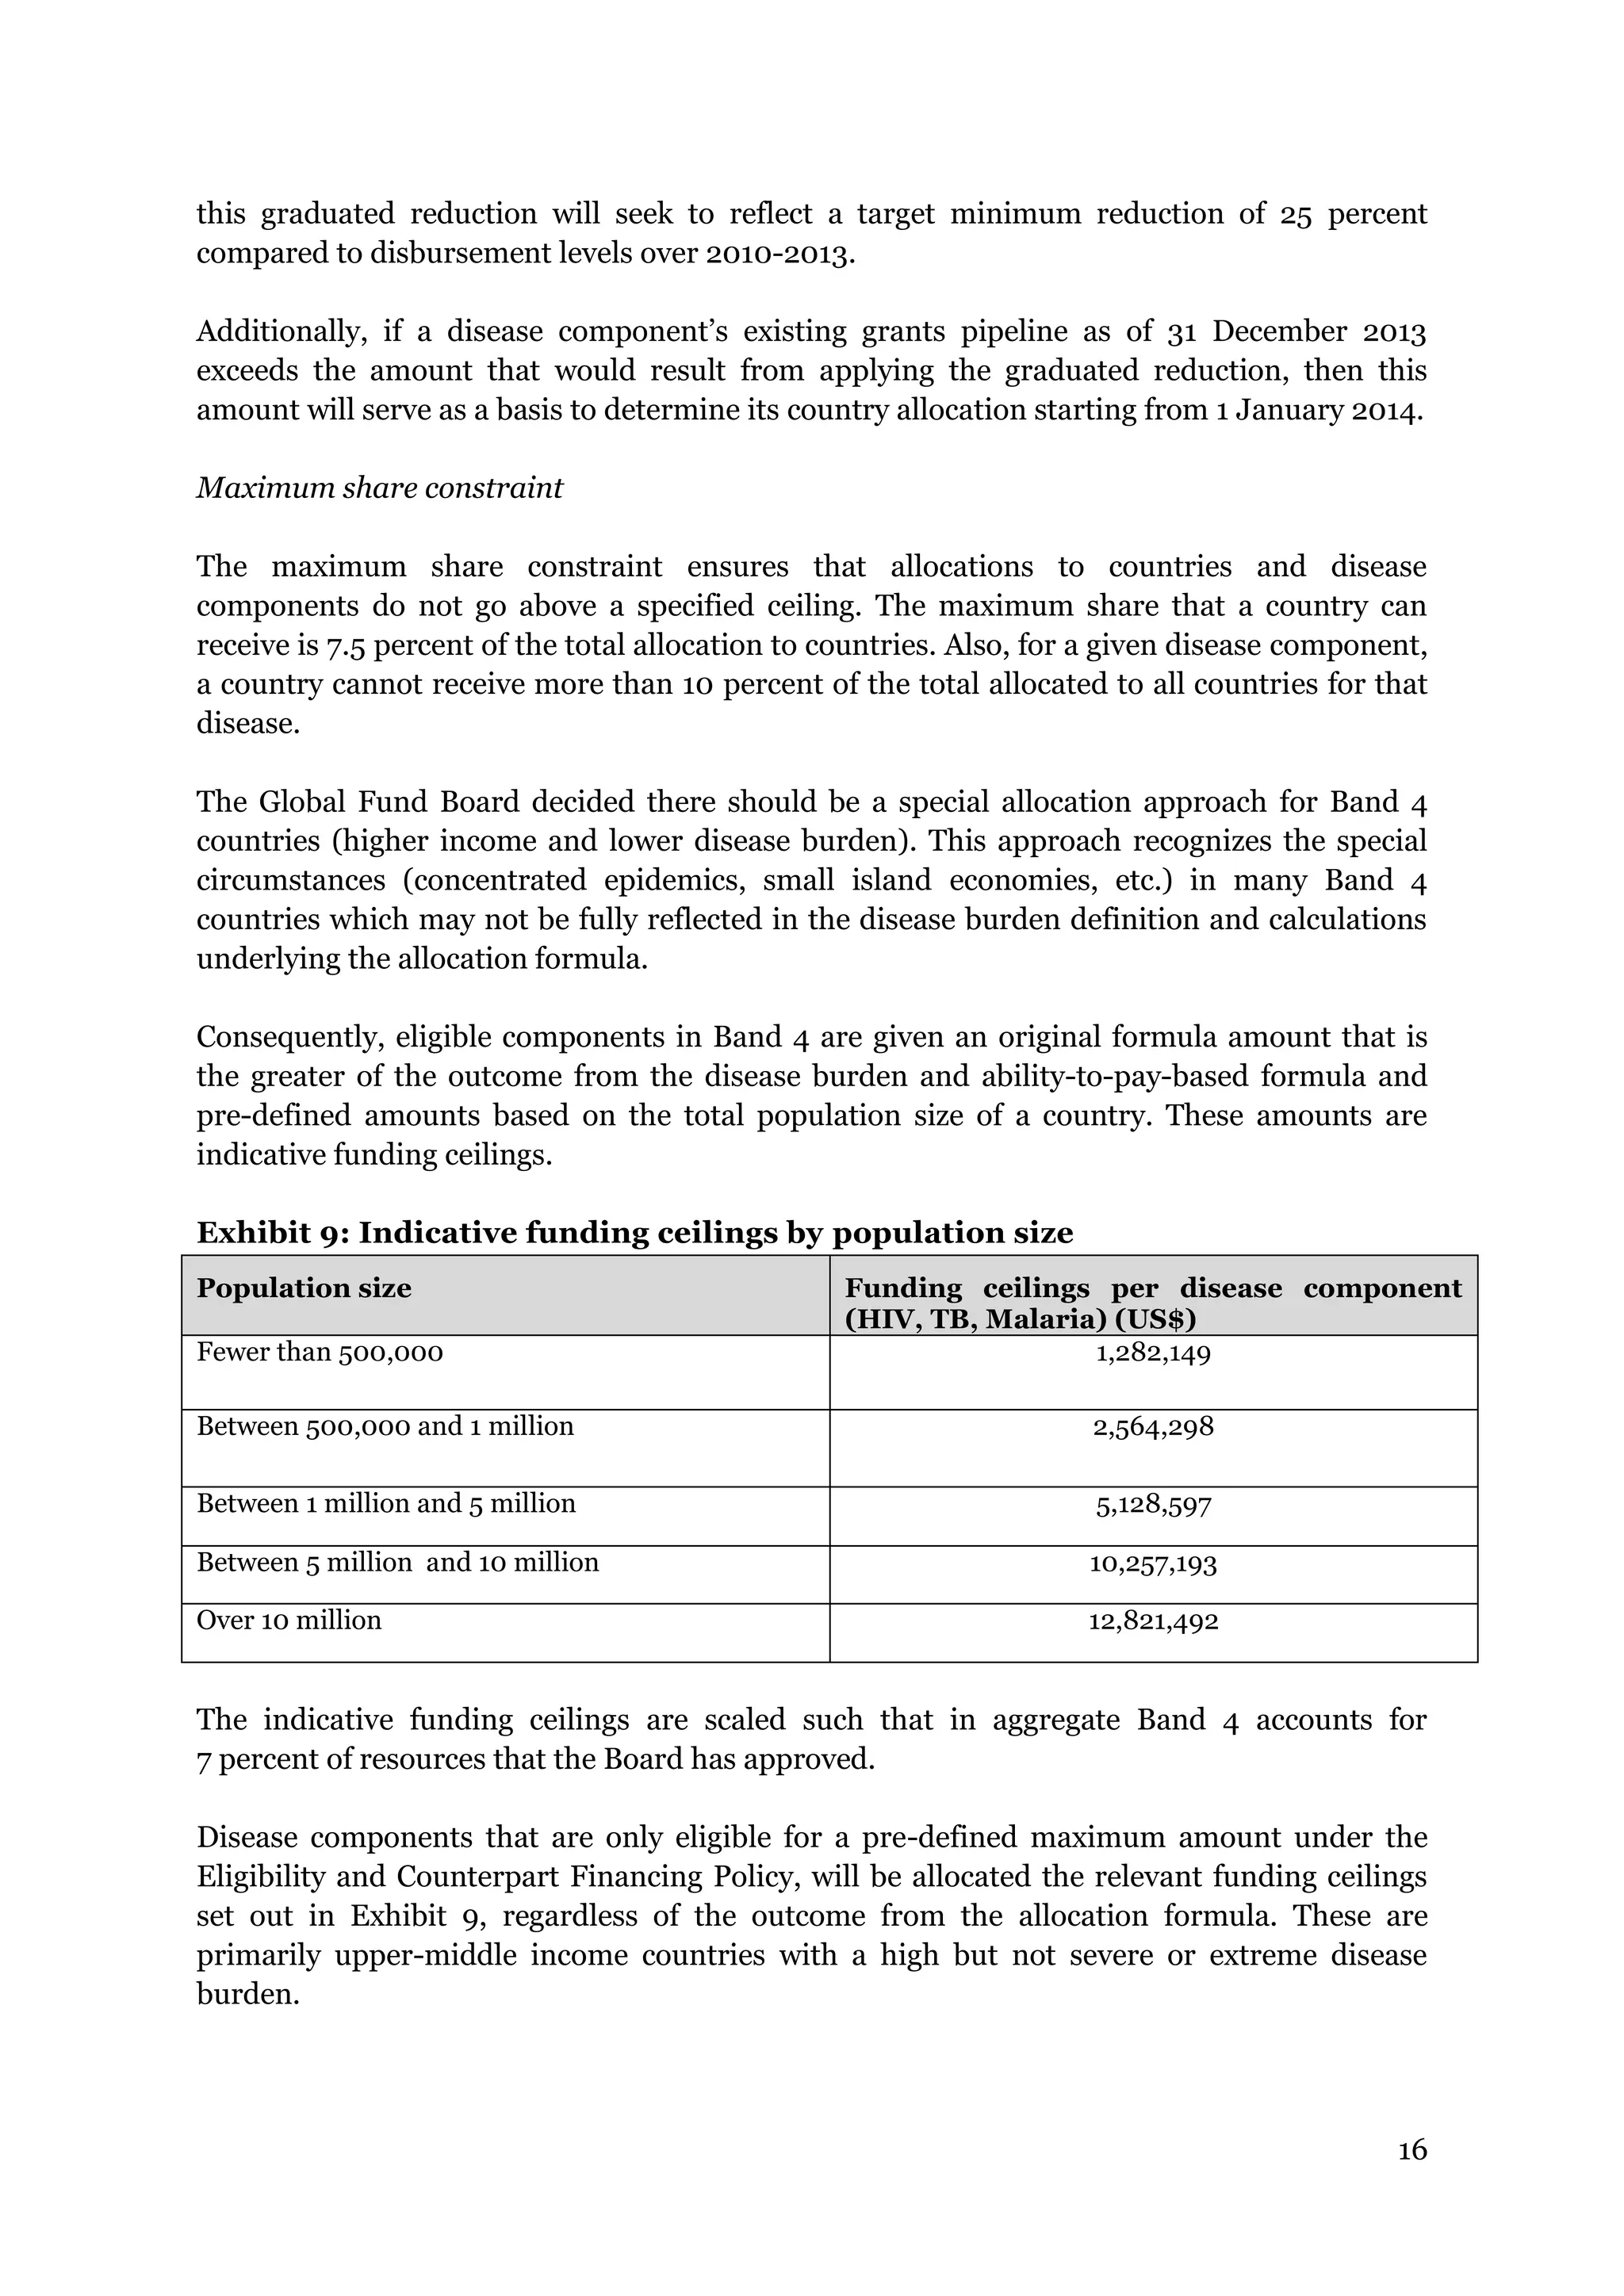
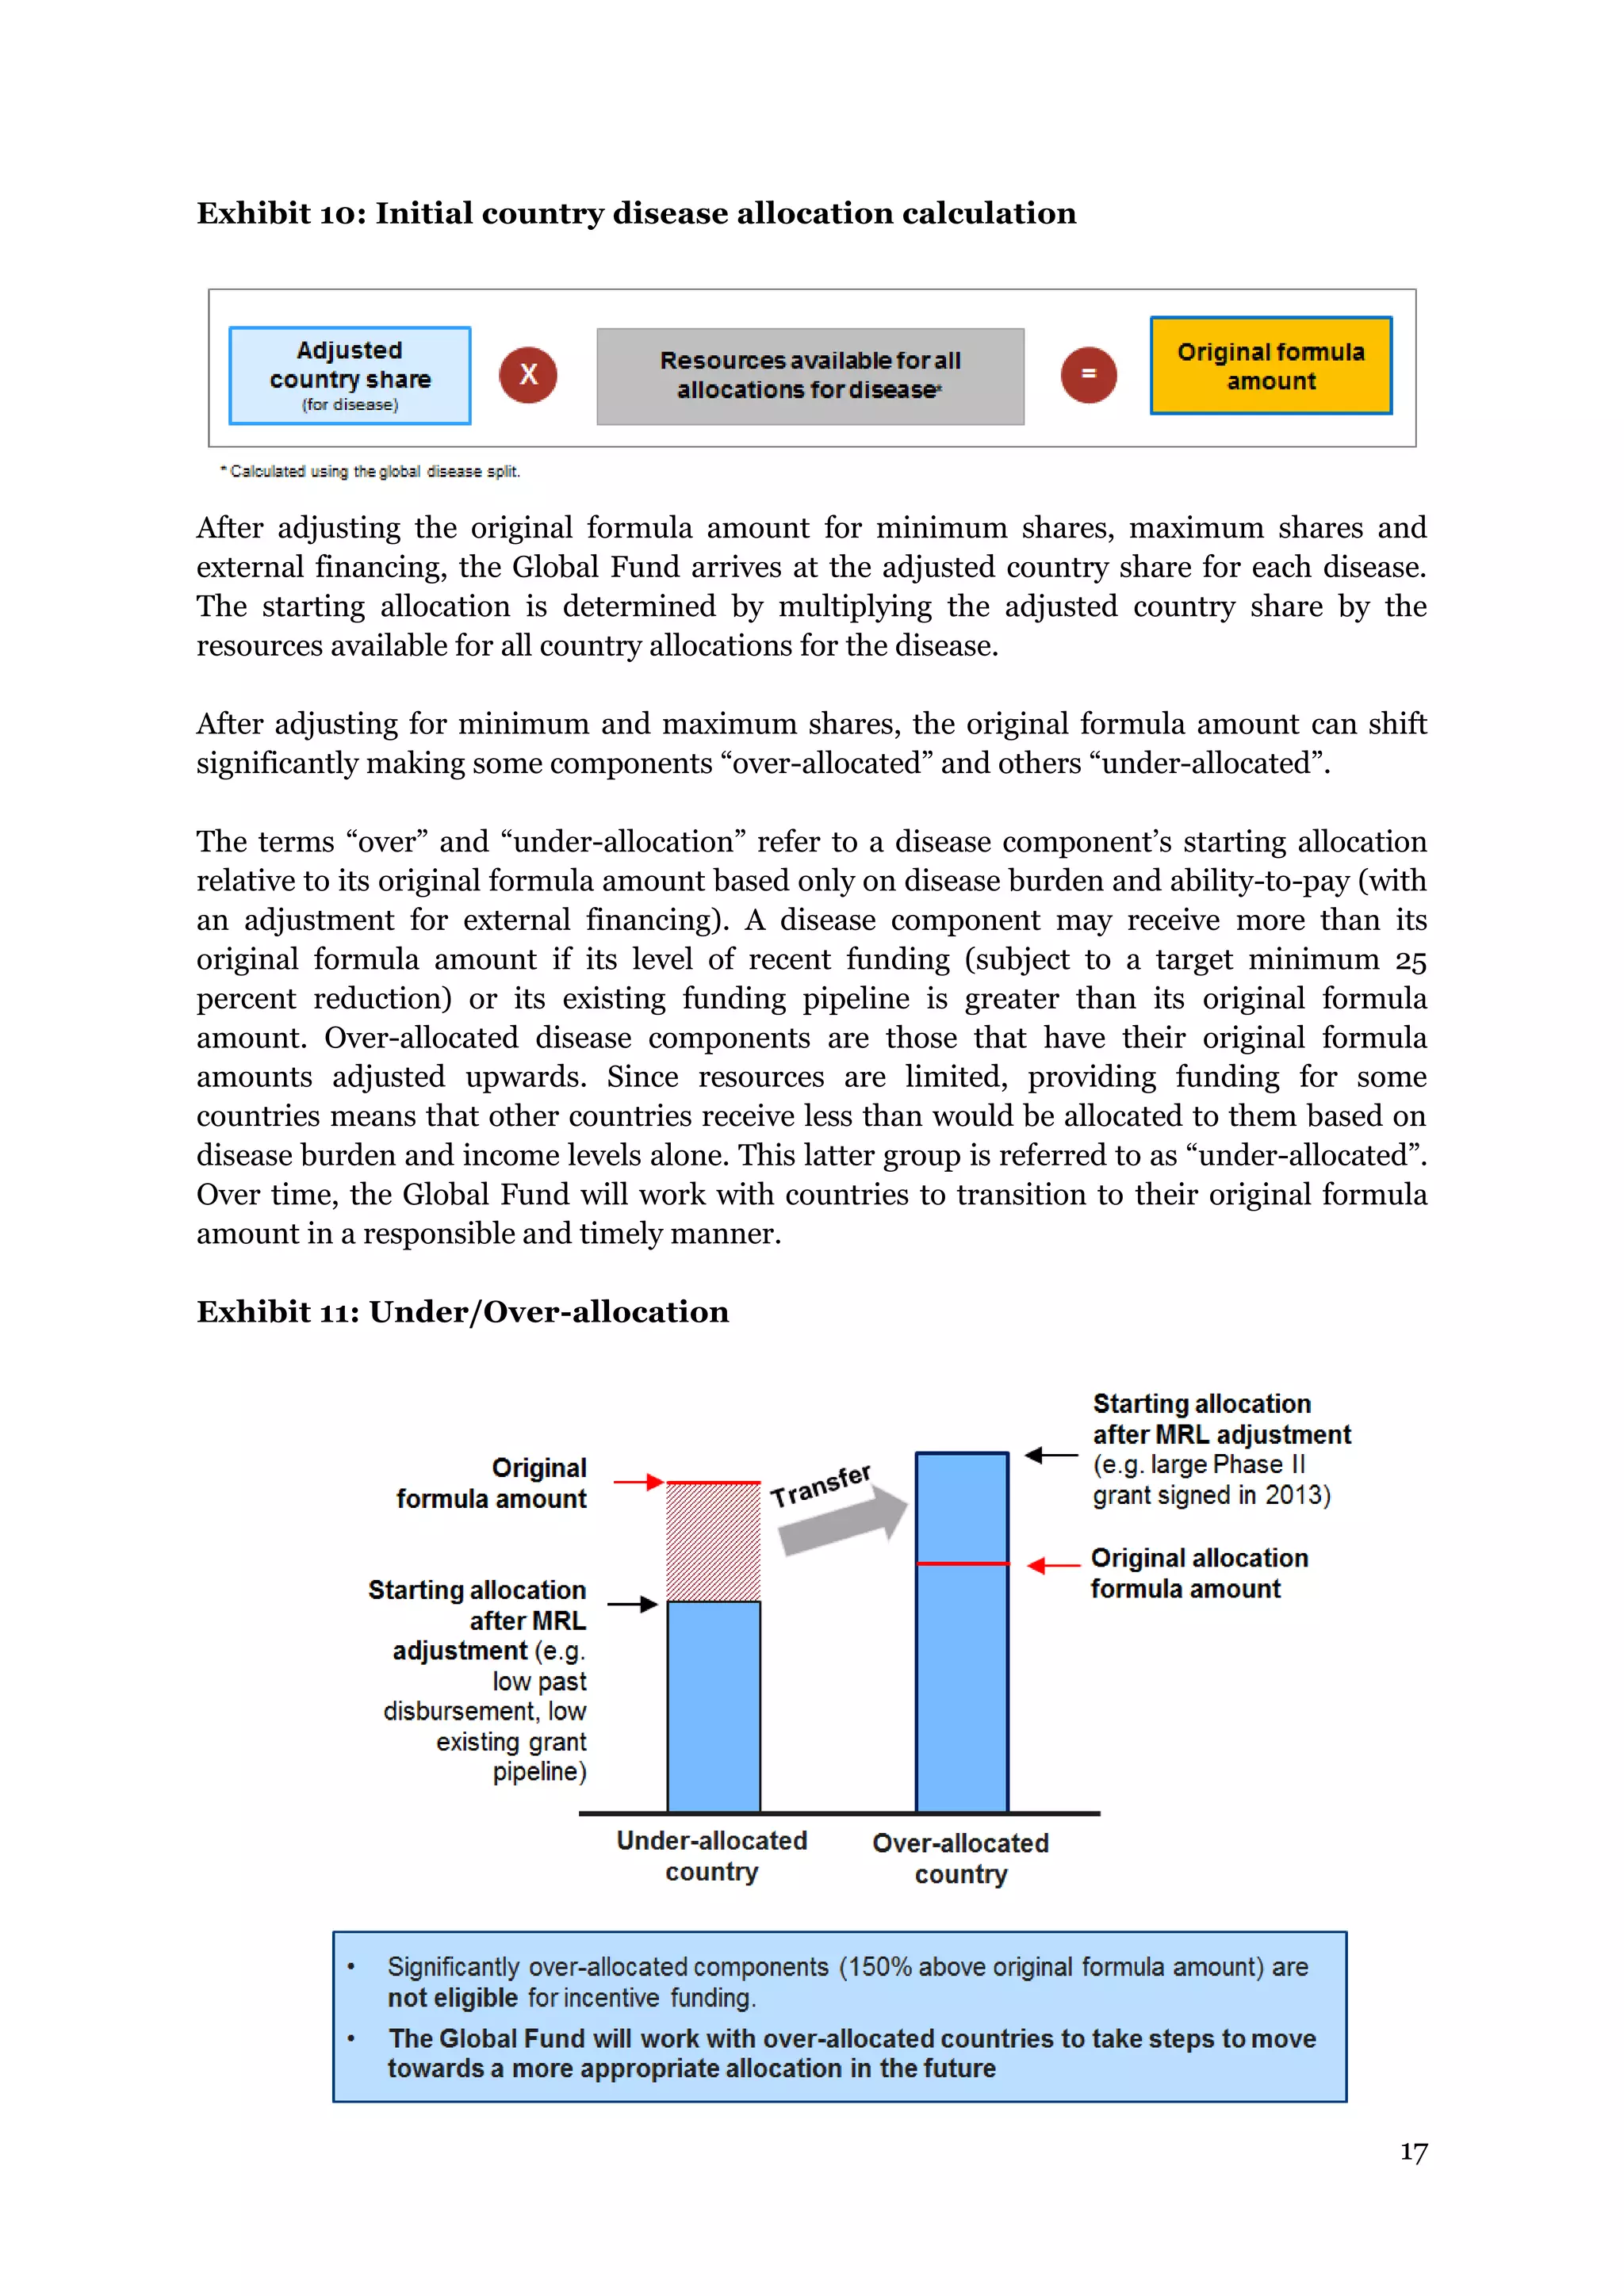
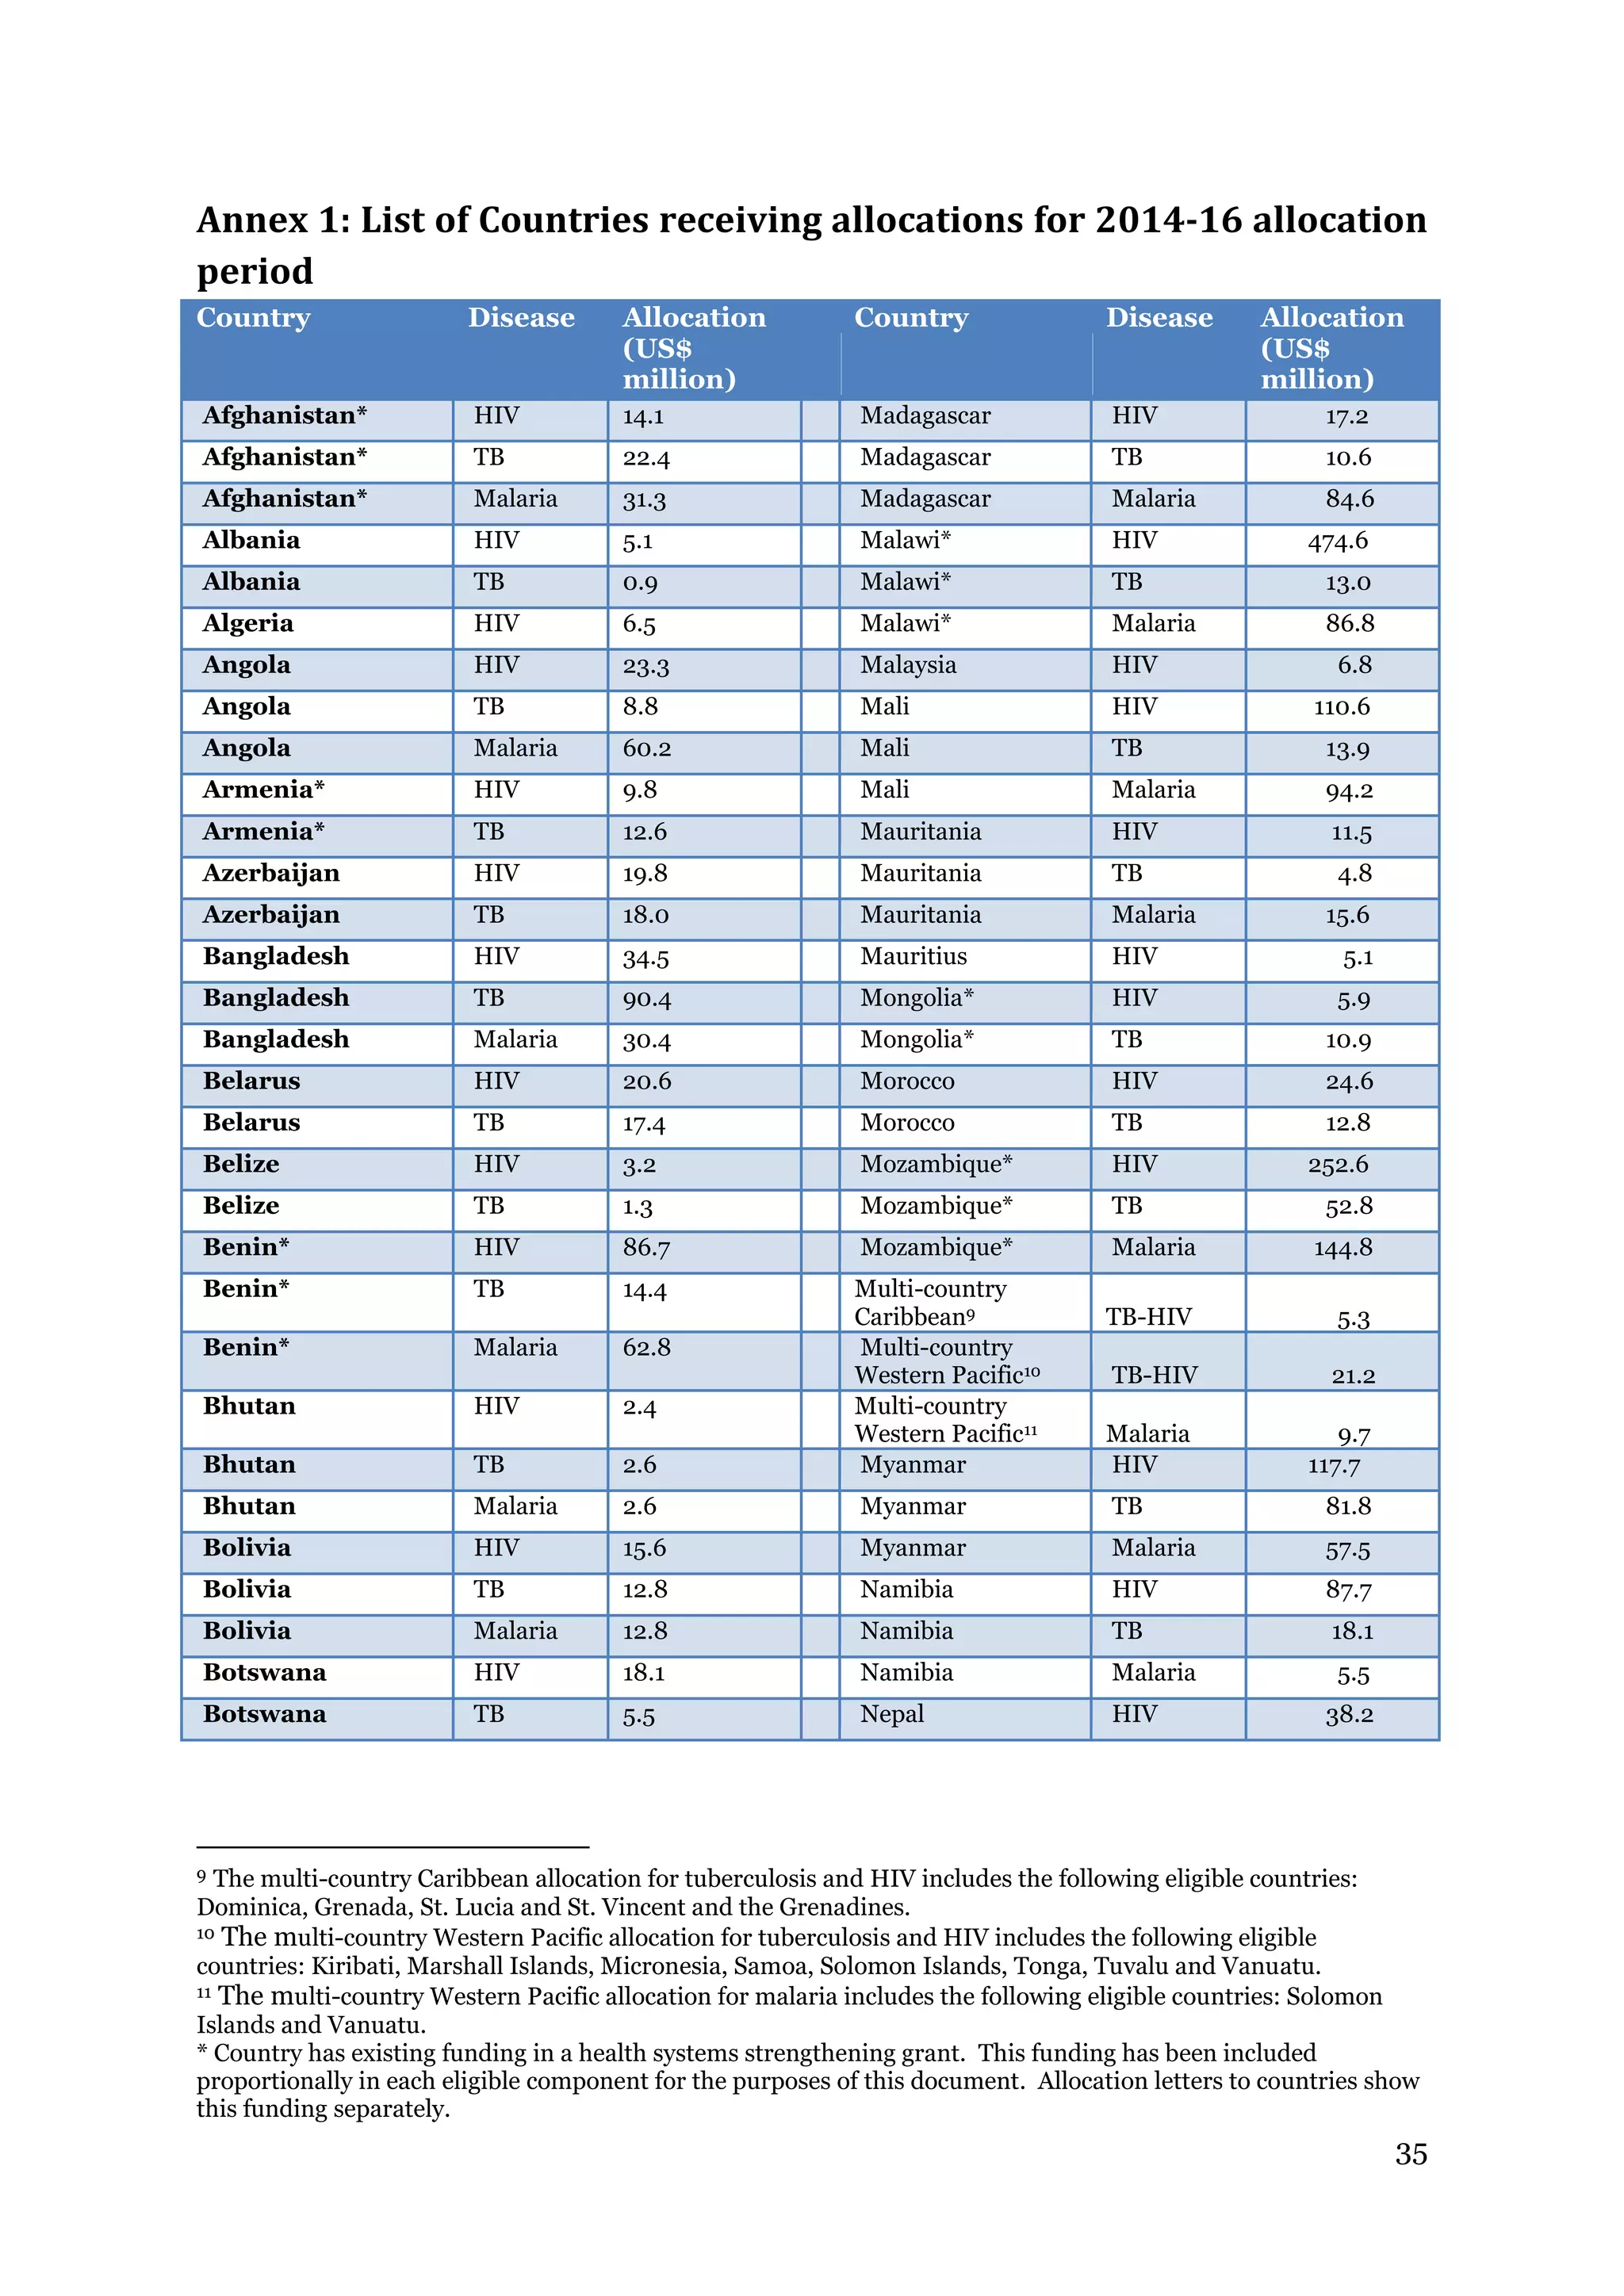
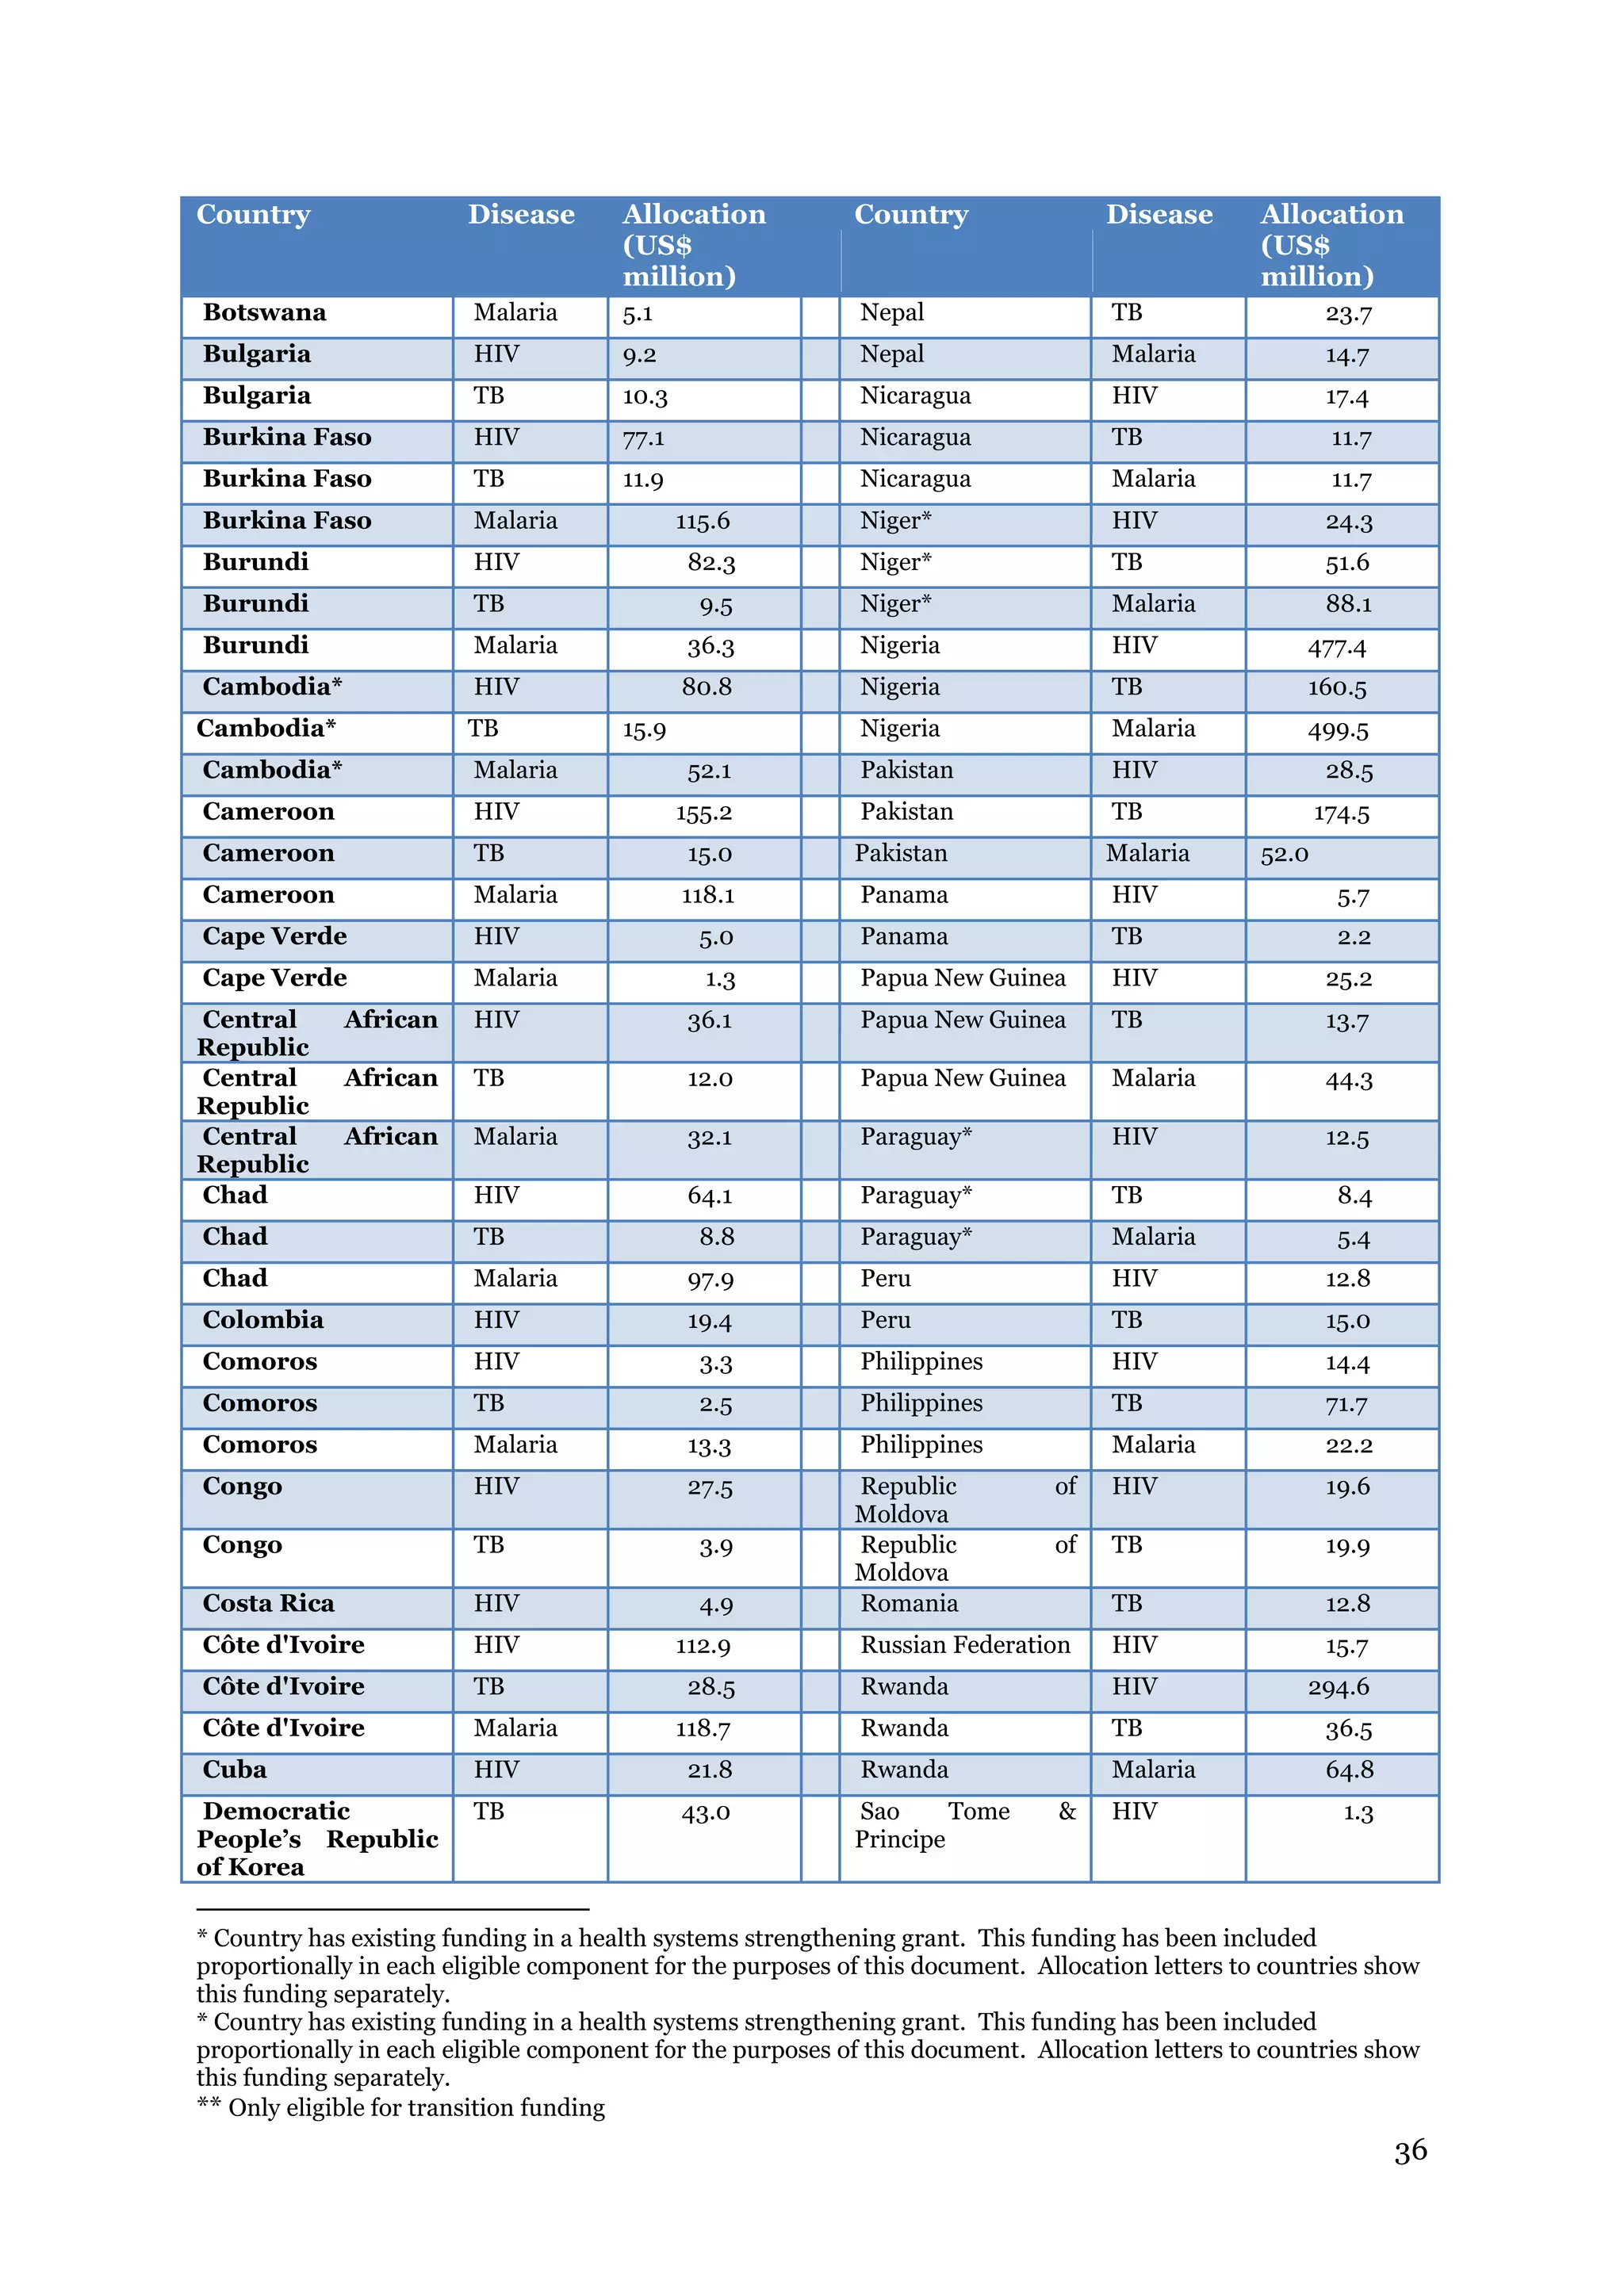
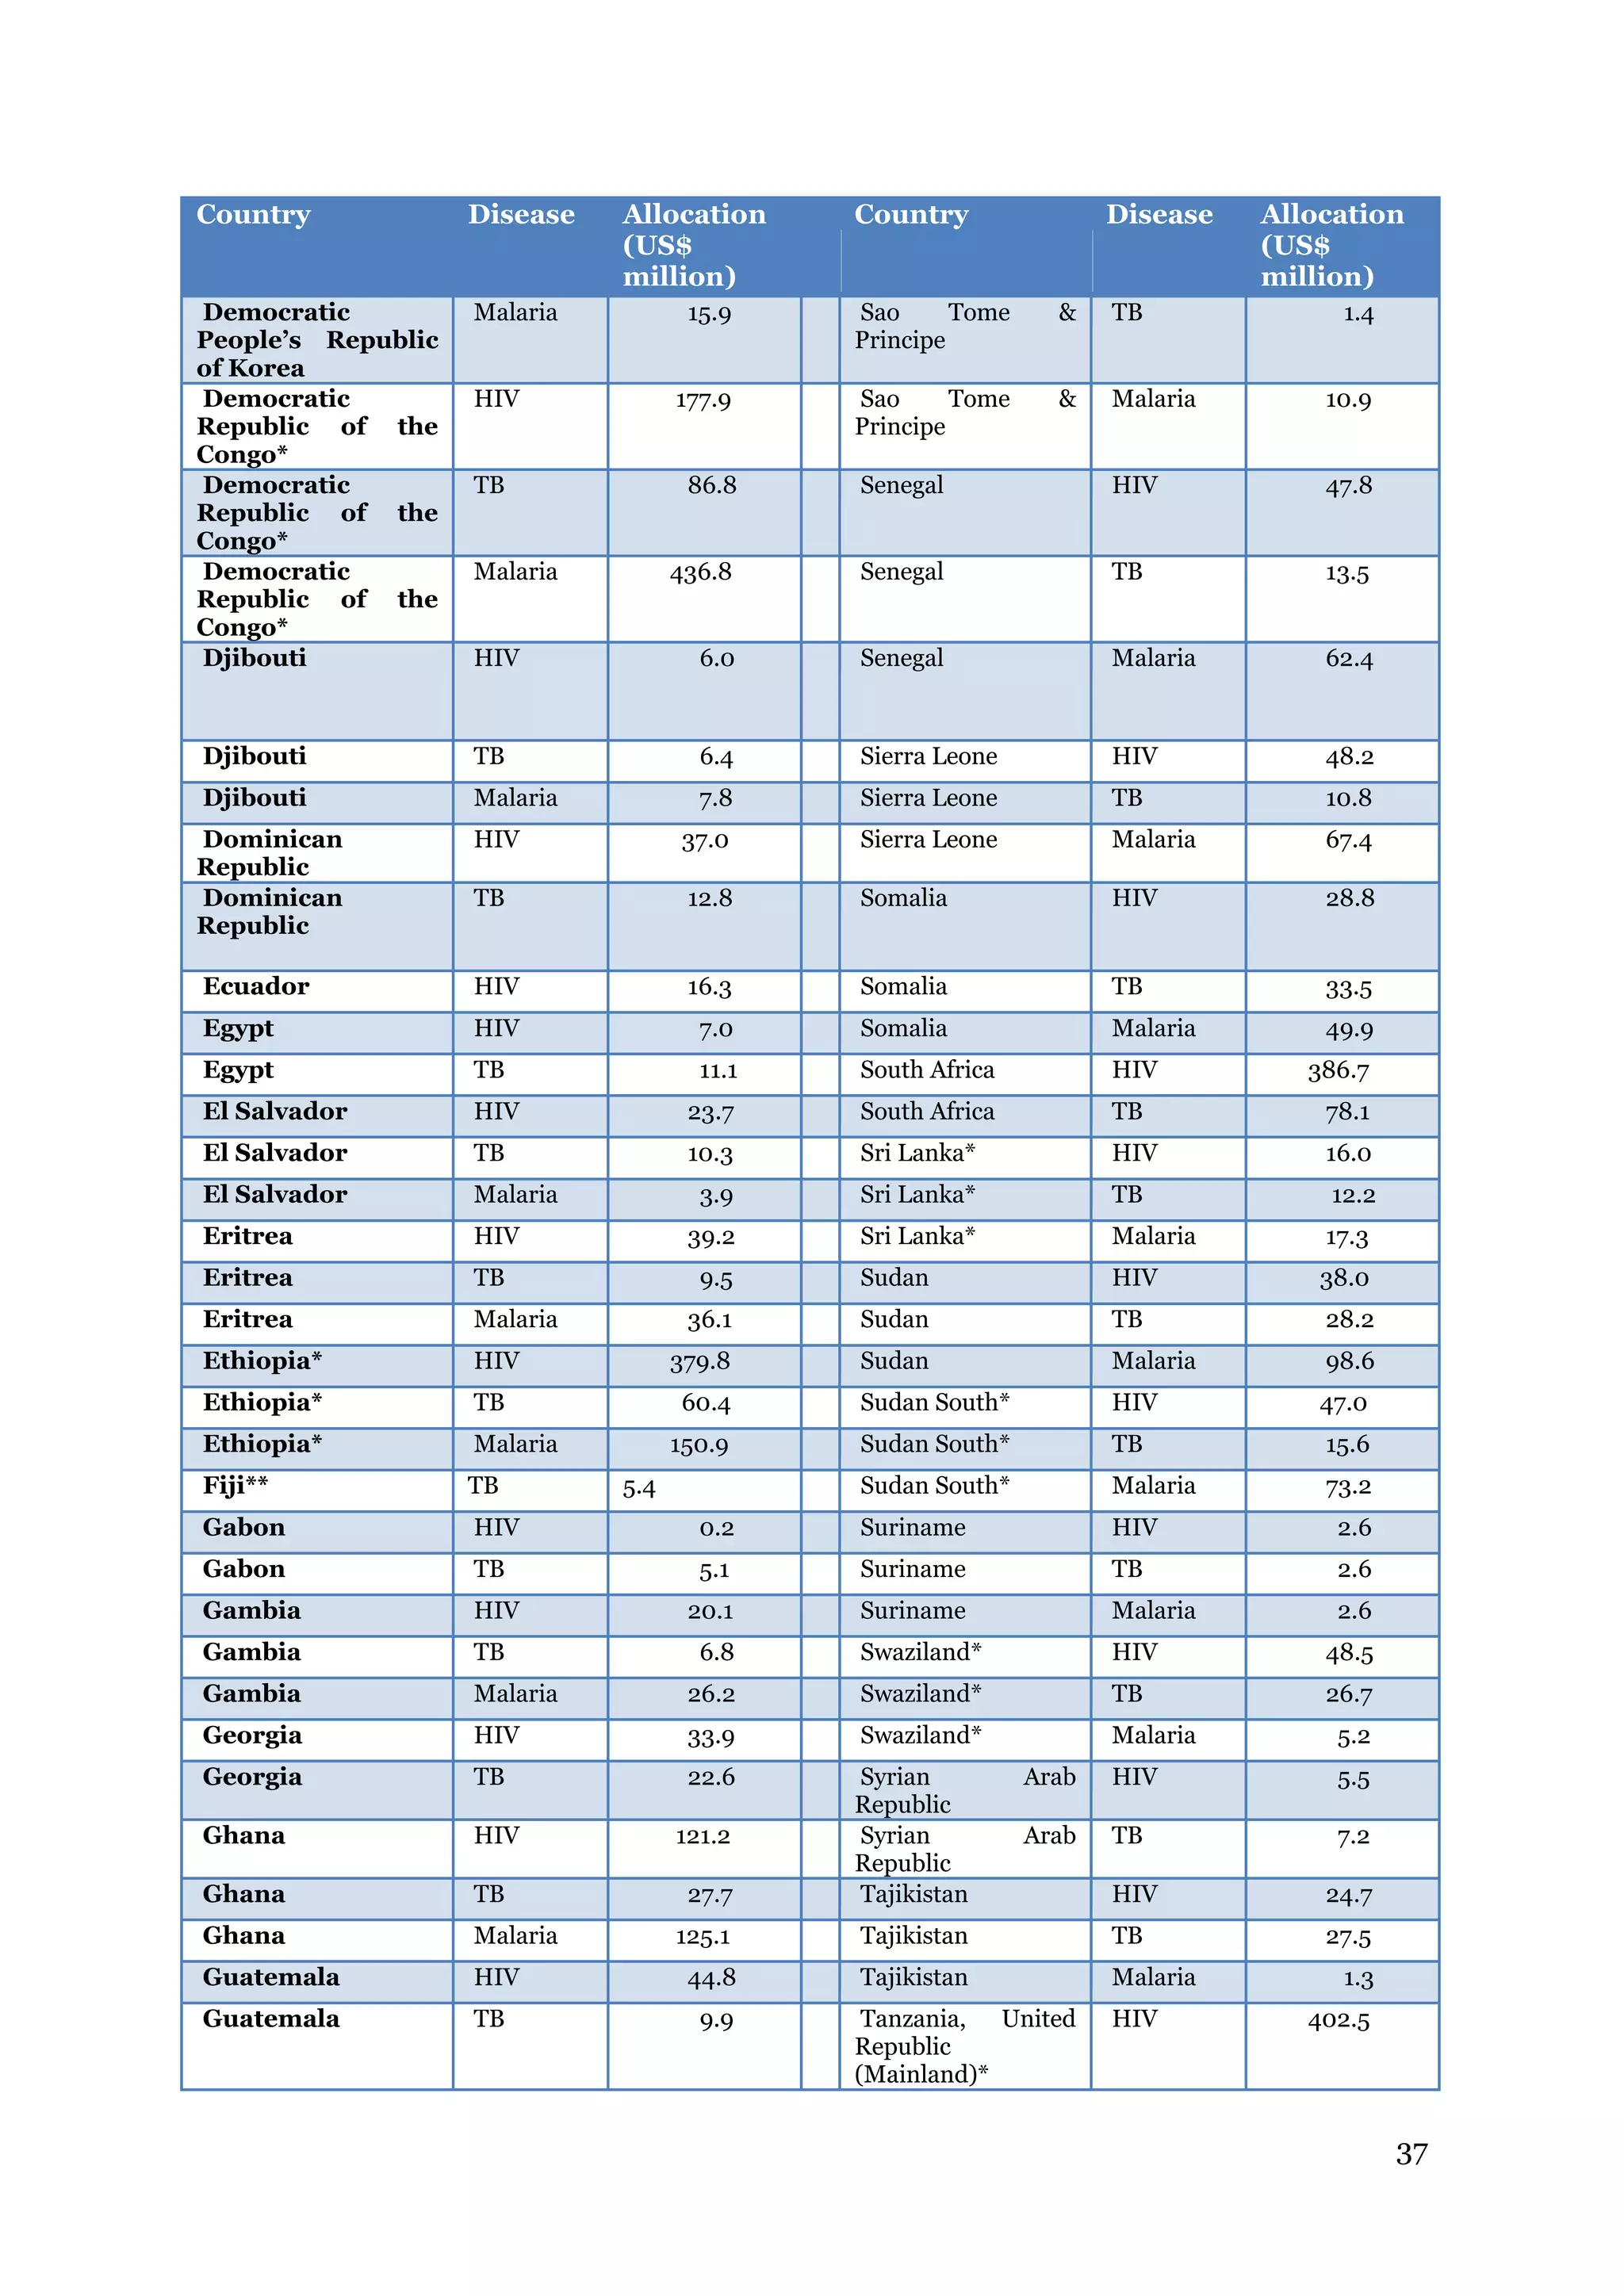

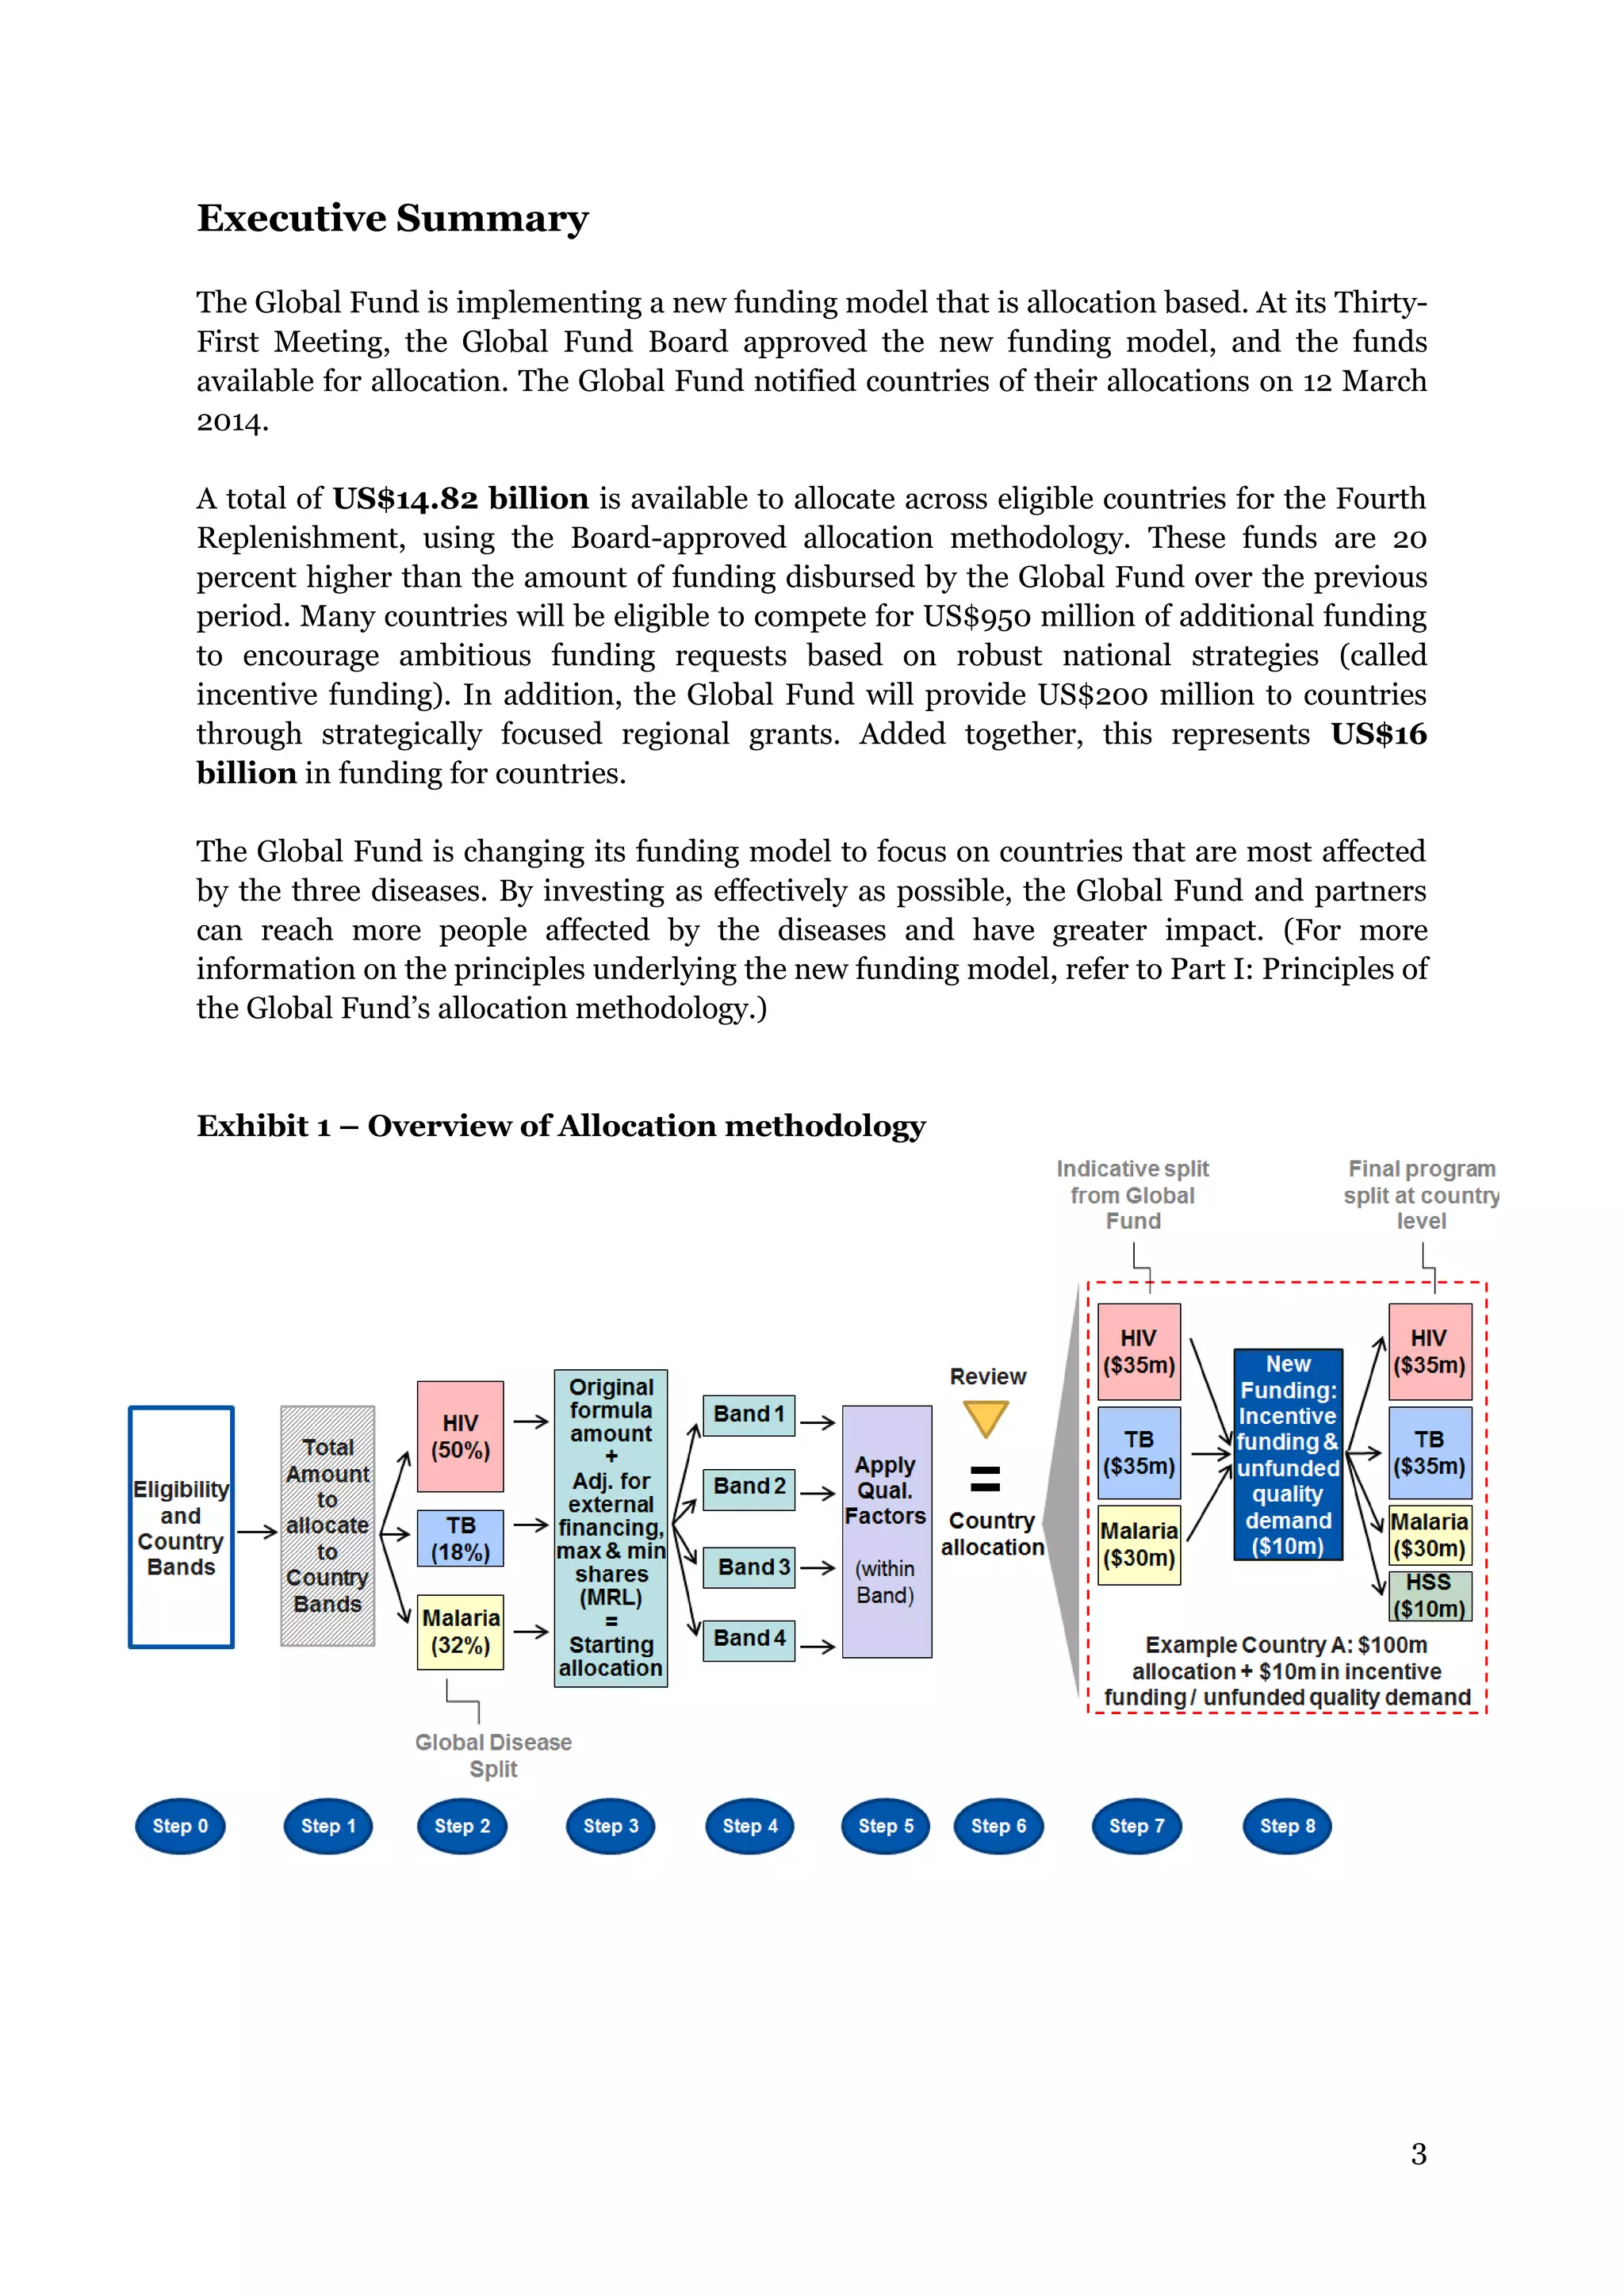
The document describes the Global Fund's new allocation-based funding model for 2014-2016. It outlines 7 key steps: 1) determining country eligibility and bands, 2) approving total funds, 3) splitting funds across diseases, 4) calculating starting allocations, 5) finalizing country band amounts, 6) adjusting allocations for qualitative factors, and 7) communicating country allocations. A total of $14.82 billion is available to allocate based on disease burden and ability to pay, aiming to focus funding on countries most affected by HIV/AIDS, TB, and malaria.


