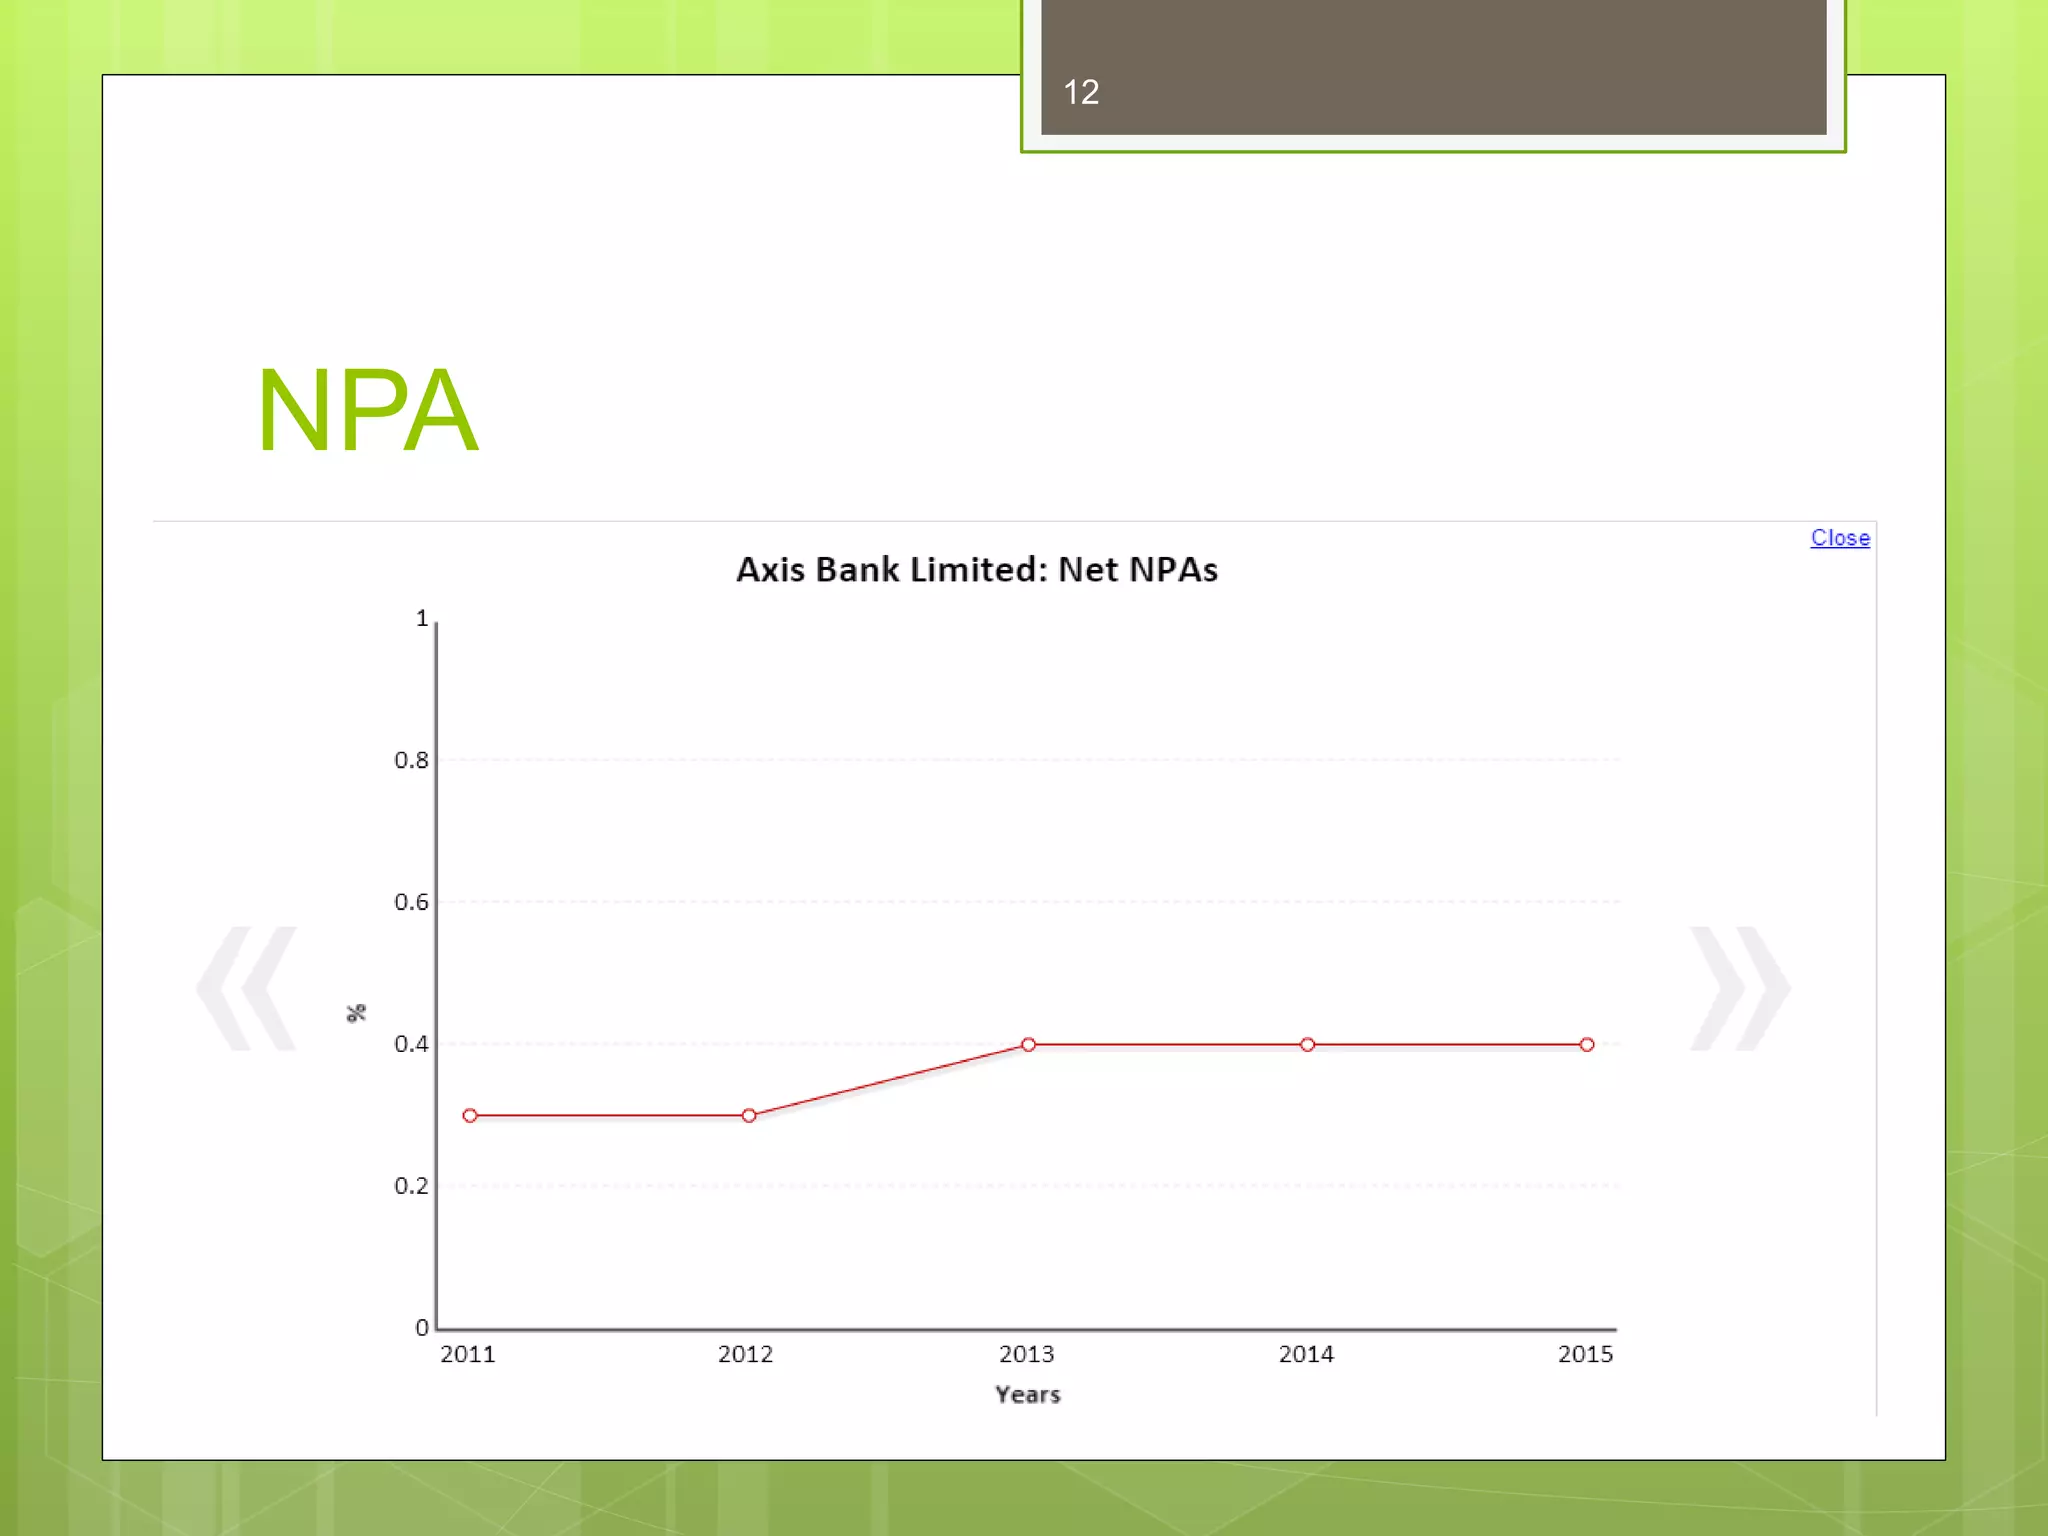
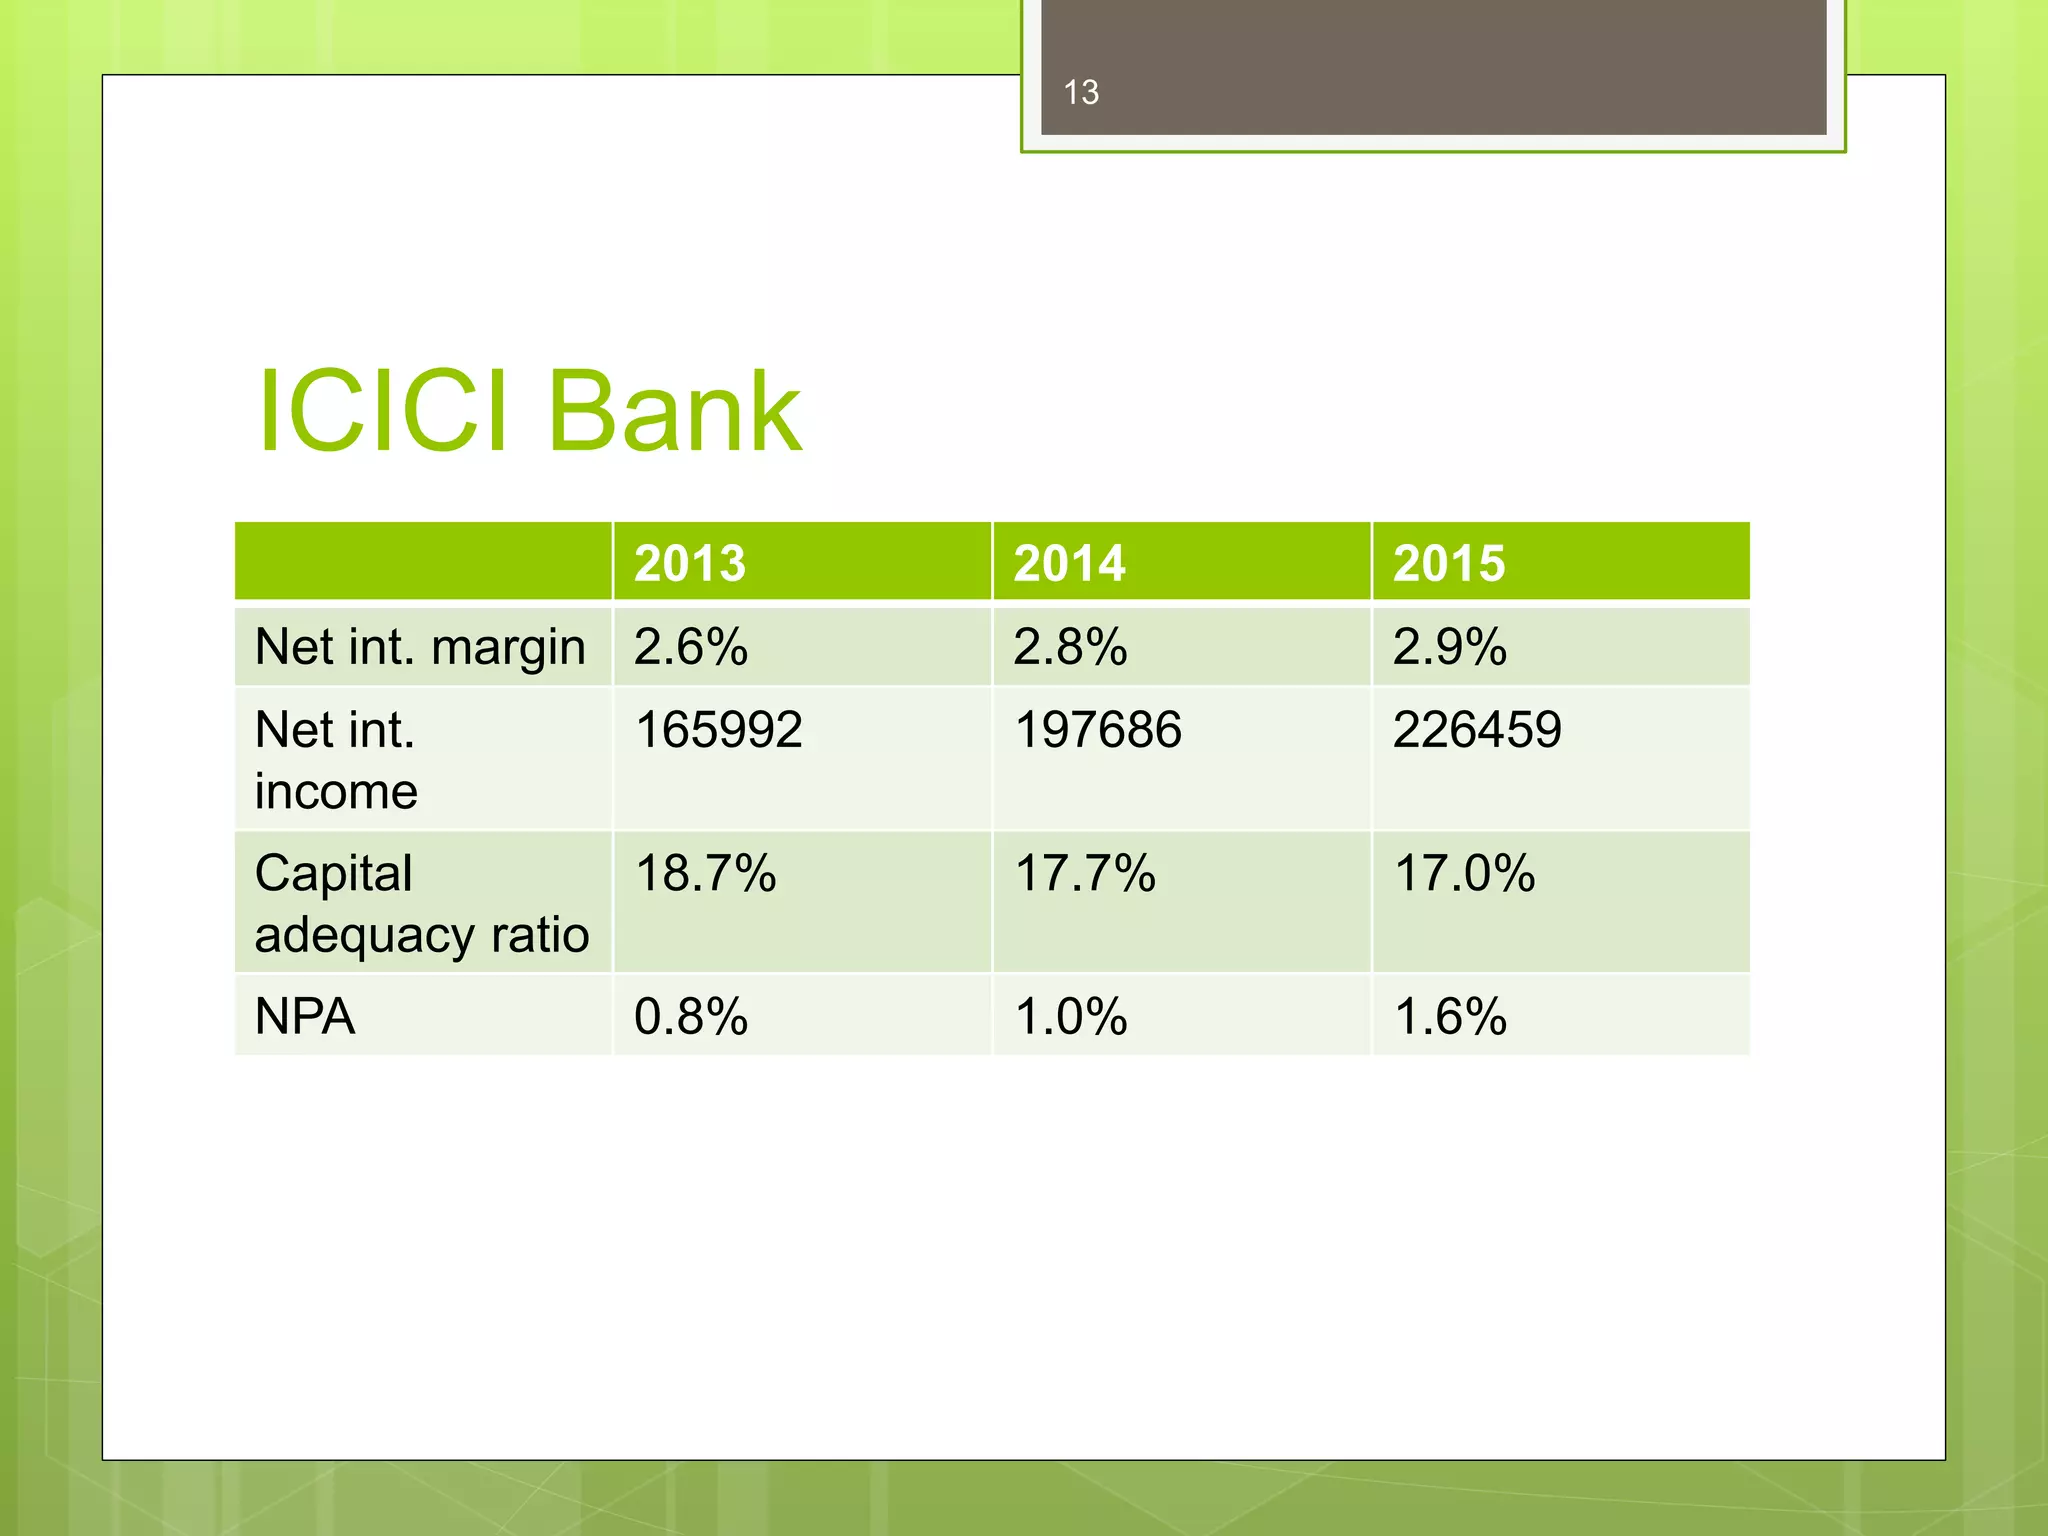
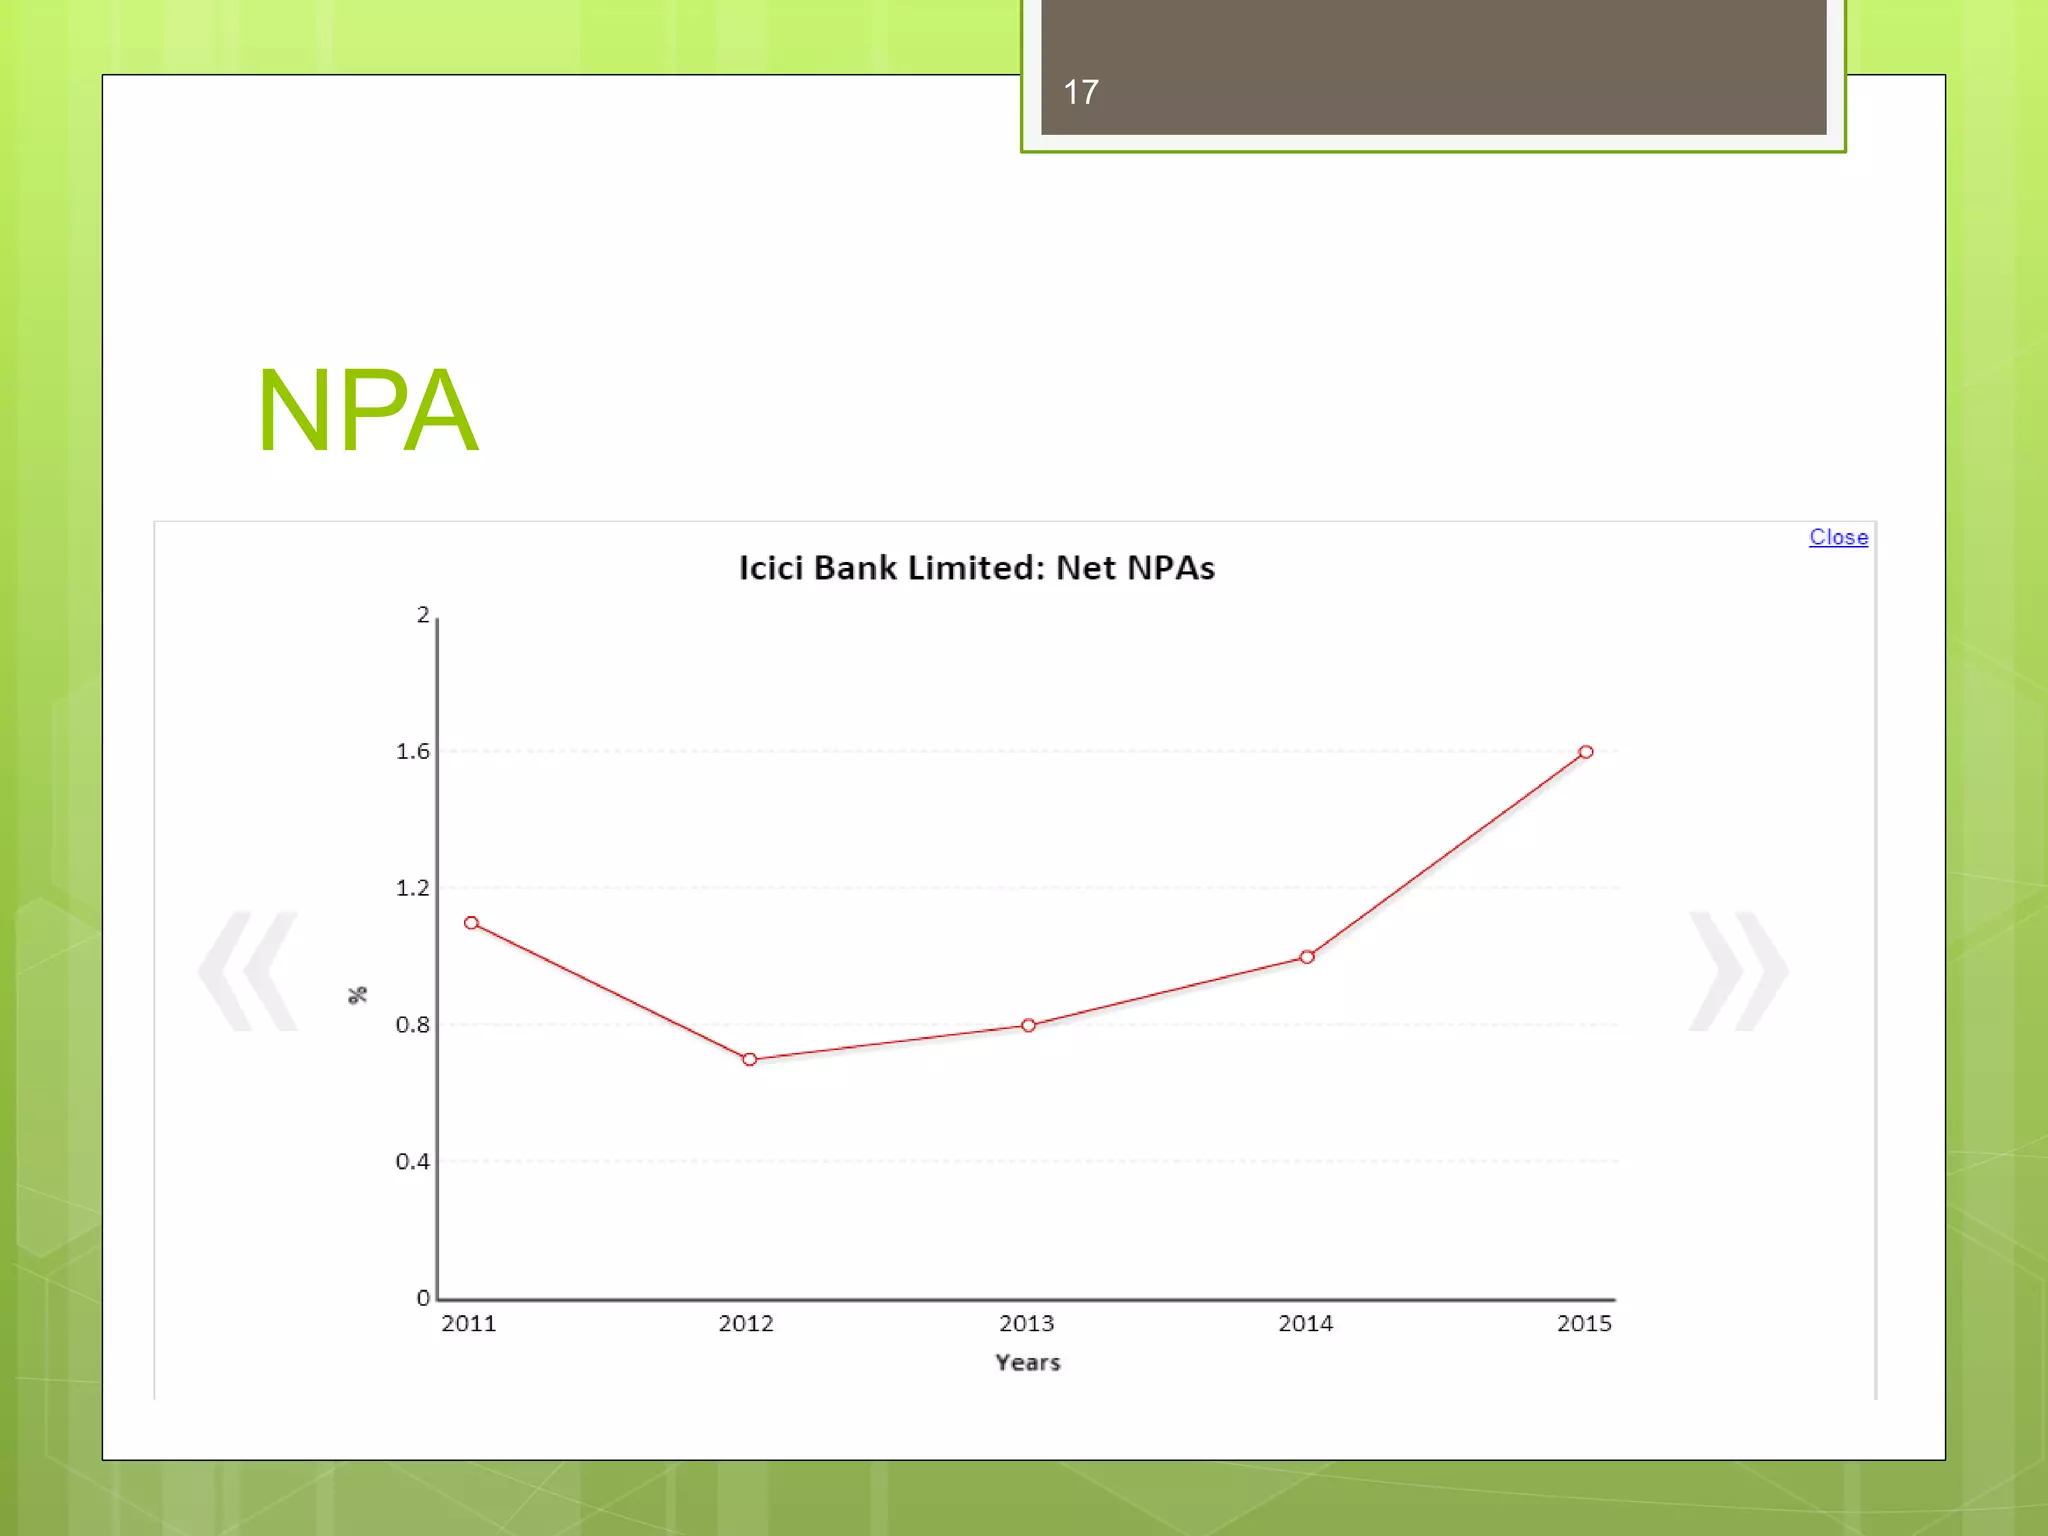
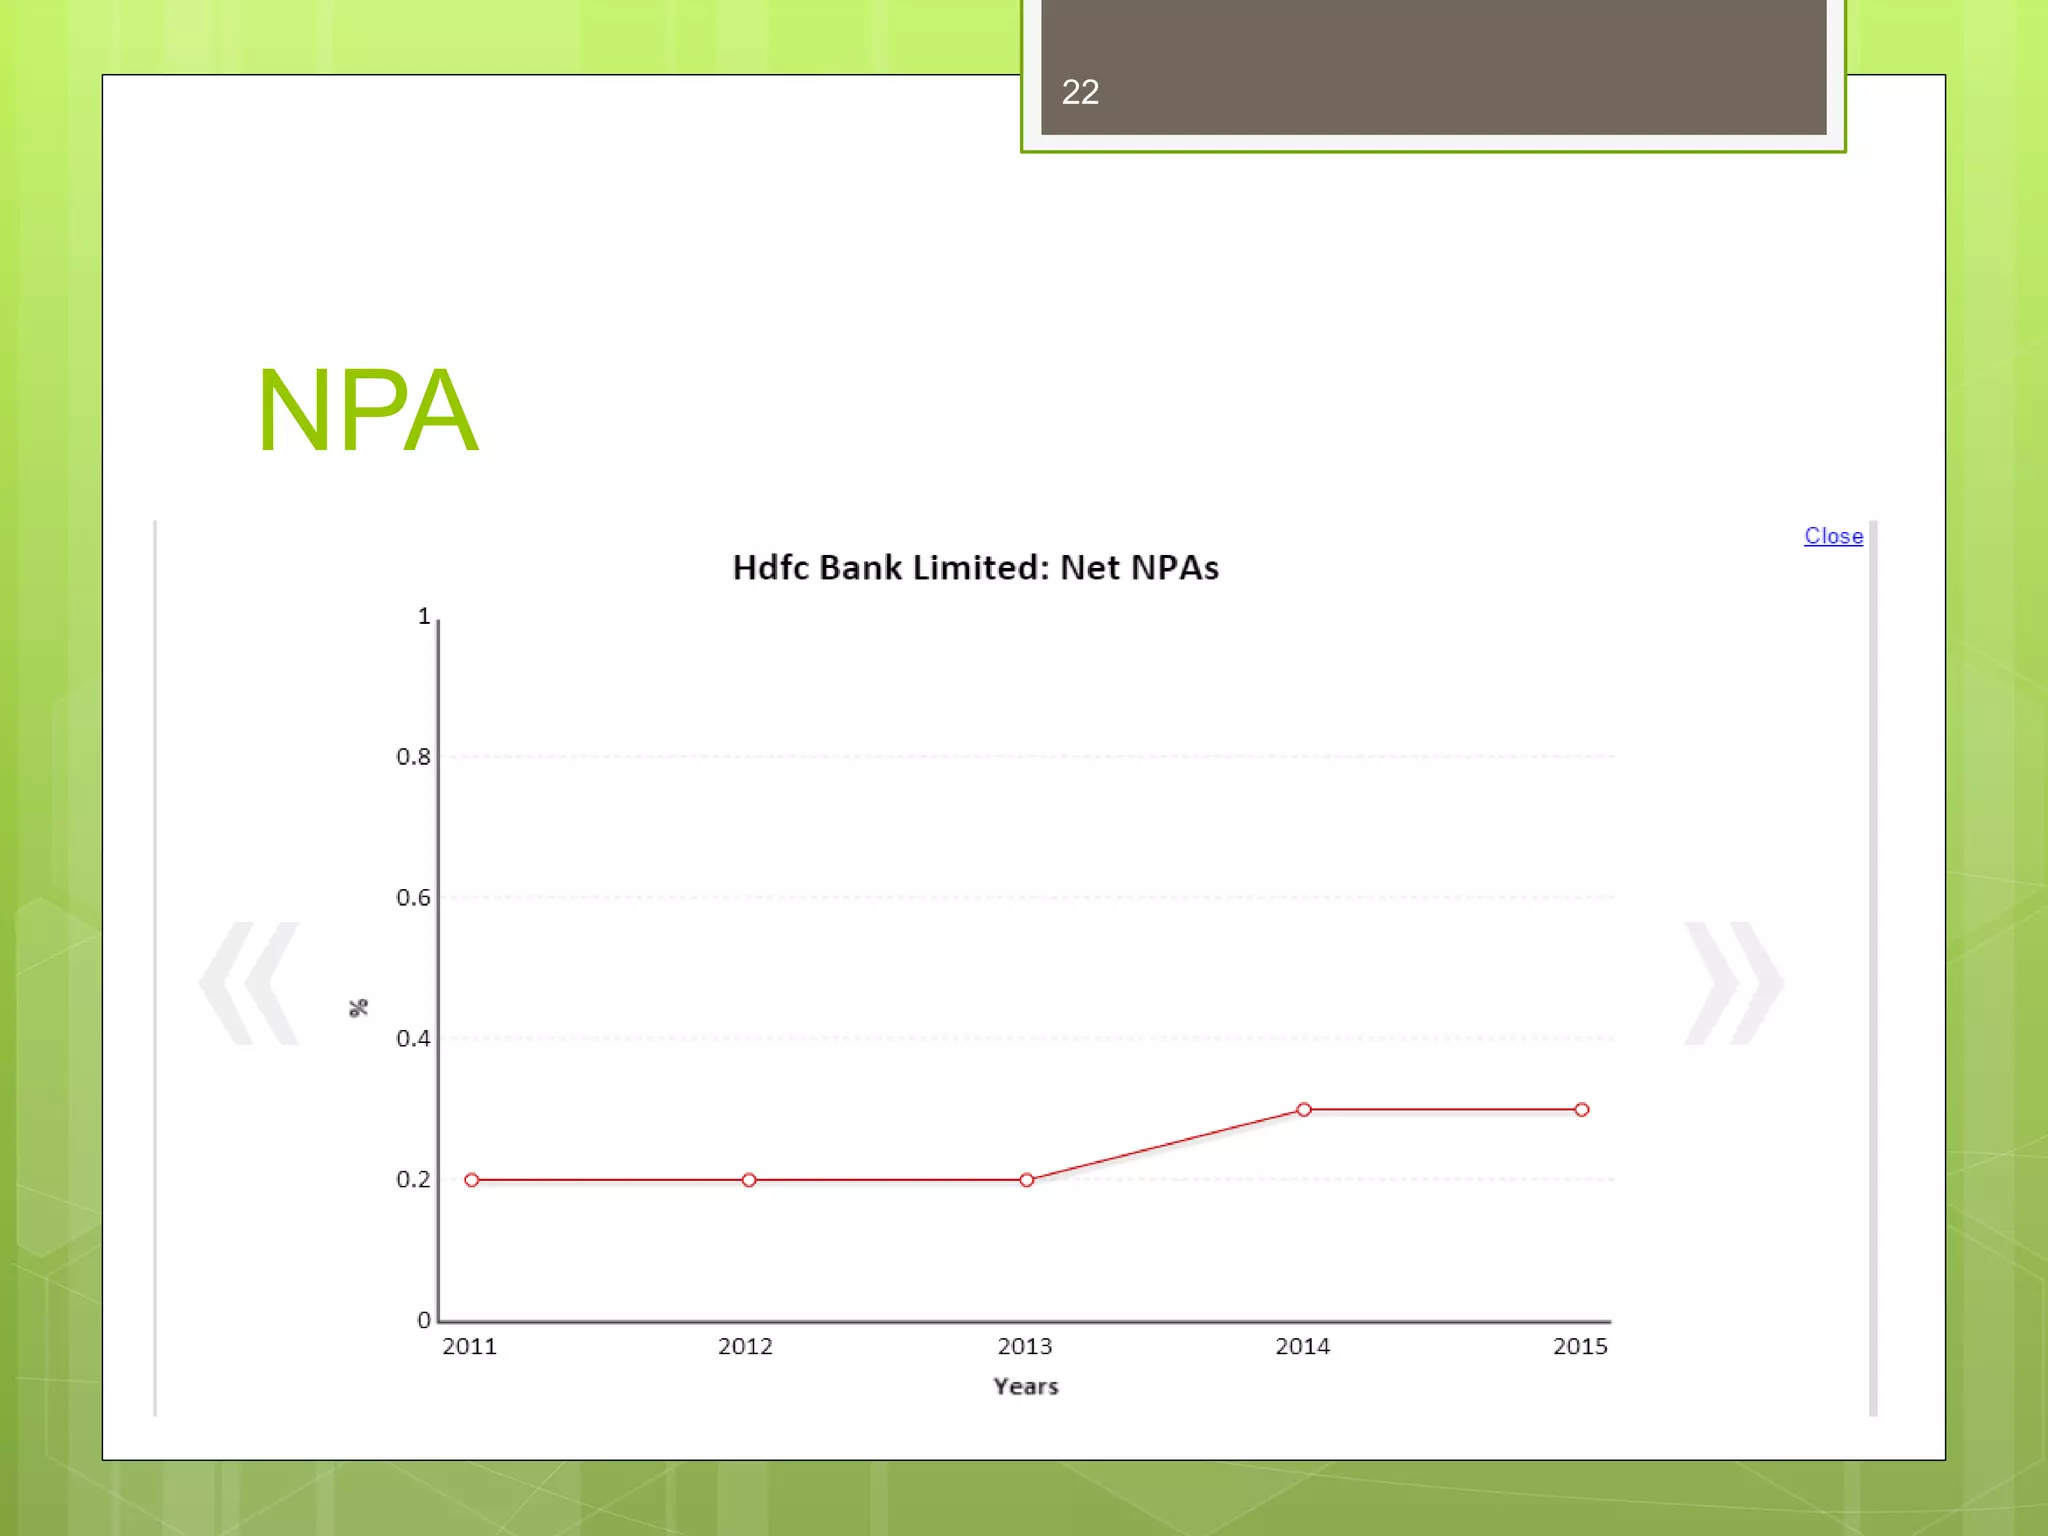
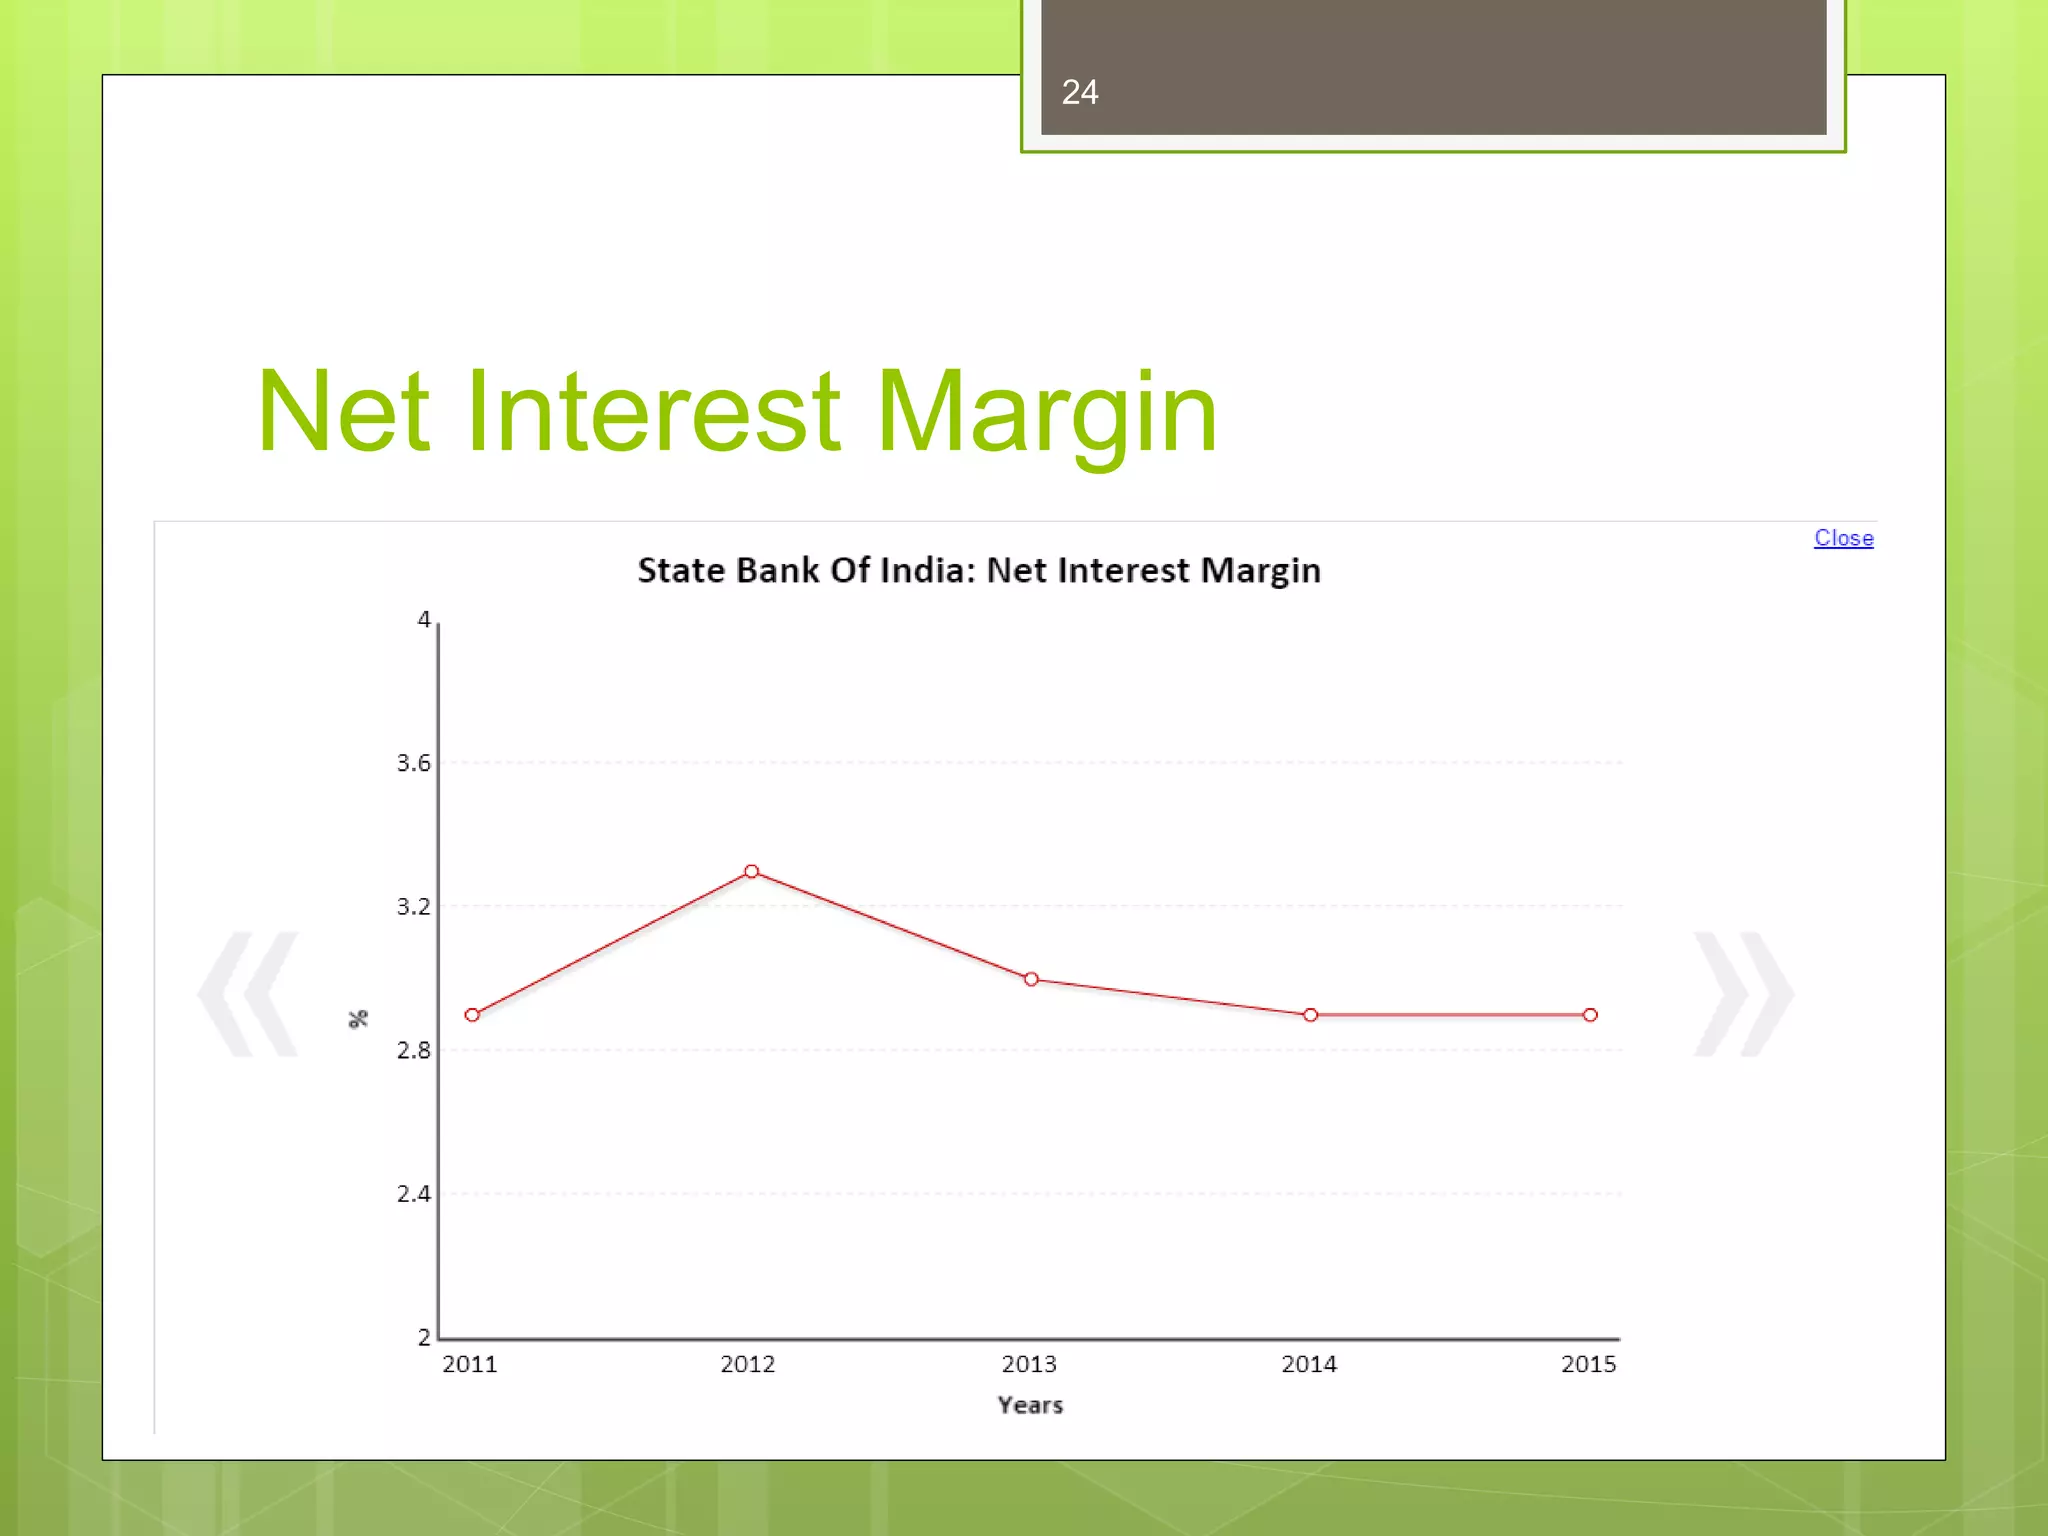
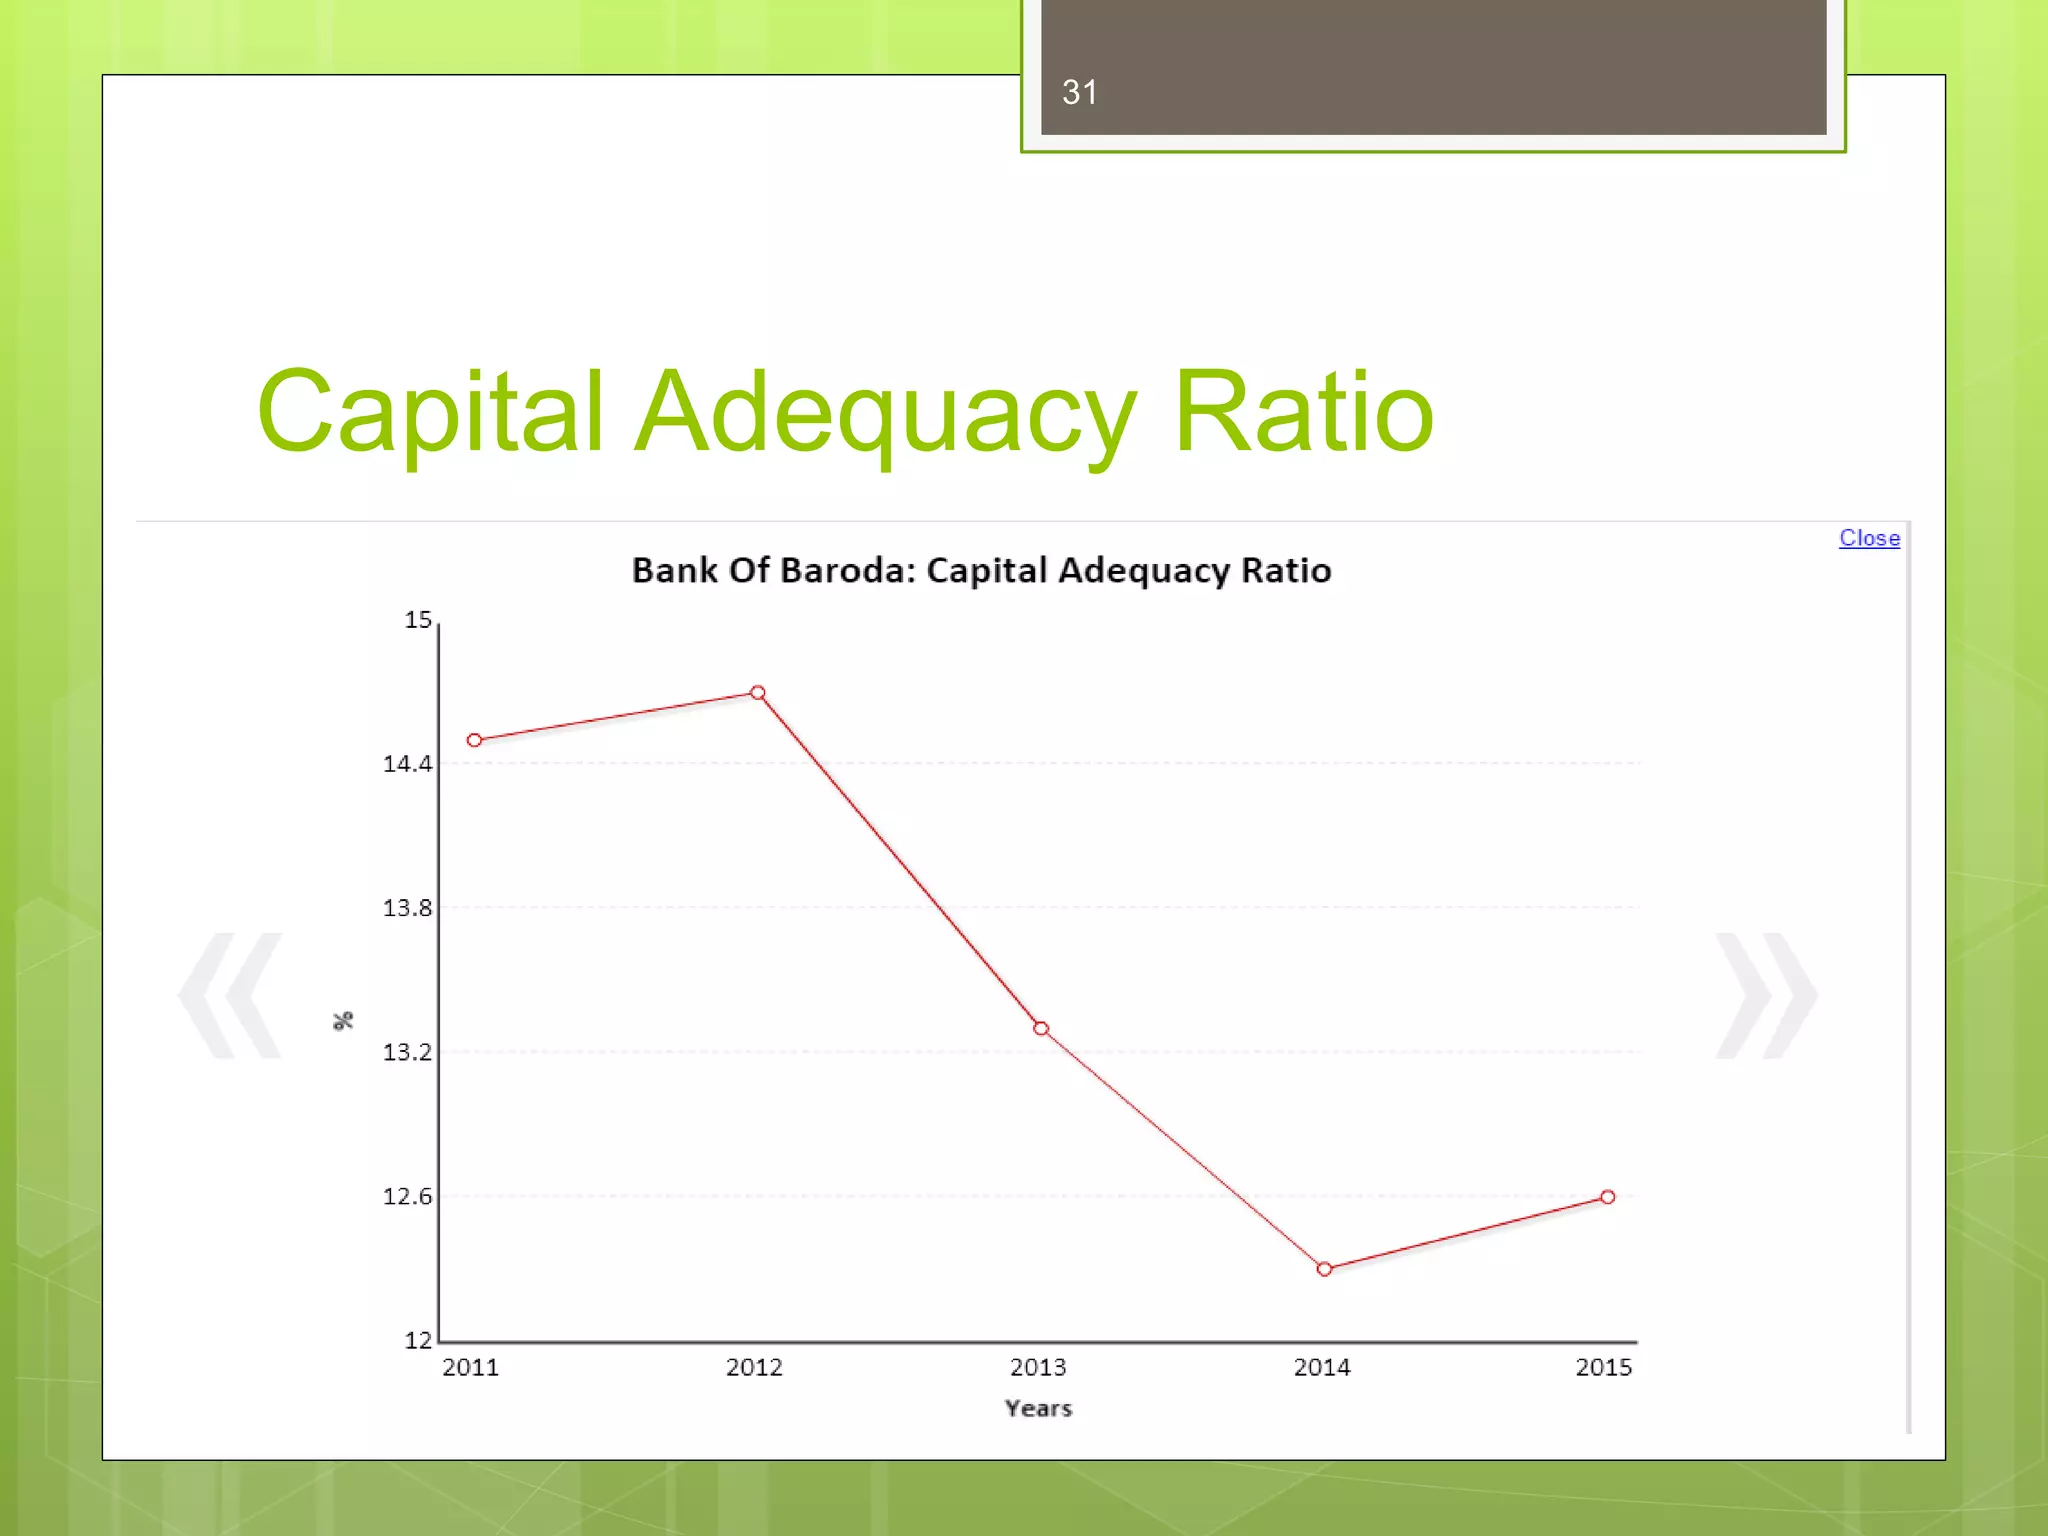
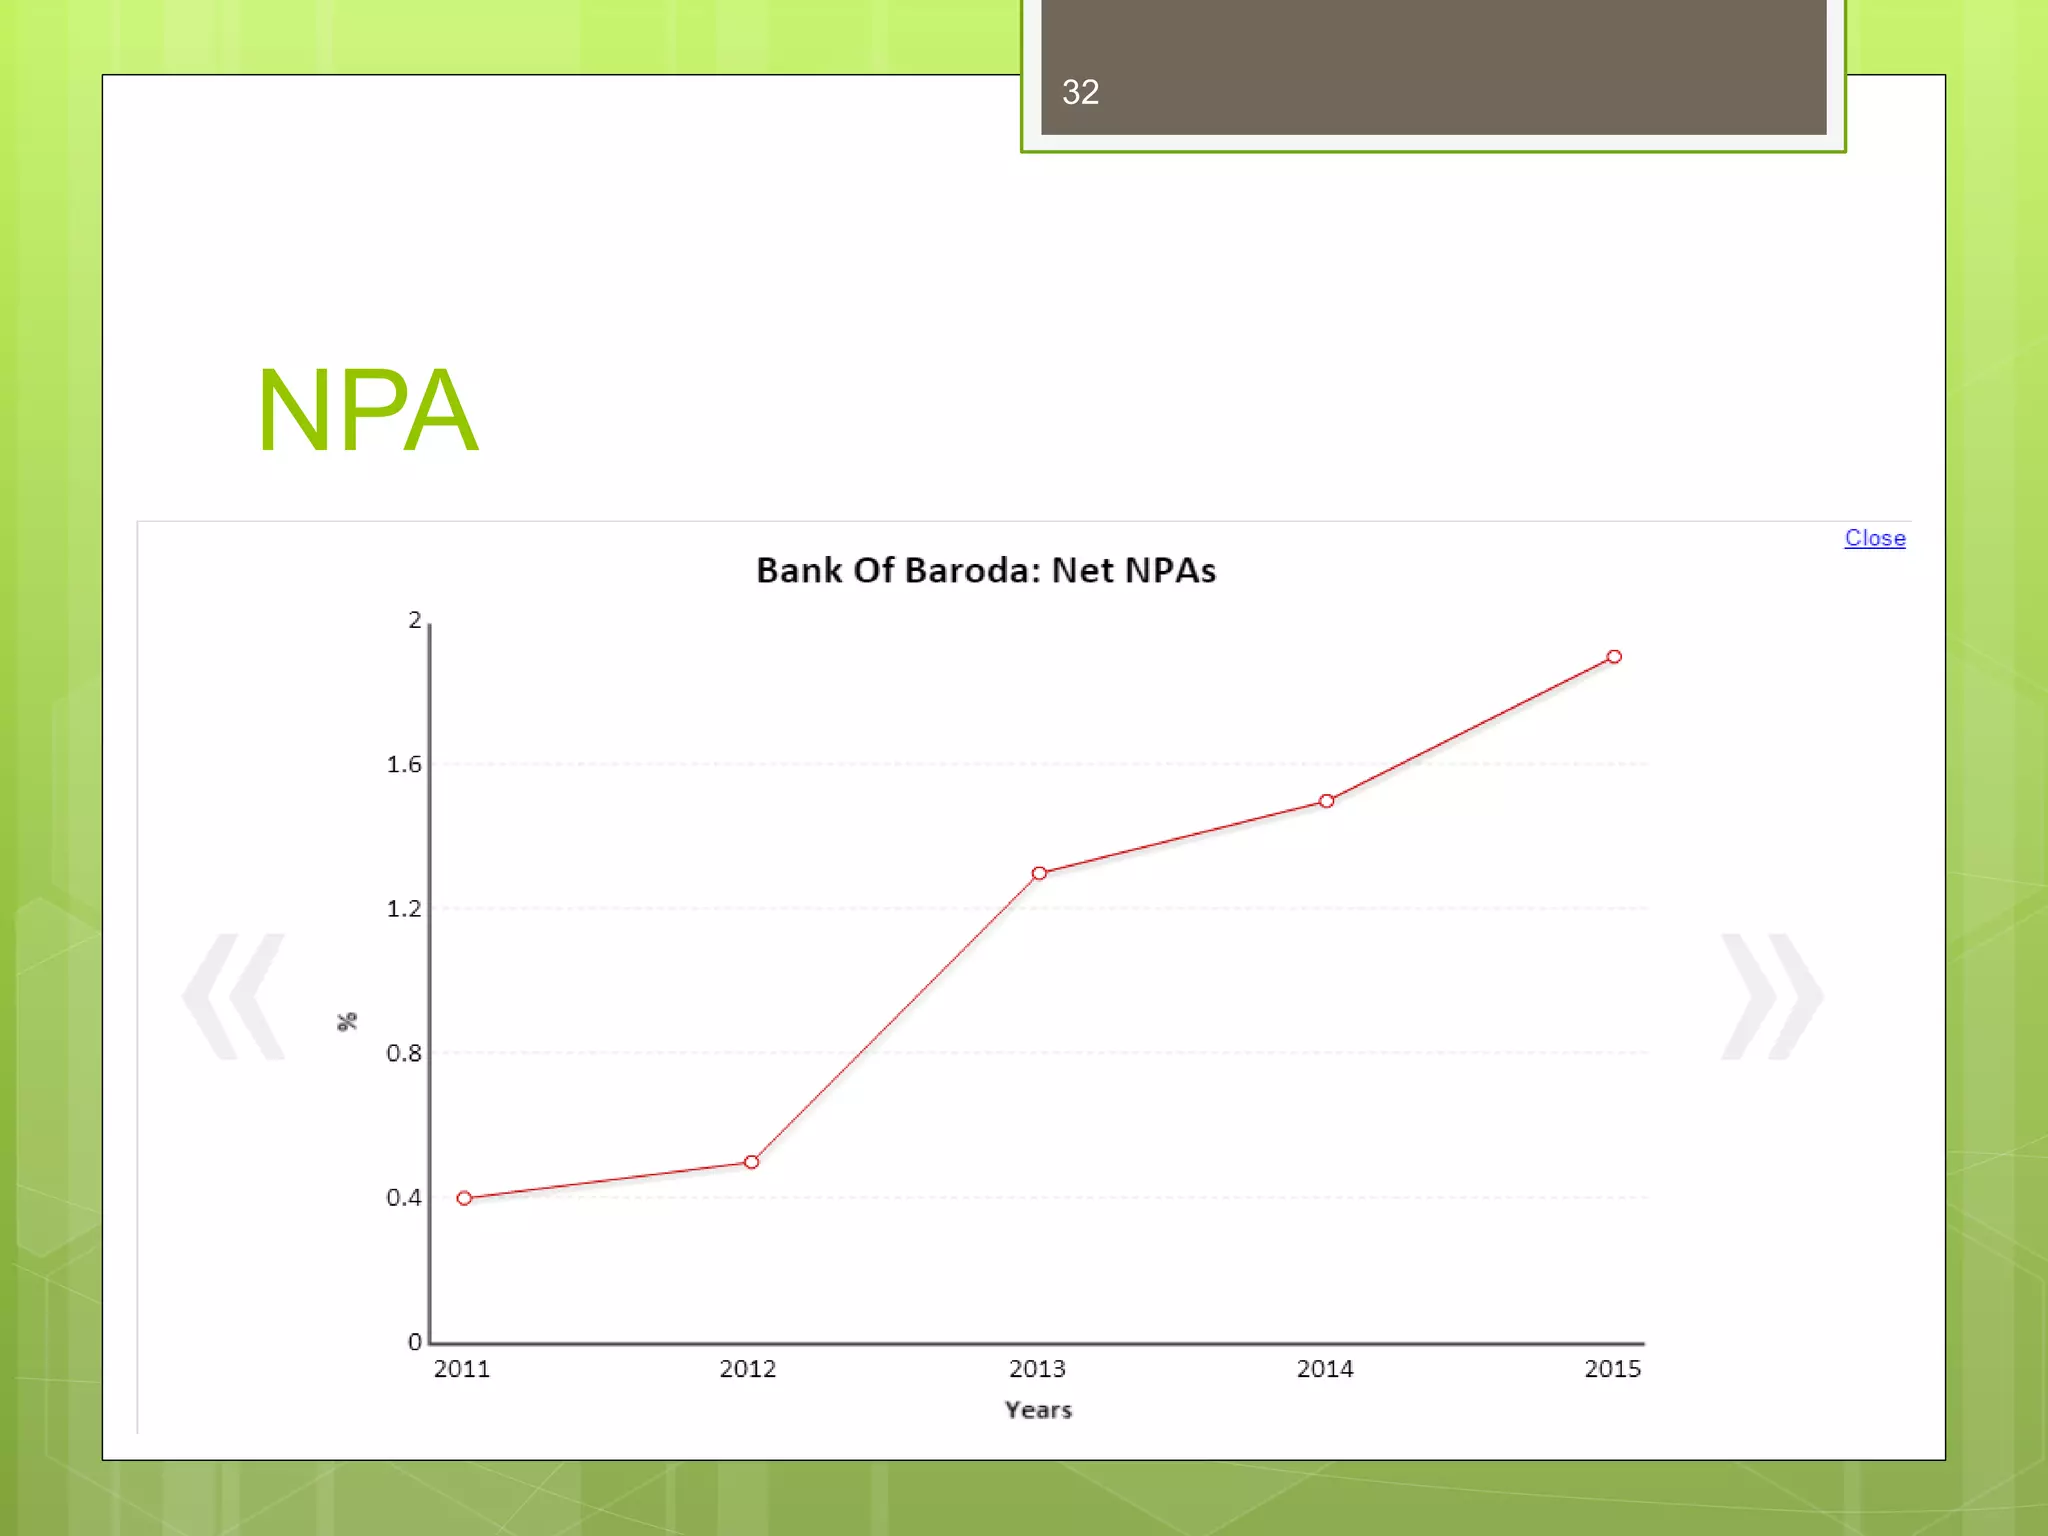
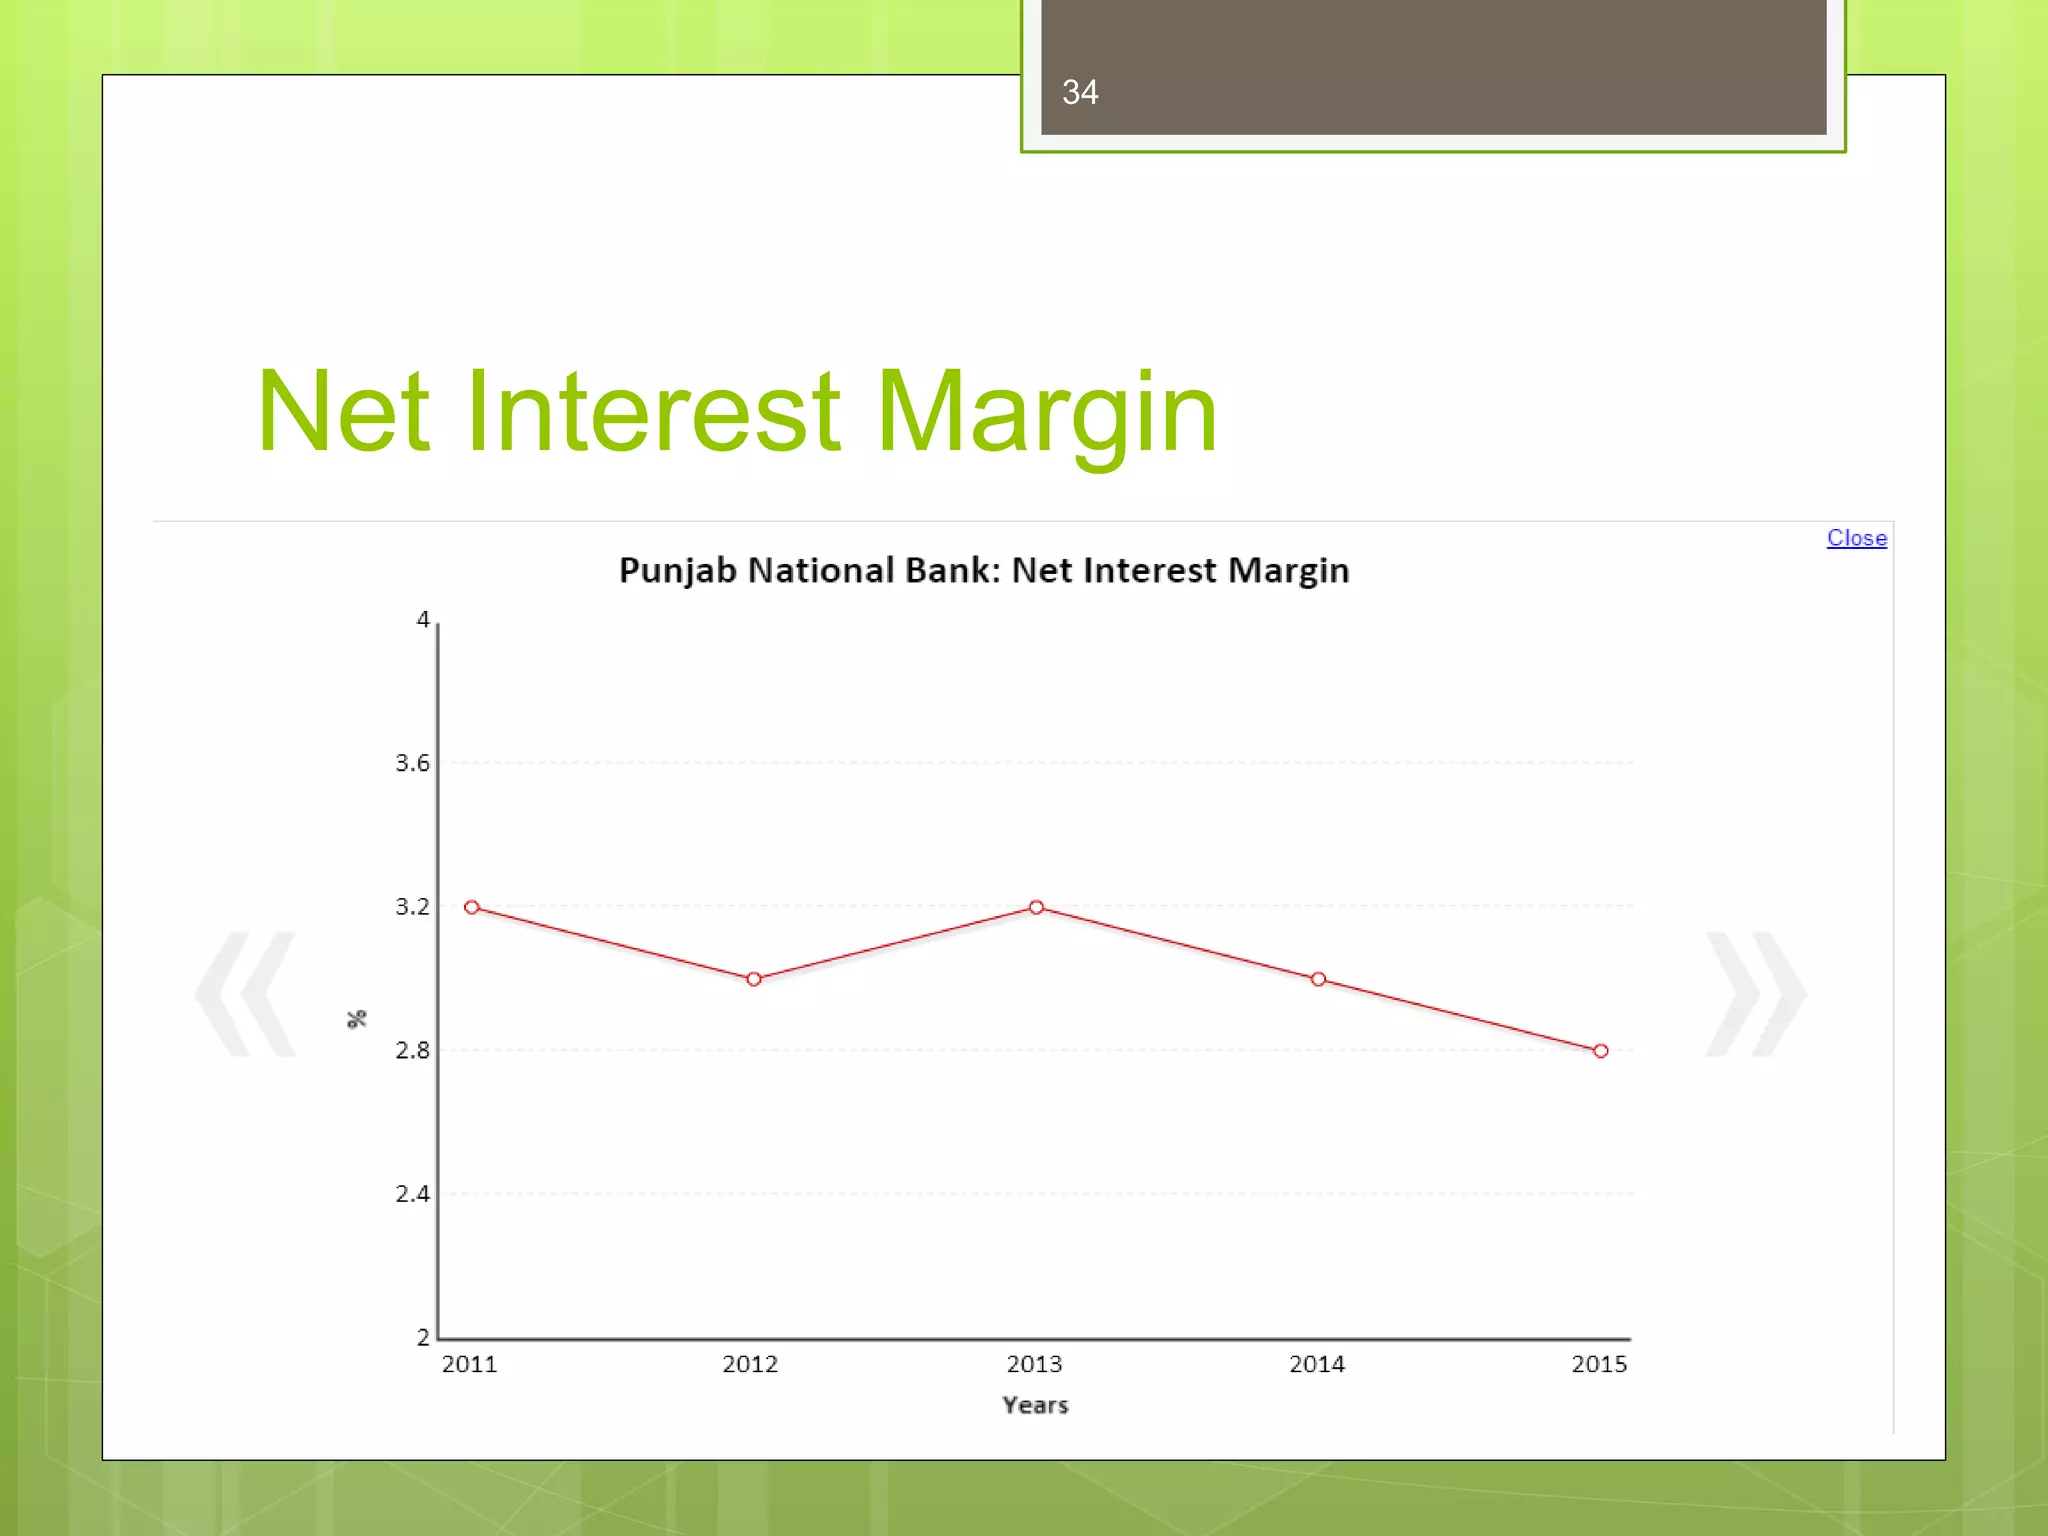
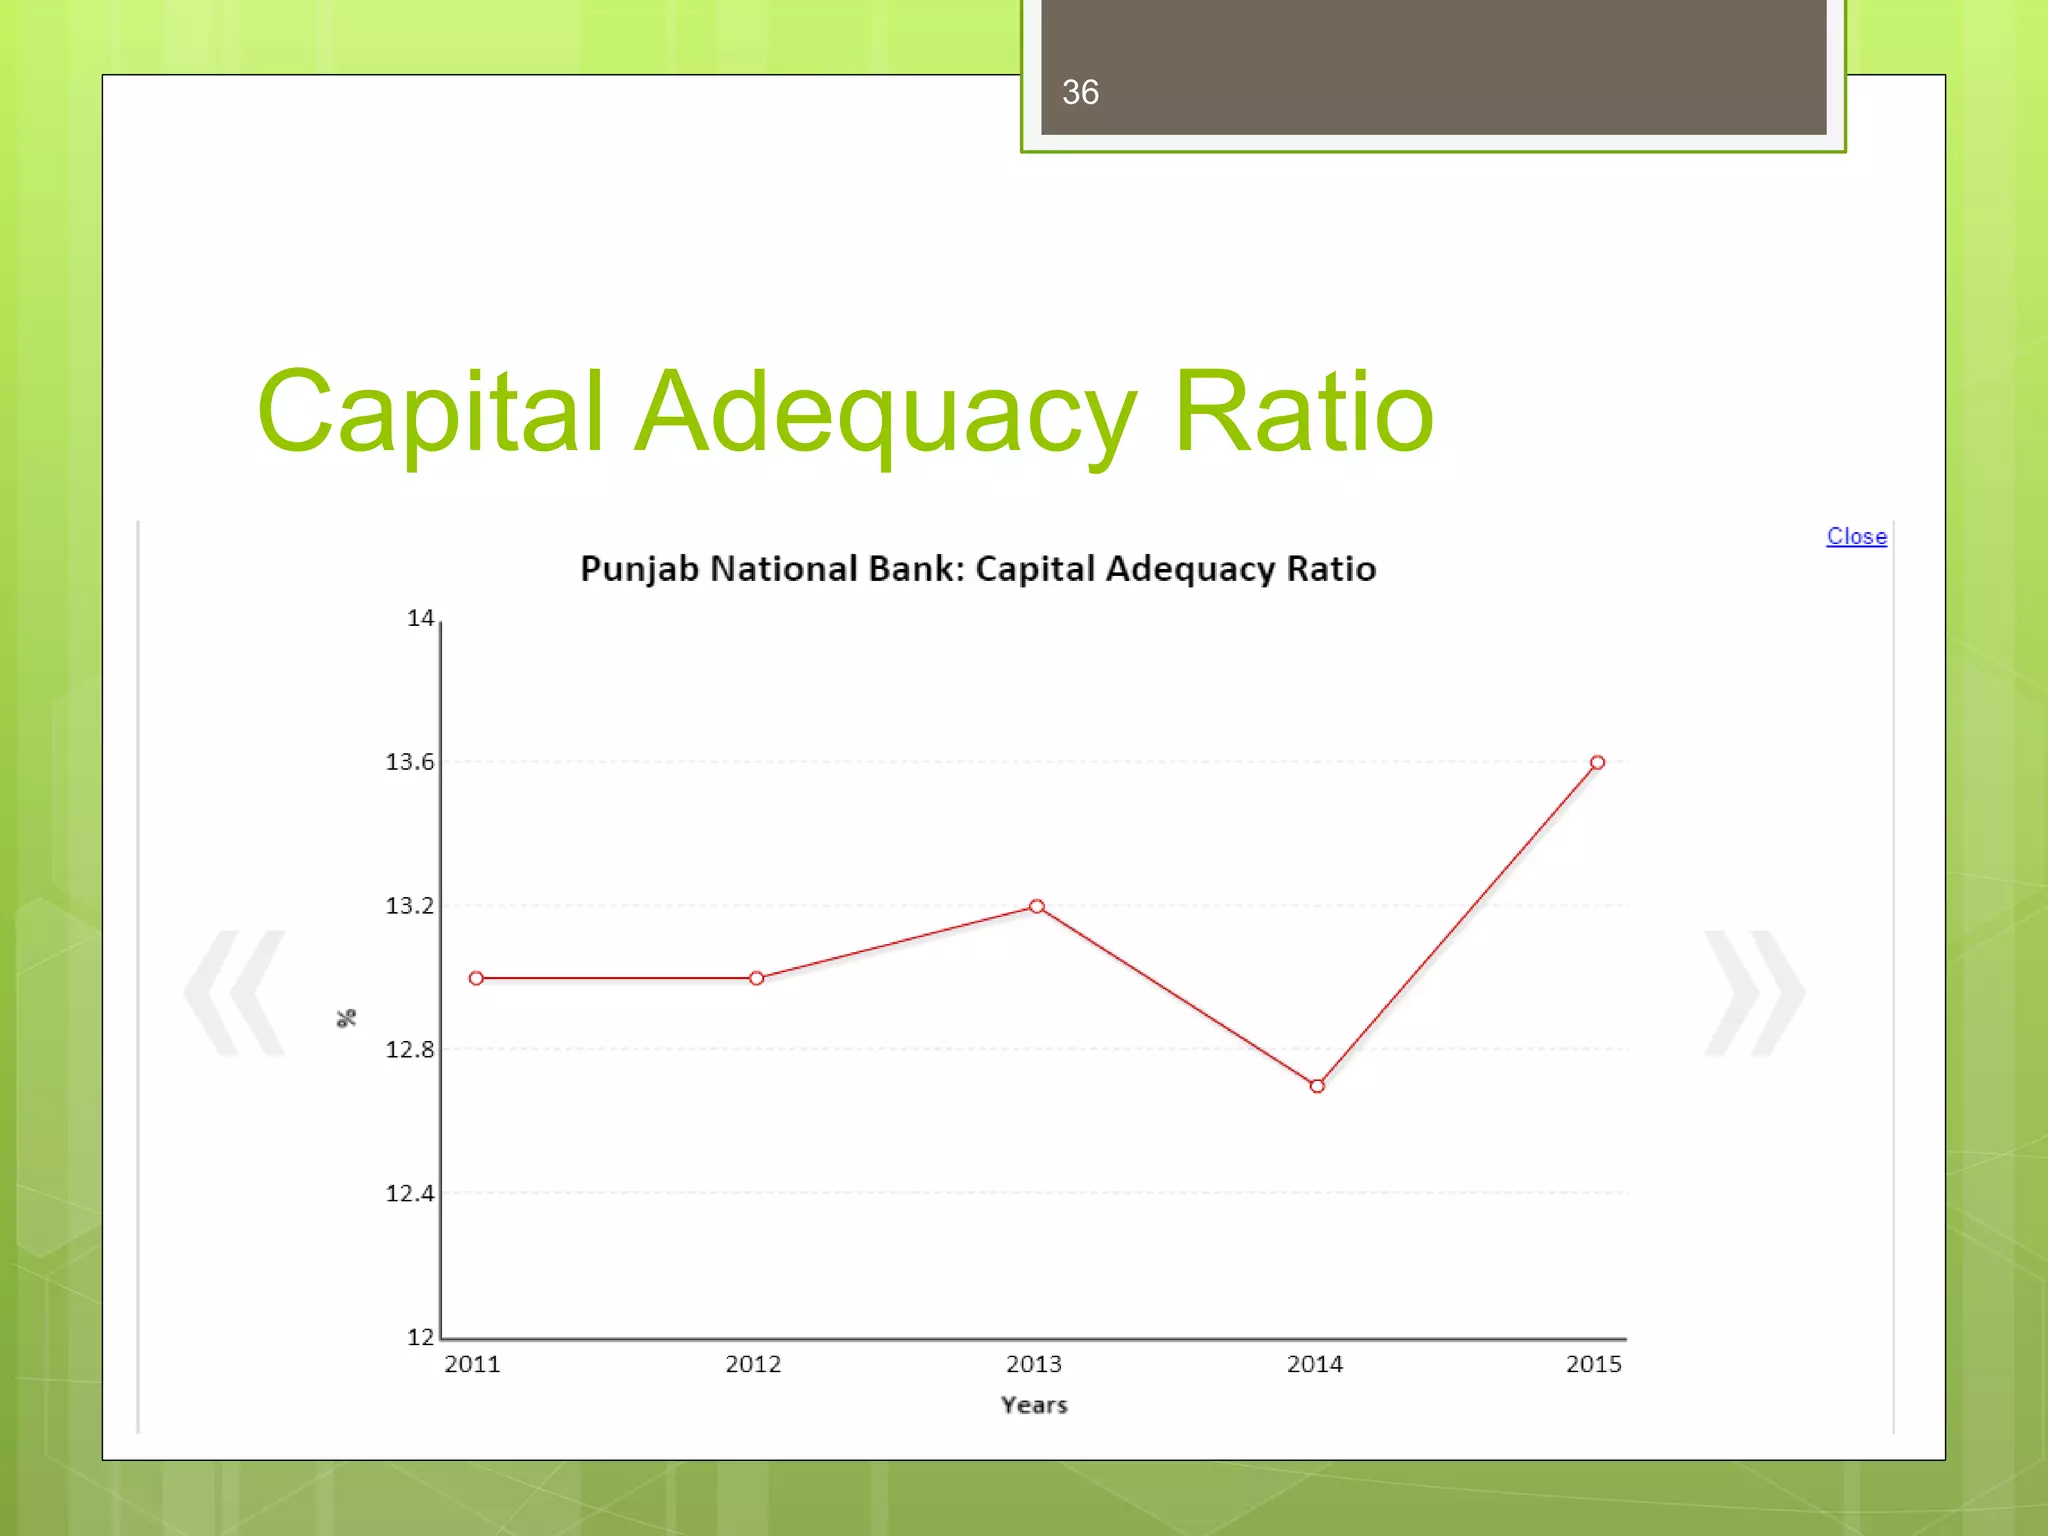
FUNDAMENTAL
ANALYSIS OF
BANKING
SECTOR
Presented by:-
Himanshu Shrimali
B2F-13
1
INTRODUCTION
 The efficient, dynamic and effective banking
sector plays a very important role in accelerating
the rate of economic growth in any economy.
 The Government of India introduced economic
and financial sector reforms in 1991 and banking
sector reforms were part and parcel of financial
sector reforms.
 These were initiated in 1991 to make Indian
banking sector more efficient, strong and
2
Purpose
 The main purpose of the banking sector
analysis is to examine a risk and return
characteristics of public sector banks and
private sector banks .
 The main aim is to know which bank sector is
worthwhile to invest.
 And which sector is more beneficial for
economic purpose.
3
Research objective
 To study the concept and techniques of
fundamental analysis.
 To evaluate 3 public sector banks and 3
private sector banks.
 To do the Comparative study of private sector
and public sector Banks.
 To study the growth trends in banking sector.
4
Methodology
Seconder source data collection by:-
 Equitymaster.com
 Moneycontrol.com
 Birla sun life.com
 Official websites of banks.
 Financial accounting
5
Major players in industry
 Public sector banks – SBI, PNB, Bank of
Baroda, Bank of India etc.
 Private sector banks- HDFC, ICICI Bank,
AXIS Bank, Yes Bank etc.
 Foreign Banks – Standard Chartered Bank,
HSBC, City Bank etc.
 Regional Rural Banks – Andhra Pradesh
gramin bank , Uttranchal Gramin Bank etc.
6
Ratios
 Net Interest Margin
 Capital Adequacy Ratio
 Net Interest Income
 Non Performing Assets
 CASA
 Loans
7
AXIS Bank
2013 2014 2015
Net int. margin 2.9% 3.2% 3.2%
Net int.
income
96886 120330 143862
Capital
adequacy ratio
17.0% 16.1% 15.1%
NPA 0.4% 0.4% 0.4%
8
Net Interest Margin
9
Net Interest Income
10
Capital Adequacy Ratio
11
NPA
12
ICICI Bank
2013 2014 2015
Net int. margin 2.6% 2.8% 2.9%
Net int.
income
165992 197686 226459
Capital
adequacy ratio
18.7% 17.7% 17.0%
NPA 0.8% 1.0% 1.6%
13
Net Interest Margin
14
Net Interest Income
15
Capital Adequacy Ratio
16
NPA
17
HDFC Bank
2013 2014 2015
Net int. margin 4.2% 4.0% 4.0%
Net int.
income
161656 191096 233780
Capital
adequacy ratio
16.8% 16.1% 16.8%
NPA 0.2% 0.3% 0.3%
18
Net Interest Margin
19
Net Interest Income
20
Capital Adequacy Ratio
21
NPA
22
State Bank of India
2013 2014 2015
Net int. margin 3.0% 2.9% 2.9%
Net int.
income
611582 675834 747957
Capital
adequacy ratio
12.9% 13.0% 12.8%
NPA 2.1% 2.6% 2.1%
23
Net Interest Margin
24
Net Interest Income
25
Capital Adequacy Ratio
26
NPA
27
Bank of Baroda
2013 2014 2015
Net int. margin 2.2% 1.9% 2.0%
Net int.
income
119556 128585 143684
Capital
adequacy ratio
13.3% 12.3% 12.6%
NPA 1.3% 1.5% 1.9%
28
Net Interest Margin
29
Net Interest Income
30
Capital Adequacy Ratio
31
NPA
32
Punjab National Bank
2013 2014 2015
Net int. margin 3.2% 3.0% 2.8%
Net int.
income
152757 167378 173668
Capital
adequacy ratio
13.2% 12.7% 13.6%
NPA 2.4% 2.9% 4.1%
33
Net Interest Margin
34
Net Interest Income
35
Capital Adequacy Ratio
36
NPA
37
Comparisons 2015
Axis
Bank
ICICI
Bank
HDFC
Bank
SBI BOB PNB
NIM 3.2% 2.9% 4.0% 2.9% 2.0% 2.8%
NII 143862 226459 233780 747957 143684 173668
CAR 15.1% 17.0% 16.8% 12.8% 12.6% 13.6%
NPA 0.4% 1.6% 0.3% 2.1% 1.9% 4.1%
38
Conclusions
 Sector is increasing with total asset size of
81trillion(USD 1.34 trillion).
 Interest rates are high and investors
confidence low resulting in shrinking
investment and GDP growth.
 The gross NPA of banks(PUB+PVT)increased
over the last one year from 3.3% to 3.9% as
on march 2014
39
Refrences
 Equitymaster.com
40
Thank You
41

Fundamental analysis of banking sector