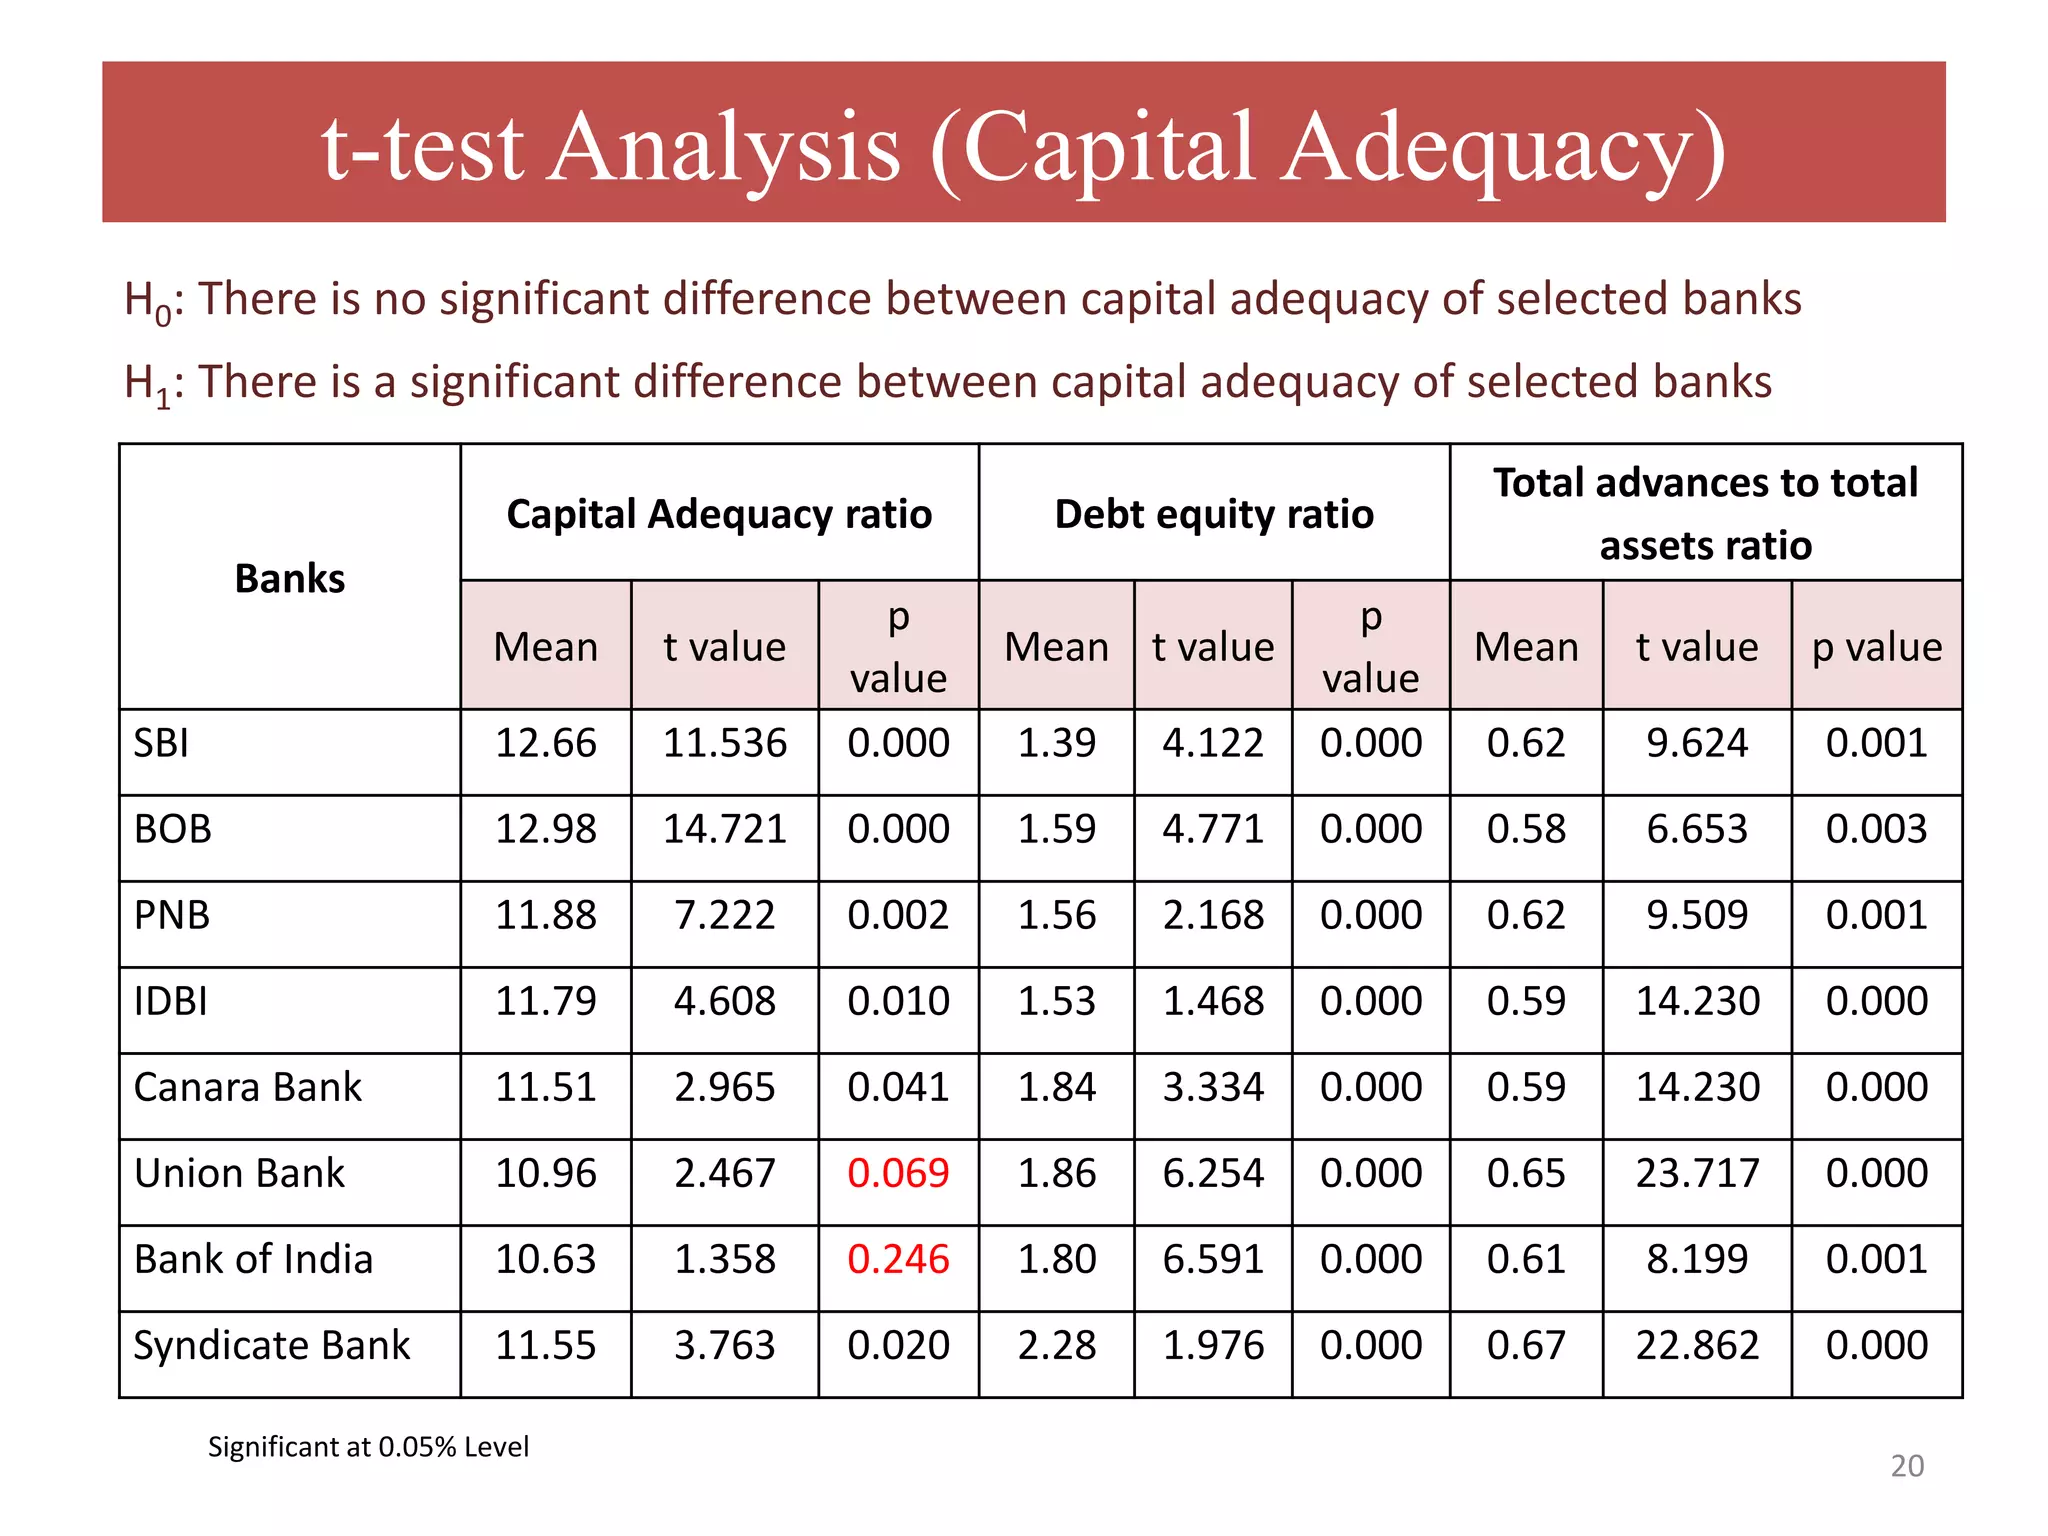
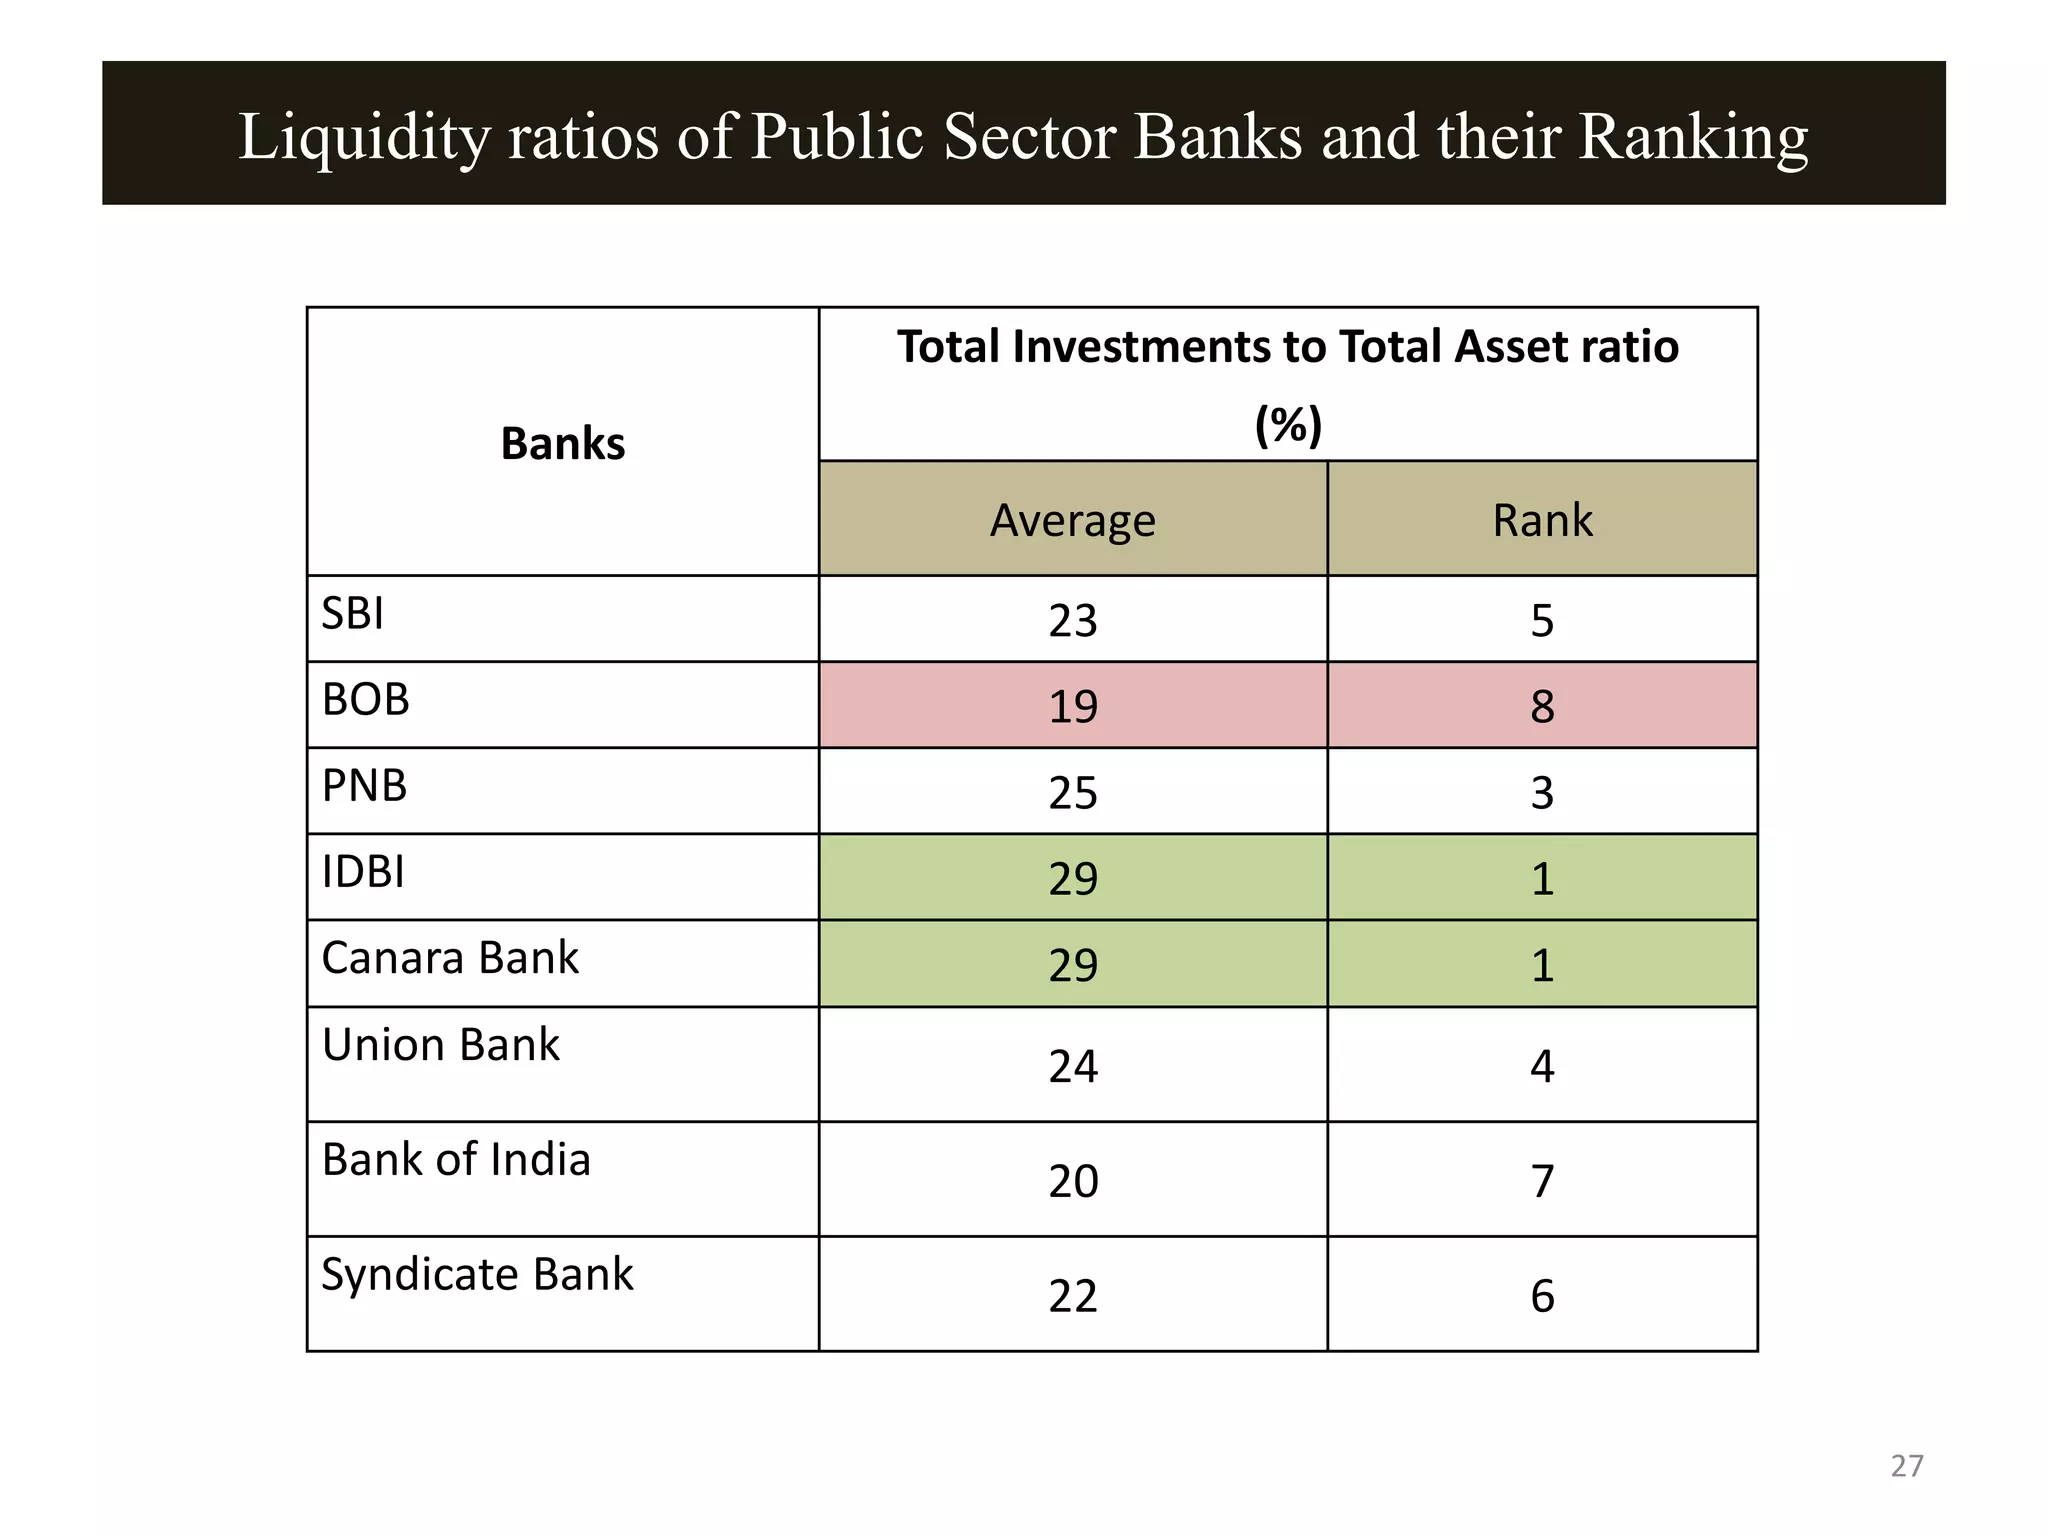
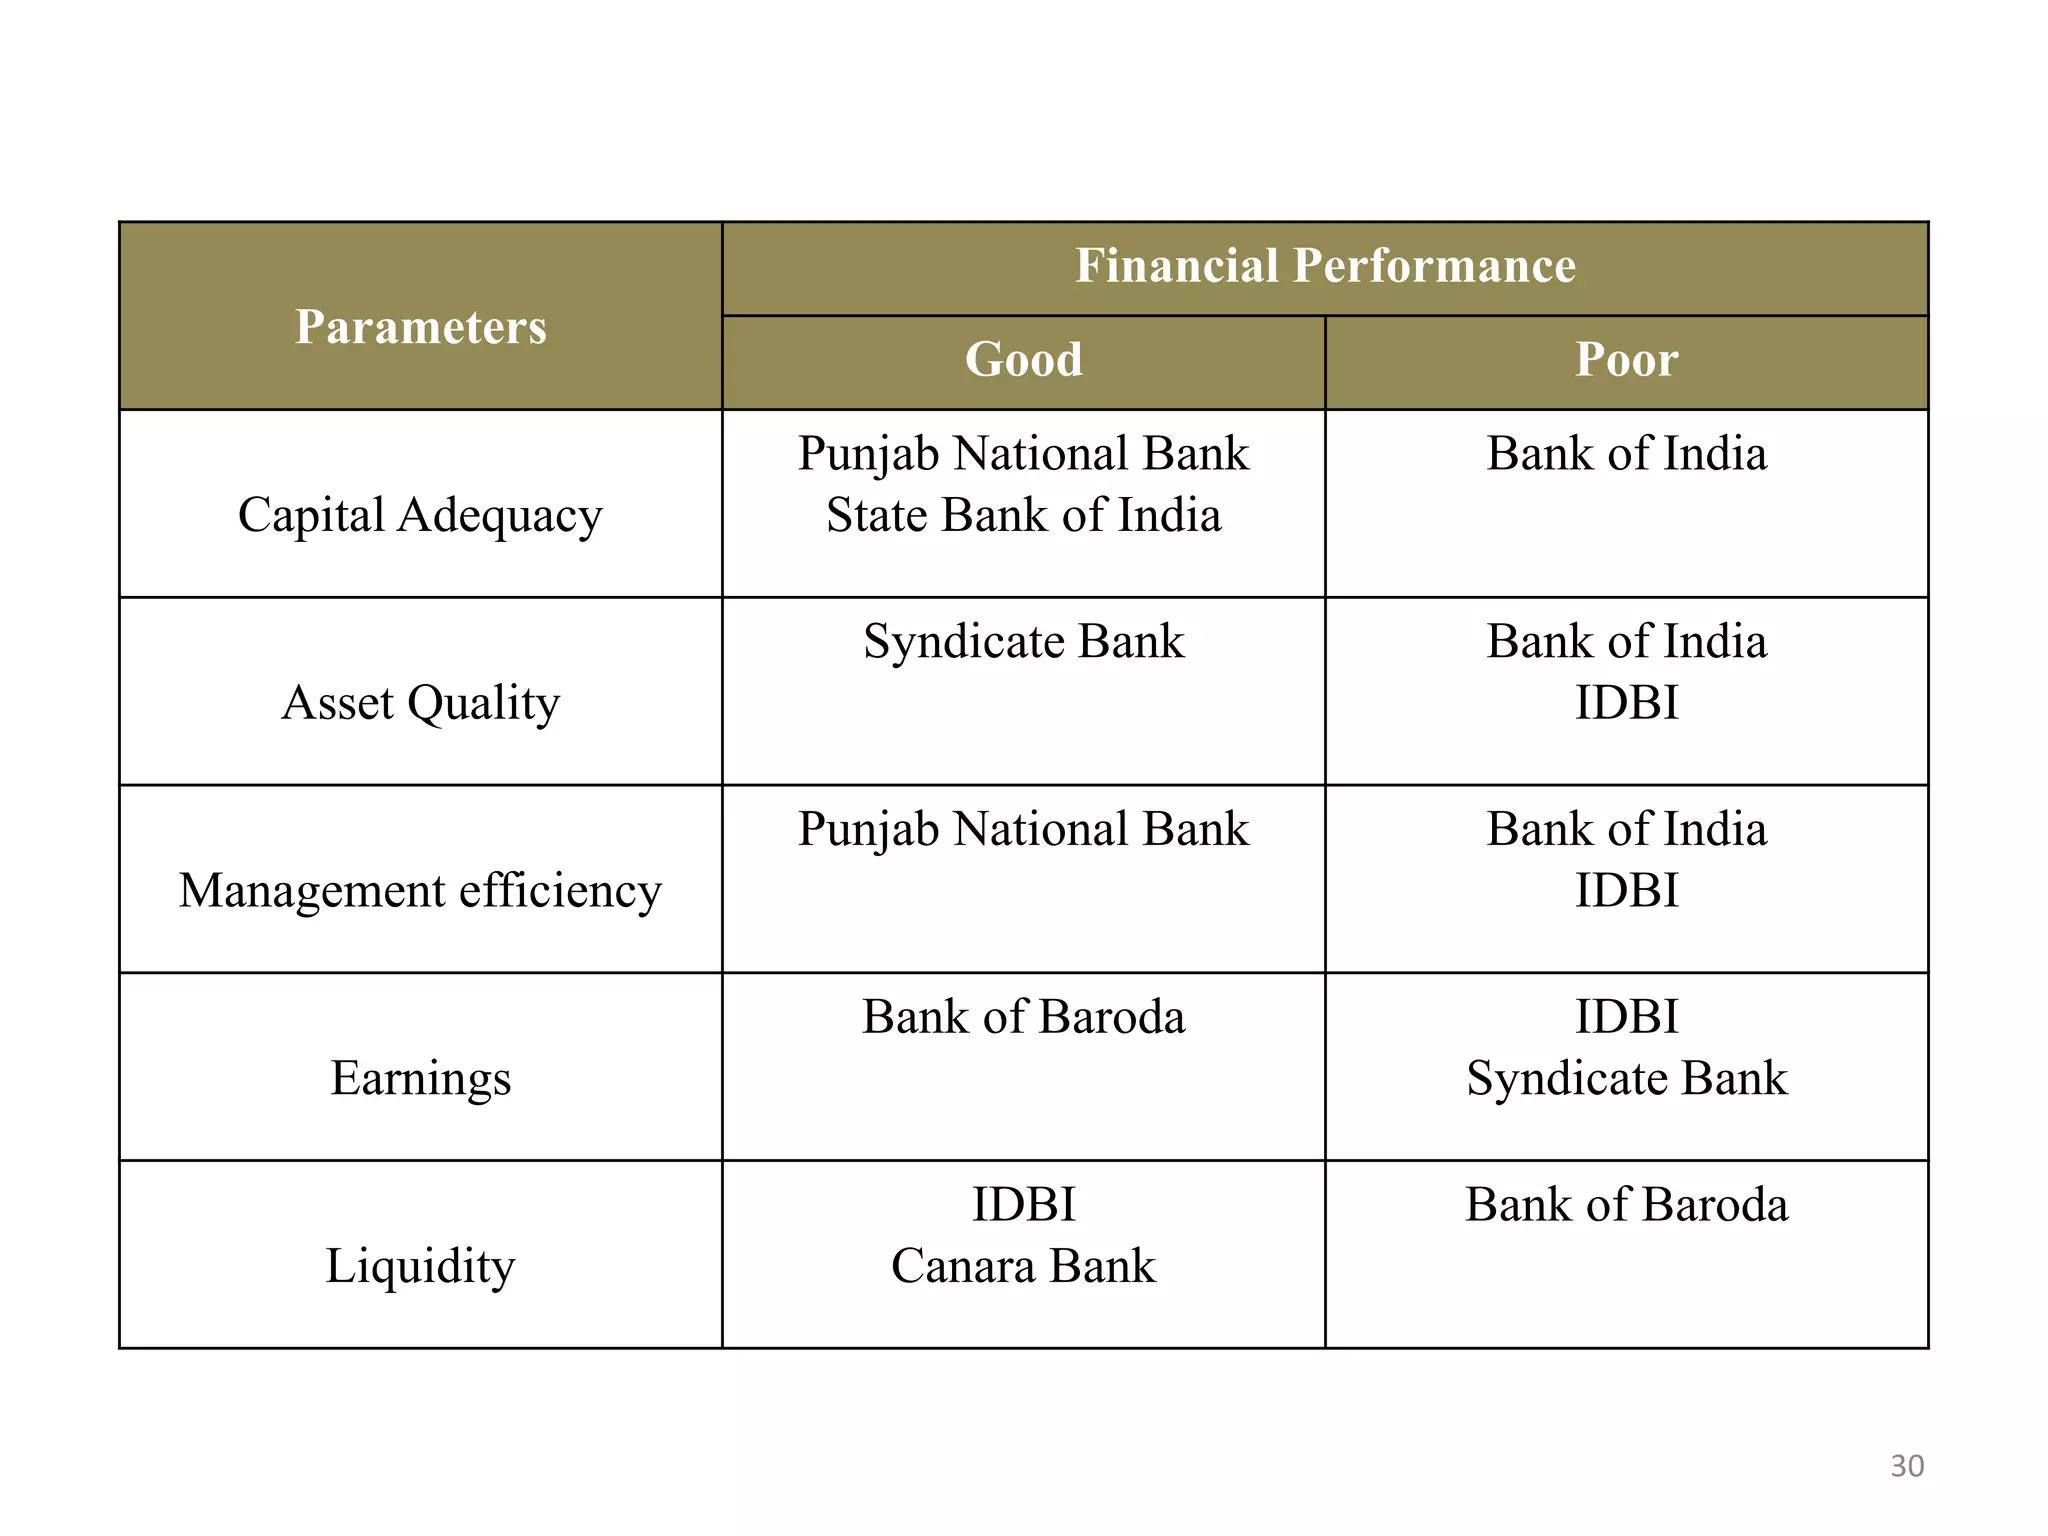
SlideShare a Scribd company logo
ANALYZING FINANCIAL SOUNDNESS OF
PUBLIC SECTOR BANKS IN INDIA USING
CAMEL MODEL
B. Krishnakumare
1
Introduction
Methodology
Findings of the Study
Conclusions
References
CONTENTS
2
INTRODUCTION
3
CAMEL RATING
A rating system, used to evaluate the overall performance of
banks and determine their strengths and weaknesses.
 Padmanabhan Committee (1995) – Reserve Bank of India
 Camel rating – Based on U.S. Federal Reserve (1970)
 CAMEL Commenced in India from 1998
4
ASSET
QUALITY
MANAGEMENT
QUALITY
EARNINGS
LIQUIDITYCAPITAL
ADEQUACY
5
Minimum reserves of
capital which a bank or
other financial institutions
must have.
𝑇𝑖𝑒𝑟 1 𝐶𝑎𝑝𝑖𝑡𝑎𝑙 + 𝑇𝑖𝑒𝑟 2 𝐶𝑎𝑝𝑖𝑡𝑎𝑙
𝑅𝑖𝑠𝑘 𝑤𝑒𝑖𝑔ℎ𝑡𝑒𝑑 𝑎𝑠𝑠𝑒𝑡𝑠
CAPITALADEQUACY RATIO:
CAPITAL ADEQUACY
6
RATIOS USED TO STUDY PARAMETER ‘C’
RATIOS FORMULA PRESCRIBED LEVEL
Capital Adequacy Ratio
Tier 1 Capital + Tier 2 Capital
/ Risk weighted Assets
10%
Debt to Equity Ratio Debt / Equity <1.5
Total Advances to Total
Assets Ratio
Total Advances / Total Assets <0.4
Source: Reserve Bank of India, Official website
7
ASSET QUALITY
• Determines the healthiness
of financial institutions
against loss of value in the
assets.
• An indicator of bank’s
control over its bad debts.
8
RATIOS USED TO STUDY PARAMETER ‘A’
RATIOS FORMULA PRESCRIBED LEVEL
Gross NPA Ratio Gross NPA / Gross Advances 5%
Net NPA Ratio Net NPA / Net Advances 3%
Source: Reserve Bank of India, Official website
9
MANAGEMENT QUALITY
For successful operation a bank needs,
• Competent Management
• Effective policies and guidelines
RATIOS FORMULA PRESCRIBED LEVEL
Asset Turnover Ratio Net Sales / Average Total Assets 0.05
Net Profit Margin Ratio Net Profit / Total Revenue 8.5%
RATIOS USED TO STUDY PARAMETER ‘M’
Source: Reserve Bank of India, Official website
10
• Total income earned by banks
through various sources in
accordance with the guidance
exposed by the regulator.
• Reflects the ability to support
present and future operations.
EARNINGS
11
RATIOS USED TO STUDY PARAMETER ‘E’
RATIOS FORMULA PRESCRIBED LEVEL
Return on Assets
Net Income / Average Total
Assets
1%
Return on Equity
Net Income / Average
Shareholders equity
9.75
Source: Reserve Bank of India, Official website
12
• Most important component
for a bank
• Reflects the capacity of
banks to withstand shocks
to cash flows
LIQUIDITY
13
RATIOS USED TO STUDY PARAMETER ‘L’
RATIOS FORMULA PRESCRIBED LEVEL
Total Investments to Total
Assets Ratio
Total Investments / Total
Assets
>20%
Source: Reserve Bank of India, Official website
14
RESEARCH
METHODOLOGY
15
Research Design Descriptive Research
Sample of the
study
8 Public Sector Banks selected based on their overall
business
Period of Study 5 years (2013-17)
Data Source Secondary data
Annual Reports of selected banks
Statistical tools t test analysis Analysis (using SPSS Software)
Limitation Restricted only to Public Sector Banks
16
S.No Banks
Overall Business
(Rs. Crore)
1 State Bank of India 154,750.96
2 Bank of Baroda 32,762.18
3 Punjab National Bank 15,247.33
4 IDBI 13,588.18
5 Canara Bank 10,710.50
6 Union Bank 7,957.13
7 Bank of India 7,191.48
8 Syndicate Bank 5,178.27
PUBLIC SECTOR BANKS BASED ON THEIR CAPITAL
17
FINDINGS OF
THE STUDY
18
Banks
Capital
Adequacy ratio
Debt to Equity
ratio
Total Advance to
Total Asset ratio
Overall
Ranking
Average Rank Average Rank Average Rank Average Rank
SBI 12.66 2 1.39 1 0.62 5 2.0 1
BOB 12.98 1 1.59 4 0.58 1 4.3 4
PNB 11.88 3 1.56 3 0.62 5 3.0 2
IDBI 11.79 4 1.53 2 0.59 2 4.0 3
Canara Bank 11.51 6 1.84 6 0.59 2 6.0
7
Union Bank 10.96 7 1.86 7 0.65 7 5.3
6
Bank of India 10.63 8 1.80 5 0.61 4 6.0
7
Syndicate Bank 11.55 5 2.28 8 0.67 8 4.7 5
Capital Adequacy Ratios of Public Sector banks and their
Ranking
19
Banks
Capital Adequacy ratio Debt equity ratio
Total advances to total
assets ratio
Mean t value
p
value
Mean t value
p
value
Mean t value p value
SBI 12.66 11.536 0.000 1.39 4.122 0.000 0.62 9.624 0.001
BOB 12.98 14.721 0.000 1.59 4.771 0.000 0.58 6.653 0.003
PNB 11.88 7.222 0.002 1.56 2.168 0.000 0.62 9.509 0.001
IDBI 11.79 4.608 0.010 1.53 1.468 0.000 0.59 14.230 0.000
Canara Bank 11.51 2.965 0.041 1.84 3.334 0.000 0.59 14.230 0.000
Union Bank 10.96 2.467 0.069 1.86 6.254 0.000 0.65 23.717 0.000
Bank of India 10.63 1.358 0.246 1.80 6.591 0.000 0.61 8.199 0.001
Syndicate Bank 11.55 3.763 0.020 2.28 1.976 0.000 0.67 22.862 0.000
t-test Analysis (Capital Adequacy)
H0: There is no significant difference between capital adequacy of selected banks
H1: There is a significant difference between capital adequacy of selected banks
Significant at 0.05% Level
20
Asset quality ratios of Public Sector Banks and their Ranking
Banks
Gross NPA ratio (%) Net NPA ratio (%) Group Ranking
Average Rank Average Rank Average Rank
SBI 5.91 4 3.19 3 4.0 3
BOB 5.90 3 2.89 2 4.3 4
PNB 8.30 7 5.14 7 5.7 6
IDBI 8.94 8 5.39 8 5.7 6
Canara Bank 5.60 2 3.97 5 2.7 1
Union Bank 6.39 5 3.69 4 4.3 4
Bank of India 7.56 6 4.42 6 6.3 8
Syndicate Bank 4.59 1 2.78 1 2.7 1
21
Banks
Net NPA ratio Gross NPA ratio
Mean t value P value Mean t value P value
SBI 3.19 0.338 0.752 5.91 1.051 0.353
BOB 2.89 -0.134 0.900 5.90 0.506 0.640
PNB 5.14 1.654 0.174 8.30 1.794 0.147
IDBI 5.39 1.110 0.329 8.94 1.258 0.277
Canara Bank 3.97 0.928 0.406 5.60 0.368 0.732
Union Bank 3.69 0.731 0.505 6.39 0.904 0.417
Bank of India 4.42 1.160 0.311 7.56 1.106 0.331
Syndicate Bank 2.78 -0.251 0.814 4.59 -0.323 0.763
t-test Analysis (Asset Quality)
H0: There is no significant difference between asset quality of selected banks
H1: There is a significant difference between asset quality of selected banks
Significant at 0.05% Level
22
Management efficiency ratios of Public Sector Banks
and their Ranking
Banks
Asset Turnover ratio
(%)
Net Profit Margin
ratio
(%)
Overall Ranking
Average Rank Average Rank Average Rank
State Bank of India 0.08 2 6.39 4 3 3
Bank of Baroda 0.07 8 9.56 2 5 7
Punjab National Bank 0.08 2 9.84 1 1.5 1
IDBI 0.08 2 -3.36 8 5 7
Canara Bank 0.08 2 3.42 6 4 5
Union Bank 0.09 1 5.16 5 3 3
Bank of India 0.08 2 0.24 7 4.5 6
Syndicate Bank 0.08 2 7.32 3 2.5 2
23
Banks
Asset turnover ratio Net profit margin
Mean t value p value Mean t value p value
SBI 0.088 4.000 0.01 6.39 2.754 0.51
BOB 0.086 -5.715 0.05 9.56 4.509 0.01
PNB 0.082 0.535 0.62 9.84 4.922 0.08
IDBI 0.080 0.000 1.00 -3.36 -0.934 0.40
Canara Bank 0.084 1.000 0.37 3.42 0.733 0.50
Union Bank 0.086 2.449 0.07 5.16 3.257 0.03
Bank of India 0.080 -2.449 0.07 0.24 -0.293 0.78
Syndicate Bank 0.820 1.000 0.37 7.32 3.475 0.02
t-test Analysis (Management efficiency)
H0: There is no significant difference between management efficiency of selected
banks
H1: There is a significant difference between management efficiency of selected banks
Significant at 0.05% Level
24
Earnings’ ratios of Public Sector Banks and their
Ranking
Banks
Return on Assets
(%)
Return on Equity
(%)
Overall Ranking
Average Rank Average Rank Average Rank
SBI 0.62 2 9.10 3 2.5 2
BOB 0.76 1 10.58 1 1 1
PNB 0.55 3 9.44 2 2.5 2
IDBI -0.22 8 -4.99 7 7.5 7
Canara Bank 0.31 5 3.85 6 5.5 6
Union Bank 0.31 5 7.89 4 4.5 4
Bank of India 0.33 4 5.90 5 4.5 4
Syndicate Bank 0.12 7 -7.78 8 7.5 7
25
Banks
Return on Assets Return on equity
Mean t value p value Mean t value p value
SBI 0.62 6.992 0.02 9.10 5.402 0.06
BOB 0.76 10.186 0.01 10.58 3.066 0.03
PNB 0.55 3.790 0.01 9.44 3.625 0.02
IDBI -0.22 -0.539 0.61 -4.99 -1.448 0.22
Canara Bank 0.31 1.362 0.24 3.85 -0.292 0.78
Union Bank 0.31 3.403 0.02 7.89 2.095 0.10
Bank of India 0.33 1.289 0.26 5.90 0.162 0.87
Syndicate Bank 0.12 1.289 0.26 -7.78 0.928 0.40
t-test Analysis (Earnings)
H0: There is no significant difference between earnings of selected banks
H1: There is a significant difference between earnings of selected banks
Significant at 0.05% Level
26
Liquidity ratios of Public Sector Banks and their Ranking
Banks
Total Investments to Total Asset ratio
(%)
Average Rank
SBI 23 5
BOB 19 8
PNB 25 3
IDBI 29 1
Canara Bank 29 1
Union Bank 24 4
Bank of India 20 7
Syndicate Bank 22 6
27
t-test Analysis (Liquidity)
Banks
Total investment to total ratio
Mean t value P value
SBI 23 5.667 0.05
BOB 19 -1.222 0.28
PNB 25 7.071 0.02
IDBI 29 4.916 0.08
Canara Bank 29 4.914 0.07
Union Bank 24 6.332 0.03
Bank of India 20 -1.633 0.17
Syndicate Bank 22 6.532 0.03
H0: There is no significant difference between liquidity of selected banks
H1: There is a significant difference between liquidity of selected banks
Significant at 0.05% Level
28
CONCLUSION
29
Parameters
Financial Performance
Good Poor
Capital Adequacy
Punjab National Bank
State Bank of India
Bank of India
Asset Quality
Syndicate Bank Bank of India
IDBI
Management efficiency
Punjab National Bank Bank of India
IDBI
Earnings
Bank of Baroda IDBI
Syndicate Bank
Liquidity
IDBI
Canara Bank
Bank of Baroda
30
Banks C A M E L Average Rank
SBI 2.0 4.0 3 2.5 5 3.3 2
BOB 4.3 4.3 5 1 8 4.52 5
PNB 3.0 5.7 1.5 2.5 3 3.14 1
IDBI 4.0 5.7 5 7.5 1 4.64 6
Canara Bank 6.0 2.7 4 5.5 1 3.84 3
Union Bank 5.3 4.3 3 4.5 4 4.22 4
Bank of India 6.0 6.3 4.5 4.5 7 5.66 8
Syndicate Bank 4.7 2.7 2.5 7.5 6 4.68 7
Overall Performance of Public Sector Banks
31
REFERENCES
• Angela Roman and Alina Camelia (2013) “Analyzing the Financial
Soundness of the Commercial Banks in Romania: An Approach Based on
CAMELS framework” Procedia Economics and Finance, 6(2013):703-712.
• Annual Reports of Public Sector Banks, 2013-17.
• Evan O, Leone A M, Gill M and Hilbers P (2000) Macro prudential
Indicators of Financial System Soundness, IMF Occasional Paper, no.192.
• IMF and World Bank (2005) Financial sector Assessment: A Handbook.
• Master Circulars (2016-17), Prudential Norms on Capital Adequacy,
Reserve Bank of India.
32

More Related Content

What's hot

Working capital management of maharashtra bank
Working capital management of maharashtra bankWorking capital management of maharashtra bank
Working capital management of maharashtra bankDharmik
 
Securitization
SecuritizationSecuritization
SecuritizationDharmik
 
Role of Commercial Bank for economic Sustainabilty
Role of Commercial Bank for economic SustainabiltyRole of Commercial Bank for economic Sustainabilty
Role of Commercial Bank for economic SustainabiltyMd Chowdhury
 
Capital market
Capital market Capital market
Capital market
Rahul Jain
 
Risk Management in NBFC
Risk Management in NBFCRisk Management in NBFC
Risk Management in NBFC
Sumeet Main
 
12. npa & recovery management
12. npa & recovery management12. npa & recovery management
12. npa & recovery managementRatnesh Ratn
 
Credit appraisal SYSTEM
Credit appraisal SYSTEMCredit appraisal SYSTEM
Credit appraisal SYSTEM
Anil Chaurasiya
 
Basel introduction
Basel introductionBasel introduction
Basel introduction
asfhaq
 
Camel ratings ppt
Camel ratings pptCamel ratings ppt
Camel ratings ppt
Sagar Patil
 
Non performing asset (npa)
Non performing asset (npa)Non performing asset (npa)
Non performing asset (npa)Dharmik
 
Internship report (nrb)
Internship report (nrb)Internship report (nrb)
Internship report (nrb)
Pawan Kawan
 
Bank analysis and rating using the CAMEL model
Bank analysis and rating using the CAMEL modelBank analysis and rating using the CAMEL model
Bank analysis and rating using the CAMEL modelRoger Aung
 
Dedication,Letter of submission,Executive summary-" Financial Performance Ana...
Dedication,Letter of submission,Executive summary-" Financial Performance Ana...Dedication,Letter of submission,Executive summary-" Financial Performance Ana...
Dedication,Letter of submission,Executive summary-" Financial Performance Ana...
Md. Shohel Rana
 
Credit appraisal in sbi bank project6 report
Credit appraisal in  sbi bank project6 report Credit appraisal in  sbi bank project6 report
Credit appraisal in sbi bank project6 report
Babasab Patil
 
Liability management in Banks focus on Deposits
Liability management in Banks focus on DepositsLiability management in Banks focus on Deposits
Liability management in Banks focus on Deposits
D V Srinivas Rao
 
“Credit Risk Management” A comparative analysis on three selected Banks- (Na...
“Credit Risk Management”  A comparative analysis on three selected Banks- (Na...“Credit Risk Management”  A comparative analysis on three selected Banks- (Na...
“Credit Risk Management” A comparative analysis on three selected Banks- (Na...
Ashis Barman
 

What's hot (20)

Basel 2
Basel 2Basel 2
Basel 2
 
Basel Norms
Basel NormsBasel Norms
Basel Norms
 
Working capital management of maharashtra bank
Working capital management of maharashtra bankWorking capital management of maharashtra bank
Working capital management of maharashtra bank
 
Finance PPT-finance project
Finance PPT-finance projectFinance PPT-finance project
Finance PPT-finance project
 
Securitization
SecuritizationSecuritization
Securitization
 
Basel-2
Basel-2Basel-2
Basel-2
 
Role of Commercial Bank for economic Sustainabilty
Role of Commercial Bank for economic SustainabiltyRole of Commercial Bank for economic Sustainabilty
Role of Commercial Bank for economic Sustainabilty
 
Capital market
Capital market Capital market
Capital market
 
Risk Management in NBFC
Risk Management in NBFCRisk Management in NBFC
Risk Management in NBFC
 
12. npa & recovery management
12. npa & recovery management12. npa & recovery management
12. npa & recovery management
 
Credit appraisal SYSTEM
Credit appraisal SYSTEMCredit appraisal SYSTEM
Credit appraisal SYSTEM
 
Basel introduction
Basel introductionBasel introduction
Basel introduction
 
Camel ratings ppt
Camel ratings pptCamel ratings ppt
Camel ratings ppt
 
Non performing asset (npa)
Non performing asset (npa)Non performing asset (npa)
Non performing asset (npa)
 
Internship report (nrb)
Internship report (nrb)Internship report (nrb)
Internship report (nrb)
 
Bank analysis and rating using the CAMEL model
Bank analysis and rating using the CAMEL modelBank analysis and rating using the CAMEL model
Bank analysis and rating using the CAMEL model
 
Dedication,Letter of submission,Executive summary-" Financial Performance Ana...
Dedication,Letter of submission,Executive summary-" Financial Performance Ana...Dedication,Letter of submission,Executive summary-" Financial Performance Ana...
Dedication,Letter of submission,Executive summary-" Financial Performance Ana...
 
Credit appraisal in sbi bank project6 report
Credit appraisal in  sbi bank project6 report Credit appraisal in  sbi bank project6 report
Credit appraisal in sbi bank project6 report
 
Liability management in Banks focus on Deposits
Liability management in Banks focus on DepositsLiability management in Banks focus on Deposits
Liability management in Banks focus on Deposits
 
“Credit Risk Management” A comparative analysis on three selected Banks- (Na...
“Credit Risk Management”  A comparative analysis on three selected Banks- (Na...“Credit Risk Management”  A comparative analysis on three selected Banks- (Na...
“Credit Risk Management” A comparative analysis on three selected Banks- (Na...
 

Similar to Analyzing financial soundness using camel model

Comparative analysis
Comparative analysisComparative analysis
Comparative analysis
Akshaya Nanodkar
 
Non-Performing Assets by Rahul Kalawade
Non-Performing Assets by Rahul Kalawade Non-Performing Assets by Rahul Kalawade
Non-Performing Assets by Rahul Kalawade
RahulKalawade
 
Nb pb
Nb pbNb pb
Psb open-forum-of-final-banking
Psb open-forum-of-final-bankingPsb open-forum-of-final-banking
Psb open-forum-of-final-bankingMOSPlanning
 
KPI and CAMEL analysis of axis and idbi bank
KPI and CAMEL analysis of axis and idbi bankKPI and CAMEL analysis of axis and idbi bank
KPI and CAMEL analysis of axis and idbi bank
Neel VVN
 
Fundamental analysis of banking sector
Fundamental analysis of banking sectorFundamental analysis of banking sector
Fundamental analysis of banking sector
himanshu shrimali
 
CAMEL ANALYSIS OF BIG FOUR BANKS IN INDIA
CAMEL ANALYSIS OF BIG FOUR BANKS IN INDIACAMEL ANALYSIS OF BIG FOUR BANKS IN INDIA
CAMEL ANALYSIS OF BIG FOUR BANKS IN INDIA
Pradeep Kumar
 
Bank management
Bank managementBank management
Bank management
Ranga Naik
 
Institutional research report sbi
Institutional research report  sbiInstitutional research report  sbi
Institutional research report sbi
Choice Equity
 
Non Performing Asset (NPA)
Non Performing Asset (NPA)Non Performing Asset (NPA)
Non Performing Asset (NPA)
JyotiranjanSahoo30
 
Role of banks in financial inclusion of solapur district
Role of banks in financial inclusion of solapur districtRole of banks in financial inclusion of solapur district
Role of banks in financial inclusion of solapur district
Shivaji Shinde
 
Banking hdfc pms ppt
Banking hdfc pms pptBanking hdfc pms ppt
Banking hdfc pms ppt
Jyotirmoy Pegu
 
Performance evaluation of_pnb
Performance evaluation of_pnbPerformance evaluation of_pnb
Performance evaluation of_pnb
shruti_kapur
 
statebankofindia-131205003551-phpapp02.pdf
statebankofindia-131205003551-phpapp02.pdfstatebankofindia-131205003551-phpapp02.pdf
statebankofindia-131205003551-phpapp02.pdf
PRAVEENKUMARN48
 
Csr spending of indian banking sector
Csr spending of indian banking sectorCsr spending of indian banking sector
Csr spending of indian banking sector
Naresh Alla
 
Performance of banks in india 2011
Performance of banks in india 2011Performance of banks in india 2011
Performance of banks in india 2011domsr
 
“Satisfaction level for banking services a case study of hdfc bank customers”
“Satisfaction level for banking services a case study of hdfc bank customers”“Satisfaction level for banking services a case study of hdfc bank customers”
“Satisfaction level for banking services a case study of hdfc bank customers”Nawa Raj Karki
 

Similar to Analyzing financial soundness using camel model (20)

Comparative analysis
Comparative analysisComparative analysis
Comparative analysis
 
Non-Performing Assets by Rahul Kalawade
Non-Performing Assets by Rahul Kalawade Non-Performing Assets by Rahul Kalawade
Non-Performing Assets by Rahul Kalawade
 
Nb pb
Nb pbNb pb
Nb pb
 
Psb open-forum-of-final-banking
Psb open-forum-of-final-bankingPsb open-forum-of-final-banking
Psb open-forum-of-final-banking
 
KPI and CAMEL analysis of axis and idbi bank
KPI and CAMEL analysis of axis and idbi bankKPI and CAMEL analysis of axis and idbi bank
KPI and CAMEL analysis of axis and idbi bank
 
Fundamental analysis of banking sector
Fundamental analysis of banking sectorFundamental analysis of banking sector
Fundamental analysis of banking sector
 
CAMEL ANALYSIS OF BIG FOUR BANKS IN INDIA
CAMEL ANALYSIS OF BIG FOUR BANKS IN INDIACAMEL ANALYSIS OF BIG FOUR BANKS IN INDIA
CAMEL ANALYSIS OF BIG FOUR BANKS IN INDIA
 
Bank management
Bank managementBank management
Bank management
 
Institutional research report sbi
Institutional research report  sbiInstitutional research report  sbi
Institutional research report sbi
 
Non Performing Asset (NPA)
Non Performing Asset (NPA)Non Performing Asset (NPA)
Non Performing Asset (NPA)
 
Role of banks in financial inclusion of solapur district
Role of banks in financial inclusion of solapur districtRole of banks in financial inclusion of solapur district
Role of banks in financial inclusion of solapur district
 
Banking hdfc pms ppt
Banking hdfc pms pptBanking hdfc pms ppt
Banking hdfc pms ppt
 
Performance evaluation of_pnb
Performance evaluation of_pnbPerformance evaluation of_pnb
Performance evaluation of_pnb
 
statebankofindia-131205003551-phpapp02.pdf
statebankofindia-131205003551-phpapp02.pdfstatebankofindia-131205003551-phpapp02.pdf
statebankofindia-131205003551-phpapp02.pdf
 
Csr spending of indian banking sector
Csr spending of indian banking sectorCsr spending of indian banking sector
Csr spending of indian banking sector
 
Performance of banks in india 2011
Performance of banks in india 2011Performance of banks in india 2011
Performance of banks in india 2011
 
Banking industry
Banking industry Banking industry
Banking industry
 
Canara
CanaraCanara
Canara
 
“Satisfaction level for banking services a case study of hdfc bank customers”
“Satisfaction level for banking services a case study of hdfc bank customers”“Satisfaction level for banking services a case study of hdfc bank customers”
“Satisfaction level for banking services a case study of hdfc bank customers”
 
Factor p
Factor pFactor p
Factor p
 

Recently uploaded

The secret way to sell pi coins effortlessly.
The secret way to sell pi coins effortlessly.The secret way to sell pi coins effortlessly.
The secret way to sell pi coins effortlessly.
DOT TECH
 
what is the best method to sell pi coins in 2024
what is the best method to sell pi coins in 2024what is the best method to sell pi coins in 2024
what is the best method to sell pi coins in 2024
DOT TECH
 
what is a pi whale and how to access one.
what is a pi whale and how to access one.what is a pi whale and how to access one.
what is a pi whale and how to access one.
DOT TECH
 
APP I Lecture Notes to students 0f 4the year
APP I  Lecture Notes  to students 0f 4the yearAPP I  Lecture Notes  to students 0f 4the year
APP I Lecture Notes to students 0f 4the year
telilaalilemlem
 
Exploring Abhay Bhutada’s Views After Poonawalla Fincorp’s Collaboration With...
Exploring Abhay Bhutada’s Views After Poonawalla Fincorp’s Collaboration With...Exploring Abhay Bhutada’s Views After Poonawalla Fincorp’s Collaboration With...
Exploring Abhay Bhutada’s Views After Poonawalla Fincorp’s Collaboration With...
beulahfernandes8
 
Turin Startup Ecosystem 2024 - Ricerca sulle Startup e il Sistema dell'Innov...
Turin Startup Ecosystem 2024  - Ricerca sulle Startup e il Sistema dell'Innov...Turin Startup Ecosystem 2024  - Ricerca sulle Startup e il Sistema dell'Innov...
Turin Startup Ecosystem 2024 - Ricerca sulle Startup e il Sistema dell'Innov...
Quotidiano Piemontese
 
how can I sell pi coins after successfully completing KYC
how can I sell pi coins after successfully completing KYChow can I sell pi coins after successfully completing KYC
how can I sell pi coins after successfully completing KYC
DOT TECH
 
BYD SWOT Analysis and In-Depth Insights 2024.pptx
BYD SWOT Analysis and In-Depth Insights 2024.pptxBYD SWOT Analysis and In-Depth Insights 2024.pptx
BYD SWOT Analysis and In-Depth Insights 2024.pptx
mikemetalprod
 
Introduction to Value Added Tax System.ppt
Introduction to Value Added Tax System.pptIntroduction to Value Added Tax System.ppt
Introduction to Value Added Tax System.ppt
VishnuVenugopal84
 
how to sell pi coins on Binance exchange
how to sell pi coins on Binance exchangehow to sell pi coins on Binance exchange
how to sell pi coins on Binance exchange
DOT TECH
 
how to swap pi coins to foreign currency withdrawable.
how to swap pi coins to foreign currency withdrawable.how to swap pi coins to foreign currency withdrawable.
how to swap pi coins to foreign currency withdrawable.
DOT TECH
 
GeM ppt in railway for presentation on gem
GeM ppt in railway  for presentation on gemGeM ppt in railway  for presentation on gem
GeM ppt in railway for presentation on gem
CwierAsn
 
how to sell pi coins in South Korea profitably.
how to sell pi coins in South Korea profitably.how to sell pi coins in South Korea profitably.
how to sell pi coins in South Korea profitably.
DOT TECH
 
The new type of smart, sustainable entrepreneurship and the next day | Europe...
The new type of smart, sustainable entrepreneurship and the next day | Europe...The new type of smart, sustainable entrepreneurship and the next day | Europe...
The new type of smart, sustainable entrepreneurship and the next day | Europe...
Antonis Zairis
 
Scope Of Macroeconomics introduction and basic theories
Scope Of Macroeconomics introduction and basic theoriesScope Of Macroeconomics introduction and basic theories
Scope Of Macroeconomics introduction and basic theories
nomankalyar153
 
The Evolution of Non-Banking Financial Companies (NBFCs) in India: Challenges...
The Evolution of Non-Banking Financial Companies (NBFCs) in India: Challenges...The Evolution of Non-Banking Financial Companies (NBFCs) in India: Challenges...
The Evolution of Non-Banking Financial Companies (NBFCs) in India: Challenges...
beulahfernandes8
 
Chương 6. Ancol - phenol - ether (1).pdf
Chương 6. Ancol - phenol - ether (1).pdfChương 6. Ancol - phenol - ether (1).pdf
Chương 6. Ancol - phenol - ether (1).pdf
va2132004
 
where can I find a legit pi merchant online
where can I find a legit pi merchant onlinewhere can I find a legit pi merchant online
where can I find a legit pi merchant online
DOT TECH
 
Commercial Bank Economic Capsule - May 2024
Commercial Bank Economic Capsule - May 2024Commercial Bank Economic Capsule - May 2024
Commercial Bank Economic Capsule - May 2024
Commercial Bank of Ceylon PLC
 
The WhatsPump Pseudonym Problem and the Hilarious Downfall of Artificial Enga...
The WhatsPump Pseudonym Problem and the Hilarious Downfall of Artificial Enga...The WhatsPump Pseudonym Problem and the Hilarious Downfall of Artificial Enga...
The WhatsPump Pseudonym Problem and the Hilarious Downfall of Artificial Enga...
muslimdavidovich670
 

Recently uploaded (20)

The secret way to sell pi coins effortlessly.
The secret way to sell pi coins effortlessly.The secret way to sell pi coins effortlessly.
The secret way to sell pi coins effortlessly.
 
what is the best method to sell pi coins in 2024
what is the best method to sell pi coins in 2024what is the best method to sell pi coins in 2024
what is the best method to sell pi coins in 2024
 
what is a pi whale and how to access one.
what is a pi whale and how to access one.what is a pi whale and how to access one.
what is a pi whale and how to access one.
 
APP I Lecture Notes to students 0f 4the year
APP I  Lecture Notes  to students 0f 4the yearAPP I  Lecture Notes  to students 0f 4the year
APP I Lecture Notes to students 0f 4the year
 
Exploring Abhay Bhutada’s Views After Poonawalla Fincorp’s Collaboration With...
Exploring Abhay Bhutada’s Views After Poonawalla Fincorp’s Collaboration With...Exploring Abhay Bhutada’s Views After Poonawalla Fincorp’s Collaboration With...
Exploring Abhay Bhutada’s Views After Poonawalla Fincorp’s Collaboration With...
 
Turin Startup Ecosystem 2024 - Ricerca sulle Startup e il Sistema dell'Innov...
Turin Startup Ecosystem 2024  - Ricerca sulle Startup e il Sistema dell'Innov...Turin Startup Ecosystem 2024  - Ricerca sulle Startup e il Sistema dell'Innov...
Turin Startup Ecosystem 2024 - Ricerca sulle Startup e il Sistema dell'Innov...
 
how can I sell pi coins after successfully completing KYC
how can I sell pi coins after successfully completing KYChow can I sell pi coins after successfully completing KYC
how can I sell pi coins after successfully completing KYC
 
BYD SWOT Analysis and In-Depth Insights 2024.pptx
BYD SWOT Analysis and In-Depth Insights 2024.pptxBYD SWOT Analysis and In-Depth Insights 2024.pptx
BYD SWOT Analysis and In-Depth Insights 2024.pptx
 
Introduction to Value Added Tax System.ppt
Introduction to Value Added Tax System.pptIntroduction to Value Added Tax System.ppt
Introduction to Value Added Tax System.ppt
 
how to sell pi coins on Binance exchange
how to sell pi coins on Binance exchangehow to sell pi coins on Binance exchange
how to sell pi coins on Binance exchange
 
how to swap pi coins to foreign currency withdrawable.
how to swap pi coins to foreign currency withdrawable.how to swap pi coins to foreign currency withdrawable.
how to swap pi coins to foreign currency withdrawable.
 
GeM ppt in railway for presentation on gem
GeM ppt in railway  for presentation on gemGeM ppt in railway  for presentation on gem
GeM ppt in railway for presentation on gem
 
how to sell pi coins in South Korea profitably.
how to sell pi coins in South Korea profitably.how to sell pi coins in South Korea profitably.
how to sell pi coins in South Korea profitably.
 
The new type of smart, sustainable entrepreneurship and the next day | Europe...
The new type of smart, sustainable entrepreneurship and the next day | Europe...The new type of smart, sustainable entrepreneurship and the next day | Europe...
The new type of smart, sustainable entrepreneurship and the next day | Europe...
 
Scope Of Macroeconomics introduction and basic theories
Scope Of Macroeconomics introduction and basic theoriesScope Of Macroeconomics introduction and basic theories
Scope Of Macroeconomics introduction and basic theories
 
The Evolution of Non-Banking Financial Companies (NBFCs) in India: Challenges...
The Evolution of Non-Banking Financial Companies (NBFCs) in India: Challenges...The Evolution of Non-Banking Financial Companies (NBFCs) in India: Challenges...
The Evolution of Non-Banking Financial Companies (NBFCs) in India: Challenges...
 
Chương 6. Ancol - phenol - ether (1).pdf
Chương 6. Ancol - phenol - ether (1).pdfChương 6. Ancol - phenol - ether (1).pdf
Chương 6. Ancol - phenol - ether (1).pdf
 
where can I find a legit pi merchant online
where can I find a legit pi merchant onlinewhere can I find a legit pi merchant online
where can I find a legit pi merchant online
 
Commercial Bank Economic Capsule - May 2024
Commercial Bank Economic Capsule - May 2024Commercial Bank Economic Capsule - May 2024
Commercial Bank Economic Capsule - May 2024
 
The WhatsPump Pseudonym Problem and the Hilarious Downfall of Artificial Enga...
The WhatsPump Pseudonym Problem and the Hilarious Downfall of Artificial Enga...The WhatsPump Pseudonym Problem and the Hilarious Downfall of Artificial Enga...
The WhatsPump Pseudonym Problem and the Hilarious Downfall of Artificial Enga...
 

Analyzing financial soundness using camel model

  • 1. ANALYZING FINANCIAL SOUNDNESS OF PUBLIC SECTOR BANKS IN INDIA USING CAMEL MODEL B. Krishnakumare 1
  • 2. Introduction Methodology Findings of the Study Conclusions References CONTENTS 2
  • 4. CAMEL RATING A rating system, used to evaluate the overall performance of banks and determine their strengths and weaknesses.  Padmanabhan Committee (1995) – Reserve Bank of India  Camel rating – Based on U.S. Federal Reserve (1970)  CAMEL Commenced in India from 1998 4
  • 6. Minimum reserves of capital which a bank or other financial institutions must have. 𝑇𝑖𝑒𝑟 1 𝐶𝑎𝑝𝑖𝑡𝑎𝑙 + 𝑇𝑖𝑒𝑟 2 𝐶𝑎𝑝𝑖𝑡𝑎𝑙 𝑅𝑖𝑠𝑘 𝑤𝑒𝑖𝑔ℎ𝑡𝑒𝑑 𝑎𝑠𝑠𝑒𝑡𝑠 CAPITALADEQUACY RATIO: CAPITAL ADEQUACY 6
  • 7. RATIOS USED TO STUDY PARAMETER ‘C’ RATIOS FORMULA PRESCRIBED LEVEL Capital Adequacy Ratio Tier 1 Capital + Tier 2 Capital / Risk weighted Assets 10% Debt to Equity Ratio Debt / Equity <1.5 Total Advances to Total Assets Ratio Total Advances / Total Assets <0.4 Source: Reserve Bank of India, Official website 7
  • 8. ASSET QUALITY • Determines the healthiness of financial institutions against loss of value in the assets. • An indicator of bank’s control over its bad debts. 8
  • 9. RATIOS USED TO STUDY PARAMETER ‘A’ RATIOS FORMULA PRESCRIBED LEVEL Gross NPA Ratio Gross NPA / Gross Advances 5% Net NPA Ratio Net NPA / Net Advances 3% Source: Reserve Bank of India, Official website 9
  • 10. MANAGEMENT QUALITY For successful operation a bank needs, • Competent Management • Effective policies and guidelines RATIOS FORMULA PRESCRIBED LEVEL Asset Turnover Ratio Net Sales / Average Total Assets 0.05 Net Profit Margin Ratio Net Profit / Total Revenue 8.5% RATIOS USED TO STUDY PARAMETER ‘M’ Source: Reserve Bank of India, Official website 10
  • 11. • Total income earned by banks through various sources in accordance with the guidance exposed by the regulator. • Reflects the ability to support present and future operations. EARNINGS 11
  • 12. RATIOS USED TO STUDY PARAMETER ‘E’ RATIOS FORMULA PRESCRIBED LEVEL Return on Assets Net Income / Average Total Assets 1% Return on Equity Net Income / Average Shareholders equity 9.75 Source: Reserve Bank of India, Official website 12
  • 13. • Most important component for a bank • Reflects the capacity of banks to withstand shocks to cash flows LIQUIDITY 13
  • 14. RATIOS USED TO STUDY PARAMETER ‘L’ RATIOS FORMULA PRESCRIBED LEVEL Total Investments to Total Assets Ratio Total Investments / Total Assets >20% Source: Reserve Bank of India, Official website 14
  • 16. Research Design Descriptive Research Sample of the study 8 Public Sector Banks selected based on their overall business Period of Study 5 years (2013-17) Data Source Secondary data Annual Reports of selected banks Statistical tools t test analysis Analysis (using SPSS Software) Limitation Restricted only to Public Sector Banks 16
  • 17. S.No Banks Overall Business (Rs. Crore) 1 State Bank of India 154,750.96 2 Bank of Baroda 32,762.18 3 Punjab National Bank 15,247.33 4 IDBI 13,588.18 5 Canara Bank 10,710.50 6 Union Bank 7,957.13 7 Bank of India 7,191.48 8 Syndicate Bank 5,178.27 PUBLIC SECTOR BANKS BASED ON THEIR CAPITAL 17
  • 19. Banks Capital Adequacy ratio Debt to Equity ratio Total Advance to Total Asset ratio Overall Ranking Average Rank Average Rank Average Rank Average Rank SBI 12.66 2 1.39 1 0.62 5 2.0 1 BOB 12.98 1 1.59 4 0.58 1 4.3 4 PNB 11.88 3 1.56 3 0.62 5 3.0 2 IDBI 11.79 4 1.53 2 0.59 2 4.0 3 Canara Bank 11.51 6 1.84 6 0.59 2 6.0 7 Union Bank 10.96 7 1.86 7 0.65 7 5.3 6 Bank of India 10.63 8 1.80 5 0.61 4 6.0 7 Syndicate Bank 11.55 5 2.28 8 0.67 8 4.7 5 Capital Adequacy Ratios of Public Sector banks and their Ranking 19
  • 20. Banks Capital Adequacy ratio Debt equity ratio Total advances to total assets ratio Mean t value p value Mean t value p value Mean t value p value SBI 12.66 11.536 0.000 1.39 4.122 0.000 0.62 9.624 0.001 BOB 12.98 14.721 0.000 1.59 4.771 0.000 0.58 6.653 0.003 PNB 11.88 7.222 0.002 1.56 2.168 0.000 0.62 9.509 0.001 IDBI 11.79 4.608 0.010 1.53 1.468 0.000 0.59 14.230 0.000 Canara Bank 11.51 2.965 0.041 1.84 3.334 0.000 0.59 14.230 0.000 Union Bank 10.96 2.467 0.069 1.86 6.254 0.000 0.65 23.717 0.000 Bank of India 10.63 1.358 0.246 1.80 6.591 0.000 0.61 8.199 0.001 Syndicate Bank 11.55 3.763 0.020 2.28 1.976 0.000 0.67 22.862 0.000 t-test Analysis (Capital Adequacy) H0: There is no significant difference between capital adequacy of selected banks H1: There is a significant difference between capital adequacy of selected banks Significant at 0.05% Level 20
  • 21. Asset quality ratios of Public Sector Banks and their Ranking Banks Gross NPA ratio (%) Net NPA ratio (%) Group Ranking Average Rank Average Rank Average Rank SBI 5.91 4 3.19 3 4.0 3 BOB 5.90 3 2.89 2 4.3 4 PNB 8.30 7 5.14 7 5.7 6 IDBI 8.94 8 5.39 8 5.7 6 Canara Bank 5.60 2 3.97 5 2.7 1 Union Bank 6.39 5 3.69 4 4.3 4 Bank of India 7.56 6 4.42 6 6.3 8 Syndicate Bank 4.59 1 2.78 1 2.7 1 21
  • 22. Banks Net NPA ratio Gross NPA ratio Mean t value P value Mean t value P value SBI 3.19 0.338 0.752 5.91 1.051 0.353 BOB 2.89 -0.134 0.900 5.90 0.506 0.640 PNB 5.14 1.654 0.174 8.30 1.794 0.147 IDBI 5.39 1.110 0.329 8.94 1.258 0.277 Canara Bank 3.97 0.928 0.406 5.60 0.368 0.732 Union Bank 3.69 0.731 0.505 6.39 0.904 0.417 Bank of India 4.42 1.160 0.311 7.56 1.106 0.331 Syndicate Bank 2.78 -0.251 0.814 4.59 -0.323 0.763 t-test Analysis (Asset Quality) H0: There is no significant difference between asset quality of selected banks H1: There is a significant difference between asset quality of selected banks Significant at 0.05% Level 22
  • 23. Management efficiency ratios of Public Sector Banks and their Ranking Banks Asset Turnover ratio (%) Net Profit Margin ratio (%) Overall Ranking Average Rank Average Rank Average Rank State Bank of India 0.08 2 6.39 4 3 3 Bank of Baroda 0.07 8 9.56 2 5 7 Punjab National Bank 0.08 2 9.84 1 1.5 1 IDBI 0.08 2 -3.36 8 5 7 Canara Bank 0.08 2 3.42 6 4 5 Union Bank 0.09 1 5.16 5 3 3 Bank of India 0.08 2 0.24 7 4.5 6 Syndicate Bank 0.08 2 7.32 3 2.5 2 23
  • 24. Banks Asset turnover ratio Net profit margin Mean t value p value Mean t value p value SBI 0.088 4.000 0.01 6.39 2.754 0.51 BOB 0.086 -5.715 0.05 9.56 4.509 0.01 PNB 0.082 0.535 0.62 9.84 4.922 0.08 IDBI 0.080 0.000 1.00 -3.36 -0.934 0.40 Canara Bank 0.084 1.000 0.37 3.42 0.733 0.50 Union Bank 0.086 2.449 0.07 5.16 3.257 0.03 Bank of India 0.080 -2.449 0.07 0.24 -0.293 0.78 Syndicate Bank 0.820 1.000 0.37 7.32 3.475 0.02 t-test Analysis (Management efficiency) H0: There is no significant difference between management efficiency of selected banks H1: There is a significant difference between management efficiency of selected banks Significant at 0.05% Level 24
  • 25. Earnings’ ratios of Public Sector Banks and their Ranking Banks Return on Assets (%) Return on Equity (%) Overall Ranking Average Rank Average Rank Average Rank SBI 0.62 2 9.10 3 2.5 2 BOB 0.76 1 10.58 1 1 1 PNB 0.55 3 9.44 2 2.5 2 IDBI -0.22 8 -4.99 7 7.5 7 Canara Bank 0.31 5 3.85 6 5.5 6 Union Bank 0.31 5 7.89 4 4.5 4 Bank of India 0.33 4 5.90 5 4.5 4 Syndicate Bank 0.12 7 -7.78 8 7.5 7 25
  • 26. Banks Return on Assets Return on equity Mean t value p value Mean t value p value SBI 0.62 6.992 0.02 9.10 5.402 0.06 BOB 0.76 10.186 0.01 10.58 3.066 0.03 PNB 0.55 3.790 0.01 9.44 3.625 0.02 IDBI -0.22 -0.539 0.61 -4.99 -1.448 0.22 Canara Bank 0.31 1.362 0.24 3.85 -0.292 0.78 Union Bank 0.31 3.403 0.02 7.89 2.095 0.10 Bank of India 0.33 1.289 0.26 5.90 0.162 0.87 Syndicate Bank 0.12 1.289 0.26 -7.78 0.928 0.40 t-test Analysis (Earnings) H0: There is no significant difference between earnings of selected banks H1: There is a significant difference between earnings of selected banks Significant at 0.05% Level 26
  • 27. Liquidity ratios of Public Sector Banks and their Ranking Banks Total Investments to Total Asset ratio (%) Average Rank SBI 23 5 BOB 19 8 PNB 25 3 IDBI 29 1 Canara Bank 29 1 Union Bank 24 4 Bank of India 20 7 Syndicate Bank 22 6 27
  • 28. t-test Analysis (Liquidity) Banks Total investment to total ratio Mean t value P value SBI 23 5.667 0.05 BOB 19 -1.222 0.28 PNB 25 7.071 0.02 IDBI 29 4.916 0.08 Canara Bank 29 4.914 0.07 Union Bank 24 6.332 0.03 Bank of India 20 -1.633 0.17 Syndicate Bank 22 6.532 0.03 H0: There is no significant difference between liquidity of selected banks H1: There is a significant difference between liquidity of selected banks Significant at 0.05% Level 28
  • 30. Parameters Financial Performance Good Poor Capital Adequacy Punjab National Bank State Bank of India Bank of India Asset Quality Syndicate Bank Bank of India IDBI Management efficiency Punjab National Bank Bank of India IDBI Earnings Bank of Baroda IDBI Syndicate Bank Liquidity IDBI Canara Bank Bank of Baroda 30
  • 31. Banks C A M E L Average Rank SBI 2.0 4.0 3 2.5 5 3.3 2 BOB 4.3 4.3 5 1 8 4.52 5 PNB 3.0 5.7 1.5 2.5 3 3.14 1 IDBI 4.0 5.7 5 7.5 1 4.64 6 Canara Bank 6.0 2.7 4 5.5 1 3.84 3 Union Bank 5.3 4.3 3 4.5 4 4.22 4 Bank of India 6.0 6.3 4.5 4.5 7 5.66 8 Syndicate Bank 4.7 2.7 2.5 7.5 6 4.68 7 Overall Performance of Public Sector Banks 31
  • 32. REFERENCES • Angela Roman and Alina Camelia (2013) “Analyzing the Financial Soundness of the Commercial Banks in Romania: An Approach Based on CAMELS framework” Procedia Economics and Finance, 6(2013):703-712. • Annual Reports of Public Sector Banks, 2013-17. • Evan O, Leone A M, Gill M and Hilbers P (2000) Macro prudential Indicators of Financial System Soundness, IMF Occasional Paper, no.192. • IMF and World Bank (2005) Financial sector Assessment: A Handbook. • Master Circulars (2016-17), Prudential Norms on Capital Adequacy, Reserve Bank of India. 32