- The study characterized 13 microsatellite markers for Calochortus gunnisonii, a montane lily species in the central and southern Rocky Mountains, using next-generation DNA sequencing.
- The markers were found to be polymorphic, with a mean of 4.97 alleles per locus. Observed and expected heterozygosity ranged from 0.077 to 0.871 and 0.213 to 0.782, respectively.
- The markers will be useful for investigating population structure, genetic diversity, and demographic history of C. gunnisonii across its range in the Rocky Mountains. They also showed potential for cross-species amplification in other Calochortus species.
Eco-floristic studies of the Beer Hills along the Indus River in the district...Shujaul Mulk Khan
The present study was conducted to elaborate vegetation composition structure to analyze role of edaphic and topographic factors on plant species distribution and community formation during 2013–14. A mixture of quadrat and transect methods were used. The size of quadrat for trees shrubs and herbs were 10 × 5, 5 × 2, 1 × 1 meter square respectively. Different phytosociological attribute were measured at each station. Primary results reported 123 plant species belong to 46 families. Asteraceae and Lamiaceae were dominant families with 8 species each. PCORD version 5 were used for Cluster and Two Way Cluster Analyses that initiated 4 plant communities within elevation range of 529–700 m from sea level. Indicator species analyses (ISA) were used to identify indicator species of each community. CANOCO Software (version 4.5) was used to measure the influence of edaphic and topographic variables on species composition, diversity and community formation. Whereas Canonical Correspondence Analysis (CCA) was used to measure the effect of environmental variables which showed elevation and aspect were the stronger environmental variable among topographic and CaCO3 contents, electric conductivity, soil pH were the stronger edaphic factors in determination of vegetation and communities of the Bheer Hills. Grazing pressure was one of the main anthropogenic factors in this regard.
Abstract— An experiment stand of clonal orchard of masson pine, which included the 123 plus trees of 8 provenances collected from 8 provinces of Southern China, was founded at Jingshan County of Hubei province. Randomly amplified polymorphic DNA (RAPD) technique was applied to assess genetic diversity and structure for this clonal seed orchard. Total genomic DNA was extracted from fresh needle tissue with Plant Genomic DNA Extraction Miniprep System made by Viotechnology Corporation The results indicated that the clonal seed orchard of masson pine had higher genetic diversity. The average genetic diversity of the clonal seed orchard was 0.3169, the Shannon’s information index was 0.4813 respectively, and the percentage of polymorphic loci was 71.0%. Observed number of alleles (Na), effective number of alleles (Ne), Nei’s gene diversity (H), Shannon’s information index (I) and percentage of polymorphic loci (P) within population of Jiangxi, Hunan and Zhejiang were bigger than those of Guangdong, Guangxi, Anhui and Sichuan. Genetic distances among 8 populations were range from 0.0225 to 0.2175, whereas genetic identities were range from 0.8045 to 0.9777. 8 populations were clustered into 7 clusters, which showed that populations with similar latitude were clustered together and the clustering had nothing to do with geographic distributing. There was not significant correlation between genetic distance and geographic distance, while the correlation between genetic distance and latitude was more significant.
Theriot E.C., Cannone J.J., Gutell R.R., and Alverson A.J. (2009).
The limits of nuclear encoded SSU rDNA for resolving the diatom phylogeny.
European Journal of Phycology, 44(3):277-290.
Managing Health and Disease Using Omics and Big DataLaura Berry
Presented at the NGS Tech and Applications Congress: USA. To find out more, visit:
www.global-engage.com
Michael Snyder is a Professor, Chair of Genetics and Director of the Stanford Center for Genomics and Personalized Medicine at Stanford University. In this presentation Michael discusses using omics and big data to predict disease risk and catch early disease onset.
Here, we describe a learning strategy that results an excellent choice for a first approach of students to produce scientific knowledge that can be confronted in the scientific field as well as recognize in this knowledge the transferability to the natural resources management. Nowadays, the availability of several Population Genetics software together with public molecular database represents a valuable tool of great assistance for teachers of this discipline. In this way, we implemented a
lecture where the students worked with empirical data set from a recent published article. The students joined theoretical concepts learned, computational software free available and empirical data set. The development of the activity comprised four steps: i) estimate population genetics parameters using software recommended by teachers, ii) understand results in a biological sense, iii) read the original manuscript from dataset authors and iv) compare both results in a comprehensive way. The students assumed the challenge under a reflective look and they kept a very fruitful discussion playing a role of population geneticists. Their exchange of ideas allowed them arrive to the conclusion that Manilkara zapota populations keep high levels of genetic diversity, although Ancient Maya left traces in the genetic makeup of these non-native populations with different management histories.
Study of Genotypic and Phenotypic Correlation among 20 Accessions of Nigerian...IOSRJAVS
Morphological techniques were used to evaluate the diversity in 20 cowpea accessions collected from some parts of Nigeria for two years (2007 and 2008) at Ibadan, South Western Nigeria. Correlation analysis was employed to show the relationships among the traits. Similarly, genotypic and phenotypic variances, genotypic coefficients of variation, heritability and expected genetic advance were estimated for the twelve traits in cowpea for each season. This study shows that for cowpea yield improvement, number of main branches, pod numbers, pods per plant, pods per peduncle and seeds per pod should be part of the selection criteria.
Evaluation of viable selection criteria at the seedling stage in corn genotyp...Innspub Net
Drought is the only factor which causes a more drastic effect on crop plant. Corn is a drought-sensitive crop their yield is influenced at every single phase of growth and development by limited water availability. Corn. A total of 90 accessions were screened and evaluated at different water levels 100% (T1), 40% (T2) and 30% (T3) of field capacity (FC). Evaluation of corn genotypes was done against six seedling parameters (root length, shoot length, fresh root weight, fresh shoot weight, dry root weight and dry shoot weight). The analysis of variance indicated that all the traits under all water levels revealed significantly and the principal component analysis depicted diverse results for different treatments. The results showed that the genotypes Lala Musa, Akbar, Sahiwal-2002, Sultan, Pearl, 15005,15077,14972,15110 under 100% FC level performed well and genotypes 14933,15023,14968,15055, 15005, MMRI yellow, Lala Musa, Pearl, Akbar, Akhgoti, 15067 and Sultan under 40% FC and the genotypes Desi Fsd, 15075, Lala Musa, 14930, 14976, 15132, 15048, Sultan and 15005 performed best in 30% FC. Some corn genotypes Akhgoti, Lala Musa, Sultan, and 15005 performed better under all three water levels. The information on seedling parameters is best suited to screen viable genotypes for baseline information for on-ward corn breeding and research programs on water stress tolerance.
PENSOFT ARTICLE COLLECTION ABOUT MYANMAR
https://pensoft.net/about#Company-Profile
Pensoft is an independent academic publishing company, well known worldwide for its innovations in the field of semantic publishing and for its cutting-edge publishing tools and workflows. Founded in 1992 "by scientists, for the scientists" and initially focusing on book publishing, it has grown to become a leading publisher of innovative open access journals, such as: Research Ideas and Outcomes (RIO), ZooKeys, Biodiversity Data Journal, PhytoKeys, MycoKeys, Nature Conservation, NeoBiota, Comparative Cytogenetics, and others. Pensoft has published more than 1,000 books and over 4,000 open access articles, mostly in the field of natural history.
Pensoft is a member or partner of several professional publishing organisations and data publishing platforms, including CrossRef, OASPA, PubMedCentral, CLOCKSS, Research Data Alliance (RDA), OpenAIRE, LifeWatch, DataONE, Dryad Data Repository, Global Biodiversity Information Facility (GBIF), Encyclopedia of Life (EoL), and others.
https://zookeys.pensoft.net/article/24248/
A new remarkable species of Alloscorpiops Vachon, 1980 from Myanmar (Burma) (Scorpiones, Scorpiopidae)
https://zookeys.pensoft.net/article/24453/
Filling the BINs of life: Report of an amphibian and reptile survey of the Tanintharyi (Tenasserim) Region of Myanmar, with DNA barcode data
https://zookeys.pensoft.net/article/24198/
Taxonomic notes on Babinskaiidae from the Cretaceous Burmese amber, with the description of a new species (Insecta, Neuroptera)
https://zookeys.pensoft.net/article/22510/
Laubuka tenella, a new species of cyprinid fish from southeastern Bangladesh and southwestern Myanmar (Teleostei, Cyprinidae, Danioninae)
https://zookeys.pensoft.net/article/22310/
New genus and species of sisyrids (Insecta, Neuroptera) from the Late Cretaceous Myanmar amber
https://www.facebook.com/groups/799902210118950/permalink/1642543752521454/
https://www.facebook.com/Pensoft/
Association mapping identifies loci for canopy coverage in diverse soybean ge...Avjinder (Avi) Kaler
Rapid establishment of canopy coverage decreases
soil evaporation relative to transpiration improves
water use efficiency and light interception, and increases
soybean competitiveness against weeds.
Longevity is a highly desirable trait that considerably affects overall profitability. With increased longevity, the mean production of the herd increases because a greater proportion of the culling decisions are based on production. Longevity did not receive adequate attention in breeding programs because genetic evaluation for this trait is generally difficult as some animals are still alive at the time of genetic evaluation. Therefore, three basic strategies were suggested to evaluate longevity for cows: Firstly, cow survival to a specific age, which can be analyzed as a binary trait by either linear or threshold models. Secondly, estimating life expectancy of live cows and including these records in a linear model analysis. Thirdly, survival analysis: a method of combining the information of dead (uncensored) and alive (censored) cows in same analysis. This review represents an attempt to shed a light on different strategies of genetic evaluation of longevity in dairy cattle in most of developed countries.
Genetic engineering is the best technology that is promoting the world and this technology is applied to many plants, animals and microorganisms. It has wider applications in the field of Biology, Medicine, Industry, Research, Agriculture and many other fields of science. In this research paper I update the Roles of Genetic Engineering in Agriculture, Animals, Human enhancement and Evolution, Bacteriophage Against Infectious Diseases, Medicines, Phage in Infectious Diseases, Biofuels Production and Improve Plant Performance Under Drought.
Influence of some site factors on germinative parameters of Quercus seedsAI Publications
The genus Quercus has a high economic and ecological potential in Mexico. Nonetheless, its populations are reducing yearly, which demands the implementation of efficient management strategies to preserve them. To determine germinating capacity of seeds, and to learn about their relationship with some conditions of collecting sites (latitude N, accumulated degree-days >5 C in the frozen-free period (AD), precipitation of growing season (PGS)) we used information of seeds and collecting sites for natural populations of Quercus crassifolia, Q. jonesii, Q. polymorpha and Q. potosina. We determined that Q. potosina, the northernmost population; showed higher values of seeds mean weight, percentage of germinated seeds (PGS), average germination time (AGT), peak value (PV), and germination energy (GE), than other species. Q. polymorpha also showed high mean values of seeds weight, PGS, PV, and GE and it was collected at northern latitudes near those of Q. crassifolia and Q. jonesii. Q. jonesii was the southernmost population and showed lower values in these parameters. On the other hand, the analysis also determined that Q. jonesii, Q. plymorpha, and Q. potosina had quicker germination than Q. crassifolia. We inferred that for the species in the analyzed sites, increasing PGS improves sites conditions, which promotes better germination of germplasm.
High Performing Analytics professional with more than 3 years of experience in different business domain like manufacturing and Business Data Analytics and research
Genetic Analysis to Improve Grain Yield Potential and Associated Agronomic Tr...Galal Anis, PhD
Grain yield of rice is a complex trait consisting of several yield parameters. It is of
great necessary to reveal the genetic relationships between GY and its yield components. Therefore,
the correlation of agronomic traits contributed of grain yield will be a supplemental advantage in
providing the selection process. The objective of this study was to compare genetic variability and
relationships between nine rice genotypes and their F1 progenies in rice by assessment of heterosis,
yield advantage and correlation coefficient for grain yield improvement. A field experiment were
conducted in a randomized complete block design with three replications in the growing seasons of
2012 and 2013 at Rice Research and Training Center, Sakha, Egypt. Heterosis and correlation
coefficient of various agro-morphological and yield traits were studied by using nine-parent diallel
mating design. The results showed that grain yield was highly significant positive heterosis over
standard heterosis and the highest value was 79.68 for the cross Sakha 101 x Giza 171 and the lowest
value was 32.86 for the cross Sakha 104 x HR5824-B-3-2-3. At the same time, fifteen crosses were
highly significant and positive heterosis over mid-parent, the highest cross was Giza 177 x Sakha
104 with value 32.74 and the lowest cross was Sakha 101 x Sakha 104 with value 19.56 for grain
yield. Significant positive correlation coefficients were observed between grain yield and each of
days to maturing, panicle initiation and number of primary branches panicle-1. Pay special attention
to the cross from Sakha 101 x Giza 171 and as well as Giza 177 x Sakha 104 was achieved the best
grain yield trait. These promising cross would be more valuable materials for breeders engaged in the
development of high yielding cultivars.
Aula sobre dor crônica e liberação de opióides, endógenosDanusa Menegaz
Curso de Extensão para terceira idade. Tópico do dia: Dor Crônica e liberação de endorfinas no alívio da dor.
Universidade Federal de Santa Catarina, Brasil
Rapid Impact Assessment of Climatic and Physio-graphic Changes on Flagship G...Arvinder Singh
‘NATIONAL CONFERENCE ON MAN AND ENVIRONMENT’October 15 – 16, 2012
Organized by
Department of Zoology and Environmental Sciences, Punjabi University, Patiala (Pb.) – 147 002, India
Nature GeNetics VOLUME 46 NUMBER 10 OCTOBER 2014 1 0 8 9.docxgemaherd
Nature GeNetics VOLUME 46 | NUMBER 10 | OCTOBER 2014 1 0 8 9
A suite of forces and factors, including mutation, recombination,
selection, population history and gene duplication influence patterns
of intraspecific genetic variation. Distinguishing which factors have
shaped sequence variation across a genome requires extensive whole-
genome sequencing of multiple individuals, which has only recently
become tractable1. Most large-scale whole-genome resequencing
studies have focused on model and domesticated species1–5. However,
extensive sequencing of natural populations holds great promise for
advancing understanding of evolutionary biology, including identify-
ing functional variation and the molecular bases of adaptation. Recent
work in a number of species has identified genomic regions that show
signatures of positive selection, suggesting that such regions contain
loci that control adaptive traits4,6–8. Relatively few studies, however,
have combined genome-wide scans with phenotypic data to determine
whether computationally identified selected regions influence adap-
tive phenotypic variation5,9–13. Genome-wide studies of large natural
populations combined with phenotypic measurements are necessary
to determine which factors shape patterns of genetic variation within
species and, therefore, enhance understanding of adaptation.
With large geographic ranges spanning wide environmental gradi-
ents and a long history of research showing local adaptation14, forest
trees are ideal for examining the processes shaping genetic variation
in natural populations. Forest trees cover approximately 30% of ter-
restrial land area15, provide direct feedback to global climate15 and
are often foundation species that organize entire biotic communities
and biogeochemical systems16,17. Clearly, biotic and abiotic interac-
tions have influenced population sizes and distributions of forest
trees, leaving diagnostic signatures in the genomes of present-day
populations14,18,19. A deeper understanding of the evolutionary and
ecological forces that shaped these patterns will offer insights and
options for ecosystem management, applied tree improvement and
accelerated domestication efforts20.
Black cottonwood, Populus trichocarpa Torr. & Gray, is a dominant
riparian tree that has become a model for the advancement of genome-
level insights in forest trees21. The sequencing of 16 P. trichocarpa
genomes revealed widespread patterns of linkage disequilibrium (LD)
and population structure22 and extensive genecological studies have
revealed a high degree of adaptive phenotypic variation in growth,
vegetative phenology and physiological traits such as water-use effi-
ciency and photosynthesis23–25, suggesting that local adaptation is
prevalent. To date, candidate gene–association analyses have revealed
loci with significant effects on phenotypic traits26,27. However, thus
far there have been no publications describing whole-genome asso-
.
Nature GeNetics VOLUME 46 NUMBER 10 OCTOBER 2014 1 0 8 9.docxvannagoforth
Nature GeNetics VOLUME 46 | NUMBER 10 | OCTOBER 2014 1 0 8 9
A suite of forces and factors, including mutation, recombination,
selection, population history and gene duplication influence patterns
of intraspecific genetic variation. Distinguishing which factors have
shaped sequence variation across a genome requires extensive whole-
genome sequencing of multiple individuals, which has only recently
become tractable1. Most large-scale whole-genome resequencing
studies have focused on model and domesticated species1–5. However,
extensive sequencing of natural populations holds great promise for
advancing understanding of evolutionary biology, including identify-
ing functional variation and the molecular bases of adaptation. Recent
work in a number of species has identified genomic regions that show
signatures of positive selection, suggesting that such regions contain
loci that control adaptive traits4,6–8. Relatively few studies, however,
have combined genome-wide scans with phenotypic data to determine
whether computationally identified selected regions influence adap-
tive phenotypic variation5,9–13. Genome-wide studies of large natural
populations combined with phenotypic measurements are necessary
to determine which factors shape patterns of genetic variation within
species and, therefore, enhance understanding of adaptation.
With large geographic ranges spanning wide environmental gradi-
ents and a long history of research showing local adaptation14, forest
trees are ideal for examining the processes shaping genetic variation
in natural populations. Forest trees cover approximately 30% of ter-
restrial land area15, provide direct feedback to global climate15 and
are often foundation species that organize entire biotic communities
and biogeochemical systems16,17. Clearly, biotic and abiotic interac-
tions have influenced population sizes and distributions of forest
trees, leaving diagnostic signatures in the genomes of present-day
populations14,18,19. A deeper understanding of the evolutionary and
ecological forces that shaped these patterns will offer insights and
options for ecosystem management, applied tree improvement and
accelerated domestication efforts20.
Black cottonwood, Populus trichocarpa Torr. & Gray, is a dominant
riparian tree that has become a model for the advancement of genome-
level insights in forest trees21. The sequencing of 16 P. trichocarpa
genomes revealed widespread patterns of linkage disequilibrium (LD)
and population structure22 and extensive genecological studies have
revealed a high degree of adaptive phenotypic variation in growth,
vegetative phenology and physiological traits such as water-use effi-
ciency and photosynthesis23–25, suggesting that local adaptation is
prevalent. To date, candidate gene–association analyses have revealed
loci with significant effects on phenotypic traits26,27. However, thus
far there have been no publications describing whole-genome asso-
...
Poster describing a global occurrence database of over 5 million records of the distributions of crops and their wild relatives, including taxonomic and geographic information.
Nuts & Bolts: Genetically Appropriate Choices for Plant Materials to Maintain...nycparksnmd
Dr. Arlee Montavalo, University of California, Riverside
Symposium:
What is Local? Genetics & Plant Selection in the Urban Context. (Tuesday, May 23, 2006, American Museum of Natural History)
Examining the spatial distribution pattern and optimum sample size for monito...AI Publications
The white mango scale insect, Aulacaspis tubercularis (Newstead) (Hemiptera: Diaspididae) is one of the most destructive pests of mango trees in Egypt. The main objective of the present work is to estimate the spatial distribution pattern and minimum sample size for monitoring populations of A. tubercularis on six different cultivars of mango through the two successive years of 2017/2018 and 2018/2019 at Esna district, Luxor Governorate, Egypt. Data on the indices of distribution and Taylor’s and Iwao’s regression analyses indicate significant aggregation behaviour during each year in all the tested cultivars of mango trees, that may be caused by environmental heterogeneity. The regression models of Taylor’s power law (b) and Iwao’s patchiness (β) were both significantly >1, indicating that A. tubercularis had an aggregation distribution with a negative binomial distribution during each year in all the tested mango cultivars. The Iwao regression coefficients were used to determine the optimum sample size required to estimate populations at three fixed precision levels. The optimum size decreased with increased density in all levels of precision (5, 10 and 15%) in all tested mango cultivars. These can be deployed to develop a sampling plan to estimate the population density accurately. Results suggesting that the optimum sample size was flexible and the precision levels of 5 and 10% were suitable for ecological or insect behavioral studies of A. tubercularis where a higher level of precision is required, whereas, for pest management programs, a 15% level would be acceptable. Furthermore, the distribution, different mango cultivars, and sampling protocol presented here could be used as a tool for future research on pest management methods for this pest.
I am working with collaborators in Brazil, the U.S., and Mexico to complete genetic data analyses and manuscripts from two postdoctoral research fellowships. This slideshow presents a brief overview of the two main funded research projects that I am involved in.
Project Overview: Ecological & Evolutionary Genetics of Southwestern White Pi...Justin C. Bagley
Provides a brief overview of our project on the ecological and evolutionary genetics of southwestern white pine (SWWP), an alpine white pine distributed in the sky-islands of the North American desert southwest.
1. BioOne sees sustainable scholarly publishing as an inherently collaborative enterprise connecting authors, nonprofit publishers, academic institutions, research
libraries, and research funders in the common goal of maximizing access to critical research.
Characterization of 13 Microsatellite Markers for Calochortus gunnisonii
(Liliaceae) from Illumina MiSeq Sequencing
Author(s): Ryan S. Fuller, Seth Frietze and Mitchell E. McGlaughlin
Source: Applications in Plant Sciences, 3(8)
Published By: Botanical Society of America
DOI: http://dx.doi.org/10.3732/apps.1500051
URL: http://www.bioone.org/doi/full/10.3732/apps.1500051
BioOne (www.bioone.org) is a nonprofit, online aggregation of core research in the biological, ecological, and
environmental sciences. BioOne provides a sustainable online platform for over 170 journals and books published
by nonprofit societies, associations, museums, institutions, and presses.
Your use of this PDF, the BioOne Web site, and all posted and associated content indicates your acceptance of
BioOne’s Terms of Use, available at www.bioone.org/page/terms_of_use.
Usage of BioOne content is strictly limited to personal, educational, and non-commercial use. Commercial inquiries
or rights and permissions requests should be directed to the individual publisher as copyright holder.
4. Applications in Plant Sciences 2015 3(8): 1500051 Fuller et al.—Calochortus gunnisonii microsatellites
doi:10.3732/apps.1500051
3 of 4http://www.bioone.org/loi/apps
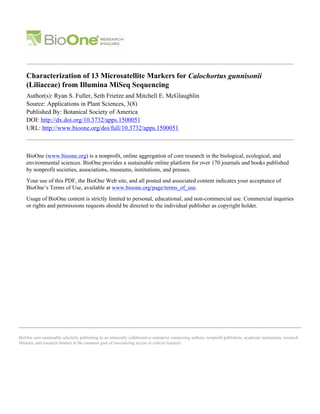
TABLE 2. Allelic diversity at 13 variable microsatellite loci for three populations of Calochortus gunnisonii.
Dixon Sand Lake Shavano Camp
Locus N A Ho He
a N A Ho He
a N A Ho He
a
CAGU_14 31 4 0.469 0.469 31 3 0.233 0.376* 33 4 0.559 0.493
CAGU_15 31 8 0.563 0.607 32 4 0.419 0.348 34 3 0.571 0.519
CAGU_22 31 5 0.125 0.252* 32 5 0.387 0.356 33 5 0.441 0.440
CAGU_31 31 6 0.531 0.582* 32 5 0.645 0.674 34 5 0.457 0.602
CAGU_35 30 6 0.419 0.601 29 5 0.241 0.405* 28 6 0.393 0.695*
CAGU_36 30 5 0.387 0.455* 18 3 0.118 0.213 34 4 0.294 0.407*
CAGU_39 30 6 0.452 0.655 32 5 0.806 0.691 34 6 0.600 0.666*
CAGU_42 31 7 0.250 0.750* 30 4 0.448 0.542 25 5 0.077 0.643*
CAGU_45 31 7 0.344 0.616* 32 4 0.548 0.575 33 5 0.500 0.599*
CAGU_46 28 4 0.517 0.633 32 3 0.516 0.533 33 4 0.618 0.478
CAGU_47 30 5 0.387 0.363 31 4 0.400 0.575 33 3 0.118 0.452*
CAGU_48 30 8 0.871 0.763 28 5 0.692 0.648 34 6 0.686 0.782
CAGU_50 29 6 0.633 0.554 30 4 0.586 0.691 34 7 0.714 0.738
Mean 30.23 5.92 0.458 0.562 29.92 4.15 0.465 0.510 32.46 4.85 0.464 0.578
Note: A = number of alleles; He = expected heterozygosity; Ho = observed heterozygosity; N = sample size.
a Statistical significance associated with departure from Hardy–Weinberg equilibrium (HWE) is indicated with an asterisk (*P ≤ 0.05).
tags, M13R (GGAAACAGCTATGACCAT) and CAGT (CAGTCGGGCGT-
CATCA), and one custom tag, T7 (GCTAGTTATTGCTCAGCGG), were used.
Fifty loci with optimum primer conditions were screened for amplification suc-
cess and within-population variability. Microsatellite loci were amplified in
12-μL reaction volumes that included 2.5 mM of tagged primer, 25 mM of
nontagged primer, 25 mM of fluorescently labeled tag (6-FAM, PET, or VIC;
Applied Biosystems, Wilmington, Delaware, USA), 5× Colorless GoTaq Flexi
Buffer (Promega Corporation, Madison, Wisconsin, USA), 2.5 mM each dNTP,
0.02 units GoTaq Flexi DNA Polymerase (Promega Corporation), 0.1 μL 100×
bovine serum albumin, 25 mM MgCl2 or 100 mM MgSO4 (Table 1), ~20–50 ng
of gDNA, and brought to volume with purified water. Thermal cycler condi-
tions were 94°C for 3 min; 35 cycles of 94°C for 30 s, 56–63°C for 30 s, and
72°C for 30 s; followed by an extension for 10 min at 72°C; and a final 30-min
extension at 72°C. PCR products were mixed with 1× SYBR Green (LONZA,
Rockland, Maine) and visualized on a 1% agarose gel. Successful PCR prod-
ucts were diluted with water and mixed with Hi-Di formamide and GeneScan
500 LIZ Size Standard (Applied Biosystems) before electrophoresis on an
Applied Biosystems 3730 Genetic Analyzer at Arizona State University. Frag-
ments were sized using the microsatellite plug-in of Geneious v.8.0.4 (created
by Biomatters, http://www.geneious.com/).
Of the 50 initial screenings, 22 failed to yield reliable PCR product via gel elec-
trophoresis. Twenty-eight loci yielded consistent products and were amplified.
Preliminary sizing of the products revealed 13 primer pairs that consistently yielded
amplicons within the target size range (120–400 bp) (Table 1). Three sample
populations of C. gunnisonii were selected to evaluate variability in the isolated
loci (Table 2). One population represents central Colorado (Shavano Campground;
n = 34), the second represents a low-elevation population in northern Colorado
(Dixon Reservoir; n = 31), and the third is a population from south-central
Wyoming near the northern edge of the southern Rockies (Sand Lake; n = 32).
All 13 microsatellite loci were variable and polymorphic among sampled
populations. Population statistics and deviations from Hardy–Weinberg equilib-
rium (HWE) were calculated using GenAlEx v.6.5 (Peakall and Smouse, 2012).
The mean number of alleles per locus ranged from 4.15 to 5.92, with an average
of 4.97 (Table 2). The observed and expected heterozygosity ranged from 0.077
to 0.871 and 0.213 to 0.782, respectively. Significant deviations from HWE were
observed for individual loci, but no consistent pattern across multiple popula-
tions was observed, suggesting the deviations are due to population processes
(Table 2). Observed and expected heterozygosities are high when examined
across all populations, indicating the value of these markers for future studies.
All 13 loci were screened for amplification success in four additional Calo-
chortus species spread throughout the Calochortus phylogeny (Patterson and
Givnish, 2003). Cross-amplification success was high in the closely related C.
nuttallii Torr. & A. Gray (11), moderate in C. kennedyi Porter var. kennedyi (8),
and low in C. flexuosus S. Watson (7) and C. subalpinus Piper (4) (Appendix 2).
CONCLUSIONS
We identified 13 C. gunnisonii microsatellite loci that
are variable and informative. These markers will be used to
investigate the population genetic structure and levels of genetic
variability of C. gunnisonii in the central and southern Rocky
Mountains. Intra- and intermontane patterns of gene flow and
divergence will be inferred within C. gunnisonii. Cross-species
amplification was high in a closely related taxon, C. nuttallii, and
decreased in more divergent sampled taxa.
LITERATURE CITED
BOLGER, A. M., M. LOHSE, AND B. USADEL. 2014. Trimmomatic: A
flexible trimmer for Illumina sequence data. Bioinformatics 30:
2114–2120.
BOUTIN-GANACHE, I., M. RAPOSO, M. RAYMOND, AND C. F. DESCHEPPER.
2001. M13-tailed primers improve the readability and usability of
microsatellite analyses performed with two different allele-sizing
methods. BioTechniques 31: 24–28.
FAIRCLOTH, B. C. 2008. MSATCOMMANDER: Detection of microsatellite
repeat arrays and automated, locus-specific primer design. Molecular
Ecology Resources 8: 92–94.
FIEDLER, P. L., AND R. K. ZEBELL. 2012. Calochortus: Flora of North
America online. Available at website http://www.efloras.org/florataxon
.aspx?flora_id=1taxon_id=105173 [accessed 15 January 2014].
FRIAR, E. A. 2005. Isolation of DNA from plants with large amounts of
secondary metabolites. Methods in Enzymology 395: 1–12.
GRABHERR, M. G., B. J. HAAS, M. YASSOUR, J. Z. LEVIN, D. A. THOMPSON,
I. AMIT, X. ADICONIS, ET AL. 2011. Full-length transcriptome assembly
from RNA-seq data without a reference genome. Nature Biotechnology
29: 644–652.
HENSS,J.M.,J.R.MOELLER,T.J.THEIM,AND T.J.GIVNISH.2013. Spatialscales
of genetic structure and gene flow in Calochortus albus (Liliaceae).
Ecology and Evolution 3: 1461–1470.
OWNBEY, M. 1940. A monograph of the genus Calochortus. Annals of the
Missouri Botanical Garden 27: 371–560.
PATTERSON, T. B., AND T. J. GIVNISH. 2003. Geographic cohesion, chromo-
somal evolution, parallel adaptive radiations, and consequent floral
adaptations in Calochortus (Calochortaceae): Evidence from a cpDNA
sequence phylogeny. New Phytologist 161: 253–264.
PEAKALL, R., AND P. E. SMOUSE. 2012. GenAlEx 6.5: Genetic analysis
in Excel. Population genetic software for teaching and research—An
update. Bioinformatics 28: 2537–2539.
ROZEN, S., AND H. J. SKALETSKY. 2000. Primer3 on the WWW for general
users and for biologist programmers. In S. Misener and S. A. Krawetz
[eds.], Methods in molecular biology, vol. 132: Bioinformatics
methods and protocols, 365–386. Humana Press, Totowa, New Jersey,
USA.
5. 4 of 4
Applications in Plant Sciences 2015 3(8): 1500051 Fuller et al.—Calochortus gunnisonii microsatellites
doi:10.3732/apps.1500051
http://www.bioone.org/loi/apps
APPENDIX 2. Cross-species amplification information for 13 microsat-
ellite loci developed for Calochortus gunnisonii with four related
Calochortus species.
Locus C. flexuosus C. nuttallii
C. kennedyi var.
kennedyi C. subalpinus
CAGU_14 — — — —
CAGU_15 — + + +
CAGU_22 + + + —
CAGU_31 — + + —
CAGU_35 + + + +
CAGU_36 + + + +
CAGU_39 + + + —
CAGU_42 + + + +
CAGU_45 — + — —
CAGU_46 — + — —
CAGU_47 — — + —
CAGU_48 + + — —
CAGU_50 + + — —
Note: + = amplification product fell within the product size range for the
locus; — = amplification product was absent or did not fall within the
product size range expected for the locus.
APPENDIX1.VoucherinformationforCalochortusspeciesusedinthisstudy.
SpeciesCollectorinformationa
Voucherspecimen
accessionno.bCollectionlocalitycGeographiccoordinatesN
C.gunnisoniidMEM608GREE23640DixonReservoir;LarimerCounty,CO40.54135329°N,105.1343894°W31
C.gunnisoniidRSF47GREE23643SandLake;CarbonCounty,WY41.33943317°N,106.1658852°W32
C.gunnisoniidMEM669GREE23639ShavanoCampground;ChaffeeCounty,CO38.586457°N,106.215402°W34
C.gunnisoniidRSF36GREE23642HellCanyonRoad;CusterCounty,SD43.7246205°N,103.854076°W1
C.gunnisoniidMEM621GREE23644LaPreleReservoir;ConverseCounty,WY42.70679583°N,105.5785312°W1
C.nuttalliidMEM620GREE23646HellCanyonRoad;CusterCounty,SD43.727663°N,103.847306°W20
C.nuttalliidMEM631GREE23647ShirleyBasin;CarbonCounty,WY42.341401°N,106.411052°W15
C.flexuosusdMEM644GREE23645BigGypsumValley;SanMiguelCounty,CO38.068645°N,108.791213°W10
C.kennedyivar.kennedyieLehto,Hensel&Pinkava11039GREE20646Oracle;PimaCounty,AZNA1
C.subalpinuseL.E.Detling3581GREE20658GoldHill;LaneCounty,OR44.1687015°N,122.4452742°W1
Note:N=numberofindividuals;NA=notavailable.
aMEM=MitchellE.McGlaughlin;RSF=RyanS.Fuller.
bVouchersdepositedattheUniversityofNorthernColoradoHerbarium(GREE),Greeley,Colorado,USA.
cLocality,county,andstateinUSA(AZ=Arizona;CO=Colorado;SD=SouthDakota;WY=Wyoming).
dFreshtissueusedinDNAextractions,microsatellitepopulationstatistics,andcross-speciesamplifications.
eHerbariumspecimentissueusedincross-speciesamplifications.