Download to read offline
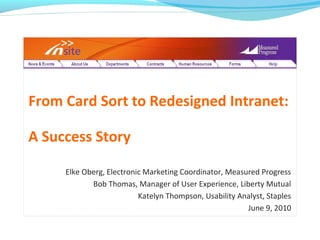
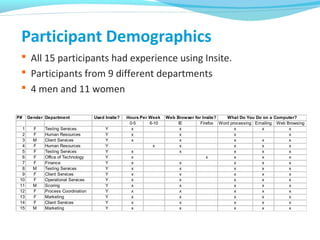
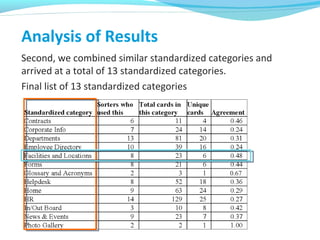
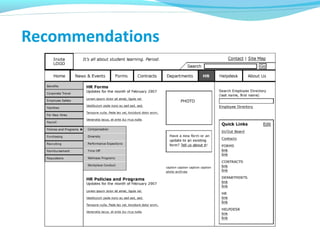
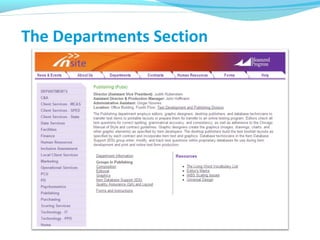
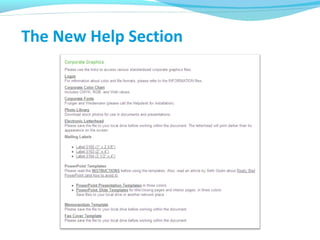
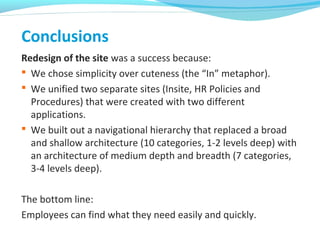
![“You’d think the [Accident and Injury Report] form is under InForm.”
InService > HR > Policy Guide > General Administration > Operational Policies > Safety > Accident Reporting and
Investigation Plan > [Text… Scroll Down Page] … Accident Report Form (7 clicks)
“A person could bleed to death before the form is even located!”
InService InForm](https://image.slidesharecdn.com/fromcardsorttoredesignedwebsiteobergthomasthompsonfinal-130719090521-phpapp02/85/From-Card-Sort-to-Redesigned-Intranet-Site-A-Success-Story-4-320.jpg)
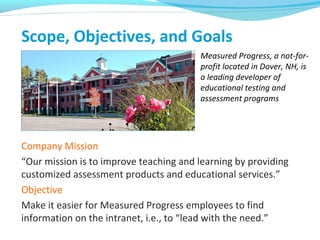
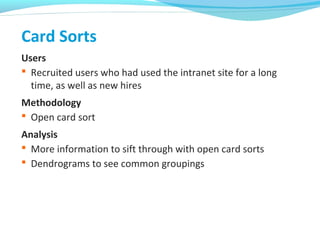
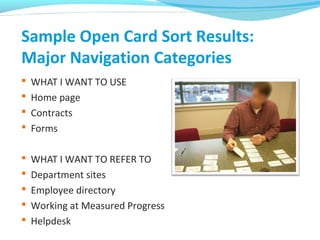
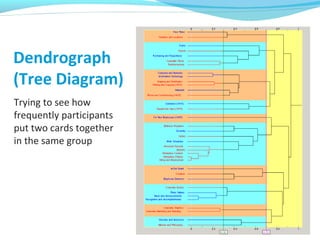
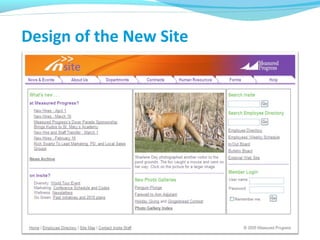
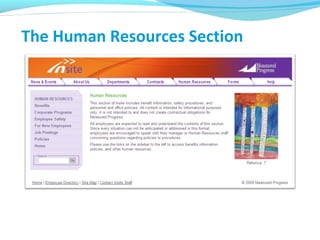
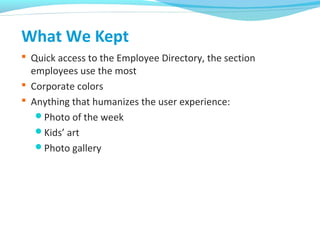
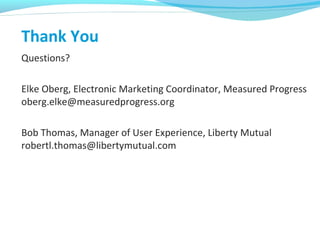
![Original Navigational Hierarchy
Insite:
broad and shallow
Job Request Form:
InForm > Job Request Forms > Form (2 clicks)
Safety Form:
InService > HR > Policy Guide > General Administration >
Operational Policies > Safety > Accident Reporting and
Investigation Plan > [Text] … Accident Report Form (7 clicks)
HR Policies and Procedures:
narrow and deep](https://image.slidesharecdn.com/fromcardsorttoredesignedwebsiteobergthomasthompsonfinal-130719090521-phpapp02/85/From-Card-Sort-to-Redesigned-Intranet-Site-A-Success-Story-5-320.jpg)
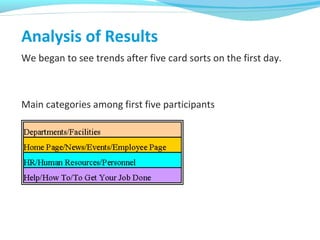
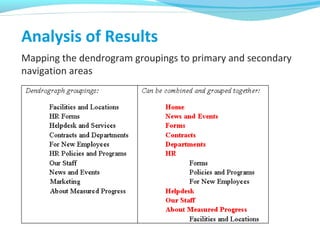
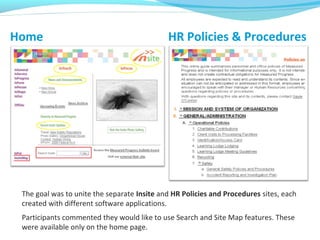
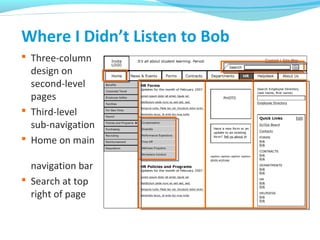
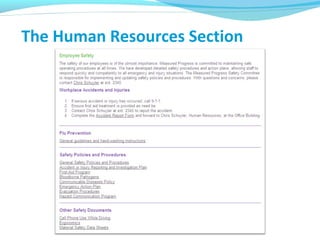
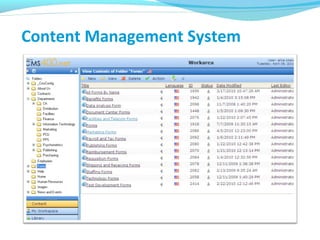
![Analysis of Results
“Mental image the user forms to understand how software
works and how to operate it”
—Arnowitz et al (2007), “Effective Prototyping for Software
Makers”
In the case of Insite, many participants in our card sorts could
not express a mental model of the website beyond the use of
“In” headings. But many did express their mental model of the
ideal Measured Progress intranet:
“There’s stuff there that people need to do their jobs. They need
a reference library for working at the company . . . a big
bookshelf of benefits and other [information].”](https://image.slidesharecdn.com/fromcardsorttoredesignedwebsiteobergthomasthompsonfinal-130719090521-phpapp02/85/From-Card-Sort-to-Redesigned-Intranet-Site-A-Success-Story-18-320.jpg)

The document details the redesign of the intranet at Measured Progress, aiming to improve information accessibility for employees. Through card sorting exercises, user feedback highlighted the need for a simplified navigation system, leading to a successful unification of two separate sites into a more intuitive structure. The redesign resulted in positive employee reactions, indicating that they can now easily locate necessary information.


![[Studienergebnisse 2015] Big Data - Status Quo in der HR in Deutschland.](https://cdn.slidesharecdn.com/ss_thumbnails/vortragzp15bigdatalinkedin2015-150914183734-lva1-app6891-thumbnail.jpg?width=640&height=640&fit=bounds)


